Article

In Silico Modeling and Quantification of Synergistic Effects of Multi-Combination Compounds: Case Study of the Attenuation of Joint Pain Using a Combination of Phytonutrients

by
V. A. Shiva Ayyadurai
* and
Prabhakar Deonikar
Systems Biology Group, CytoSolve Research Division, CytoSolve, Inc., Cambridge, MA 02138, USA
*
Author to whom correspondence should be addressed.
Appl. Sci. 2022, 12(19), 10013; https://doi.org/10.3390/app121910013
Submission received: 27 August 2022 / Revised: 27 September 2022 / Accepted: 27 September 2022 / Published: 5 October 2022
(This article belongs to the Special Issue Natural Products: Sources and Applications)

Abstract

:
The quantification of synergistic effects of multi-combination compounds is critical in developing “cocktails” that are efficacious. In this research, a method for in silico modeling and the quantification of synergistic effects of multi-combination compounds is applied for assessing a combination of phytonutrients for joint pain. Joint pain is the most prominent and disabling symptom of arthritis. Arthritic pain leads to a reduced quality of life. This research explores the efficacy of a synergistic combination of two plant-based flavonoids—apigenin and hesperidin—on joint pain. The study employs computational systems biology: (1) to identify biomolecular mechanisms of joint pain; (2) to identify the specific effects of apigenin and hesperidin, individually and in combination, on the mechanisms of joint pain; and (3) to predict the quantitative effects of apigenin and hesperidin, individually and in combination, on joint pain and whether these combination effects are synergistic or additive. Four molecular pathways that are affected by apigenin and hesperidin include the following: (1) arachidonic acid metabolism, (2) PGE2 signaling, (3) COX-2 synthesis, and (4) oxidative stress. The combination of apigenin and hesperidin significantly lowered PGE2 production, CGRP production, TRVP-1 synthesis, COX-2 production, and reactive oxygen species (ROS) production. Our results indicate that the apigenin and hesperidin combination synergistically affected four of the five modalities to attenuate joint pain.

1. Introduction

The quantification of the synergistic effects of multi-combination compounds is critical in developing “cocktails” that are efficacious. In this research study, a computational systems biology method—in silico—is employed to quantify the synergistic effects of multi-combination compounds—phytonutrients—to attenuate joint pain.
Joint pain is a hallmark of degenerative joint cartilage diseases such as osteoarthritis (OA). Arthritic pain significantly affects the physical as well as psychological health, leading to a poor quality of life [1,2], and despite its prevalence in older adults, therapeutic options remain limited [3]. A lack of clear understanding of the interconnectedness of molecular mechanisms on the degeneration of cartilage and pain is a key factor that affects the development of effective treatments for OA-related joint pain [3,4,5], leading to short-lived or ineffective treatments for OA joint pain [4].
Joint pain results from abnormal inflammatory and catabolic cellular processes that degrade the cartilage in the joint as well as the peripheral and central nervous system [4]. Under the inflammatory conditions that exist in arthritic joints, the threshold for pain is lower [6]. Pain receptors are distributed across all joints in tissues including cartilage, ligaments, vasculature, and subchondral bone [6]. The pain input from the OA tissues is transmitted through dorsal root ganglia (DRG) neurons, which then travels through the spinal cord and ends in the cortical centers in the brain for processing [5]. Key targets for joint pain treatments include endocannabinoid receptors, opioid receptors, glutamate receptors, and specific ion channels [7]. Inflammatory cytokine interleukin 1β (IL-1β) increases the expression of cyclooxygenase 2 (COX-2) in cartilage, leading to the increased production of prostaglandin E2 (PGE2) that induces pain [8]. The activation of pain-sensing peripheral afferent neurons (PAN) by PGE2 leads to action potential propagation to the spinal cord [9]. PGE2 facilitates the release of CGRP through the sensitization of TRPV1 responses in sensory neurons [10,11].

Research Aim

This research employs an in silico mechanistic platform for modeling molecular pathways to quantify the synergistic effects of multi-combination compounds. Specifically, this research aims to understand the underlying mechanistic explanation of the positive effects of two phytonutrients—the flavonoids apigenin and hesperidin—on joint pain. Researchers have identified the need for computational approaches such as CytoSolve® to develop “cocktails” of compounds, given the challenges of time and resources needed from conventional in vitro and in vivo methodologies [12]. In this study, we analyze the individual as well as the synergistic combination of these two phytonutrients. Apigenin, commonly found in leafy green plants and herbs such as celery, parsley, herbs, sorghum, and dried oregano, has strong anti-inflammatory and antioxidant properties [13,14,15]. Hesperidin naturally occurs in citrus fruits and is also a potent anti-inflammatory and antioxidant agent [16]. The role of apigenin and hesperidin has been extensively studied in various pathologies such as cancer, cardiovascular diseases, renal dysfunction, infections, neurodegeneration, etc., due to their antioxidant and anti-inflammatory properties [13,14,15,16].
Effects of apigenin and hesperidin on inflammatory joint pathologies such as osteoarthritis are poorly understood. In this study, a computational systems biology framework is used to understand the effect of apigenin and hesperidin on inflammation and the subsequent pain in joints. Such computational—in silico—methodologies facilitate the study of complex systems with multiple biochemical interactions concurrently, which is harder to carry out using more conventional lab-based in vivo/in vitro methods. An in-silico systems biology approach is employed in this study to (1) identify joint pain molecular mechanisms that are potentially targeted by apigenin and hesperidin and to (2) quantitatively predict how apigenin and hesperidin work in synergy to attenuate joint pain.

2. Materials and Methods

The methodologies used to identify molecular mechanisms involved in joint pain and the prediction of the quantitative effects of apigenin and hesperidin on these mechanisms are described in this section. The CytoSolve® computational systems biology platform is employed in this process. The protocol for setting up and using CytoSolve® is provided in Supplementary Materials. This protocol consists of up to six (6) elements. Five (5) of those six (6) elements were used for this study.

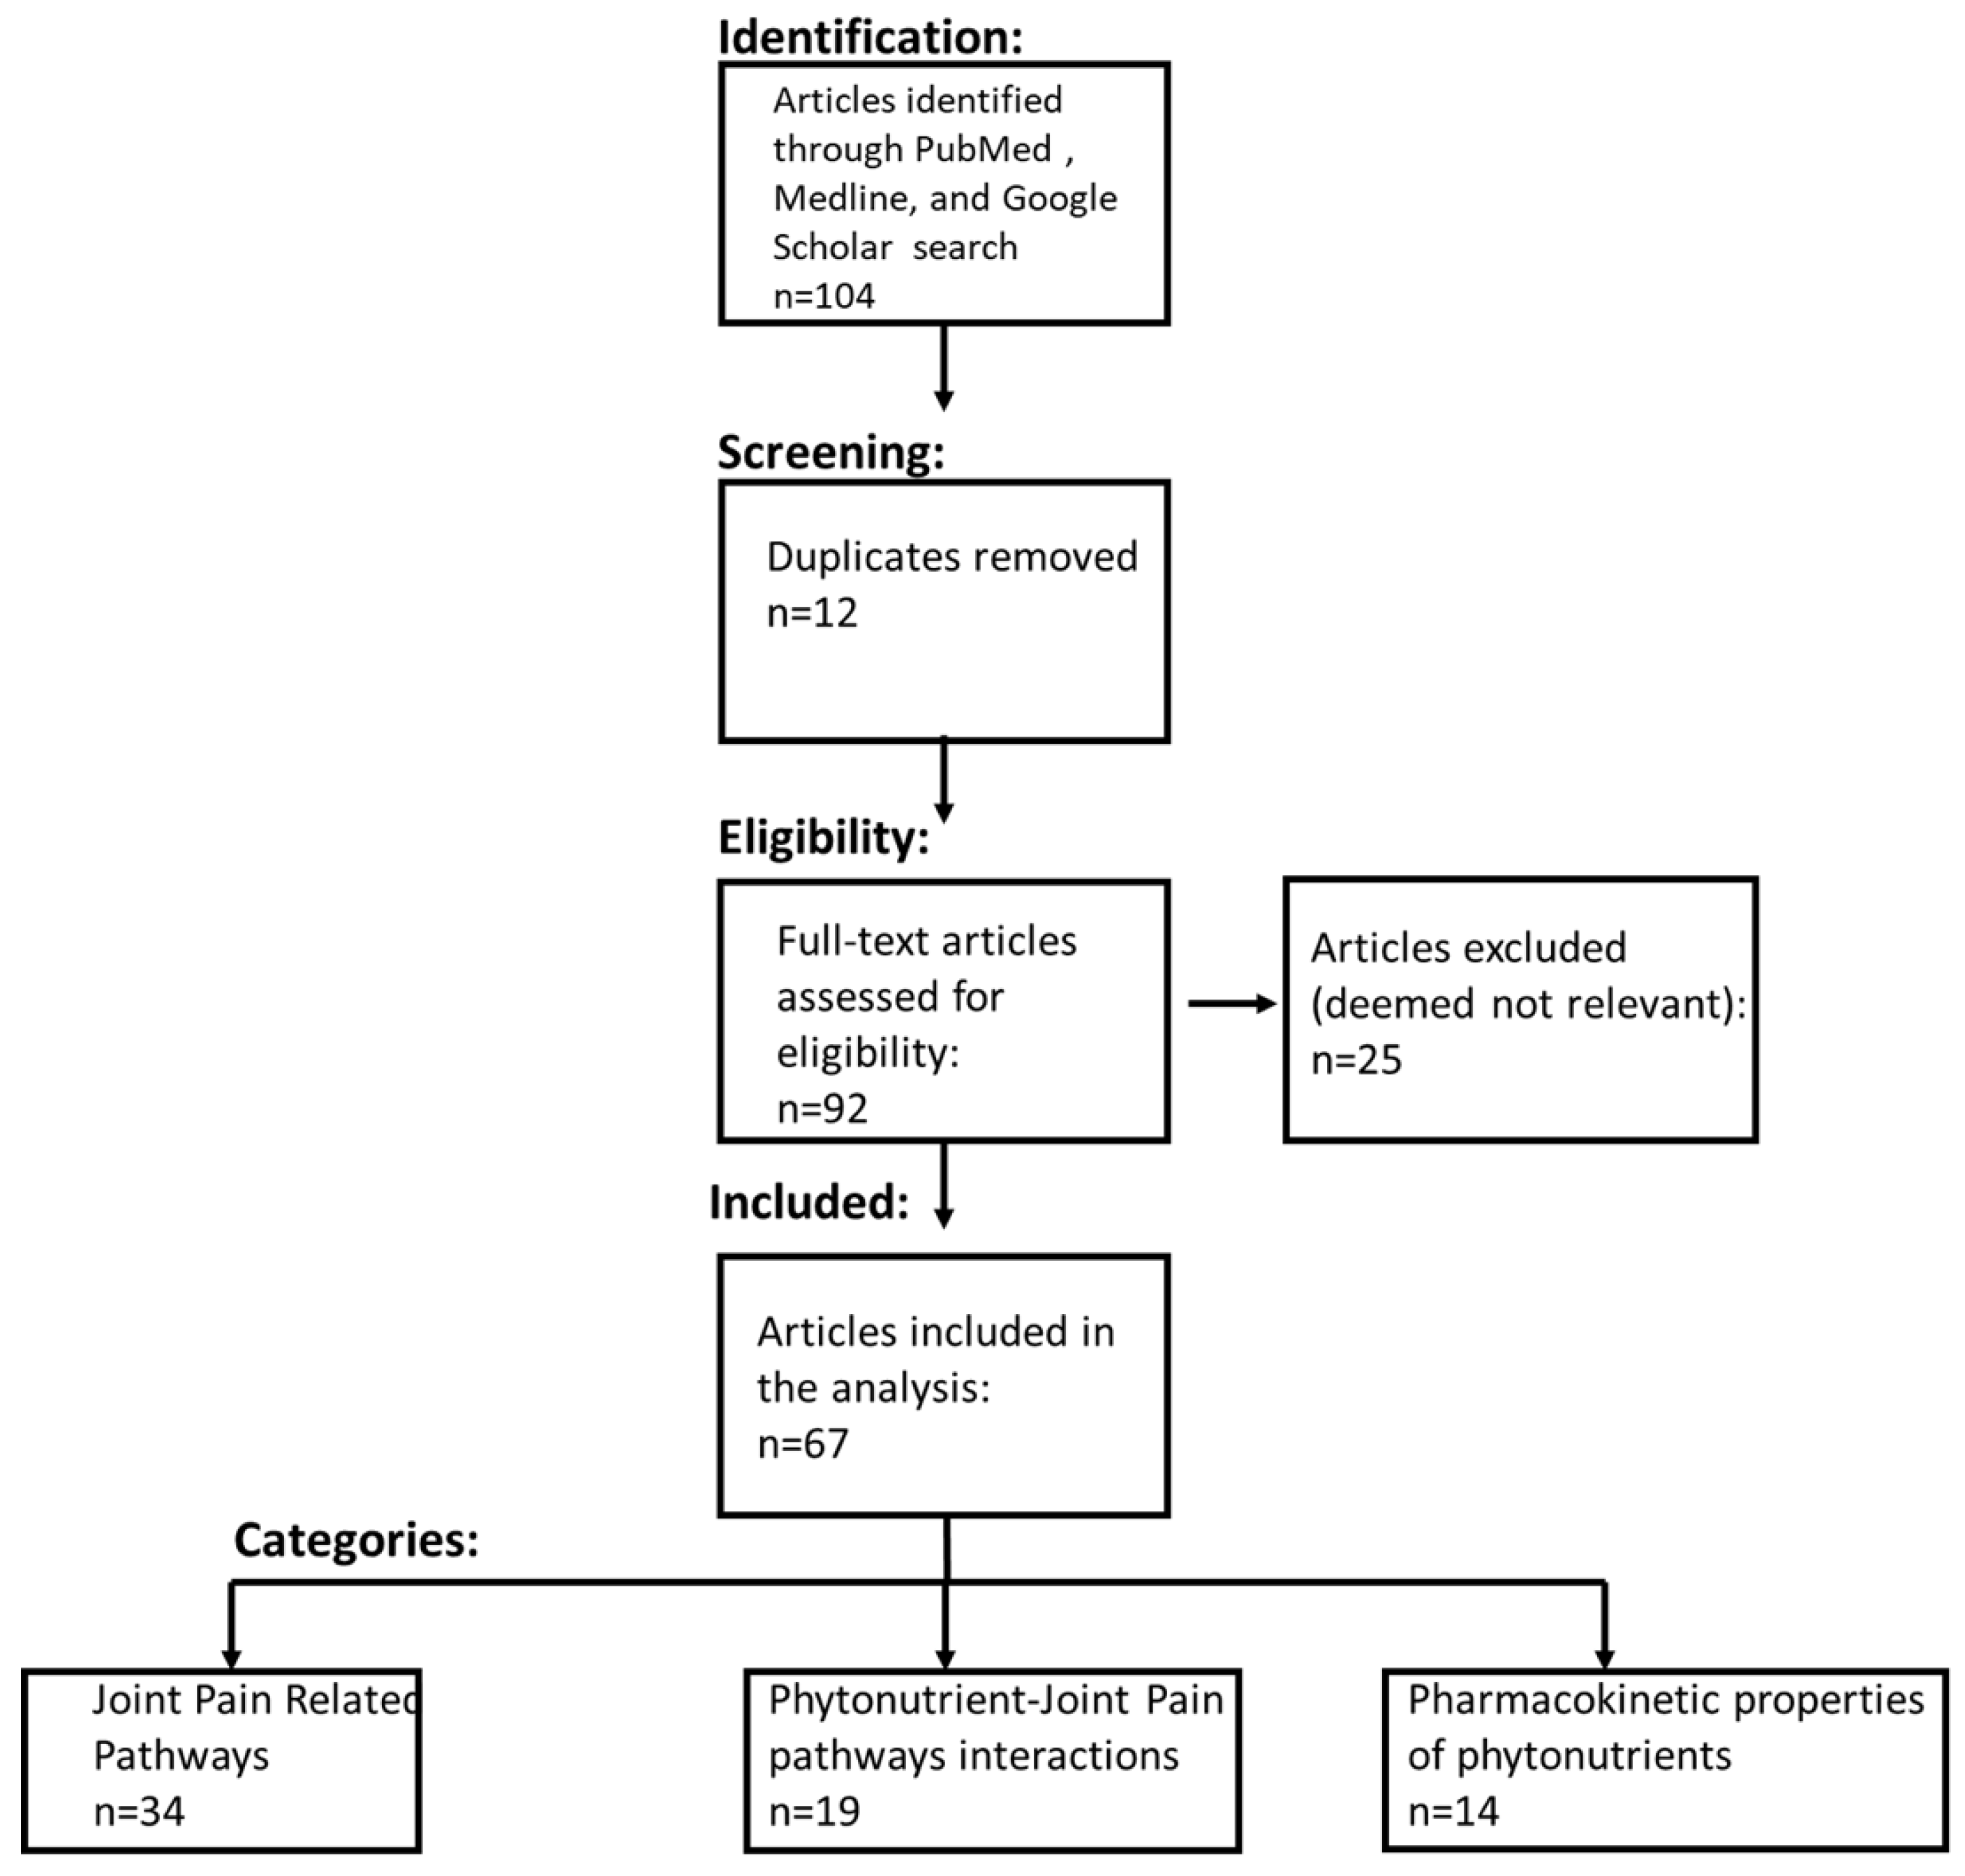
2.1. Systematic Literature Review Process and Inclusion Criteria

The workflow for the identification, organization, and curation of the literature and the extraction of information from the literature was performed per the standardized CytoSolve® protocol detailed in Supplementary Materials Section S1.4. and as employed in previous studies [17,18].
The specific list of Medical Subject Headings (MeSH) keywords is provided in Table S13 in Supplementary Materials Section S3.1. The literature review was restricted to articles published during the time period of January 1980 to November 2019.
Using the keywords in Table S13, which is restricted by the time period aforementioned, the relevant retrieved articles are categorized and represented in Figure 1 and follow PRISMA guidelines [19].
Fourteen (14) independent searches, as denoted in Table S13 in Supplementary Materials, of articles in PubMed dating up to 30 November 2019 were conducted. A systematic literature review resulted in the identification of an initial set of 92 articles (duplicates were removed). Further analyses of the title and abstract yielded 67 relevant articles that were comprehensively reviewed by the authors. Of these 67 relevant articles, 34 informed about 4 molecular pathways related to joint pain, 19 informed about the biochemical interactions between the two phytonutrients and 4 molecular pathways related joint pain, 14 informed about the pharmacokinetic and pharmacodynamics properties of phytonutrients—apigenin and hesperidin.

2.2. CytoSolve In Silico Modeling Protocol

The identification and extraction of data related to reaction rate constants, biochemical reactions, and pharmacokinetic properties of apigenin and hesperidin with respect to the molecular pathways of joint pain were performed per the standardized CytoSolve® protocol detailed in Supplementary Materials Section S1.5. All biochemical reactions for each of the individual joint-pain mathematical models along with the kinetic parameters and the initial concentration of biochemical species are listed in Supplementary Materials Sections S2.1–S2.4.
Molecular pathways of joint pain are converted into individual mathematical models using the biochemical reactions per the standardized CytoSolve® protocol detailed in Supplementary Materials Section S1.6. The individual mathematical models are integrated using the standardized CytoSolve® protocol detailed in Supplementary Materials Section S1.7.

2.2.1. Control Conditions

Under control conditions, apigenin and hesperidin concentrations are kept at zero. For the IL-1β-induced COX-2 synthesis model, chondrocyte was presumed to be in an inflammatory state. Under these conditions, IL-1β levels were found to be 0.0032 nM [20]. With this as an initial condition (IL-1β = 0.0032 nM), COX-2 concentrations were estimated for the control condition by simulating a COX-2 synthesis model for a 2-day period.
For the arachidonic acid metabolism model, chondrocyte was assumed to be under inflammatory conditions. Under such inflammatory conditions, arachidonic acid levels were found to be 35 mM [21,22]. Arachidonic acid upregulates the production of PGE2, which is a pro-inflammatory biomarker. Using the initial condition of arachidonic acid = 35 mM, PGE2 concentrations were estimated for the control condition by simulating an arachidonic acid metabolism model for a 2-day period. The predicted steady-state concentration of PGE2 from the arachidonic acid metabolism model was used as an initial condition for the PGE2 signaling model. TRPV1 and CGRP concentrations were estimated for the control condition by simulating PGE2 signaling model for a 2-day period.
Under an inflammatory state, NADPH oxidase activity, which leads to production of ROS, doubled in endothelial cells [23]. The oxidative stress model is simulated for a 2-day period to obtain the control value of ROS using doubled NADPH oxidase activities as an initial condition.

2.2.2. Computer Simulations to Study the Effect of Apigenin and Hesperidin on Integrated Model of Joint Pain

The joint-pain integrated model includes four (4) individual models: (1) arachidonic acid metabolism model, (2) PGE2 signaling model, (3) COX-2 synthesis model, and (4) oxidative stress model. The effect of apigenin and hesperidin, individually and in combination, was analyzed by estimating the concentration levels of PGE-2, TRPV1, CGRP, COX-2, and ROS in the presence of apigenin and hesperidin. The integrated model of joint pain was simulated using standardized the CytoSolve® protocol detailed in Supplementary Materials Section S1.8. Initial simulations indicated that all five biomarkers reached a steady-state value at a simulation period of 2 days, and increasing the simulation time beyond 2 days did not change results. Based on these data, a decision was made to assign the 2 days as the duration of simulations. The administration of apigenin and hesperidin occurred at the start of simulations (t = 0 s), and their levels were kept constant throughout the simulation period.
The following computer simulations were performed:
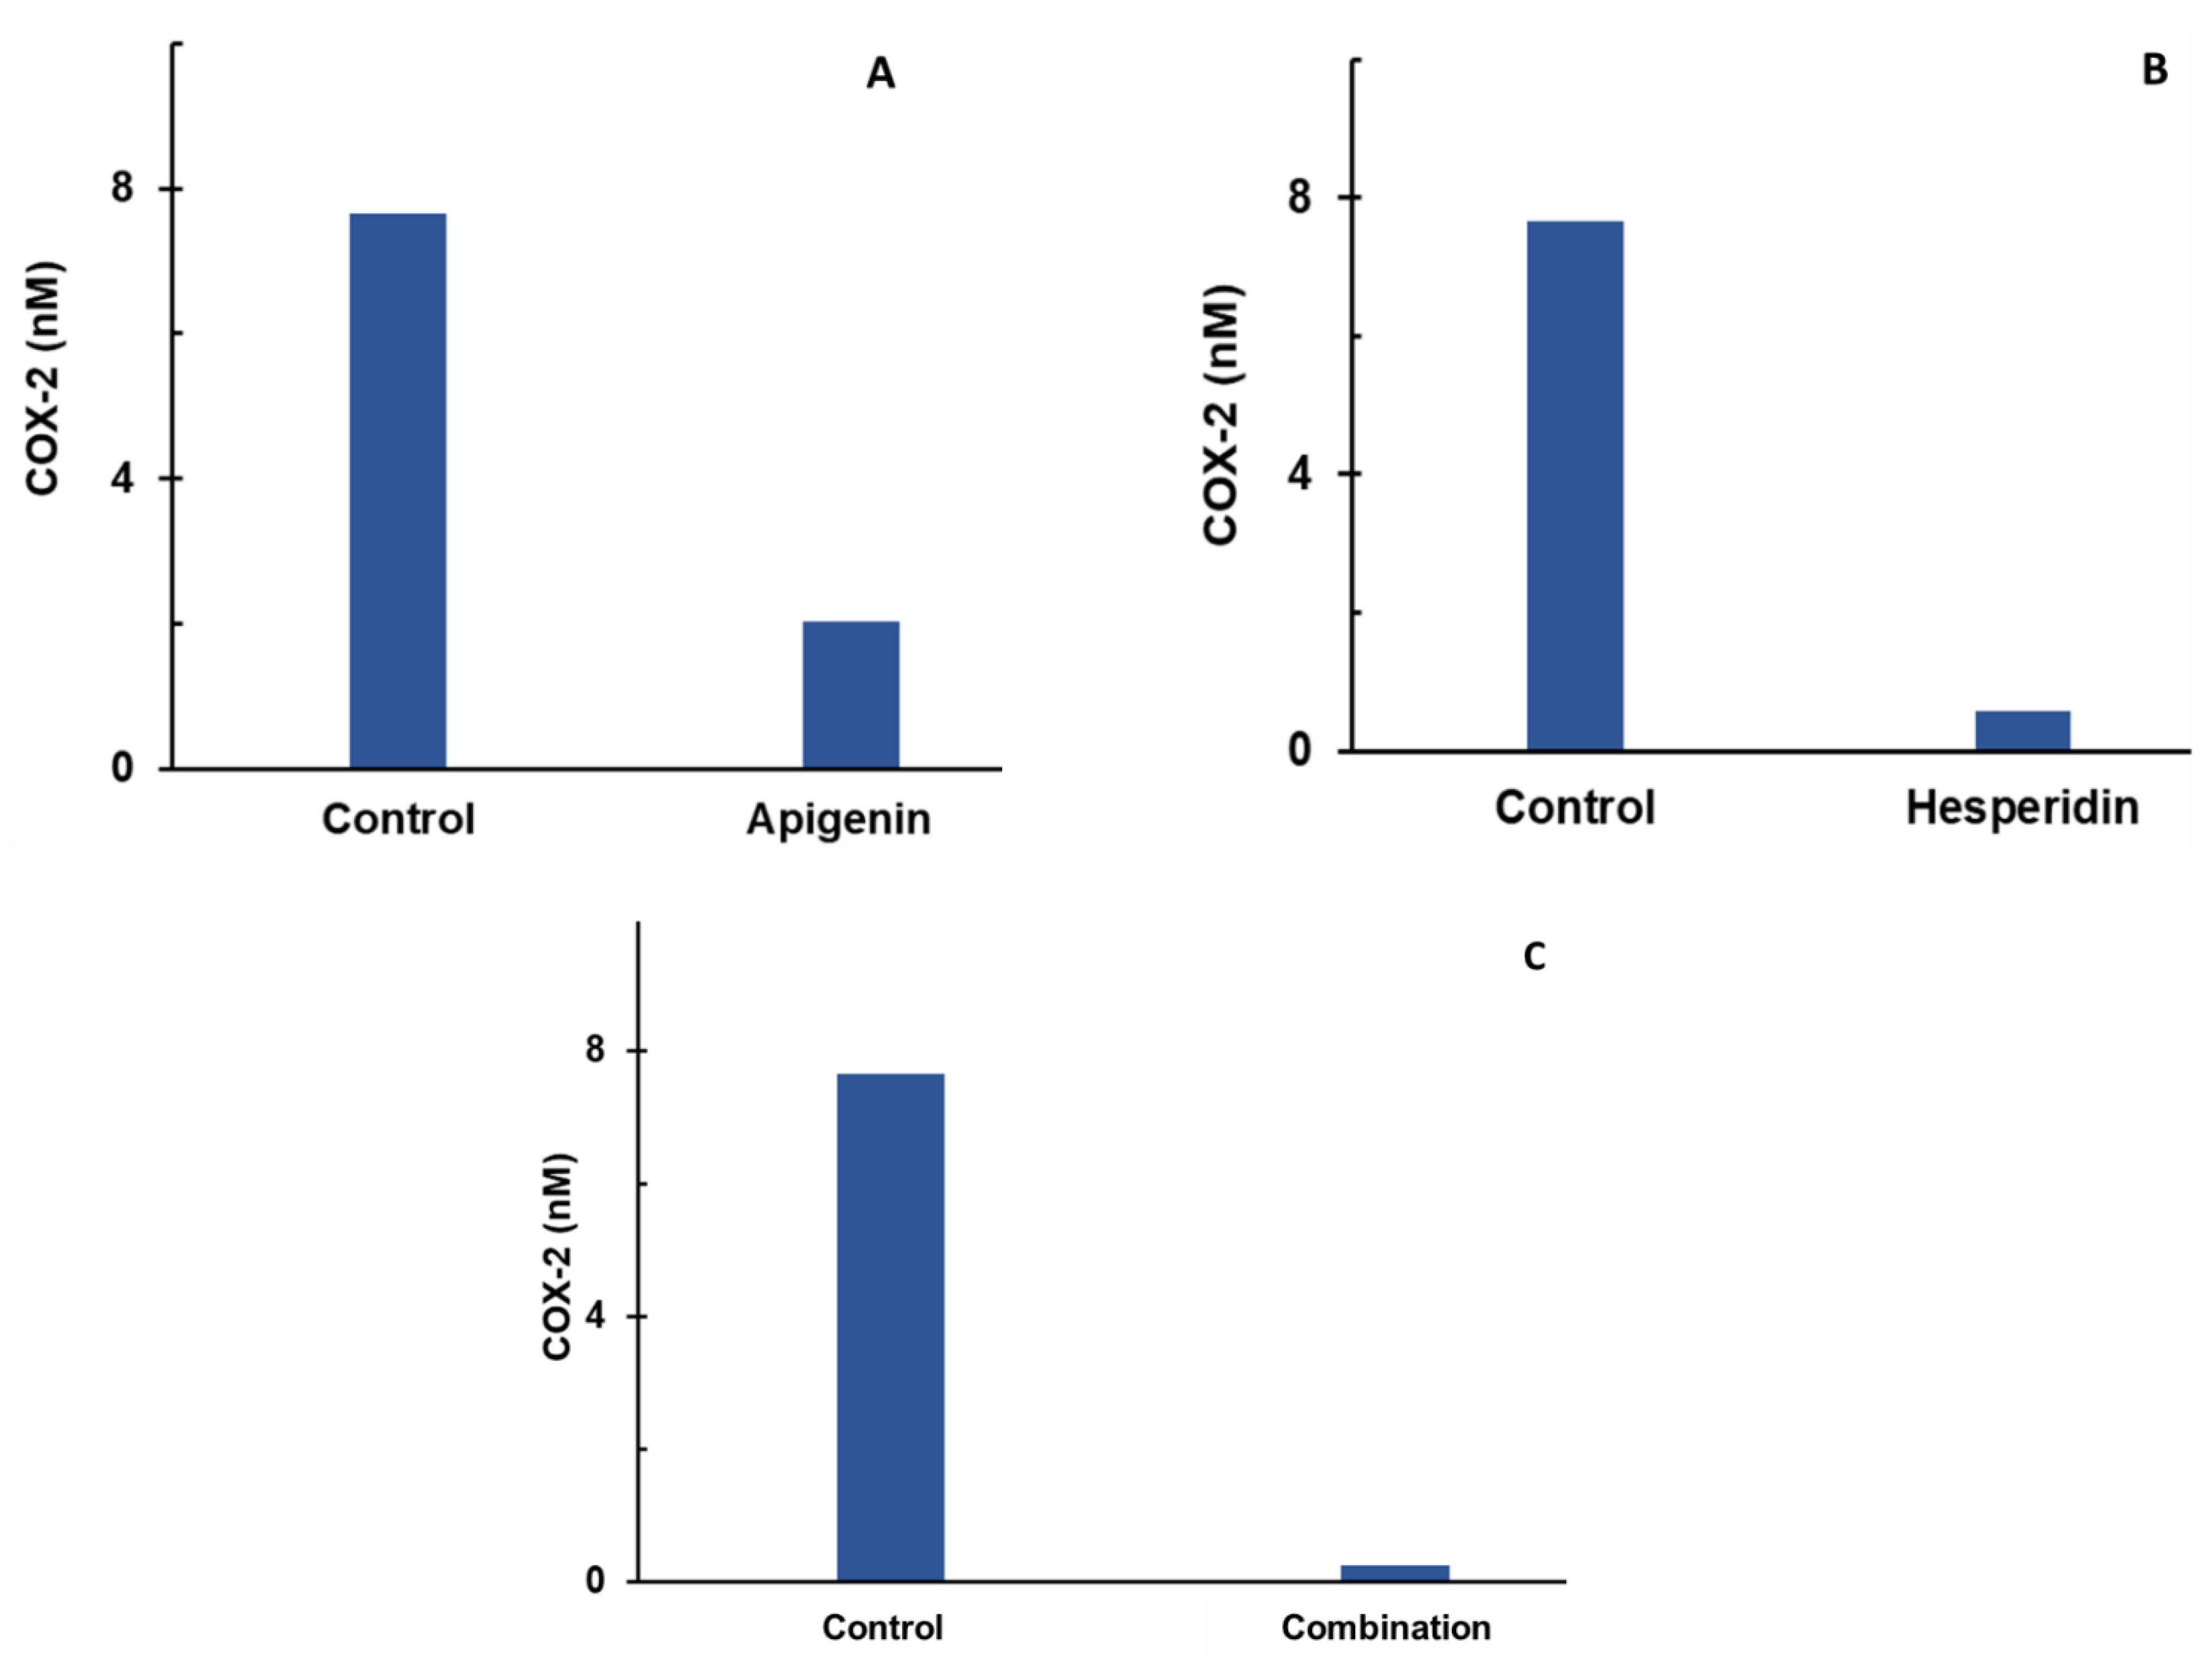
  • Individual and combination effects of apigenin and hesperidin on COX-2 production;
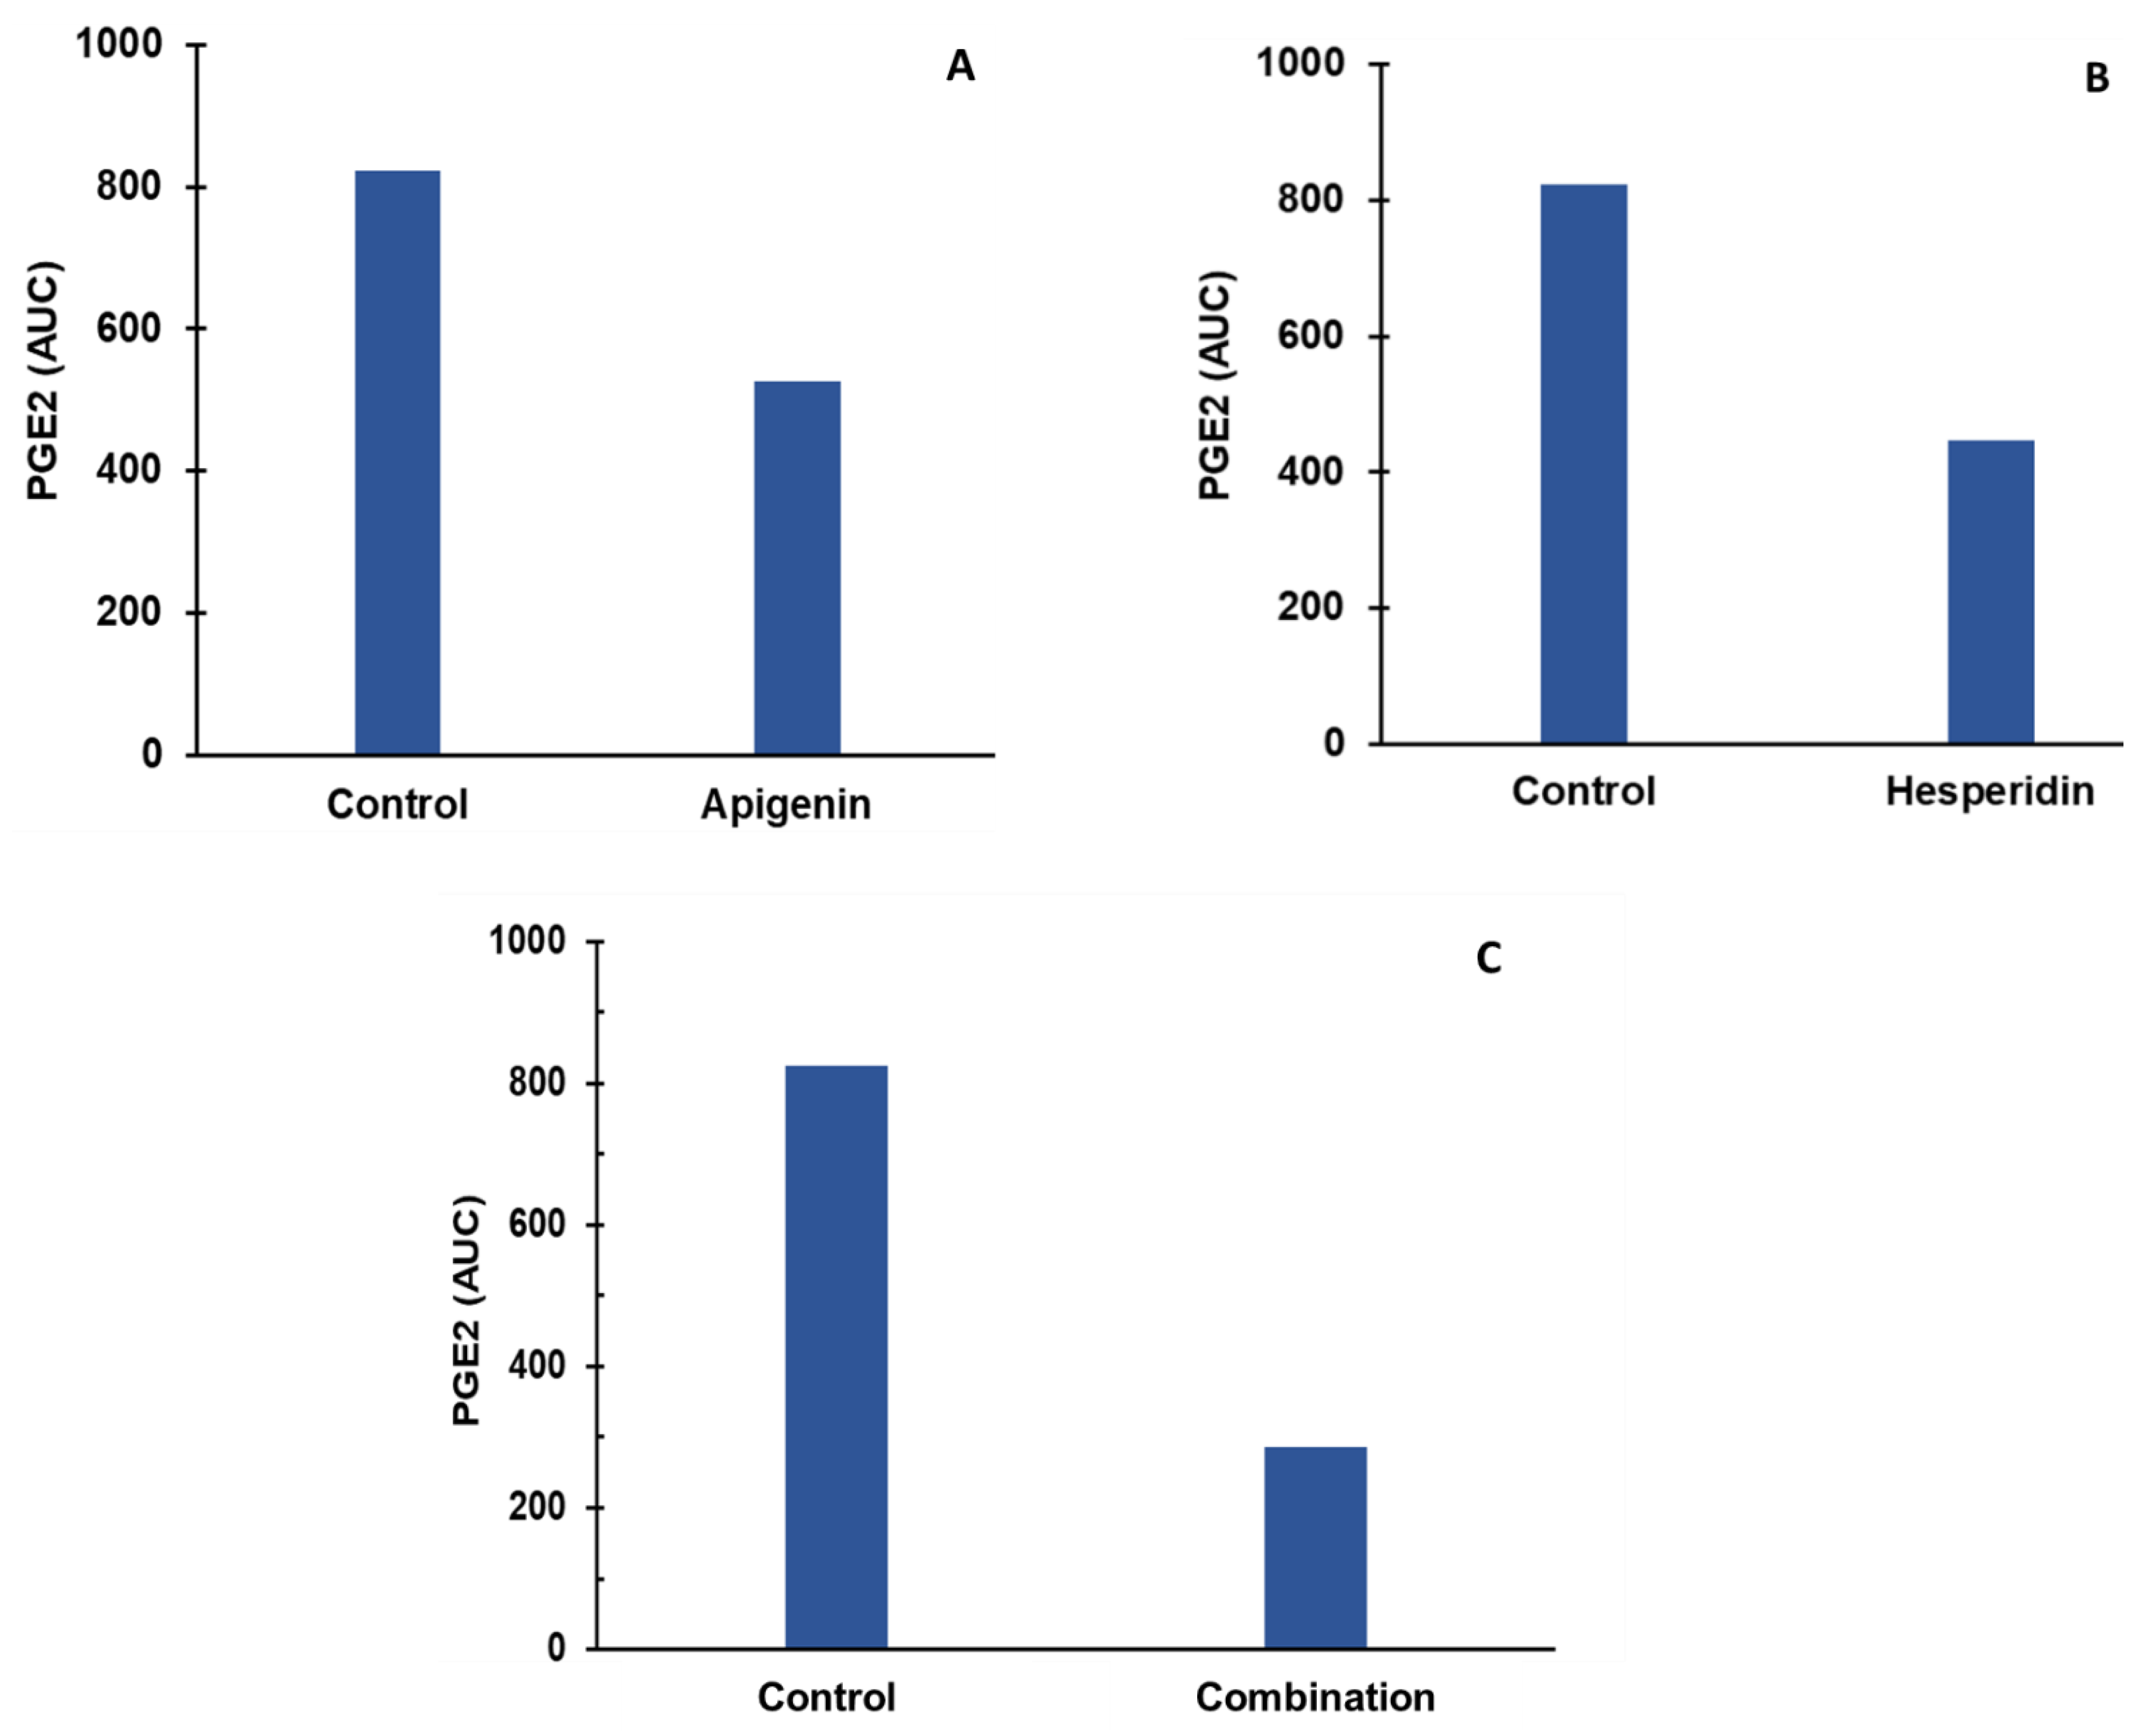
  • Individual and combination effects of apigenin and hesperidin on PGE-2 production;
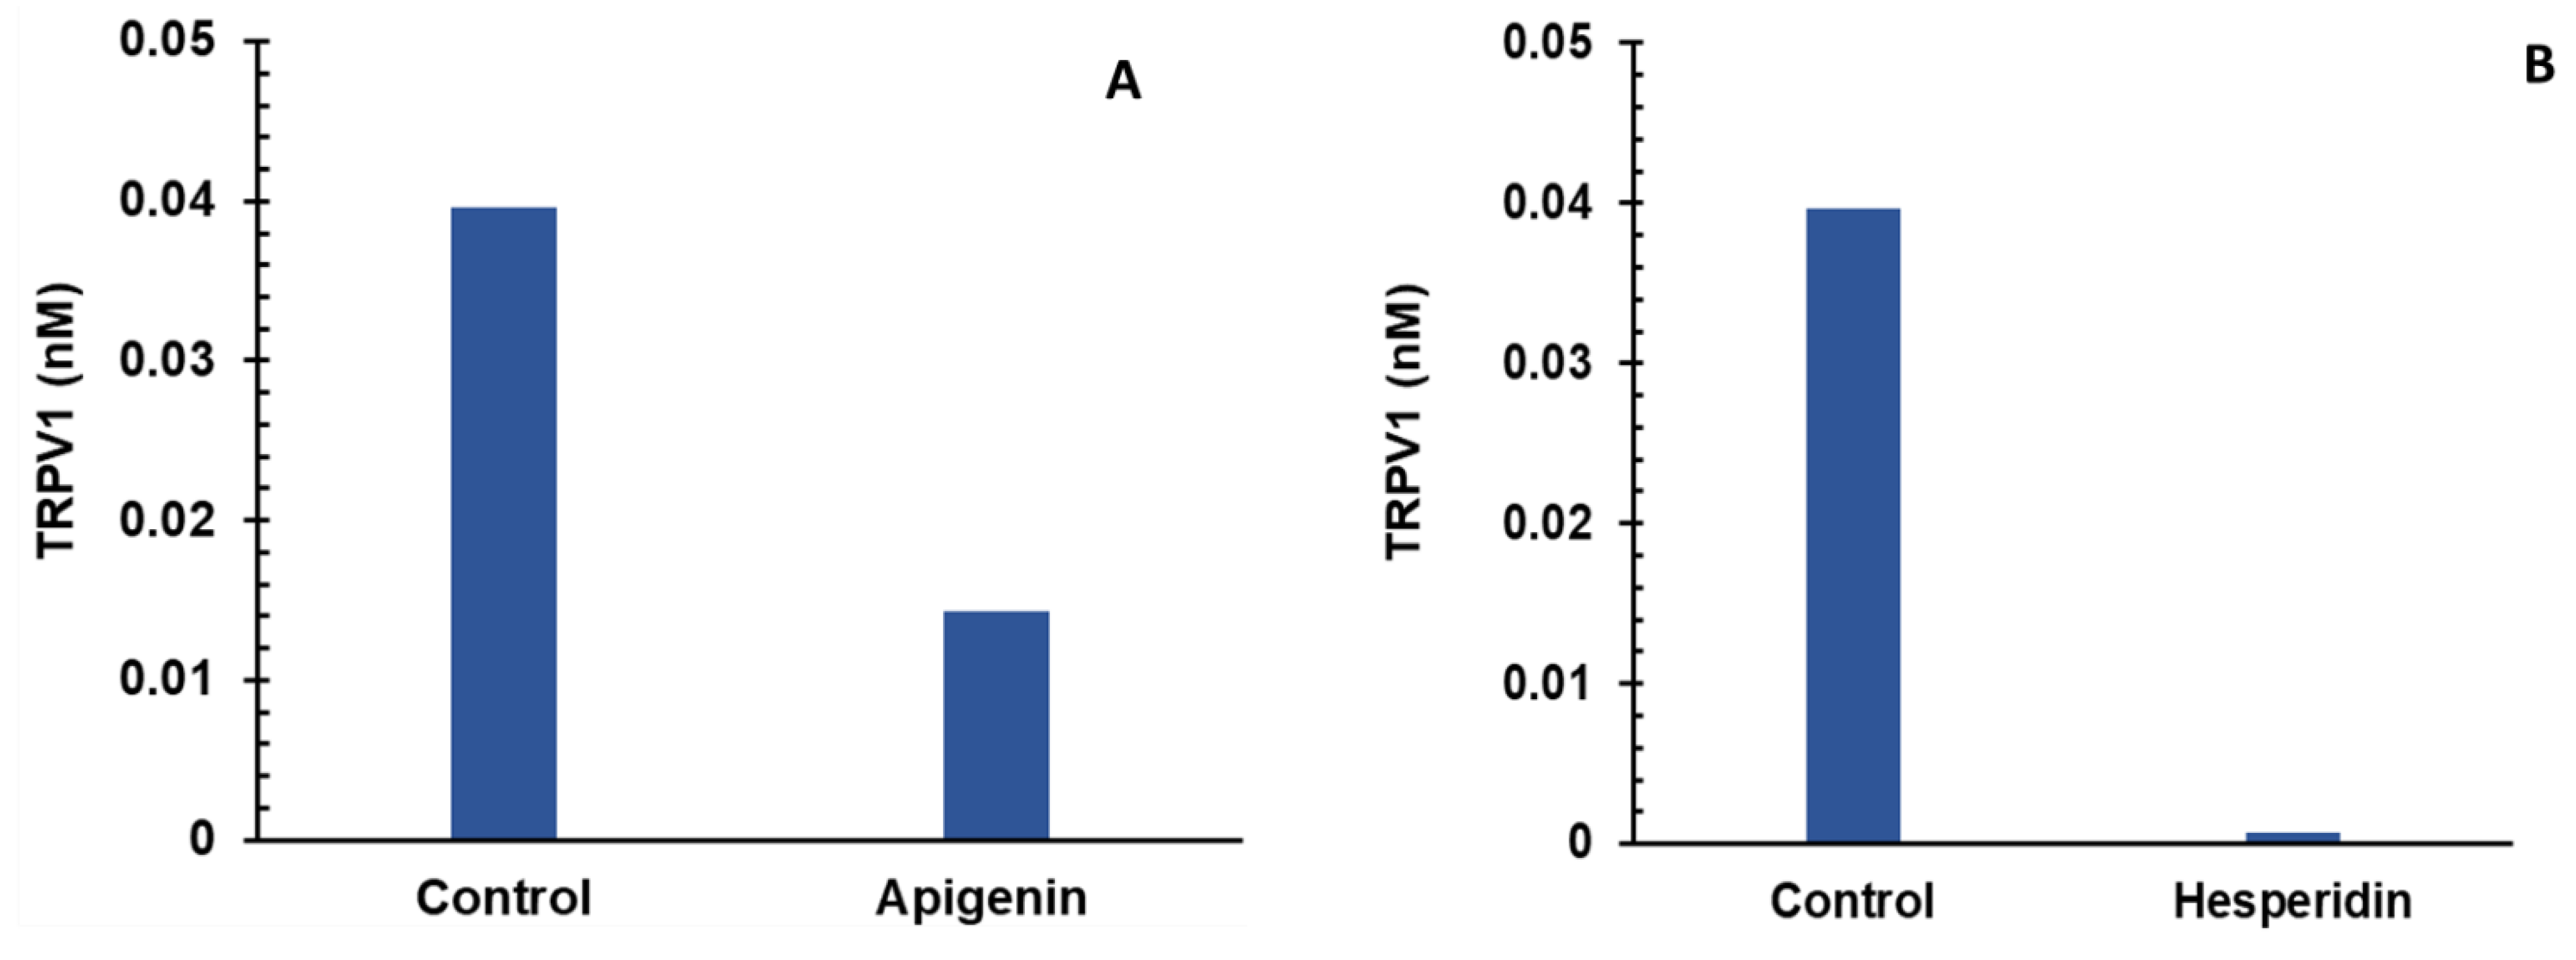
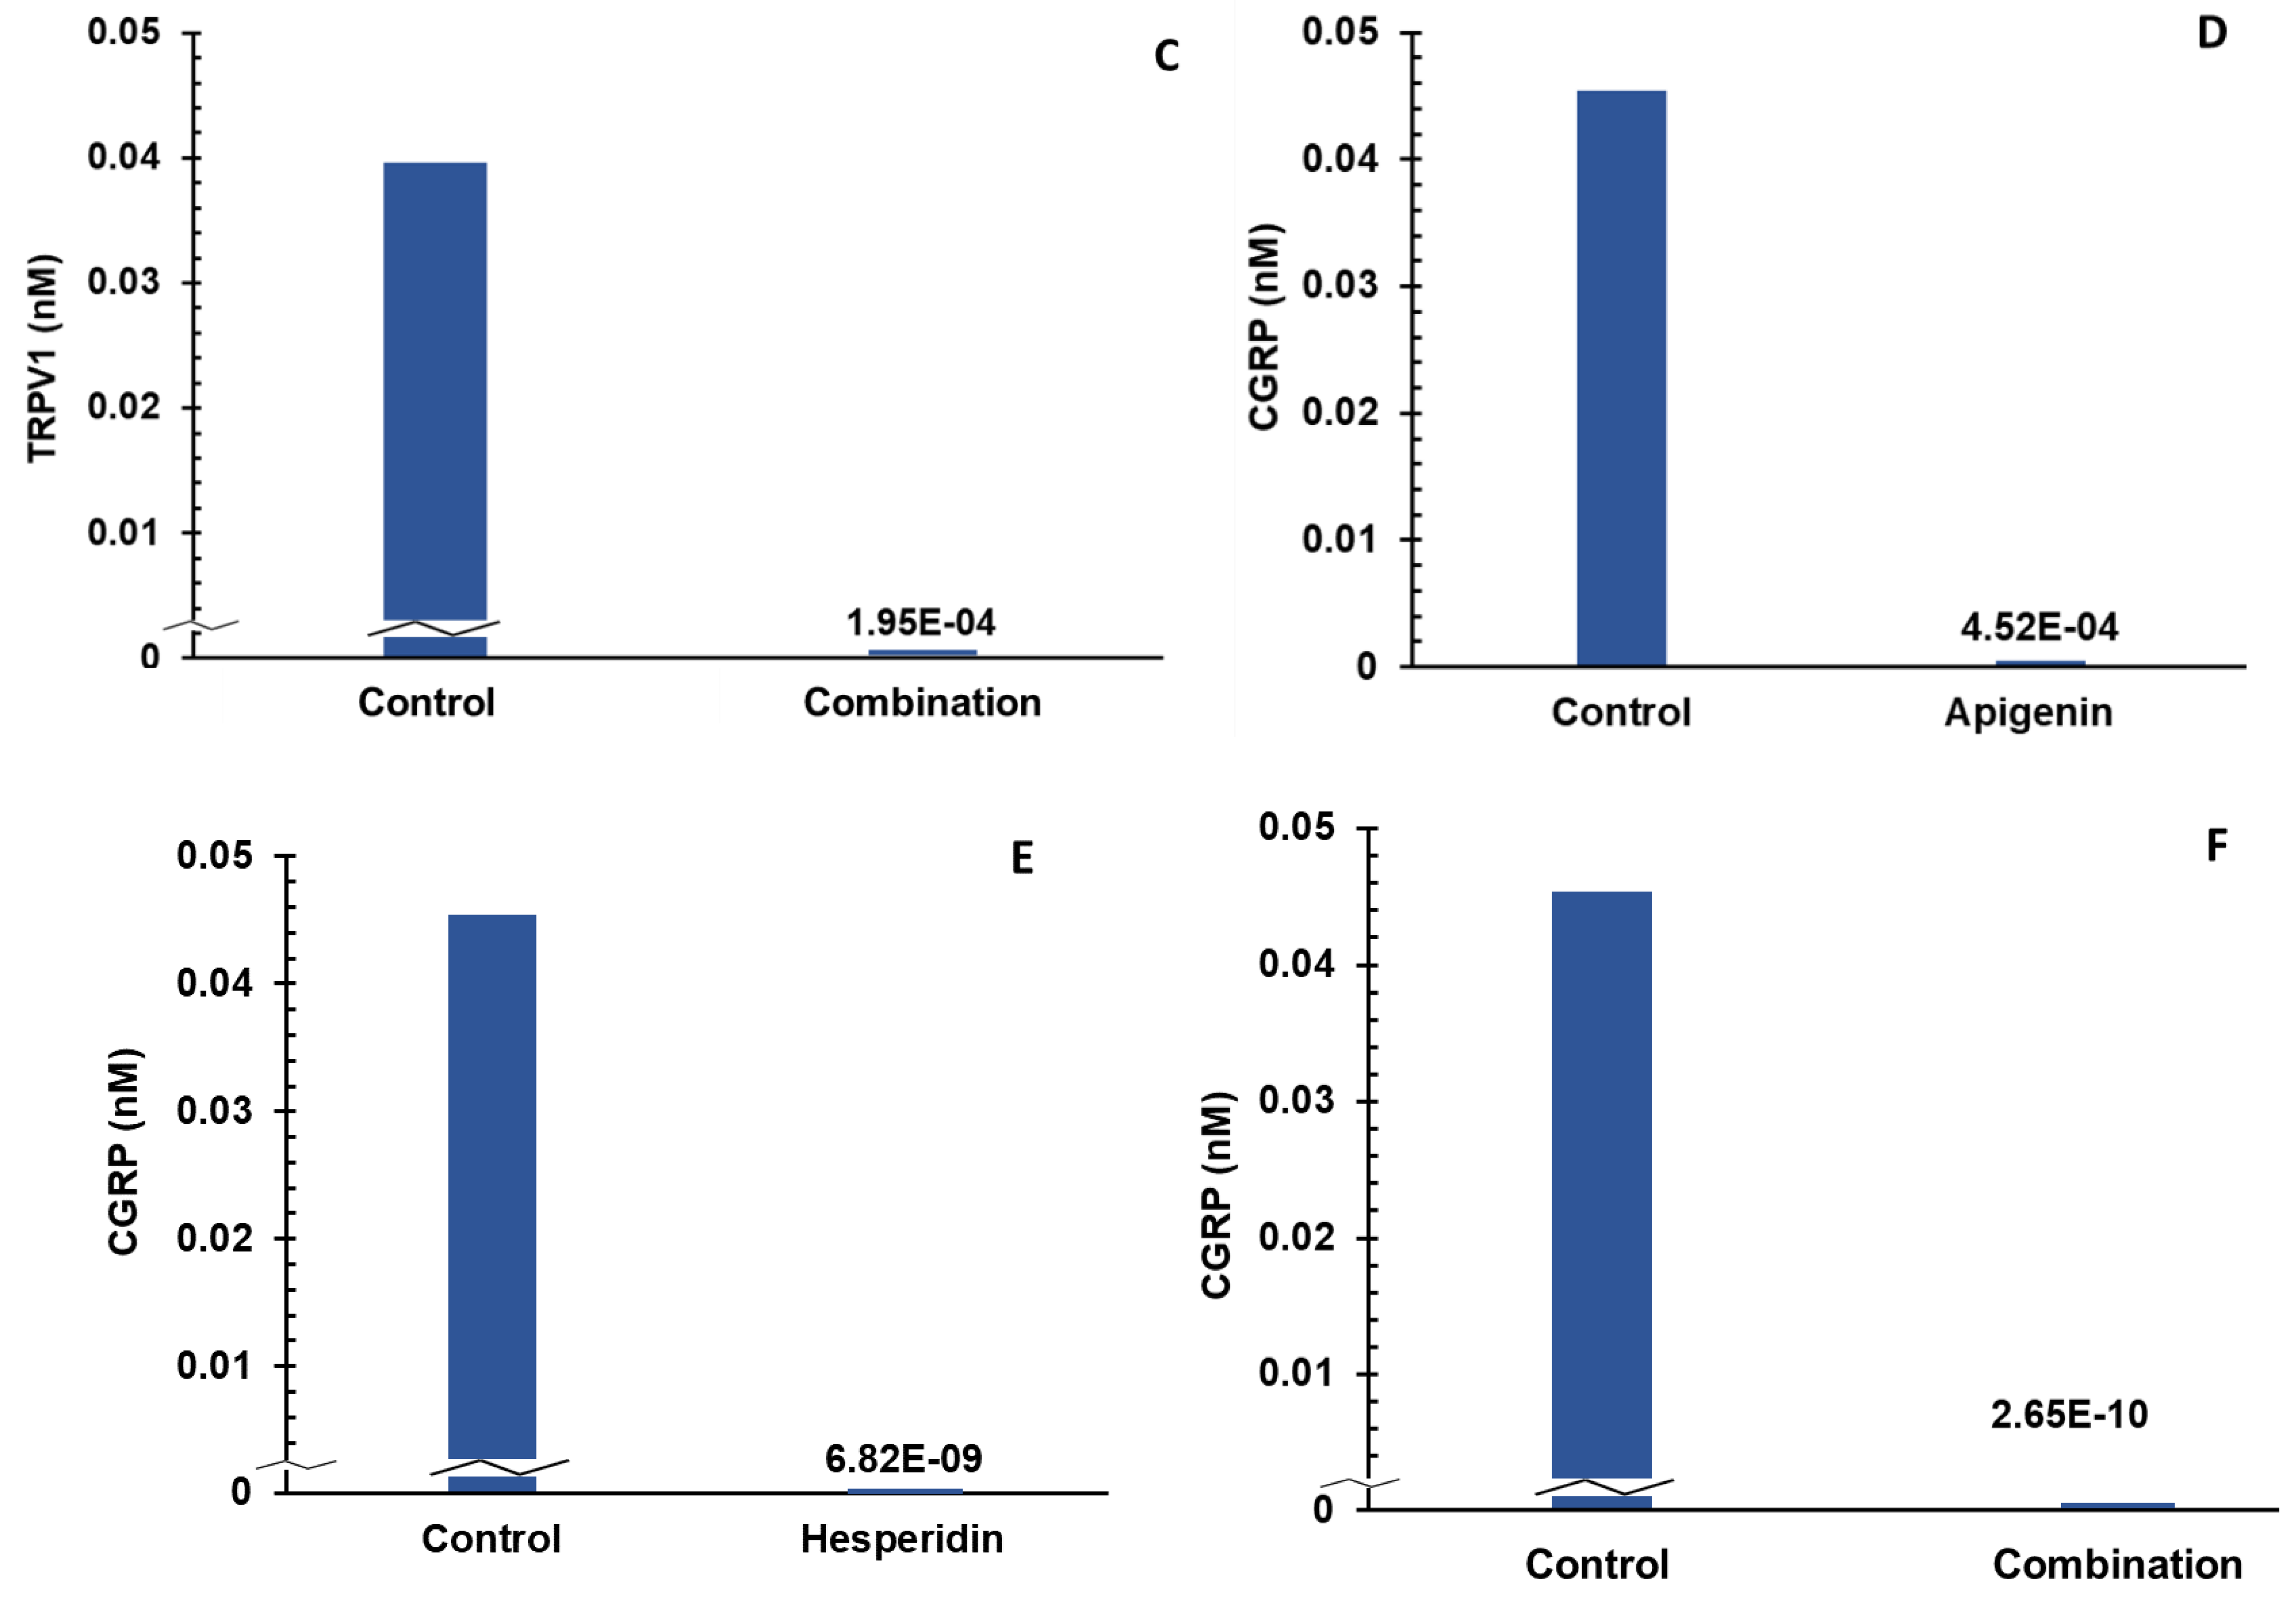
  • Individual and combination effects of apigenin and hesperidin on TRPV1 production;
  • Individual and combination effects of apigenin and hesperidin on CGRP production;
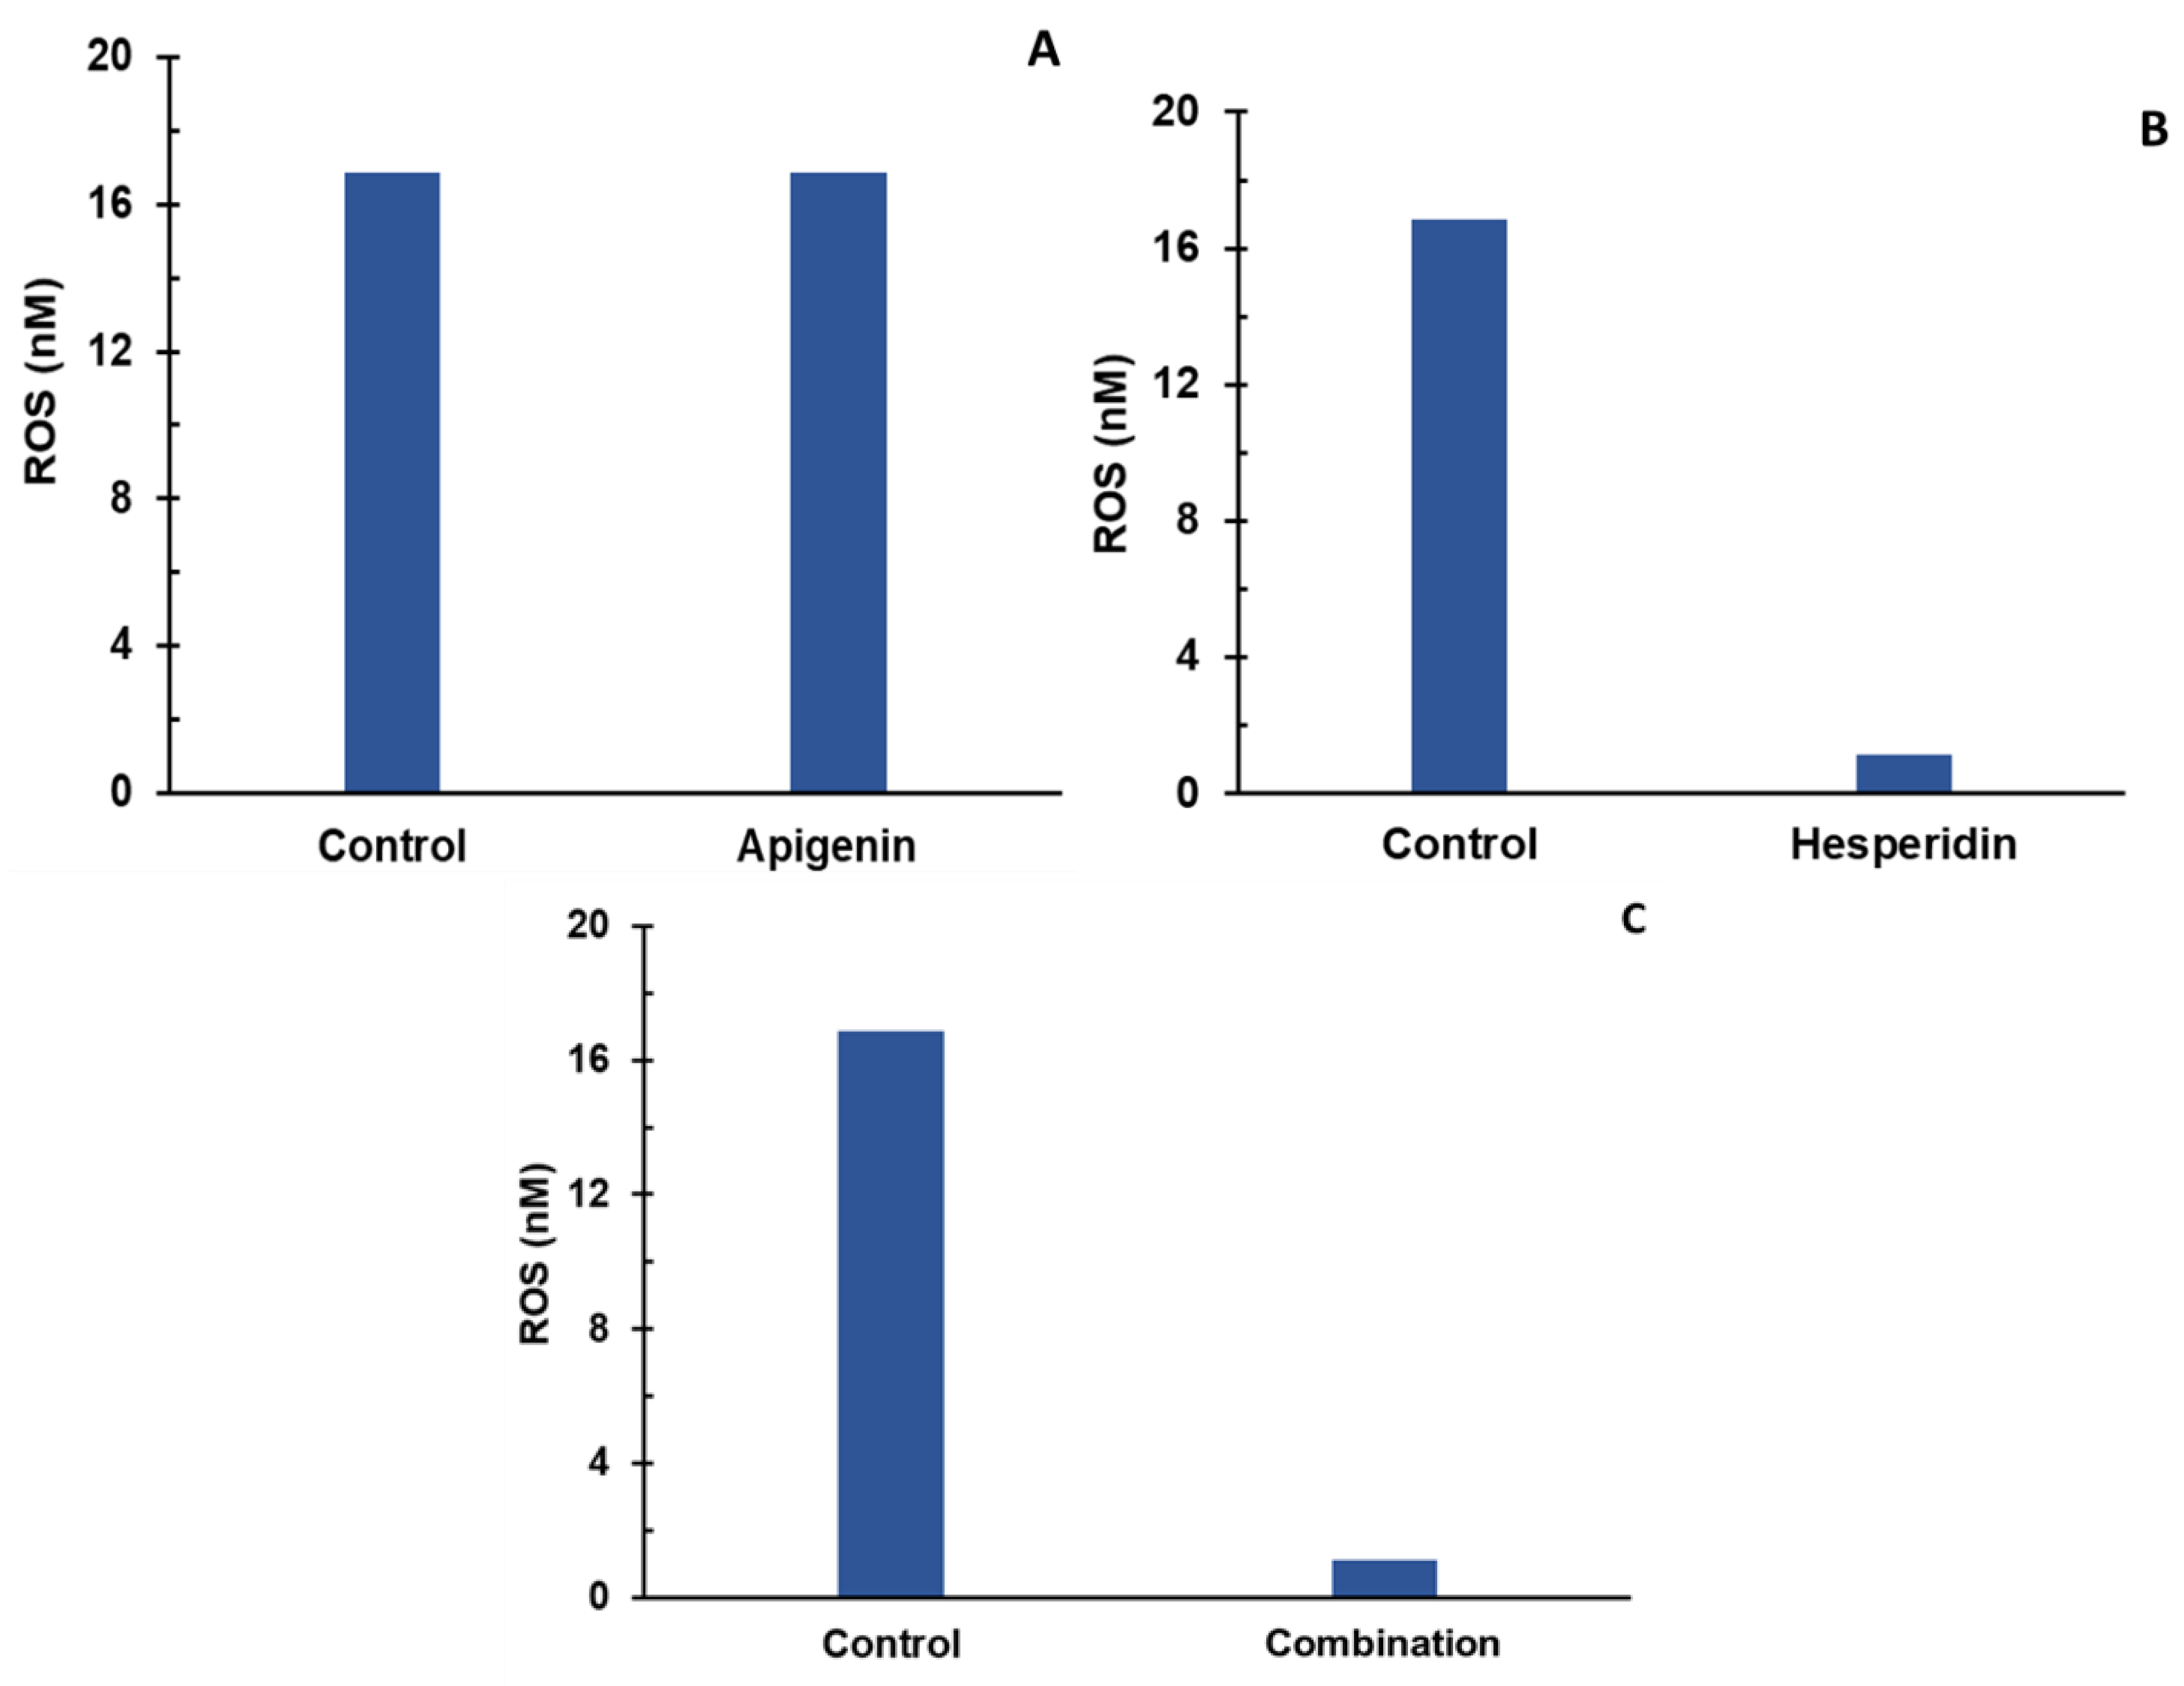
  • Individual and combination effects of apigenin and hesperidin on ROS production.
The output from the above simulations included the time-dependent concentration profiles of the five (5) biomarkers of joint pain—COX-2, PGE2, TRPV1, CGRP, and ROS.

2.2.3. Computer Simulations to Determine Synergistic Effects of Apigenin and Hesperidin on an Integrated Model of Joint Pain

A multi-combination cocktail may have greater therapeutic benefits if they can act in synergy versus in an additive manner. To determine whether the specific combination in this study acts synergistically or in an additive manner to modulate joint pain, it is necessary to quantify the synergistic effect versus the additive effect. This calculation is adapted from an earlier work applied to in vitro and in vivo studies [24].
In such quantification, the additive effect range—two endpoints—must first be determined for a particular biomarker. Determining the first endpoint of this range involves a sequential addition of compounds at their specific dosages. Determining the second endpoint of this range involves reversing the sequential addition of the compounds at their specific dosages. In this study, given that there are two compounds, apigenin was added first, followed by hesperidin to determine the first endpoint for a particular biomarker. Then, the sequence is reversed by adding hesperidin followed by apigenin to determine the second endpoint for the same biomarker. These two endpoints provide a lower and upper limit for the additive effect range of that biomarker for the specific dosages of these two compounds.
Once the additive effect range is determined, the two compounds at the specific dosages are added simultaneously to estimate the levels of the same biomarker. If the value of the biomarker obtained by the simultaneous addition of both compounds lies within the additive effect range, then the combination of these two compounds are deemed to have an additive effect on that particular biomarker. If the value of biomarker obtained by the simultaneous addition of both compounds is not in the additive effect range, the two compounds may have a synergistic or an antagonistic effect. A combination is deemed to be synergistic if the value of a biomarker is lower or higher than the additive effect range, provided that the biomarker must be lower or higher, respectively, than the control in order to have the desired beneficial effect. In this study, lowering each biomarker relative to control is considered to have beneficial effects.
The following simulations are conducted to determine the additive effect range across the five biomarkers of joint pain:
  • Sequential addition of apigenin first and then hesperidin to estimate COX-2 production;
  • Sequential addition of hesperidin first and then apigenin to estimate COX-2 production;
  • Sequential addition of apigenin first and then hesperidin to estimate PGE2 production;
  • Sequential addition of hesperidin first and then apigenin to PGE2 production;
  • Sequential addition of apigenin first and then hesperidin to estimate TRPV1 production;
  • Sequential addition of hesperidin first and then apigenin to estimate TRPV1 production;
  • Sequential addition of apigenin first and then hesperidin to estimate CGRP production;
  • Sequential addition of hesperidin first and then apigenin to estimate CGRP production;
  • Sequential addition of apigenin first and then hesperidin to estimate ROS production;
  • Sequential addition of hesperidin first and then apigenin to estimate ROS production.
The additive effect ranges for all five biomarkers were determined. The values of all five biomarkers obtained from combination simulations from Section 2.2.1 were compared to their respective additive effect ranges to determine the synergistic or additive effects of apigenin and hesperidin combination on all five biomarkers of joint pain.

3. Results

Effects of apigenin and hesperidin, individually as well as in combination, were analyzed on the joint-pain integrated model. Figure 2 illustrates the effect of apigenin and hesperidin on joint-pain molecular pathways. Initial simulations were conducted for a dose range of 0 to 100 mg for apigenin and 0 to 5000 mg for hesperidin to identify an efficacious dose level for each of phytonutrient on all four mechanisms of action analyzed in this study (please see Supplementary Materials Section S3.2 for the detailed results from initial simulation studies). The initial results indicated that 30 mg of apigenin and 1000 mg of hesperidin were most effective in reducing all five biomarkers (COX-2, PGE2, TRPV1, CGRP, and ROS) of joint pain. Increasing the dose levels of apigenin to more than 30 mg and hesperidin to more than 1000 mg did not further reduce the biomarker levels. Based on these preliminary results, dose levels of 30 mg and 1000 mg were chosen for apigenin and hesperidin, respectively, to simulate their individual and synergistic effects on biomolecular pathways of joint pain.

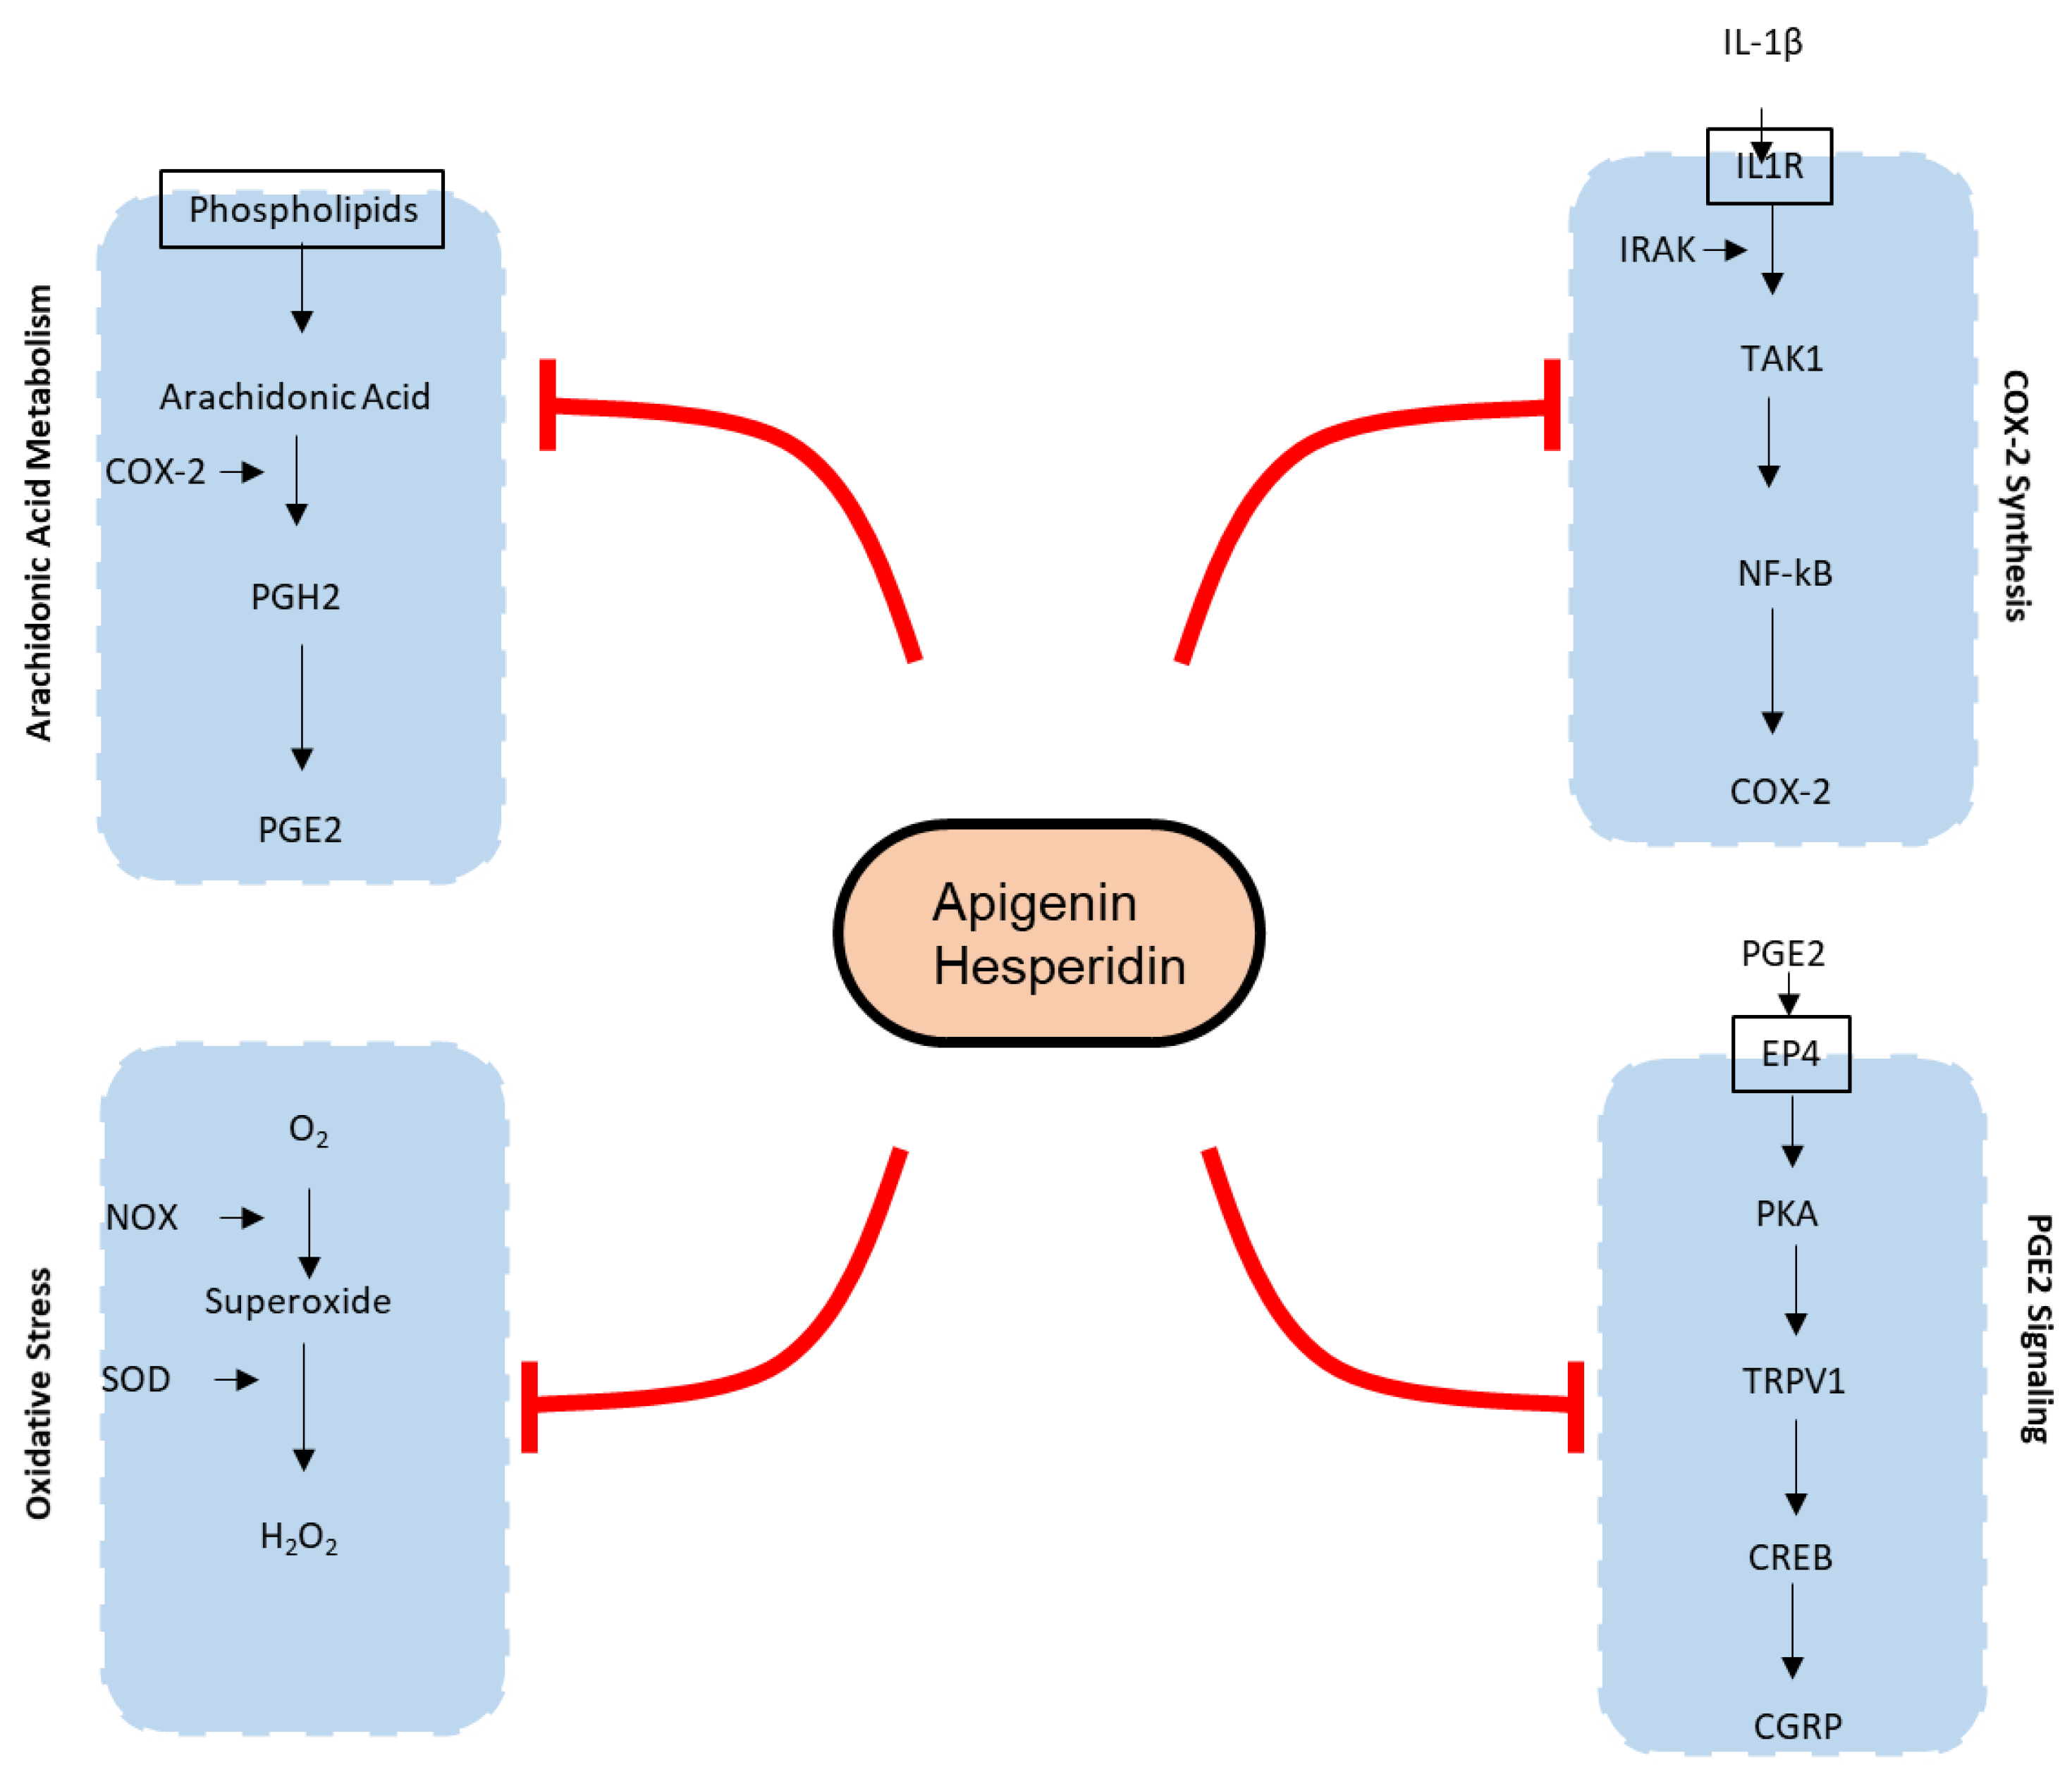
3.1. Effect of Apigenin and Hesperidin on the COX-2 Synthesis Pathway

Apigenin and hesperidin targeted COX-2 synthesis in chondrocytes. The effects of apigenin and hesperidin individually are shown in panels A and B, respectively, and the results from their combination are shown in Figure 3C. COX-2 levels were compared over a period of 2 days in the presence and absence of apigenin and hesperidin.
The levels of COX-2 were estimated to be 7.62 nM for the control condition. At the end of a 2-day period, COX-2 concentrations reduced to 2.2 nM in the presence of 30 mg of apigenin, as shown in Figure 3A. In the presence of 1000 mg of hesperidin, COX-2 concentrations reduced to 0.58 nM over a period of 2 days, as shown in Figure 3B. When combined, apigenin and hesperidin lowered COX-2 levels even further to 0.28 nM (Figure 3C).
To determine whether the apigenin and hesperidin combination value of 0.28 nM reflects a synergistic effect, the additive effect range is calculated for the biomarker COX-2 by the sequential (forward and reverse) administration of apigenin and hesperidin. As shown in Table 1, the additive effect range for the combination of 30 mg apigenin and 1000 mg hesperidin is 1.54–1.93 nM when apigenin and hesperidin were added sequentially.
When combined simultaneously, apigenin and hesperidin lowered COX-2 levels to 0.28 nM (Figure 3C). This value is lower than the additive effect range of 1.54–1.93 nM for COX-2, indicating that this specific combination has a synergistic effect. Specifically, the COX-2 level with the combination is 81.82–85.50% lower than the additive range. These results indicate that apigenin and hesperidin act in synergy to reduce COX-2, which is associated with joint pain.

3.2. Effect of Apigenin and Hesperidin on Arachidonic Acid Metabolism Pathways

Apigenin and hesperidin both targeted arachidonic acid’s metabolism. The effect of apigenin and hesperidin individually is shown in panels A and B, respectively, and results from their combination are shown in Figure 4C. PGE2 levels were compared over a period of 2 days in the presence and absence of apigenin and hesperidin.
The levels of PGE2 were estimated to be 823 AUC for the control condition. At the end of a 2-day period, PGE2 concentrations reduced to 526 AUC in the presence of 30 mg of apigenin, as shown in Figure 4A. In the presence of 1000 mg of hesperidin, PGE2 concentrations reduced to 447 AUC over a period of 2 days, as shown in Figure 4B. When combined, apigenin and hesperidin lowered PGE2 levels even further to 286 AUC (Figure 4C).
To determine whether the apigenin and hesperidin combination value of 286 AUC reflects a synergistic effect, the additive effect range is calculated for the biomarker PGE2 by the sequential (forward and reverse) administration of apigenin and hesperidin. As shown in Table 2, the additive effect range for the combination of 30 mg apigenin and 1000 mg hesperidin is 217–289 AUC when apigenin and hesperidin were added sequentially.
When combined simultaneously, apigenin and hesperidin lowered PGE2 levels to 286 AUC (Figure 4C). This value falls within the additive effect range of 217–289 nM for PGE2, indicating that this specific combination has an additive effect in reducing PGE2, which is associated with joint pain.

3.3. Effect of Apigenin and Hesperidin on PGE2 Signaling Pathways

Apigenin and hesperidin both targeted the PGE2 signaling pathway and lowered both biomarkers—TRPV1 and CGRP. The results are shown in Figure 5. Panels A and B represent the individual effects of apigenin and hesperidin on TRPV1, respectively, and results from their combination are shown in panel C. Panels D and E represent the individual effects of apigenin and hesperidin on CGRP, respectively, and results from their combination are shown in panel F. TRPV1 and CGRP levels were compared over a period of 2 days in the presence and absence of apigenin and hesperidin.
The levels of TRPV1 were estimated to be 0.039 nM for the control condition. At the end of a 2-day period, TRPV1 concentrations reduced to 0.014 nM in the presence of 30 mg of apigenin, as shown in Figure 5A. In the presence of 1000 mg of hesperidin, TRPV1 concentrations reduced to 0.0007 nM over a period of 2 days, as shown in Figure 5B.
To determine whether the apigenin and hesperidin combination value of 0.00019 nM reflects a synergistic effect, the additive effect range is calculated for the biomarker TRPV1 by a sequential (forward and reverse) administration of apigenin and hesperidin. As shown in Table 3, the additive effect range for the combination of 30 mg apigenin and 1000 mg hesperidin is 0.0027–0.0325 nM when apigenin and hesperidin were added sequentially.
When combined simultaneously, apigenin and hesperidin lowered TRPV1 levels to 0.00019 (Figure 5C). This value is lower than the additive effect range of 1.54–1.93 nM for TRPV1, indicating that this specific combination has a synergistic effect. Specifically, the TRPV1 level with the combination is >99% lower than the additive range. These results indicate that apigenin and hesperidin act in synergy to reduce TRPV1, which is associated with joint pain.
The levels of CGRP were estimated to be 0.045 nM for the control condition. At the end of a 2-day period, CGRP concentrations reduced to 0.0004 nM in the presence of 30 mg of apigenin, as shown in Figure 5D. In the presence of 1000 mg of hesperidin, CGRP levels reduced to 6.82 × 10⁻⁹ nM over a period of 2 days, as shown in Figure 5E. When combined, apigenin and hesperidin lowered CGRP levels even further to 2.65 × 10⁻¹⁰ nM (Figure 5F).
To determine whether the apigenin and hesperidin combination value of 2.65 × 10⁻¹⁰ nM reflects a synergistic effect, the additive effect range was calculated for the biomarker CGRP by a sequential (forward and reverse) administration of apigenin and hesperidin. As shown in Table 4, the additive effect range for the combination of 30 mg apigenin and 1000 mg hesperidin is 0.066–1.17 × 10⁻⁶ nM when apigenin and hesperidin were added sequentially.
When combined simultaneously, apigenin and hesperidin lowered CGRP levels to 2.65 × 10⁻¹⁰ nM nM (Figure 5F). This value is lower than the additive effect range of 0.066–1.17 × 10⁻⁶ nM for CGRP, indicating that this specific combination has a synergistic effect. Specifically, the CGRP level with the combination is >99% lower than the additive range. These results indicate that apigenin and hesperidin act in synergy to reduce CGRP, which is associated with joint pain.

3.4. Effect of Apigenin and Hesperidin on Oxidative Stress Signaling Pathway

Apigenin and hesperidin targeted the oxidative stress signaling pathway. The effect of apigenin and hesperidin individually is shown in panels A and B, respectively, and results from their combination are shown in Figure 6C. ROS levels were compared over a period of 2 days in the presence and absence of apigenin and hesperidin.
To determine whether the apigenin and hesperidin combination value of 1.117 nM reflects a synergistic effect, the additive effect range is calculated for the biomarker ROS by a sequential (forward and reverse) administration of apigenin and hesperidin. As shown in Table 5, the additive effect range for the combination of 30 mg apigenin and 1000 mg hesperidin is 1.34–12.69 nM when apigenin and hesperidin were added sequentially.
When combined simultaneously, apigenin and hesperidin lowered ROS levels to 1.117 nM (Figure 6C). This value is lower than the additive effect range of 1.34–12.69 nM for ROS, indicating that this specific combination has a synergistic effect. Specifically, ROS levels with the combination are 16.64–91.20% lower than the additive range. These results indicate that apigenin and hesperidin act in synergy to reduce ROS, which is associated with joint pain.

4. Discussion

This study provides the in silico modeling and quantification of synergistic effects of multi-combination compounds—phytonutrients—to attenuate joint pain using a computational systems biology method—CytoSolve. The study revealed that four of the five biomarkers—COX-2, TRPV1, CGRP, and ROS—were synergistically affected by the specific combination of apigenin and hesperidin. This study provides an in silico computational systems biology framework to model and quantify the synergistic or additive effects for multi-combination compounds on a particular physiological indication.
Joint pain is a hallmark symptom of several joint pathologies, such as osteoarthritis, rheumatoid arthritis, etc. [25,26]. In addition, sedentary lifestyles and aging have also been shown to cause joint pain [27]. The first line of treatment for joint pain includes non-steroidal anti-inflammatory drugs (NSAIDs) [28]; however, the chronic use of NSAIDs leads to adverse effects, including ulcers and kidney problems [29]. Increasing evidence suggests that phytonutrients with anti-inflammatory and antioxidant potential lower joint pain and improve inflammatory arthritis [30]. However, the mechanisms of actions of such phytonutrients in reducing joint pain remain poorly understood.
Results from this study enable the mechanistic understanding of joint pain and the development of a novel plant-based joint pain intervention for joint-related pathologies such as osteoarthritis and rheumatoid arthritis. This study is a first of its kind, to the best of our knowledge, that has not only mathematically modelled mechanisms involved in joint pain using a computational systems biology approach to predict how apigenin and hesperidin modulate the production of pro-inflammatory agents responsible for joint pain but also in providing a quantification of the five specific biomarkers implicated in joint pain to determine synergy versus additive effects of a multi-combination cocktail of compounds.
Systems biology is becoming a ubiquitous and reliable method to uncover how synthetic small molecules as well as phytonutrients influence a myriad of biological functions and diseases [31]. Leafy green vegetables, an essential part of Mediterranean, fruit, and vegetarian diets, have been shown to have anti-inflammatory effects [32]. Increasing evidences suggests that diets rich in anti-inflammatory and anti-oxidant compounds can modulate pain [33]. In this study, we focused on understanding the effects of apigenin, found in vegetables such as parsley, spinach, and celery, and hesperidin, which is found in citrus fruits, on joint pain. We used a systems biology approach to identify joint-pain molecular mechanisms of action. Both apigenin and hesperidin were found to have molecular targets in these molecular mechanisms of action. A summary of specific effects of apigenin and hesperidin is presented in Table 6 below.

5. Conclusions and Future Work

5.1. Conclusions

An integrated in silico model of joint pain was developed to assess the efficacy of phytonutrients on five biomarkers of joint pain, namely, PGE-2, TRPV1, CGRP, COX-2, and ROS. Apigenin lowered four of the five biomarkers, whereas hesperidin lowered all five biomarkers of joint pain individually. A combination of apigenin and hesperidin lowered all five biomarkers of joint pain; however, this specific combination synergistically lowered four of the five biomarkers, COX-2, TRPV1, CGRP, and ROS, while additively lowering PGE2.
The development of molecular systems architecture in this study provides a system-wide understanding of biomolecular interactions that characterize a biological phenomenon or a complex disease such as joint pain. In addition, such an architecture can provide insights on the anti-inflammatory and nociceptive effects of apigenin and hesperidin that may lead to improvements in joint pain.

5.2. Future Work

While in vivo results have demonstrated the lowering of pain and swelling in equine using this specific combination (patent application ref), future in vitro experiments are planned to support the integrative molecular systems architecture developed in this study. To simulate joint pain, in vitro experiments using chondrocytes under inflammatory conditions could be undertaken. A comparison of all five biomarkers (PGE-2, TRPV1, CGRP, COX-2, and ROS) from such in vitro experiments and those obtained from this study is under consideration as part of future work to validate the results from this study.

Supplementary Materials

The following supporting information can be downloaded at: https://www.mdpi.com/article/10.3390/app121910013/s1. References [34,35,36,37,38,39,40,41,42,43,44,45,46,47,48,49,50,51,52,53,54,55,56,57,58,59,60,61,62,63,64,65,66,67,68,69,70,71,72,73,74,75,76,77,78,79,80,81,82,83,84,85,86,87,88,89,90,91,92,93,94,95,96,97,98,99,100,101,102,103,104,105,106] are cited in the Supplementary Materials.

Author Contributions

Conceptualization, in silico simulations, data curation, figures generation, and writing the draft article, V.A.S.A. and P.D.; editing the draft article and reviewing the article, V.A.S.A. and P.D. All authors have read and agreed to the published version of the manuscript.

Funding

This research was funded by RAMARD Inc. Grant No: CS-RAMARD-JT-PN.

Institutional Review Board Statement

Not applicable.

Informed Consent Statement

Not applicable.

Data Availability Statement

Not applicable.

Conflicts of Interest

S.A. is the Founder and Chief Science Officer of CytoSolve, Inc. P.D. is a current employee of CytoSolve, Inc.

References

  1. Kidd, B.L.; Langford, R.M.; Wodehouse, T. Arthritis and pain. Current approaches in the treatment of arthritic pain. Arthritis Res. Ther. 2007, 9, 214. [Google Scholar] [CrossRef] [PubMed] [Green Version]
  2. Hurley, M.; Sheldon, H.; Connolly, M.; Carter, A.; Hallett, R. Providing easier access to community-based healthcare for people with joint pain: Experiences of delivering ESCAPE-pain in community venues by exercise professionals. Musculoskelet. Care 2022, 20, 408–415. [Google Scholar] [CrossRef] [PubMed]
  3. Yoon, E.; Doherty, J.B. Arthritis pain. J. Gerontol. Soc. Work 2008, 50 (Suppl. S1), 79–103. [Google Scholar] [CrossRef]
  4. Lee, A.S.; Ellman, M.B.; Yan, D.; Kroin, J.S.; Cole, B.J.; van Wijnen, A.J.; Im, H.J. A Current Review of Molecular Mechanisms Regarding Osteoarthritis and Pain. Gene 2013, 527, 440. [Google Scholar] [CrossRef] [PubMed] [Green Version]
  5. Li, X.; Kim, J.S.; Van Wijnen, A.J.; Im, H.J. Osteoarthritic Tissues Modulate Functional Properties of Sensory Neurons Associated with Symptomatic OA Pain. Mol. Biol. Rep. 2011, 38, 5335. [Google Scholar] [CrossRef]
  6. Felson, D.T. The sources of pain in knee osteoarthritis. Curr. Opin. Rheumatol. 2005, 17, 624–628. [Google Scholar] [CrossRef] [PubMed]
  7. Dray, A.; Read, S.J. Arthritis and pain. Future targets to control osteoarthritis pain. Arthritis Res. Ther. 2007, 9, 212. [Google Scholar] [CrossRef] [Green Version]
  8. Cho, H.; Walker, A.; Williams, J.; Hasty, K.A.; Shuang, Y. Study of Osteoarthritis Treatment with Anti-Inflammatory Drugs: Cyclooxygenase-2 Inhibitor and Steroids. Biomed Res. Int. 2015, 2015, 595273. [Google Scholar] [CrossRef] [Green Version]
  9. Jang, Y.; Kim, M.; Hwang, S.W. Molecular mechanisms underlying the actions of arachidonic acid-derived prostaglandins on peripheral nociception. J. Neuroinflamm. 2020, 17, 30. [Google Scholar] [CrossRef]
  10. Jenkins, D.W.; Feniuk, W.; Humphrey, P.P.A. Characterization of the prostanoid receptor types involved in mediating calcitonin gene-related peptide release from cultured rat trigeminal neurones. Br. J. Pharmacol. 2001, 134, 1296–1302. [Google Scholar] [CrossRef]
  11. Moriyama, T.; Higashi, T.; Togashi, K.; Iida, T.; Segi, E.; Sugimoto, Y.; Tominaga, T.; Narumiya, S.; Tominaga, M. Sensitization of TRPV1 by EP1 and IP reveals peripheral nociceptive mechanism of prostaglandins. Mol. Pain 2005, 1, 3. [Google Scholar] [CrossRef] [PubMed] [Green Version]
  12. Al-Lazikani, B.; Banerji, U.; Workman, P. Combinatorial drug therapy for cancer in the post-genomic era. Nat. Biotechnol. 2012, 30, 679–692. [Google Scholar] [CrossRef] [PubMed]
  13. Kim, J.K.; Park, S.U. Recent insights into the biological functions of apigenin. EXCLI J. 2020, 19, 984. [Google Scholar]
  14. Hong, S.; Dia, V.P.; Baek, S.J.; Zhong, Q. Nanoencapsulation of apigenin with whey protein isolate: Physicochemical properties, in vitro activity against colorectal cancer cells, and bioavailability. LWT 2022, 154, 112751. [Google Scholar] [CrossRef] [PubMed]
  15. Abid, R.; Ghazanfar, S.; Farid, A.; Sulaman, S.M.; Idrees, M.; Amen, R.A.; Muzammal, M.; Shahzad, M.K.; Mohamed, M.O.; Khaled, A.A.; et al. Pharmacological Properties of 4′, 5, 7-Trihydroxyflavone (Apigenin) and Its Impact on Cell Signaling Pathways. Molecules 2022, 27, 4304. [Google Scholar] [CrossRef]
  16. Pyrzynska, K. Hesperidin: A Review on Extraction Methods, Stability and Biological Activities. Nutrients 2022, 14, 2387. [Google Scholar] [CrossRef]
  17. Ayyadurai, V.A.S.; Deonikar, P. Bioactive compounds in green tea may improve transplant tolerance: A computational systems biology analysis. Clin. Nutr. ESPEN 2021, 46, 439–452. [Google Scholar] [CrossRef]
  18. Ayyadurai, V.A.S.; Deonikar, P.; Bannuru, R.R. Attenuation of low-grade chronic inflammation by phytonutrients: A computational systems biology analysis. Clin. Nutr. ESPEN 2022, 49, 425–435. [Google Scholar] [CrossRef]
  19. Moher, D.; Liberati, A.; Tetzlaff, J.; Altman, D.G.; Altman, D.; Antes, G.; Atkins, D.; Barbour, V.; Barrowman, N.; Berlin, J.A.; et al. Preferred reporting items for systematic reviews and meta-analyses: The PRISMA statement. PLoS Med. 2009, 6, e1000097. [Google Scholar] [CrossRef] [Green Version]
  20. Imamura, M.; Targino, R.A.; Hsing, W.T.; Imamura, S.; Azevedo, R.S.; Villas Boas, L.S.; Tozetto-Mendoza, T.R.; Alfieri, F.M.; Filippo, T.R.; Battistella, L.R. Concentration of cytokines in patients with osteoarthritis of the knee and fibromyalgia. Clin. Interv. Aging 2014, 9, 939. [Google Scholar]
  21. King, S.S.; Abughazaleh, A.A.; Webel, S.K.; Jones, K.L. Circulating fatty acid profiles in response to three levels of dietary omega-3 fatty acid supplementation in horses. J. Anim. Sci. 2008, 86, 1114–1123. [Google Scholar] [CrossRef] [PubMed] [Green Version]
  22. Yang, K.; Ma, W.; Liang, H.; Ouyang, Q.; Tang, C.; Lai, L. Dynamic Simulations on the Arachidonic Acid Metabolic Network. PLoS Comput. Biol. 2007, 3, 523–530. [Google Scholar] [CrossRef] [PubMed]
  23. Jansen, F.; Yang, X.; Franklin, B.S.; Hoelscher, M.; Schmitz, T.; Bedorf, J.; Nickenig, G.; Werner, N. High glucose condition increases NADPH oxidase activity in endothelial microparticles that promote vascular inflammation. Cardiovasc. Res. 2013, 98, 94–106. [Google Scholar] [CrossRef] [PubMed] [Green Version]
  24. Yuan, S.; Chen, H. Mathematical rules for synergistic, additive, and antagonistic effects of multi-drug combinations and their application in research and development of combinatorial drugs and special medical food combinations. Food Sci. Hum. Wellness 2019, 8, 136–141. [Google Scholar] [CrossRef]
  25. Walsh, D.A.; McWilliams, D.F. Pain in rheumatoid arthritis. Curr. Pain Headache Rep. 2012, 16, 509–517. [Google Scholar] [CrossRef]
  26. O’Neill, T.W.; Felson, D.T. Mechanisms of Osteoarthritis (OA) Pain. Curr. Osteoporos. Rep. 2018, 16, 611. [Google Scholar] [CrossRef] [Green Version]
  27. Zhaoyang, R.; Martire, L.M. Daily Sedentary Behavior Predicts Pain and Affect in Knee Arthritis. Ann. Behav. Med. 2019, 53, 642–651. [Google Scholar] [CrossRef]
  28. McAlindon, T.E.; Bannuru, R.R.; Sullivan, M.C.; Arden, N.K.; Berenbaum, F.; Bierma-Zeinstra, S.M.; Hawker, G.A.; Henrotin, Y.; Hunter, D.J.; Kawaguchi, H.; et al. OARSI guidelines for the non-surgical management of knee osteoarthritis. Osteoarthr. Cartil. 2014, 22, 363–388. [Google Scholar] [CrossRef] [Green Version]
  29. Bindu, S.; Mazumder, S.; Bandyopadhyay, U. Non-steroidal anti-inflammatory drugs (NSAIDs) and organ damage: A current perspective. Biochem. Pharmacol. 2020, 180, 114147. [Google Scholar] [CrossRef]
  30. Bañuls-Mirete, M.; Ogdie, A.; Guma, M. Micronutrients: Essential Treatment for Inflammatory Arthritis? Curr. Rheumatol. Rep. 2020, 22, 87. [Google Scholar] [CrossRef]
  31. Badimon, L.; Vilahur, G.; Padro, T. Systems biology approaches to understand the effects of nutrition and promote health. Br. J. Clin. Pharmacol. 2017, 83, 38–45. [Google Scholar] [CrossRef] [Green Version]
  32. Johnson, M.; McElhenney, W.H.; Egnin, M. Influence of Green Leafy Vegetables in Diets with an Elevated ω-6:ω-3 Fatty Acid Ratio on Rat Blood Pressure, Plasma Lipids, Antioxidant Status and Markers of Inflammation. Nutrients 2019, 11, 301. [Google Scholar] [CrossRef] [PubMed]
  33. Rondanelli, M.; Faliva, M.A.; Miccono, A.; Naso, M.; Nichetti, M.; Riva, A.; Guerriero, F.; De Gregori, M.; Peroni, G.; Perna, S. Food pyramid for subjects with chronic pain: Foods and dietary constituents as anti-inflammatory and antioxidant agents. Nutr. Res. Rev. 2018, 31, 131–151. [Google Scholar] [CrossRef] [PubMed]
  34. Ayyadurai, V.A.S.; Dewey, C.F. CytoSolve: A Scalable Computational Method for Dynamic Integration of Multiple Molecular Pathway Models. Cell. Mol. Bioeng. 2011, 4, 28–45. [Google Scholar] [CrossRef] [PubMed] [Green Version]
  35. Nordsletten, D.A.; Yankama, B.; Umeton, R.; Ayyadurai, V.V.S.; Dewey, C.F. Multiscale Mathematical Modeling to Support Drug Development. IEEE Trans. Biomed. Eng. 2011, 58, 3508–3512. [Google Scholar] [CrossRef]
  36. Sweeney, M.D.; Ayyadurai, S.; Zlokovic, B.V. Pericytes of the Neurovascular Unit: Key Functions and Signaling Pathways. Nat. Neurosci. 2016, 19, 771–783. [Google Scholar] [CrossRef]
  37. Koo, A.; Nordsletten, D.; Umeton, R.; Yankama, B.; Ayyadurai, S.; García-Cardeña, G.; Dewey, C.F. In Silico Modeling of Shear-Stress-Induced Nitric Oxide Production in Endothelial Cells through Systems Biology. Biophys. J. 2013, 104, 2295–2306. [Google Scholar] [CrossRef] [PubMed] [Green Version]
  38. CytoSolve, Inc. Food and Drug Administration Center for Drug Evaluation and Research Request for Determination of Exempt Status of Investigational New Drug Application (IND) for Cyto-001 as Treatment for Patients with Pancreatic Cancer (PIND: 118833); CytoSolve, Inc.: Beltsville, MD, USA, 2013. [Google Scholar]
  39. Ayyadurai, V.A.S.; Deonikar, P.; McLure, K.G.; Sakamoto, K.M. Molecular Systems Architecture of Interactome in the Acute Myeloid Leukemia Microenvironment. Cancers 2022, 14, 756. [Google Scholar] [CrossRef] [PubMed]
  40. Ayyadurai, V.A.S.; Deonikar, P. Do GMOs Accumulate Formaldehyde and Disrupt Molecular Systems Equilibria? Systems Biology May Provide Answers. Agric. Sci. 2015, 6, 630–662. [Google Scholar] [CrossRef] [Green Version]
  41. Kothandaram, S.; Deonikar, P.; Mohan, M.; Venugopal, V.; Ayyadurai, V.A.S. In Silico Modeling of C1 Metabolism. Am. J. Plant Sci. 2015, 6, 1444–1465. [Google Scholar] [CrossRef] [Green Version]
  42. Mohan, M.; Kothandaram, S.; Venugopal, V.; Deonikar, P.; Ayyadurai, V.A.S. Integrative Modeling of Oxidative Stress and C1 Metabolism Reveals Upregulation of Formaldehyde and Downregulation of Glutathione. Am. J. Plant Sci. 2015, 6, 1527–1542. [Google Scholar] [CrossRef] [Green Version]
  43. Ayyadurai, V.A.S.; Hansen, M.; Fagan, J.; Deonikar, P. In-Silico Analysis & In-Vivo Results Concur on Glutathione Depletion in Glyphosate Resistant GMO Soy, Advancing a Systems Biology Framework for Safety Assessment of GMOs. Am. J. Plant Sci. 2016, 7, 1571–1589. [Google Scholar] [CrossRef]
  44. Cornish-Bowden, A. One Hundred Years of Michaelis–Menten Kinetics. Perspect. Sci. 2015, 4, 3–9. [Google Scholar] [CrossRef]
  45. Michaelis, L.; Menten, M.L.; Goody, R.S.; Johnson, K.A. Die Kinetik Der Invertinwirkung/ The Kinetics of Invertase Action. Biochemistry 1913, 49, 352. [Google Scholar]
  46. Hucka, M.; Finney, A.; Sauro, H.M.; Bolouri, H.; Doyle, J.C.; Kitano, H.; Arkin, A.P.; Bornstein, B.J.; Bray, D.; Cornish-Bowden, A.; et al. The Systems Biology Markup Language (SBML): A Medium for Representation and Exchange of Biochemical Network Models. Bioinformatics 2003, 19, 524–531. [Google Scholar] [CrossRef] [PubMed] [Green Version]
  47. Ayyadurai, V.A.S. Services-Based Systems Architecture for Modeling the Whole Cell: A Distributed Collaborative Engineering Systems Approach. Commun. Med. Care Compunetics 2010, 1, 115–168. [Google Scholar]
  48. Shmulevich, I.; Aitchison, J.D. DETERMINISTIC AND STOCHASTIC MODELS OF GENETIC REGULATORY NETWORKS. Methods Enzymol. 2009, 467, 335. [Google Scholar] [CrossRef] [PubMed] [Green Version]
  49. Oden, J.T.; John, T.; Reddy, J.N.; Junuthula, N. An Introduction to the Mathematical Theory of Finite Elements, 1976th ed.; Dover Publications: New York, NY, USA, 2011; ISBN 9780486142210. [Google Scholar]
  50. Cumming, G.; Fidler, F.; Vaux, D.L. Error Bars in Experimental Biology. J. Cell Biol. 2007, 177, 7. [Google Scholar] [CrossRef] [PubMed] [Green Version]
  51. Thanh, V.H.; Zunino, R.; Priami, C. Efficient Finite-Difference Method for Computing Sensitivities of Biochemical Reactions. Proc. R. Soc. A Math. Phys. Eng. Sci. 2018, 474. [Google Scholar] [CrossRef] [Green Version]
  52. Kablar, N.A.; Kvrgi, V. Mathematical Model of IL − 1 — N F ΚB Biological Module. J. Theor. Biol. 2012, 1, 31–37. [Google Scholar]
  53. Hoffmann, A.; Levchenko, A.; Scott, M.L.; Baltimore, D. The IκB-NF-ΚB Signaling Module: Temporal Control and Selective Gene Activation. Science 2002. [Google Scholar] [CrossRef] [PubMed] [Green Version]
  54. Boerboom, D.; Brown, K.A.; Vaillancourt, D.; Poitras, P.; Goff, A.K.; Watanabe, K.; Doré, M.; Sirois, J. Expression of Key Prostaglandin Synthases in Equine Endometrium During Late Diestrus and Early Pregnancy. Biol. Reprod. 2004, 70, 391–399. [Google Scholar] [CrossRef] [PubMed] [Green Version]
  55. Learn, C.A.; Mizel, S.B.; McCall, C.E. MRNA and Protein Stability Regulate the Differential Expression of Pro- and Anti-Inflammatory Genes in Endotoxin-Tolerant THP-1 Cells. J. Biol. Chem. 2000, 275, 12185–12193. [Google Scholar] [CrossRef] [PubMed] [Green Version]
  56. Ghorbani, A.; Nazari, M.; Jeddi-Tehrani, M.; Zand, H. The Citrus Flavonoid Hesperidin Induces P53 and Inhibits NF-ΚB Activation in Order to Trigger Apoptosis in NALM-6 Cells: Involvement of PPARγ-Dependent Mechanism. Eur. J. Nutr. 2012, 51, 39–46. [Google Scholar] [CrossRef] [PubMed]
  57. Shukla, S.; Kanwal, R.; Shankar, E.; Datt, M.; Chance, M.R.; Fu, P.; MacLennan, G.T.; Gupta, S. Apigenin Blocks IKKα Activation and Suppresses Prostate Cancer Progression. Oncotarget 2015, 6, 31216. [Google Scholar] [CrossRef] [PubMed]
  58. Alcaraz, M.J.; Ferrándiz, M.L. Modification of Arachidonic Metabolism by Flavonoids. J. Ethnopharmacol. 1987, 21, 209–229. [Google Scholar] [CrossRef]
  59. Franke, R.; Schilcher, H. Chamomile Indrsurtia Profiles, 1st ed.; CRC Press: Boca Raton, FA, USA; p. 304. ISBN 9780429215674.
  60. McLaughlin, S.; Wang, J.; Gambhir, A.; Murray, D. PIP(2) and Proteins: Interactions, Organization, and Information Flow. Annu. Rev. Biophys. Biomol. Struct. 2002, 31, 151–175. [Google Scholar] [CrossRef] [PubMed] [Green Version]
  61. Willoughby, D.; Cooper, D.M.F. Organization and Ca2+ Regulation of Adenylyl Cyclases in CAMP Microdomains. Physiol. Rev. 2007, 87, 965–1010. [Google Scholar] [CrossRef] [Green Version]
  62. Kawaguchi, S.Y.; Hirano, T. Gating of Long-Term Depression by Ca2+/Calmodulin-Dependent Protein Kinase II through Enhanced CGMP Signalling in Cerebellar Purkinje Cells. J. Physiol. 2013, 591, 1707–1730. [Google Scholar] [CrossRef]
  63. Wei, X.; Zhang, X.; Zuscik, M.J.; Drissi, M.H.; Schwarz, E.M.; O’Keefe, R.J. Fibroblasts Express RANKL and Support Osteoclastogenesis in a COX-2-Dependent Manner after Stimulation with Titanium Particles. J. Bone Miner. Res. 2005, 20, 1136–1148. [Google Scholar] [CrossRef]
  64. Calebiro, D.; Nikolaev, V.O.; Gagliani, M.C.; De Filippis, T.; Dees, C.; Tacchetti, C.; Persani, L.; Lohse, M.J. Persistent CAMP-Signals Triggered by Internalized G-Protein-Coupled Receptors. PLoS Biol. 2009, 7. [Google Scholar] [CrossRef] [Green Version]
  65. Markevich, N.I.; Hoek, J.B.; Kholodenko, B.N. Signaling Switches and Bistability Arising from Multisite Phosphorylation in Protein Kinase Cascades. J. Cell Biol. 2004, 164, 353–359. [Google Scholar] [CrossRef] [PubMed]
  66. Salonikidis, P.S.; Zeug, A.; Kobe, F.; Ponimaskin, E.; Richter, D.W. Quantitative Measurement of CAMP Concentration Using an Exchange Protein Directly Activated by a CAMP-Based FRET-Sensor. Biophys. J. 2008, 95, 5412–5423. [Google Scholar] [CrossRef] [PubMed] [Green Version]
  67. Biggin, M.D. Animal Transcription Networks as Highly Connected, Quantitative Continua. Dev. Cell 2011, 21, 611–626. [Google Scholar] [CrossRef] [Green Version]
  68. Dolan, A.T.; Diamond, S.L. Systems Modeling of Ca(2+) Homeostasis and Mobilization in Platelets Mediated by IP3 and Store-Operated Ca(2+) Entry. Biophys. J. 2014, 106, 2049–2060. [Google Scholar] [CrossRef]
  69. Greget, R.; Pernot, F.; Bouteiller, J.M.C.; Ghaderi, V.; Allam, S.; Keller, A.F.; Ambert, N.; Legendre, A.; Sarmis, M.; Haeberle, O.; et al. Simulation of Postsynaptic Glutamate Receptors Reveals Critical Features of Glutamatergic Transmission. PLoS ONE 2011, 6, e28380. [Google Scholar] [CrossRef] [PubMed] [Green Version]
  70. Chang, C.W.; Poteet, E.; Schetz, J.A.; Gümüş, Z.H.; Weinstein, H. Towards a Quantitative Representation of the Cell Signaling Mechanisms of Hallucinogens: Measurement and Mathematical Modeling of 5-HT1A and 5-HT2A Receptor-Mediated ERK1/2 Activation. Neuropharmacology 2009, 56 (Suppl. S1), 213–225. [Google Scholar] [CrossRef] [Green Version]
  71. Wu, G.; Lü, J.M.; Van Der Donk, W.A.; Kulmacz, R.J.; Tsai, A.L. Cyclooxygenase Reaction Mechanism of Prostaglandin H Synthase from Deuterium Kinetic Isotope Effects. J. Inorg. Biochem. 2011, 105, 382–390. [Google Scholar] [CrossRef] [Green Version]
  72. Buschow, R. The Heterogeneity of TRPV1 and Its Activation in Nociceptive Neurons. Ph.D. Thesis, Freien Universität Berlin, Berlin, Germany, 2014. [Google Scholar]
  73. Zuo, P.; Picher, M.; Okada, S.F.; Lazarowski, E.R.; Button, B.; Boucher, R.C.; Elston, T.C. Mathematical Model of Nucleotide Regulation on Airway Epithelia: IMPLICATIONS FOR AIRWAY HOMEOSTASIS*. J. Biol. Chem. 2008, 283, 26805. [Google Scholar] [CrossRef] [Green Version]
  74. Marshall, F.H.; Patel, K.; Lundstrom, K.; Camacho, J.; Foord, S.M.; Lee, M.G. Characterization of [3H]-Prostaglandin E2 Binding to Prostaglandin EP4 Receptors Expressed with Semliki Forest Virus. Br. J. Pharmacol. 1997, 121, 1673–1678. [Google Scholar] [CrossRef] [Green Version]
  75. Ponsioen, B.; Zhao, J.; Riedl, J.; Zwartkruis, F.; van der Krogt, G.; Zaccolo, M.; Moolenaar, W.H.; Bos, J.L.; Jalink, K. Detecting CAMP-Induced Epac Activation by Fluorescence Resonance Energy Transfer: Epac as a Novel CAMP Indicator. EMBO Rep. 2004, 5, 1176–1180. [Google Scholar] [CrossRef] [Green Version]
  76. Ogawa, N.; Kurokawa, T.; Fujiwara, K.; Polat, O.K.; Badr, H.; Takahashi, N.; Mori, Y. Functional and Structural Divergence in Human TRPV1 Channel Subunits by Oxidative Cysteine Modification. J. Biol. Chem. 2016, 291, 4197–4210. [Google Scholar] [CrossRef] [Green Version]
  77. Long, X.; Fan, M.; Bigsby, R.M.; Nephew, K.P. Apigenin Inhibits Antiestrogen-Resistant Breast Cancer Cell Growth through Estrogen Receptor-Alpha-Dependent and Estrogen Receptor-Alpha-Independent Mechanisms. Mol. Cancer Ther. 2008, 7, 2096–2108. [Google Scholar] [CrossRef] [PubMed] [Green Version]
  78. Lin, J.K. Suppression of Protein Kinase C and Nuclear Oncogene Expression as Possible Action Mechanisms of Cancer Chemoprevention by Curcumin. Arch. Pharm. Res. 2004, 27, 683–692. [Google Scholar] [CrossRef]
  79. Jin, Y.R.; Han, X.H.; Zhang, Y.H.; Lee, J.J.; Lim, Y.; Chung, J.H.; Yun, Y.P. Antiplatelet Activity of Hesperetin, a Bioflavonoid, Is Mainly Mediated by Inhibition of PLC-Gamma2 Phosphorylation and Cyclooxygenase-1 Activity. Atherosclerosis 2007, 194, 144–152. [Google Scholar] [CrossRef] [PubMed]
  80. Boonpawa, R.; Spenkelink, A.; Punt, A.; Rietjens, I.M.C.M. Physiologically Based Kinetic Modeling of Hesperidin Metabolism and Its Use to Predict in Vivo Effective Doses in Humans. Mol. Nutr. Food Res. 2017, 61. [Google Scholar] [CrossRef] [Green Version]
  81. Martínez, I.; Saracho, R.; Moina, I.; Montenegro, J.; Llach, F. Is There a Lesser Hyperparathyroidism in Diabetic Patients with Chronic Renal Failure? Nephrol. Dial. Transplant. 1998, 13, 9–11. [Google Scholar] [CrossRef] [Green Version]
  82. Rehmann, H. Epac-Inhibitors: Facts and Artefacts. Sci. Rep. 2013, 3. [Google Scholar] [CrossRef] [Green Version]
  83. Enslen, H.; Tokumitsu, H.; Soderling, T.R. Phosphorylation of CREB by CaM-Kinase IV Activated by CaM-Kinase IV Kinase. Biochem. Biophys. Res. Commun. 1995, 207, 1038–1043. [Google Scholar] [CrossRef] [PubMed]
  84. Tomaiuolo, M.; Kottke, M.; Matheny, R.W.; Reifman, J.; Mitrophanov, A.Y. Computational Identification and Analysis of Signaling Subnetworks with Distinct Functional Roles in the Regulation of TNF Production. Mol. Biosyst. 2016, 12, 826–838. [Google Scholar] [CrossRef] [PubMed] [Green Version]
  85. Neeb, L.; Hellen, P.; Boehnke, C.; Hoffmann, J.; Schuh-Hofer, S.; Dirnagl, U.; Reuter, U. IL-1β Stimulates COX-2 Dependent PGE2 Synthesis and CGRP Release in Rat Trigeminal Ganglia Cells. PLoS ONE 2011, 6. [Google Scholar] [CrossRef] [PubMed]
  86. Ma, W. Chronic Prostaglandin E2 Treatment Induces the Synthesis of the Pain-Related Peptide Substance P and Calcitonin Gene-Related Peptide in Cultured Sensory Ganglion Explants. J. Neurochem. 2010, 115, 363–372. [Google Scholar] [CrossRef] [PubMed]
  87. Shimozawa, N.; Okajima, K.; Harada, N. Estrogen and Isoflavone Attenuate Stress-Induced Gastric Mucosal Injury by Inhibiting Decreases in Gastric Tissue Levels of CGRP in Ovariectomized Rats. Am. J. Physiol. Gastrointest. Liver Physiol. 2007, 292. [Google Scholar] [CrossRef] [PubMed] [Green Version]
  88. Dargemont, C.; Kühn, L.C. Export of MRNA from Microinjected Nuclei of Xenopus Laevis Oocytes. J. Cell Biol. 1992, 118, 1–9. [Google Scholar] [CrossRef] [PubMed]
  89. Deisseroth, K.; Heist, E.K.; Tsien, R.W. Translocation of Calmodulin to the Nucleus Supports CREB Phosphorylation in Hippocampal Neurons. Nature 1998, 392, 198–202. [Google Scholar] [CrossRef] [PubMed]
  90. Falcke, M.; Huerta, R.; Rabinovich, M.I.; Abarbanel, H.D.I.; Elson, R.C.; Selverston, A.I. Modeling Observed Chaotic Oscillations in Bursting Neurons: The Role of Calcium Dynamics and IP3. Biol. Cybern. 2000, 82, 517–527. [Google Scholar] [CrossRef]
  91. Dupont, G.; Houart, G.; De Koninck, P. Sensitivity of CaM Kinase II to the Frequency of Ca2+ Oscillations: A Simple Model. Cell Calcium 2003, 34, 485–497. [Google Scholar] [CrossRef]
  92. Saucerman, J.J.; Bers, D.M. Calmodulin Mediates Differential Sensitivity of CaMKII and Calcineurin to Local Ca2+ in Cardiac Myocytes. Biophys. J. 2008, 95, 4597–4612. [Google Scholar] [CrossRef] [Green Version]
  93. Shi, X.M.; Zheng, Y.F.; Liu, Z.R.; Yang, W.Z. A Model of Calcium Signaling and Degranulation Dynamics Induced by Laser Irradiation in Mast Cells. Chinese Sci. Bull. 2008, 53, 2315–2325. [Google Scholar] [CrossRef] [Green Version]
  94. Babbs, C.F.; Steiner, M.G. Simulation of Free Radical Reactions in Biology and Medicine: A New Two-Compartment Kinetic Model of Intracellular Lipid Peroxidation. Free Radic. Biol. Med. 1990, 8, 471–485. [Google Scholar] [CrossRef] [Green Version]
  95. Antunes, F.; Salvador, A.; Marinho, H.S.; Alves, R.; Pinto, R.E. Lipid Peroxidation in Mitochondrial Inner Membranes I. An Integrative Kinetic Model. Free Radic. Biol. Med. 1996, 21, 917–943. [Google Scholar] [CrossRef]
  96. Shi, Y.; Mellier, G.; Huang, S.; White, J.; Pervaiz, S.; Tucker-Kellogg, L. Computational Modelling of LY303511 and TRAIL-Induced Apoptosis Suggests Dynamic Regulation of CFLIP. Bioinformatics 2013, 29, 347–354. [Google Scholar] [CrossRef] [PubMed] [Green Version]
  97. Kavdia, M. Mathematical and Computational Models of Oxidative and Nitrosative Stress. Crit. Rev. Biomed. Eng. 2011, 39, 461–472. [Google Scholar] [CrossRef] [PubMed] [Green Version]
  98. Aydemir, T.; Kuru, K.; Aydem, T. Purification and Partial Characterization of Catalase from Chicken Erythrocytes and the Effect of Various Inhibitors on Enzyme Activity. Turkish J. Chem. 2003, 27, 85–98. [Google Scholar]
  99. Henle, E.S.; Luo, Y.; Linn, S. Fe2+, Fe3+, and Oxygen React with DNA-Derived Radicals Formed during Iron-Mediated Fenton Reactions†. Biochemistry 1996, 35, 12212–12219. [Google Scholar] [CrossRef] [PubMed]
  100. Xue, C.; Chou, C.S.; Kao, C.Y.; Sen, C.K.; Friedman, A. Propagation of Cutaneous Thermal Injury: A Mathematical Model. Wound Repair Regen. 2012, 20, 114–122. [Google Scholar] [CrossRef]
  101. Buettner, G.R.; Ng, C.F.; Wang, M.; Rodgers, V.G.J.; Schafer, F.Q. A New Paradigm: Manganese Superoxide Dismutase Influences the Production of H2O2 in Cells and Thereby Their Biological State. Free Radic. Biol. Med. 2006, 41, 1338–1350. [Google Scholar] [CrossRef] [Green Version]
  102. Edwards, A.; Cao, C.; Pallone, T.L. Cellular Mechanisms Underlying Nitric Oxide-Induced Vasodilation of Descending Vasa Recta. Am. J. Physiol. Physiol. 2011, 300, F441–F456. [Google Scholar] [CrossRef] [PubMed] [Green Version]
  103. Ozhogina, O.A.; Kasaikina, O.T. Β-Carotene As an Interceptor of Free Radicals. Free Radic. Biol. Med. 1995, 19, 575–581. [Google Scholar] [CrossRef]
  104. Haila, K. Effects of Carotenoids and Carotenoid- Tocopherol Interaction on Lipid Oxidation In Vitro; Semantic Scholar: Seattle, WA, USA, 1999; Volume 62, ISBN 9514586670. [Google Scholar]
  105. MacFarlane, N.G.; Miller, D.J. Depression of Peak Force without Altering Calcium Sensitivity by the Superoxide Anion in Chemically Skinned Cardiac Muscle of Rat. Circ. Res. 1992, 70, 1217–1224. [Google Scholar] [CrossRef] [Green Version]
  106. Koshkin, V.; Lotan, O.; Pick, E. Electron Transfer in the Superoxide-Generating NADPH Oxidase Complex Reconstituted in Vitro. Biochim. Biophys. Acta - Bioenerg. 1997, 1319, 139–146. [Google Scholar] [CrossRef]
Figure 1. PRISMA flow diagram. The systematic literature review process included identifying the relevant literature from PubMed, Medline, and Google Scholar. The literature was then filtered to remove duplicate studies. The eligibility of articles for the comprehensive review was determined using the inclusion criteria detailed in the Materials and Methods section.
Applsci 12 10013 g001
Figure 2. Mechanisms of action of joint pain affected by apigenin and hesperidin. Oval with black outline contains the bioactive molecules. Apigenin and hesperidin affect five biomarkers of joint pain—COX-2, PGE2, TRPV1, CGRP, and ROS—in both chondrocytes as well as endothelial cells. COX-2—Cyclooxygenase 2; PGH2—Prostaglandin H2; PGE2—Prostaglandin E2; IL-1β—Interleukin 1β; IL1R—Interleukin 1 beta receptor; TAK1—Transforming growth factor-β (TGF-β)-activated kinase 1; NFκB—Nuclear factor kappa-light-chain-enhancer of activated B cells; O2—oxygen; H2O2—hydrogen peroxide; NOX—NADPH oxidase; SOD—superoxide dismutase; PKA—protein kinase A; CREB—cAMP response element-binding protein; CGRP—calcitonin gene-related peptide.
Applsci 12 10013 g002
Figure 3. Individual (A,B) and combination effect (C) of apigenin and hesperidin on COX-2 production in chondrocytes over simulations periods of 2 days. Apigenin at 30 mg dose (A), hesperidin at 1000 mg dose, (B) and their combination at 1030 mg dose (C) reduced the levels of COX-2 over a period of 2 days. COX-2—cyclooxygenase 2.
Applsci 12 10013 g003
Figure 4. Individual (A,B) and combination effect (C) of apigenin and hesperidin on PGE2 production in chondrocytes over simulation periods of 2 days. Apigenin at 30 mg dose (A), hesperidin at 1000 mg dose (B), and their combination at 1030 mg dose (C) reduced the levels of PGE2 over a period of 2 days. PGE2—prostaglandine E2.
Applsci 12 10013 g004
Figure 5. Individual (A,B) and combination effect (C) of apigenin and hesperidin on TRPV1 production in chondrocytes over simulations periods of 2 days. Apigenin at 30 mg dose (A), hesperidin at 1000 mg dose, (B) and their combination at 1030 mg dose (C) reduced the levels of TRPV1 over a period of 2 days. Individual (panels D and E) and combination effect (panel F) of apigenin and hesperidin on CGRP production in chondrocytes over simulation periods of 2 days. Apigenin at 30 mg dose (D), hesperidin at 1000 mg dose, (E) and their combination at 1030 mg dose (F) reduced the levels of CGRP over a period of 2 days. TRPV1—transient receptor potential cation channel subfamily V member 1. CGRP—calcitonin gene-related peptide.
Applsci 12 10013 g005aApplsci 12 10013 g005b
Figure 6. Individual (A,B) and combination effect (C) of apigenin and hesperidin on ROS production in chondrocytes over simulations periods of 2 days. Apigenin at 30 mg dose, (A) hesperidin at 1000 mg dose, (B) and their combination at 1030 mg dose (C) reduced the levels of ROS over a period of 2 days.
Applsci 12 10013 g006
Table 1. COX-2 estimations for additive effects of apigenin and hesperidin.
In Silico ExperimentCOX-2 (nM)
Apigenin First, Hesperidin Second1.93
Hesperidin First, Apigenin Second1.54
Apigenin and Hesperidin Simultaneously0.28
Table 2. PGE-2 estimations for additive effects of apigenin and hesperidin.
In Silico ExperimentPGE2 (AUC)
Apigenin First, Hesperidin Second289
Hesperidin First, Apigenin Second217
Apigenin and Hesperidin Simultaneously286
Table 3. TRPV1 estimations for additive effects of apigenin and hesperidin.
In Silico ExperimentTRPV1 (nM)
Apigenin First, Hesperidin Second0.0027
Hesperidin First, Apigenin Second0.0325
Apigenin and Hesperidin Simultaneously0.00019
Table 4. Estimations for additive ranges of CGRP.
In Silico ExperimentCGRP (nM)
Apigenin First, Hesperidin Second1.17 × 10−6
Hesperidin First, Apigenin Second0.066
Apigenin and Hesperidin Simultaneously2.65 × 10−10
Table 5. Estimations for additive ranges of ROS.
In Silico ExperimentROS (nM)
Apigenin First, Hesperidin Second1.34
Hesperidin First, Apigenin Second12.69
Apigenin and Hesperidin Simultaneously1.117
Table 6. Summary of effects of apigenin and hesperidin on mechanisms of joint pain.
Joint Pain Mechanisms of ActionApigeninHesperidin
COX-2 ProductionInhibits IKK activationInhibits NF-kB
Arachidonic Acid MetabolismInhibits COX-2Inhibits COX-2
PGE2 SignalingInhibits PKC activationInhibits PLC activation
Oxidative Stress PathwayROS ProductionROS Production
Publisher’s Note: MDPI stays neutral with regard to jurisdictional claims in published maps and institutional affiliations.

