Article

Earthquake Risk Probability Evaluation for Najin Lhasa in Southern Tibet

1
State Key Laboratory of the Tibetan Plateau Earth System, Resources and Environment (TPESRE), Institute of Tibetan Plateau Research, Chinese Academy of Sciences, Beijing 100101, China
2
Seismological Bureau of the Tibet Autonomous Region, Lhasa 850004, China
3
University of the Chinese Academy of Sciences, Beijing 100049, China
4
Geophysics Department, School of Earth Sciences, Yunnan University, Kunming 650091, China
*
Authors to whom correspondence should be addressed.
Appl. Sci. 2022, 12(18), 9394; https://doi.org/10.3390/app12189394
Submission received: 18 August 2022 / Revised: 8 September 2022 / Accepted: 16 September 2022 / Published: 19 September 2022
(This article belongs to the Section Earth Sciences)

Abstract

:

Featured Application

Resource and environmental effects of the Tibetan Plateau.

Abstract

The probabilistic seismic hazard analysis (PSHA) method is effectively used in an earthquake risk probability evaluation in seismogenic regions with active faults. In this study, by focusing on the potential seismic source area in Najin Lhasa, southern Tibet, and by incorporating the PSHA method, we determined the seismic activity parameters and discussed the relationship of ground motion attenuation, the seismic hazard probability, and the horizontal bedrock ground motion acceleration peak value under different transcendence probabilities in this area. The calculation results show that the PSHA method divides the potential source area via specific tectonic scales and detailed tectonic markers, which reduces the scale of the potential source area and better reflects the uneven spatial distribution of seismic activity in the vicinity of Najin. The corrected attenuation relationship is also in line with the actual work requirements and is suitable for earthquake risk analysis. In addition, the major influences on the peak acceleration of ground motion in the study area are mainly in the potential source areas of Qushui (M7.5), Dangxiong (M8.5), and Kangma (M7.5). The peak horizontal ground motion acceleration (PGA) with a transcendence probability of 10% in 50 years is 185.9 cm/s2, and that with a transcendence probability of 2% in 50 years is 265.9 cm/s2.

1. Introduction

Najin Lhasa (91.219° E, 29.659° N) is located in the Lhasa city vicinity, southern Tibet, and at the intersection of the central Tibet seismic belt and the Himalayan seismic belt, which has strong seismic activity (Figure 1). The site and adjacent approximately 150 km are used as the study area (89.55°~92.85° E, 28.20°~31.13° N). Associated with strong neotectonic movement, various faults in this region have been well developed. The major faults are oriented nearly E‒W and N‒S, followed by NNE‒NE and NW faults with obvious differences in tectonic properties (e.g., [1,2]). The E‒W-trending faults feature large-scale thrust and reverse strike-slip motions; however, the approximately N‒S-, NNE‒NE- and NW-trending faults are generally smaller in scale, are often concentrated, and constitute a shear-extensional fault tectonic belt. Early in the lower Quaternary period, the faults were active and have witnessed the occurrence of numerous M > 7 earthquakes (e.g., [3,4,5]). The focus of this study is, thus, to investigate the regional earthquake risk probability at Najin Lhasa, Tibet (Figure 1).
The central Tibet earthquake statistical area is distributed in the northern Tibetan Plateau to the north of the Yarlung–Zangbo suture zone and is dominated by a series of near-E‒W-trending compressive fault zones [6,7]. The southern part of the Tibetan Plateau is closer to the collision boundary between the India plate and the Eurasian plate, which has strong tectonic activity (e.g., [8,9]). Relevant studies have shown that the seismic activity period in this area is approximately 50 years (e.g., [10]). Except for a few moderate-depth earthquakes in this area, most earthquakes are shallow. As of December 2014, a total of two earthquakes of magnitudes 8.0 to 8.9 had been recorded, i.e., the Dangxiong (1411-10-08) and Dangxiong north (1951-11-18) M8 earthquakes, as well as five earthquakes of magnitudes 7.0 to 7.9, which feature strong seismic activity in this region (e.g., [6,11,12]).
The Himalayan earthquake statistical area includes the region between the Yarlung–Zangbo suture zone and the Himalayas, which are part of the Himalayan tectonic fold belt (e.g., [13]). Modern tectonic movement is manifested as compressional movement on the central Himalayan thrust fault, the main boundary thrust fault zone, and the compressional and strike-slip fault activity at the Yarlung–Zangbo plate suture zone (e.g., [14,15]). This area has the highest frequency of earthquake occurrence in China and adjacent countries, and there occurred moderate-depth earthquakes in the western and eastern ends of the area (e.g., [14]). Because most of this area is located close to the country borders, the earthquake records remained are incomplete (e.g., [16]). According to the available data, as of December 2014, a total of three M8 class earthquakes and twenty-one M7 class earthquakes have been recorded including the Nyalam M8 (1833-08-26), Nepal–India border M8.1 (1934-01-15) and Chayu M8.6 (1950-08-15) earthquakes (e.g., [11,17]). Hence, it is necessary to incorporate the data from both two seismogenic areas when evaluating the earthquake risk probability at Najin Lhasa. In this study, we focus to establish a fragility curve that can correctly represent the relation between the earthquake risk probability and the peak horizontal ground motion acceleration to avoid the crippling economic and social consequences caused by earthquakes (e.g., [18,19,20]).

2. Methods

We adopted the probabilistic seismic hazard analysis (PSHA model improved by the Chinese State Seismological Bureau [21]) method to evaluate the earthquake risk in this study area, which is mainly characterized by the spatial and temporal inhomogeneity of the seismic activity distribution (e.g., [22,23,24,25]). The method and processes are as follows.
First, the earthquake statistical unit (seismic zone) is determined. The seismic activity inside the seismic zone is inhomogeneous in both space and time, and the time course of the earthquake in the seismic zone follows a piecewise Poisson process. Suppose that the upper limit magnitude of the seismic statistical zone is m u z (Table 1); the lower limit of the magnitude is m 0 ; the time is t (year) and the average annual frequency of earthquakes with a magnitude of m 0 ~ m u z in t years is ν 0 , which is determined by the future trend of seismic activity. Then, the probability of n earthquakes occurring in the seismic zone within t years is:
P ( n ) = ( ν 0 t ) n n ! e x p [ ν 0 t ]
At the same time, the earthquake magnitude distribution satisfies the Gutenberg–Richter (G–R) relationship: L o g   N ( m ) = a b m [26]. The a value indicates the overall rate of earthquakes in a region, and the   b value indicates the relative ratio of small to large magnitudes [27,28]. The PSHA seismicity model divides the magnitude domain into N magnitude intervals, and the corresponding magnitude probability density function is (e.g., [29,30]):
f ( m ) = β   e x p [ β ( m m 0 ) ] 1 e x p [ β ( m u z m 0 ) ]
where β = b l n 10 , b is the parameter in the G–R relationship, and the value of b in this study can be found in Table 2. In practical work, the magnitude m is divided into Nm bins, and mj represents the magnitude bins whose magnitude range is ( m j ± 1 2 Δ m ). Then, the probability of occurrence of mj level earthquakes in the seismic zone is:
P ( m j ) = 2 β f ( m j ) S h   ( 1 2 β Δ m )
where s h denotes a sine hyperbolic function.
Next, the potential source area is divided into the seismic zone, and the spatial distribution function of the potential source area is f i , m j , which is used to reveal the spatial inhomogeneity of earthquakes of each magnitude in each potential source area. The seismic spatial distribution function of potential source areas f i , m j is a magnitude-related constant whose physical meaning is the probability that an earthquake with a magnitude of mi ± 1 2 Δm plots will occur within the ith potential source area. As the conditional probability of the magnitude, it can reflect the inhomogeneity of the spatial distribution of earthquake intensity in the seismic zone, and it is normalized for the specified magnitude f i , m j in the entire seismic zone, namely:
i = 1 N S f i , m i = 1
In the formula, NS is the total number of potential source areas in the seismic zone; f i , m j can be determined by comprehensive assessment by statistical methods. Δm is the step size of the magnitude bins, and mi is defined as the central magnitude of the jth bin in several bins from the starting magnitude m0 to the magnitude upper limit m u z of the potential source area.
The seismicity within the potential source region is consistent. It is assumed that there is a total of N s potential hypocenter areas { S 1 , S 2 , S N s } in the seismic zone. According to the piecewise Poisson distribution model and the full probability formula, the annual transcendence probability of the earthquake occurring inside the seismic zone affecting the ground motion parameter value A at the site exceeding the given value a is:
P k ( A a ) = 1 e x p { 2 ν 0 β j = 1 N m i = 1 N s P ( A a | E ) f ( θ ) f i , m j A ( S i ) f ( m j ) S h ( 1 2 β Δ m ) d x d y d θ }
A ( S i ) is the area of the ith potential source area within the seismic zone, and P ( A a | E ) is the ground motion at the site larger than a when a specific seismic event occurs in the ith potential source zone within the seismic zone, with the epicenter of (x, y), a magnitude of m j ± 1 2 Δ m , and the rupture direction is determined. f ( θ ) is the probability density function of the rupture direction.
Assume that there are Nz seismic zones that contribute to the seismic risk of the site. If the kth seismic zone has a contributing probability of Pk (A > a) for the seismic motion at the site, then the total seismic motion annual transcendence probability of the site can be expressed as:
P ( A a ) = 1 k = 1 N z ( 1 P k ( A a ) )

3. Data Processing Results

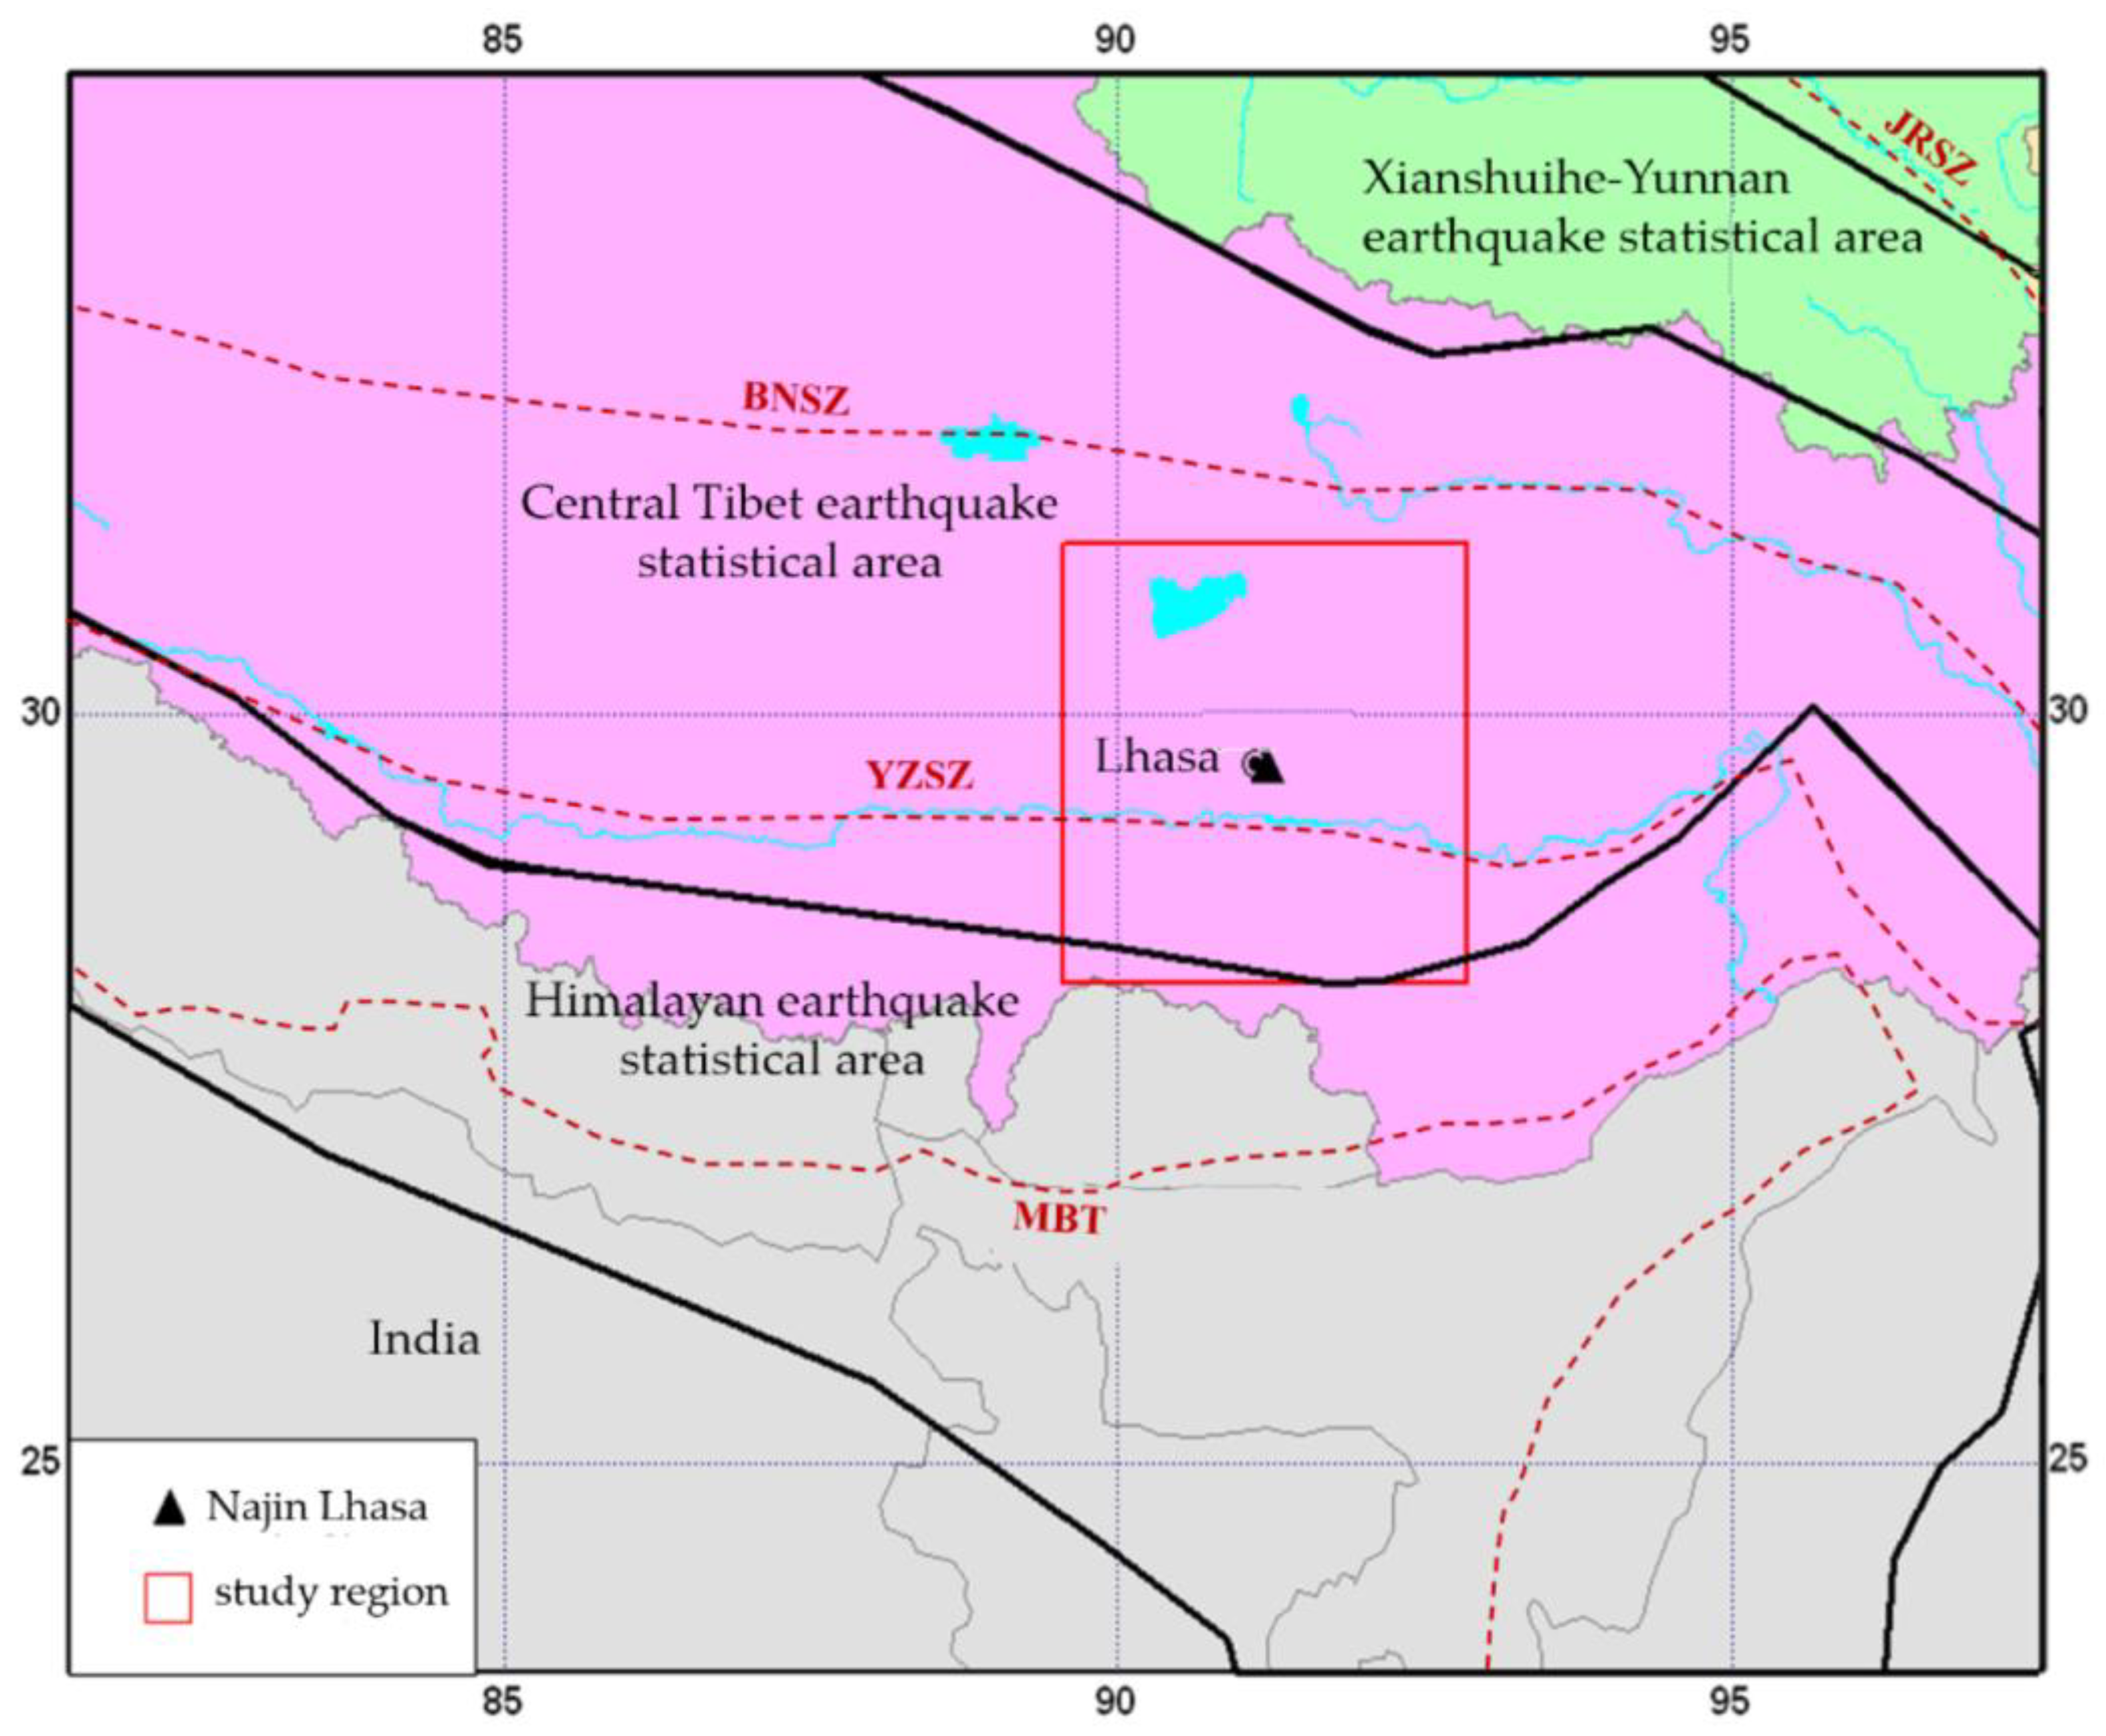
3.1. Division of Potential Source Areas

The division of potential seismogenic (source) areas follows the principle of seismotectonic analogy and the principle of repetition of seismic activity [24,31,32,33]. According to the tectonic conditions and the parameters of the 18 potential hypocenter areas that are shown in Table 1 (e.g., [24,30]), we divided the study area into 18 potential source areas, as shown in Figure 2. The division basis and description of several key potential source areas that have a greater impact on the site are as follows.
In the Qushui M7.5 potential source area (No. 13, Figure 2), a series of large-scale near-E‒W-trending fault zones have developed in the Himalayan vicinity and south of the Yarlung–Zangpo River which control the tectonic evolution and seismic activity in the region. Some fault zones have obvious Holocene activities. This area facilitates the occurrence of strong earthquakes; thus, it is divided into a potential source area of magnitude 7.5.
In the Dangxiong M8.5 potential source area (No. 7, Figure 2), the seismogenic structure is the fault at the southeastern foot of the Nyainqentanglha Mountains, which are located in the middle–north section of the Yadong–Gulu fault, an active Holocene fault that is still active at present and developed on the Dangxiong–Yangbajing basement. An M = 8 earthquake occurred in 1411, and the fault has the possibility of generating an M7.5~8.0 earthquake at present, hence, the upper limit of the magnitude is limited to 8.5.
The Kangma M7.5 potential source area (No. 8, Figure 2) dips eastward and spreads along the middle section of the Yadong–Gulu fault zone, an active Holocene fault, which developed at the southern section of the Dangxiong–Yangbajing Basin. Six M ≥ 6 earthquakes have occurred, and the largest historical one was an earthquake occurred in 1901. The potential epicenter is also located at the intersection of the Yadong–Gulu fault zone and the fault along the Luzangbo River. According to the principle of tectonic analogy, the upper magnitude limit is 7.5, while the boundaries of potential hypocenters were determined based on the geological structure and distribution of earthquakes.

3.2. Determination of Earthquake Parameters

3.2.1. Earthquake Parameters of the Statistical Area

The activity parameters of the earthquake statistical area mainly include the upper limit of the magnitude, m u z ; the starting magnitude; the background earthquake; the b value; the annual average occurrence rate; and the average annual occurrence rate of the background earthquake, RM ≥ 4 [34]. Table 2 lists the earthquake parameters of the Central Tibet and Himalayan Earthquake Statistical Area, in which the starting magnitude M0 is prescribed to be M = 4.0. The upper limit of the magnitude of the background earthquake is smaller by 0.5 than that of the delineated potential source area. The b value in the magnitude–cumulative frequency relationship represents the proportion between the frequencies of earthquakes of different sizes in a region. Hence, b specifies the density distribution function of earthquakes of various magnitudes within the earthquake statistical area [35]. The annual average occurrence rate RM ≥ 4 of M ≥ 4 earthquakes has a great influence on the calculation results of earthquake risk analysis, and the main factor affecting RM ≥ 4 is b. The b value is selected from the statistical period of the data, and the statistical period is required to represent the seismicity level within a century (Table 2).

3.2.2. Earthquake Parameters in the Potential Source Area

The magnitudes were divided into 6 grades: 4.0~5.4, 5.5~5.9, 6.0~6.4, 6.5~6.9, 7.0~7.4, and above 7.5. When determining the spatial distribution function of the potential source area, the following principles are mainly considered: (1) medium- and long-term earthquake prediction results; (2) the sufficiency of the tectonic conditions where the potential source area is located; (3) the large earthquakes provided by the small earthquake seismic activity risk background; and (4) the randomness of earthquakes, that is, the area factor of each potential source area. According to the division results of potential epicenters and the above-mentioned principles, we obtained the spatial distribution functions of each potential epicenter (Table 3).

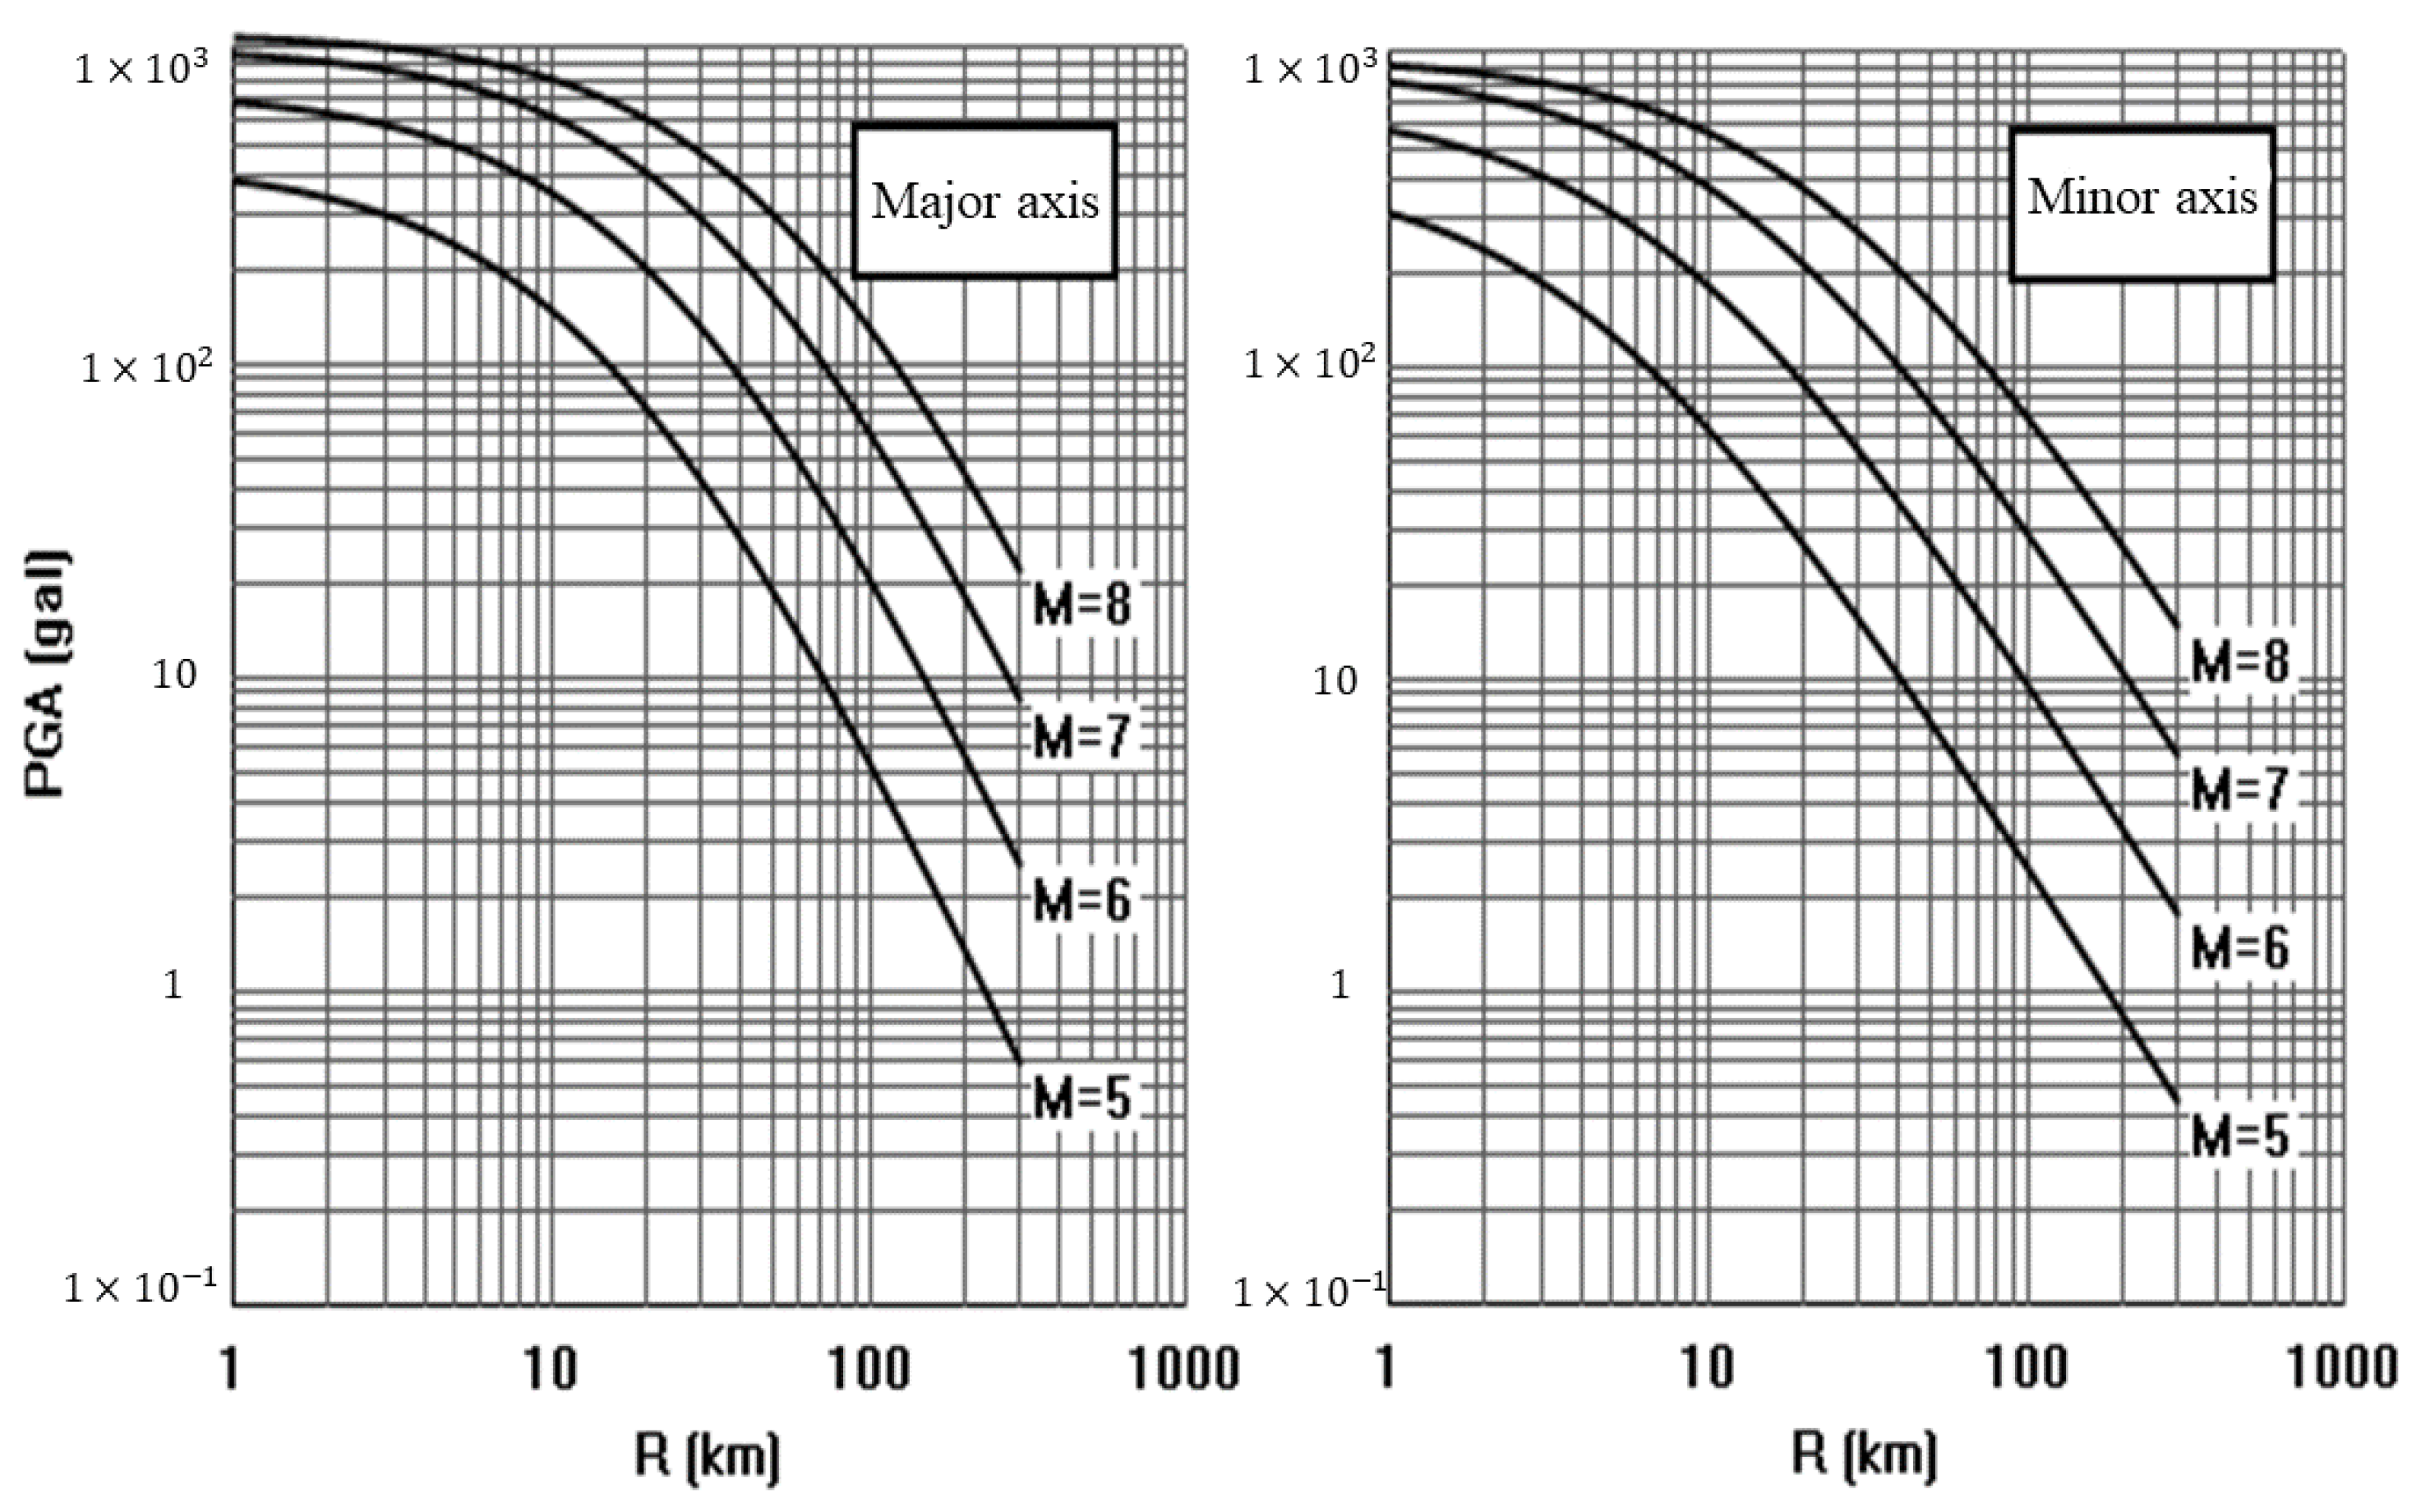
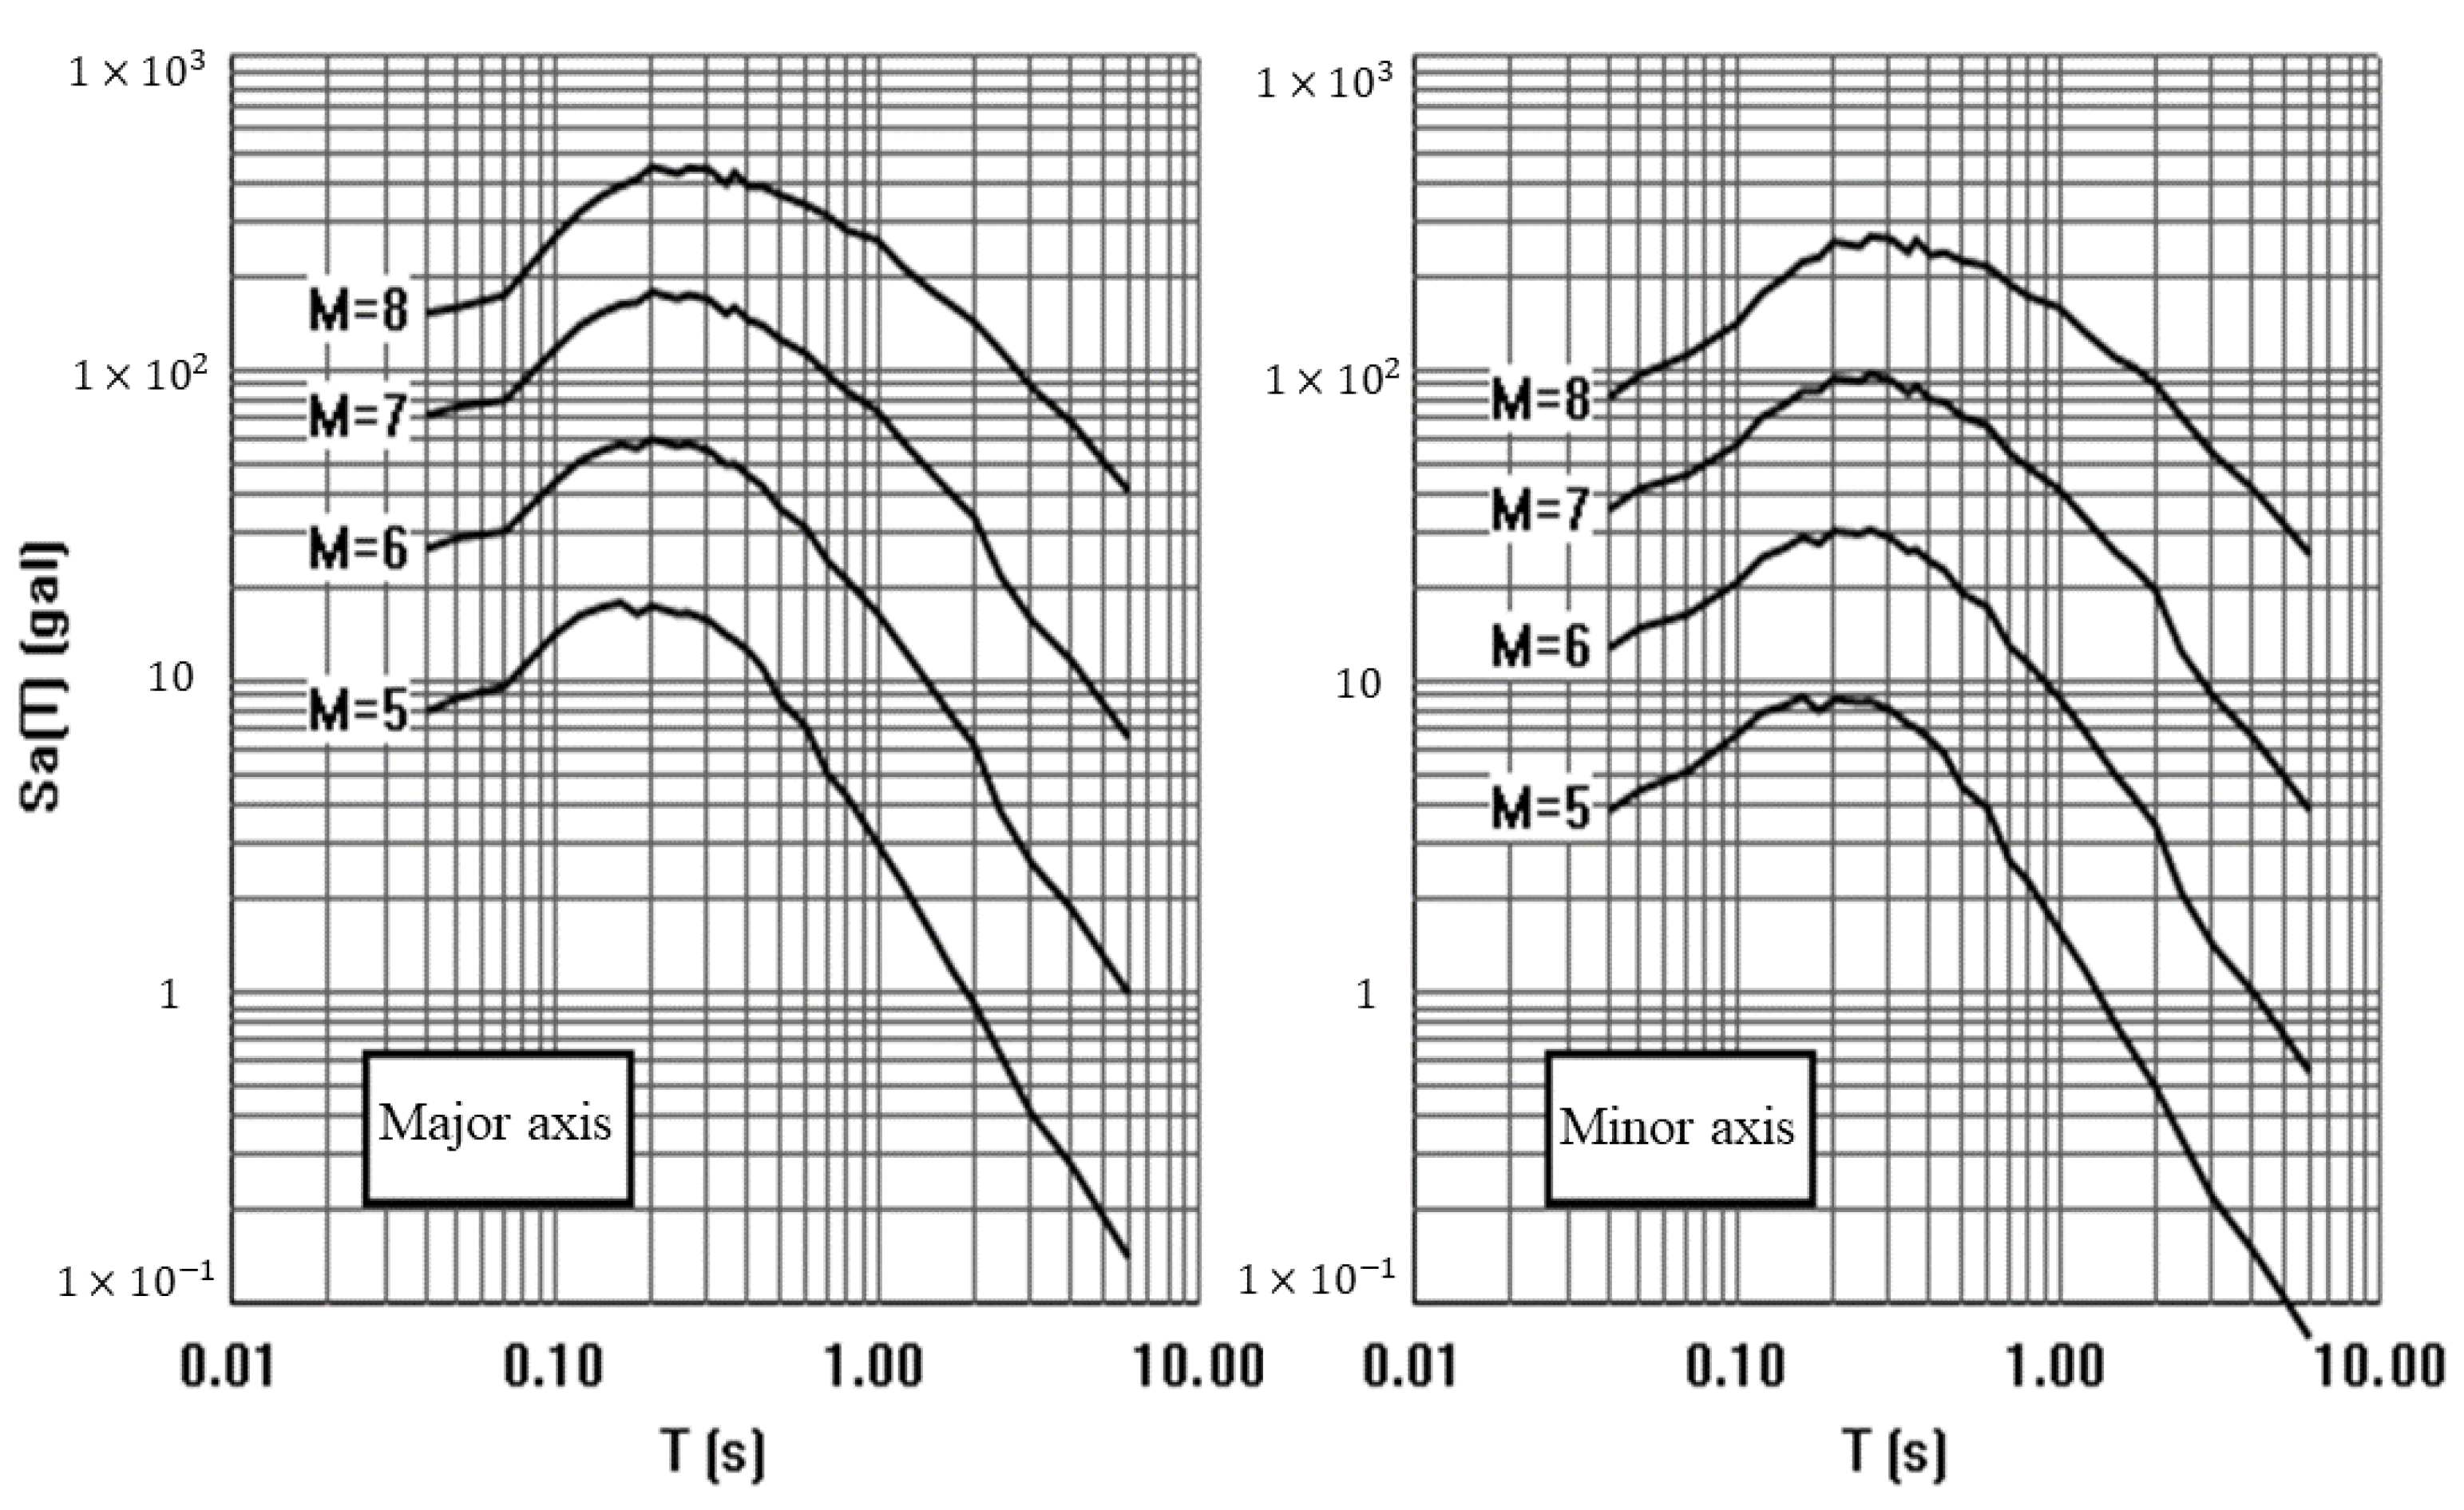
3.3. Ground Motion Attenuation

The ground motion attenuation relationship includes the site bedrock horizontal peak acceleration attenuation relationship and acceleration response spectrum attenuation relationship. In most areas of China, the conversion method obtained by Hu et al. [36] is generally used. Using the intensity attenuation relationship in the working area and the intensity, peak acceleration, and response spectrum attenuation relationship in the reference area, the peak bedrock peak value in the working area is converted. The relationship between acceleration and the acceleration response spectrum attenuation is analyzed [37].
Several sets of ground motion attenuation relationships with slight differences have been obtained in the western region of China. After comparative analysis, this work selects the ground motion attenuation relationship in the northeastern Tibetan Plateau given by Yu et al. [37]:
l o g Y = c 1 + c 2 M + c 4 l o g [ R + c 5 e x p ( c 6 M ) ]
In the formula, Y is the ground motion parameter, M is the magnitude, R is the distance, and c is the regression coefficient, listed in Table 4 and Table 5, of which the first row is the peak acceleration attenuation relational coefficient.

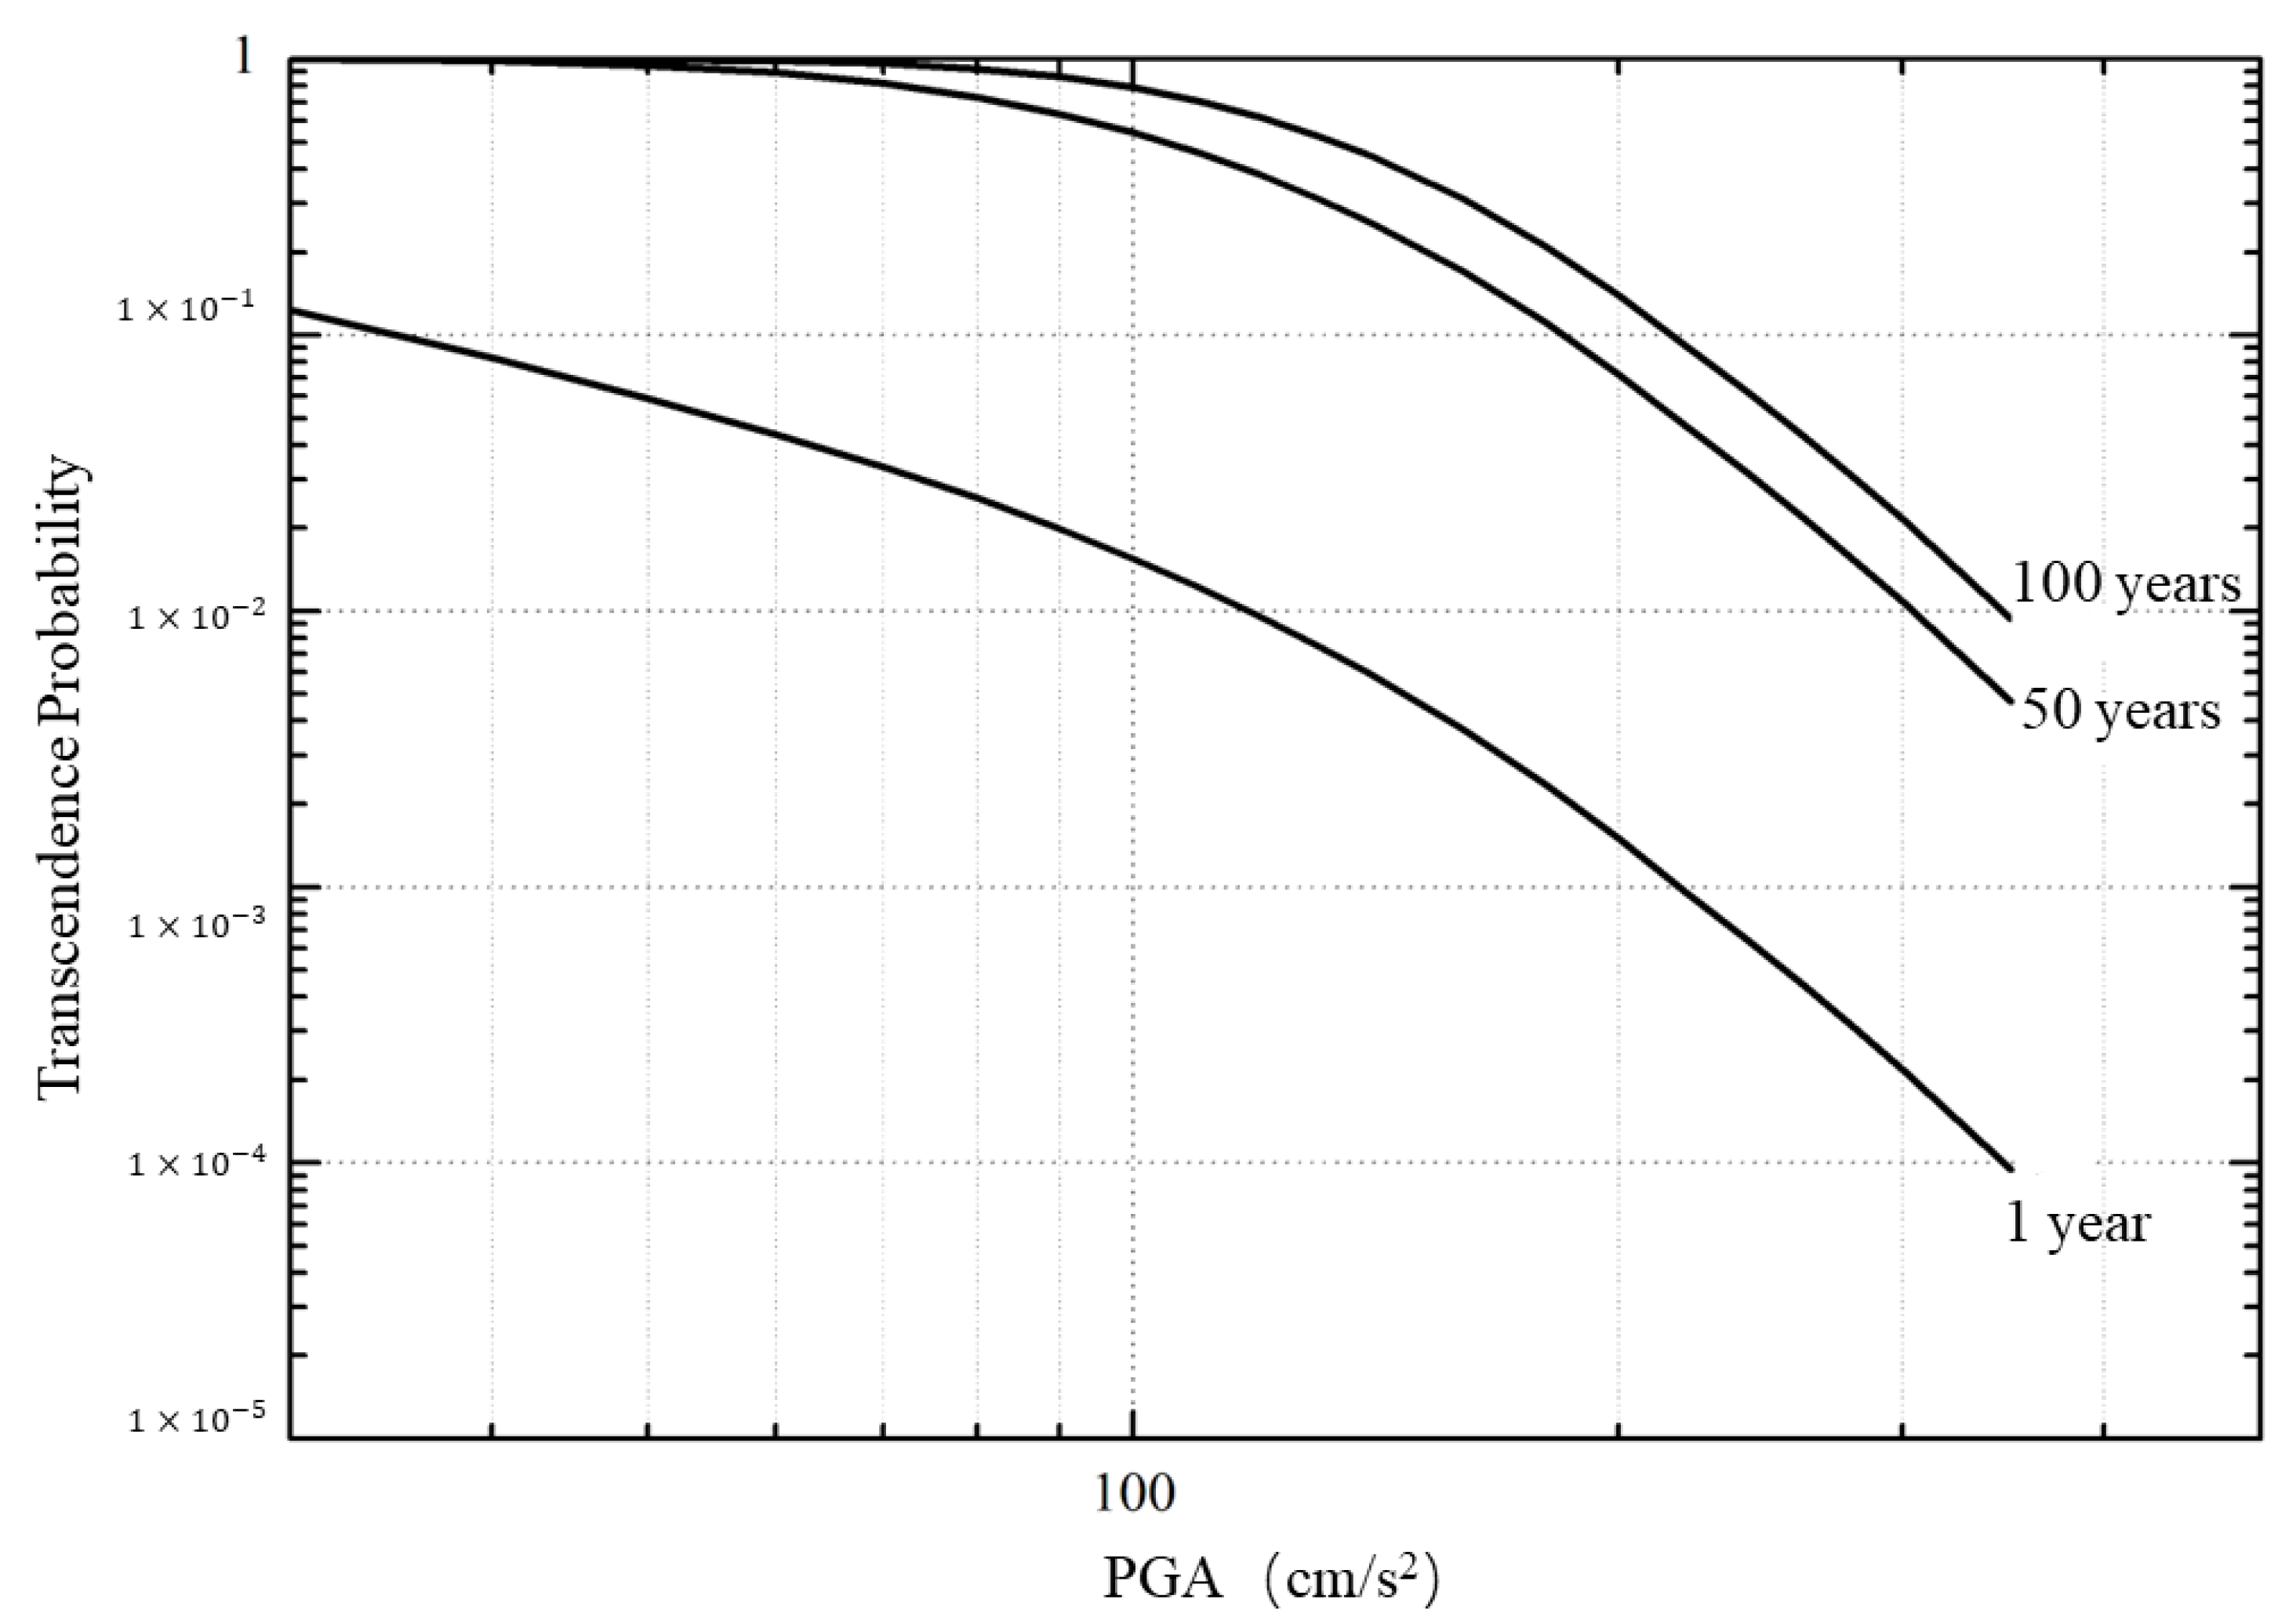
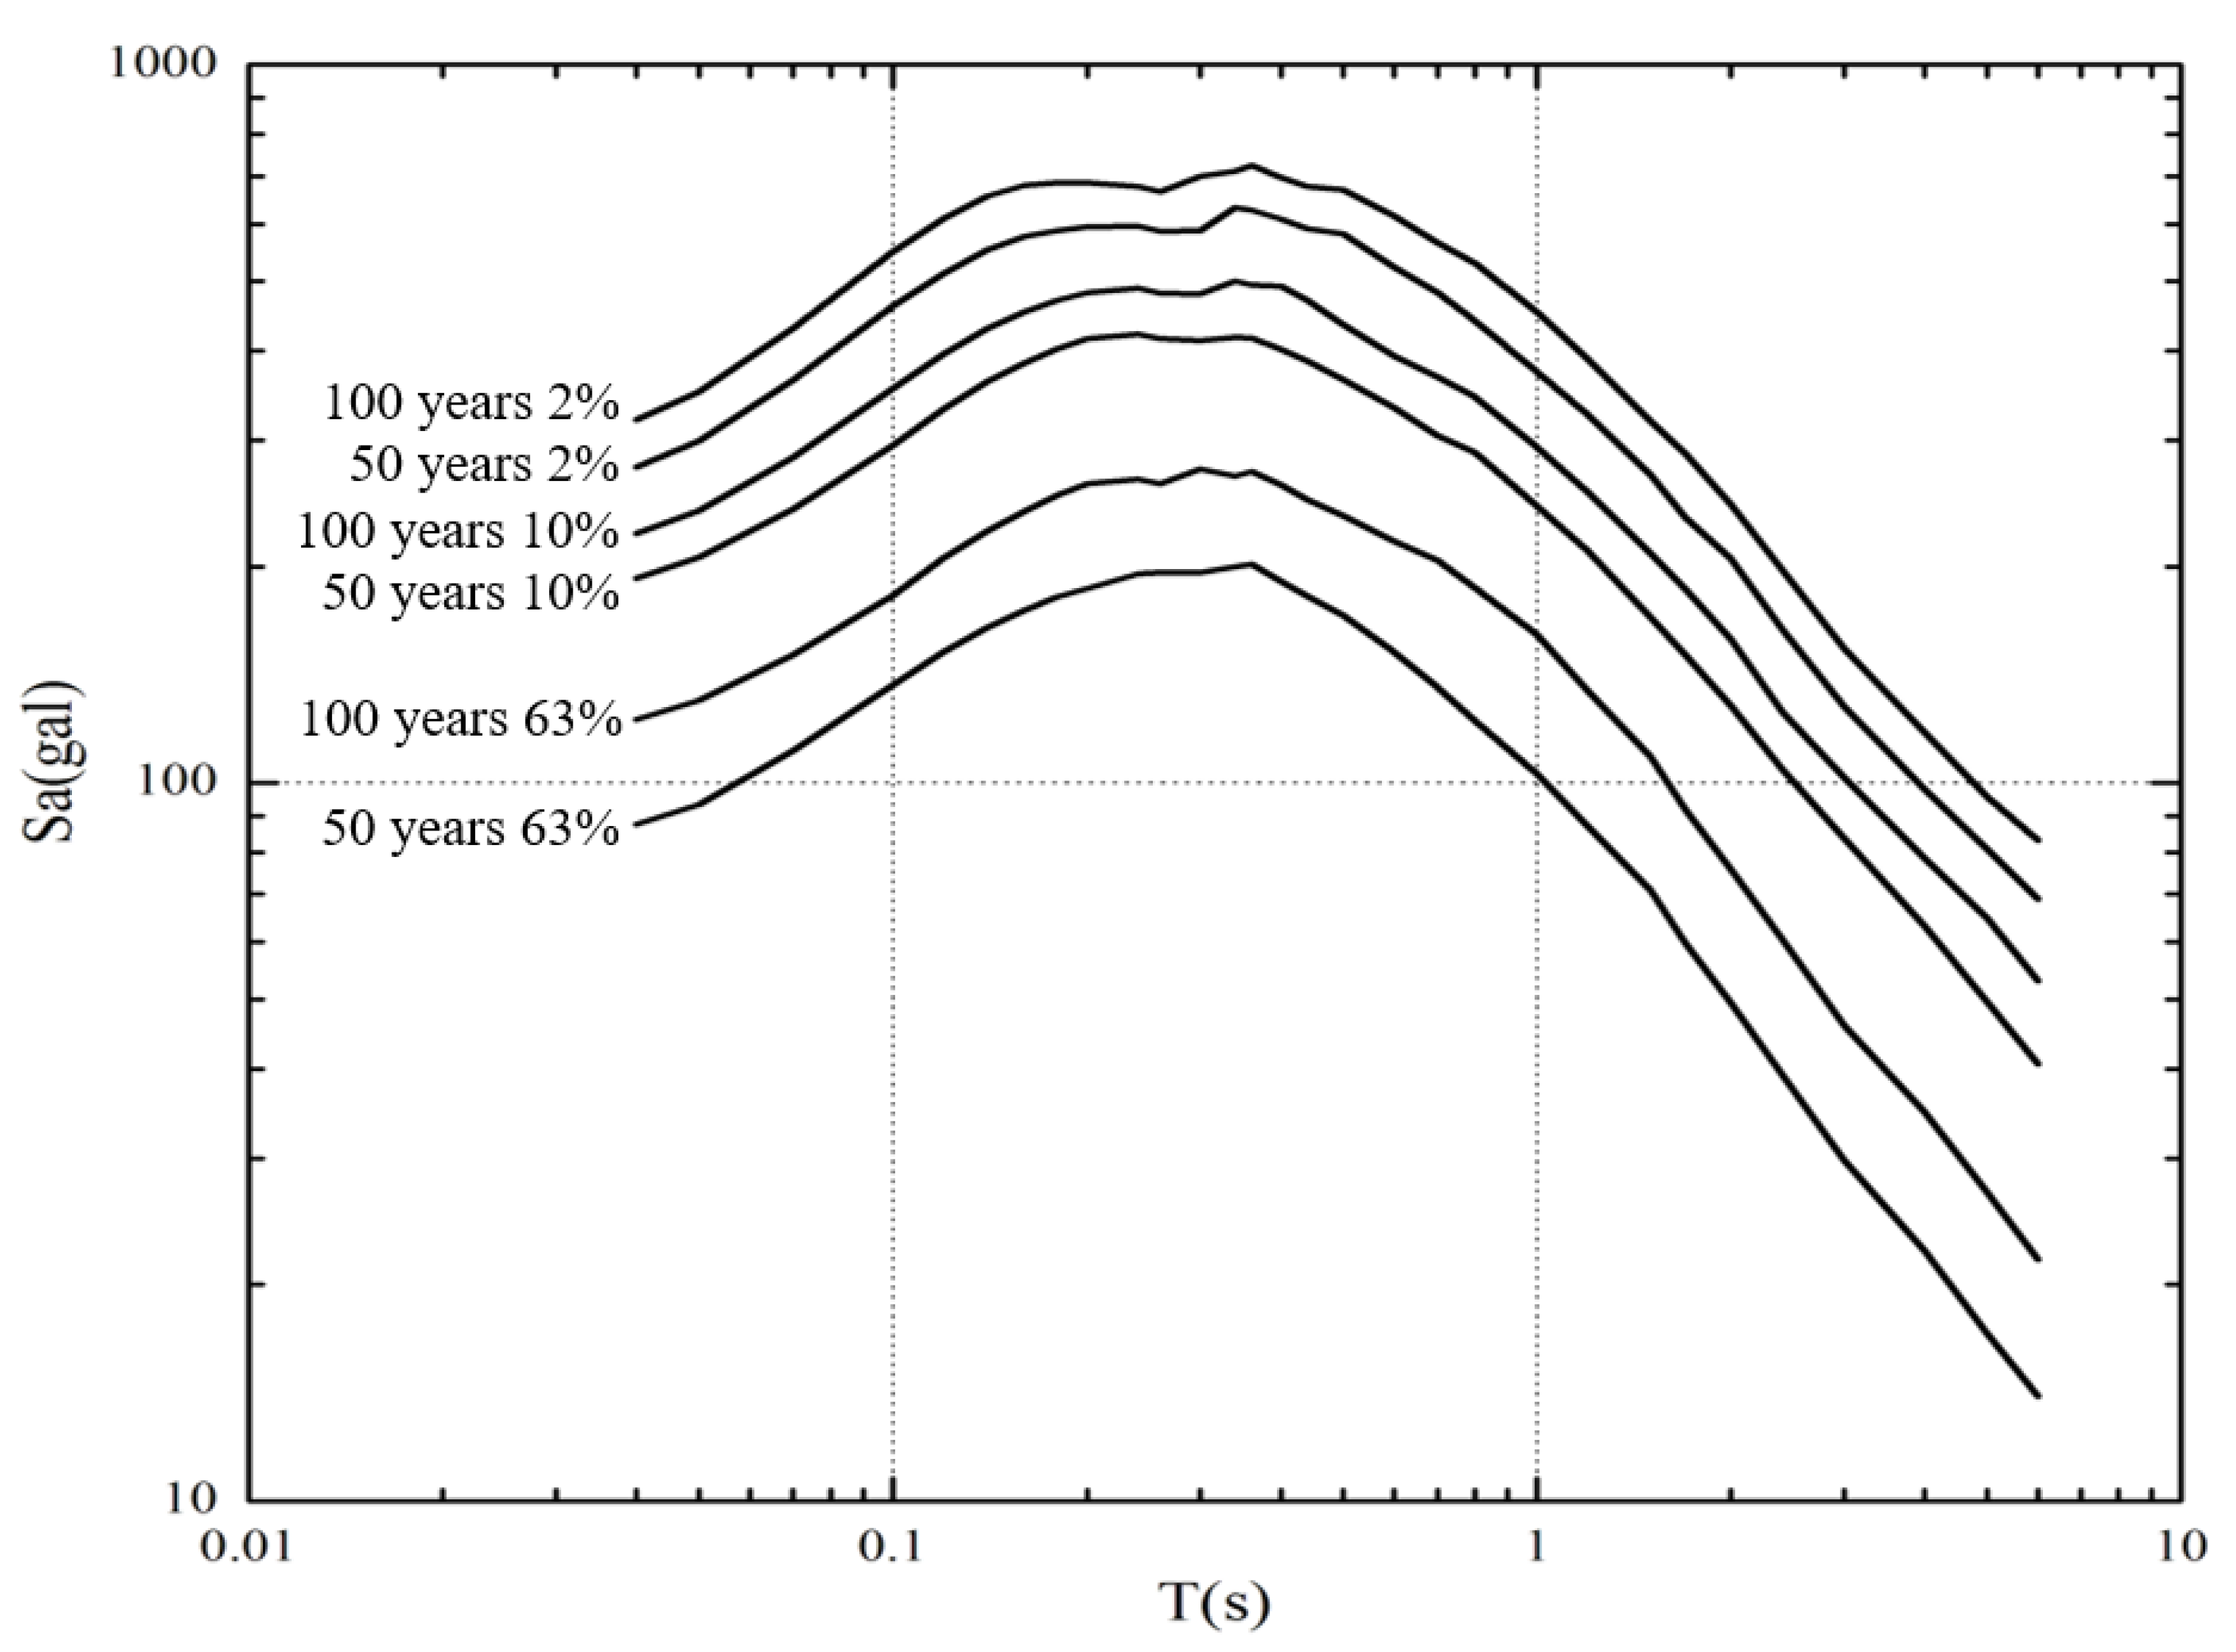
3.4. Probabilistic Analysis of Earthquake Risk

Using the comprehensive probability analysis method of earthquake risk and the uncertainty correction of the ground motion attenuation relationship, we obtained the bedrock earthquakes of the engineering site under different transcendence probabilities (63%, 10%, and 2%) of 50 years and 100 years of peak dynamic acceleration (Table 6, unit cm/s 2) and response spectrum values of the bedrock ground motion acceleration with a damping ratio of 5% under the same conditions (Table 7, unit cm/s2) and drew corresponding curves (Figure 3 and Figure 4). Peak ground motion acceleration with transcendence probabilities of 10% and 2% are occasional and rare earthquakes, respectively [38,39,40,41]. The calculation indicates that the peak horizontal ground motion acceleration of the engineering site with a transcendence probability of 10% in 50 years is 185.9 cm/s2 (Table 6).

4. Discussion

4.1. Uncertainty Correction of the Ground Motion Attenuation Relationship

The PSHA method is a method that fully considers the temporal and spatial heterogeneity of seismic activity, including the contributions of all potential hypocenter regions and the average activity rate associated with the seismic zone (e.g., [42,43]). In the process of developing the probabilistic seismic hazard analysis methods in recent years, engineering geological studies have proposed uncertainty corrections for the ground motion attenuation relationship (e.g., [44,45,46,47]). Since the ground motion attenuation relationship has a certain discreteness, the attenuation formula applied in the calculation process gives only the expected value of ground motion. Caccavale et al. [48] suggested that if the seismic input comes from a probabilistic seismic scenario, the nonlinear response of the PGA to the site effect and topographic effect should be considered. Therefore, to make the results safer and more reliable, we made an uncertainty correction for the decay relationship using the following equation:
P ( A > a ) = 1 2 π σ i 3 σ l n A 3 l n A P ( A > a e x ) e x p [ 1 2 ( X σ l n A ) 2 ] d x
where P(A > a) is the corrected transcendence probability, P(I > Ix) and P(A > aex) are the uncorrected transcendence probabilities, x is a random variable, and σ is the standard deviation of the decay relation.
In addition, because the earthquake isoseismal is elliptical, in addition to the earthquake magnitude and distance, the isoseismic long-axis orientation plays a certain role in the seismic hazard risk evaluation of the site especially in the near field. The orientation of the long axis of the isoseismal line is represented by the directional function f(θ), which is related to the tectonic trend of the corresponding potential source area, and its expression is:
f ( θ ) = P 1 δ ( θ 1 ) + P 2 δ ( θ 2 )
In the formula, θ1 and θ2 are the possible main rupture surface strikes in the potential source region, and P1 and P2 are the corresponding orientation probabilities.

4.2. Analysis of the Applicability of the Attenuation Relationship

In this study, the PSHA method and the attenuation relationships in Table 4 and Table 5 have been applied in the seismic hazard assessment of several engineering projects in China (e.g., [49,50,51,52]). The actual calculation results showed that it is suitable for the area near Najin Lhasa, Tibet. According to the obtained planning data, the maximum period of the decay relationship used in this work is 6 s, which meets the actual work requirements. As shown in Figure 5, setting M = 5–8 and the damping ratio to 5%, we have concluded the attenuation relationship between the long and short axes of the peak acceleration of the horizontal bedrock in the region. Figure 6 and Figure 7 show that at epicentral distances R = 50 km and 100 km, the attenuation relationship curve of the response spectrum of the horizontal bedrock acceleration differs. The response spectrum of different magnitudes gradually decreases with increasing distance; when the distance is the same, the response spectrum increases with increasing magnitude (Figure 5, Figure 6 and Figure 7).

5. Conclusions

This study used the probabilistic seismic hazard analysis method in Najin Lhasa and obtained the following conclusions:
(1) The PSHA method divides the potential source area via specific tectonic scales, which better reflects the inhomogeneity of the spatial distribution of seismic activity.
(2) The major influences on the peak acceleration of ground motion are the potential of M > 7.5 earthquakes occurring in the vicinity of the site.
(3) The peak horizontal bedrock ground motion acceleration for Najin Lhasa with a transcendence probability of 10% is 185.9 cm/s2, and the PGA with a transcendence probability of 2% is 265.9 cm/s2. The horizontal bedrock acceleration response spectrum attenuation decreases gradually with distance.

Author Contributions

J.Z. performed the observation analysis and interpreted the results. Y.Z. and Y.J. elaborated on the study and wrote the manuscript. W.Z., R.Q., Z.G. and C.X. provided comments to improve the manuscript. All authors examined the results and interpretations and participated in manuscript writing. All authors have read and agreed to the published version of the manuscript.

Funding

This study benefited from financial support provided by the Second Tibetan Plateau Scientific Expedition and Research Program (2019QZKK0708), the Chinese Academy of Sciences (CAS) Pioneer Hundred Talents Program, and the Najin water plant seismic risk evaluation project.

Institutional Review Board Statement

Not applicable.

Informed Consent Statement

Not applicable.

Data Availability Statement

Data are available in Figures and Tables or from the authors upon reasonable request.

Acknowledgments

We are thankful to Song Yu and Gang Yang from Key Laboratory of Earthquake Geodesy, Institute of Seismology, China Earthquake Administration for their work contributed to this study. We are grateful to China Earthquake Administration for sharing the data used in this study.

Conflicts of Interest

All the authors listed certify that they have no involvement in any organization or entity with any financial interests (including honoraria; educational grants; participation in speakers’ membership, bureaus, consultancies, stock ownership, employment, or other equity interest; and patent-licensing arrangements or expert testimony) or nonfinancial interests (including professional or personal relationships, knowledge or beliefs, and affiliations) in the subject materials or matter discussed.

References

  1. Royden, L.H.; Burchfiel, B.C.; van der Hilst, R.D. The geological evolution of the Tibetan Plateau. Science 2008, 321, 1054–1058. [Google Scholar] [CrossRef]
  2. Volkmer, J.E.; Kapp, P.; Guynn, J.H.; Lai, Q. Cretaceous-Tertiary structural evolution of the north central Lhasa terrane, Tibet. Tectonics 2007, 26, TC6007. [Google Scholar] [CrossRef]
  3. Zeng, R.; Ding, Z.; Wu, Q. A review on the lithospheric structures in the Tibetan Plateau and constraints for dynamics. Pure Appl. Geophys. 1995, 145, 425–443. [Google Scholar] [CrossRef]
  4. England, P.; Molnar, P. Right-lateral shear and rotation as the explanation for strike-slip faulting in eastern Tibet. Nature 1990, 344, 140–142. [Google Scholar] [CrossRef]
  5. Duvall, A.R.; Clark, M.K. Dissipation of fast strike-slip faulting within and beyond northeastern Tibet. Geology 2010, 38, 223–226. [Google Scholar] [CrossRef]
  6. Yang, G.; Tang, Y.; Lei, D.; Hu, Q.; Wu, J. Holocene activity and seismic hazard analysis of faults in Damxung, Tibet. Acta Geophys. 2020, 68, 597–604. [Google Scholar] [CrossRef]
  7. Dong, P.; Shi, Y.; Cheng, H.; Qiao, X. Numerical analysis of the future seismic hazards in the Tibetan Plateau and its surrounding area. Chin. J. Geophys. 2020, 63, 1155–1169. [Google Scholar]
  8. Armijo, R.; Tapponnier, P.; Han, T. Late Cenozoic right-lateral strike-slip faulting in southern Tibet. J. Geophys. Res. Solid Earth 1989, 94, 2787–2838. [Google Scholar] [CrossRef]
  9. Pan, G.; Wang, L.; Li, R.; Yuan, S.; Ji, W.; Yin, F.; Zhang, W.; Wang, B. Tectonic evolution of the Tibetan Plateau. J. Asian Earth Sci. 2012, 53, 3–14. [Google Scholar] [CrossRef]
  10. Ram, T.; Wang, G. Probabilistic seismic hazard analysis in Nepal. Earthquake Engineering and Engineering Vibration 2013, 12, 577–586. [Google Scholar] [CrossRef]
  11. Department of Disaster Prevention; China Earthquake Administration. China Modern Earthquake Catalog (1912–1990, M ≥ 4.7); China Science and Technology Press: Beijing, China, 1999. (In Chinese)
  12. Liu, Y.; Zhao, G.; Wu, Z.; Jiang, Y. An analysis of b-value characteristics of earthquake on the southeastern margin of the Tibetan Plateau and its neighboring areas. Geol. Bull. China 2015, 34, 58–70. [Google Scholar]
  13. DeCelles, P.G.; Robinson, D.M.; Quade, J.; Ojha, T.P.; Garzione, C.N.; Copeland, P.; Upreti, B.N. Stratigraphy, structure, and tectonic evolution of the Himalayan fold-thrust belt in western Nepal. Tectonics 2001, 20, 487–509. [Google Scholar] [CrossRef]
  14. Li, X.; Yin, L.; Yao, L.; Yu, W.; She, X.; Wei, W. Seismic spatiotemporal characteristics in the Alpide Himalayan Seismic Belt. Earth Sci. Inform. 2020, 13, 883–892. [Google Scholar] [CrossRef]
  15. Kayal, J.R. Himalayan tectonic model and the great earthquakes: An appraisal. Geomat. Nat. Hazards Risk 2010, 1, 51–67. [Google Scholar] [CrossRef]
  16. Xu, W.; Gao, M. Statistical analysis of the completeness of earthquake catalogs in mainland China and its periphery. Acta Geophys. 2014, 57, 2802–2812. (In Chinese) [Google Scholar]
  17. Xie, Y.; Cai, M. Compilation of Historical Data on Earthquakes in China; Science Press: Bejing, China, 1983. (In Chinese) [Google Scholar]
  18. Singh, C.; Singh, A.; Chadha, R.K. Fractal and b-value mapping in Eastern Himalaya and Southern Tibet. Bull. Seismol. Soc. Am. 2009, 99, 3529–3533. [Google Scholar] [CrossRef]
  19. Li, X.; Gao, K.; Feng, Y.; Zhang, C. 3D geomechanical modeling of the Xianshuihe fault zone, SE Tibetan Plateau: Implications for seismic hazard assessment. Tectonophysics 2022, 839, 229546. [Google Scholar] [CrossRef]
  20. Irwansyah, E.; Winarko, E.; Rasjid, Z.E.; Bekti, R.D. Earthquake hazard zonation using peak ground acceleration (PGA) approach. J. Phys. Conf. Ser. 2013, 423, 012067. [Google Scholar] [CrossRef]
  21. Pan, H.; Jin, Y.; Hu, Y.X. Discussion about the relationship between seismic belt and seismic statistical zone. Acta Seismol. Sin. 2003, 16, 323–329. [Google Scholar] [CrossRef]
  22. Gao, M. Seismic Zoning Map in China; Standards Press of China: Beijing, China, 2015. (In Chinese) [Google Scholar]
  23. Jian, W. Disaggregation of seismic hazard according to Chinese PSHA method. In Proceedings of the 14th World Conference on Earthquake Engineering, Beijing, China, 12–17 October 2008. [Google Scholar]
  24. Ji, K.; Wen, R.; Ren, Y.; Wang, W.; Chen, L. Disaggregation of Probabilistic Seismic Hazard and Construction of Pseudo-Exact Conditional Spectrum for China. Bull. Earthq. Eng. 2021. [Google Scholar] [CrossRef]
  25. GB18306-2015; Seismic Ground Motion Parameters Zonation Map of China. China Earthquake Administration; General Administration of Quality Supervision Inspection and Quarantine of the PRC. China Standards Publishing House: Beijing, China, 2015.
  26. Scholz, C.H. The frequency-magnitude relation of microfracturing in rock and its relation to earthquakes. Bull. Seismol. Soc. Am. 1968, 58, 399–415. [Google Scholar] [CrossRef]
  27. Latousakis, J.; Drakopoulos, J. A modified formula for frequency-magnitude distribution. Pure Appl. Geophys. 1987, 125, 753–764. [Google Scholar] [CrossRef]
  28. Baker, J.W. An introduction to probabilistic seismic hazard analysis (PSHA). White Pap. Version 2008, 1, 72. [Google Scholar]
  29. Du, G.; Zhang, Y.; Yang, Z.; Iqbal, J.; Tong, B.; Guo, C.; Yao, X.; Wu, R. Estimation of seismic landslide Hazard in the eastern Himalayan Syntaxis region of Tibetan plateau. Acta Geol. Sin.-Engl. Ed. 2017, 91, 658–668. [Google Scholar] [CrossRef]
  30. Zhu, W.; Liu, K.; Wang, M.; Koks, E.E. Seismic risk assessment of the railway network of China’s Mainland. Int. J. Disaster Risk Sci. 2020, 11, 452–465. [Google Scholar] [CrossRef]
  31. He, Z.; Ma, B.; Lu, H. Segmentation of active fault zones in front of Daqingshan Mountain and division of potential hypocenter areas. Earthq. Geol. 2007, 29, 765–775. (In Chinese) [Google Scholar]
  32. Wang, J.; He, Z. Responses of stream geomorphic indices to piedmont fault activity in the Daqingshan area of china. J. Earth Sci. 2020, 31, 978–987. [Google Scholar] [CrossRef]
  33. Xu, X.; Wen, X.; Han, Z.; Chen, G.; Li, C.; Zheng, W.; Zhnag, S.; Ren, Z.; Xu, C.; Tan, X.; et al. Lushan M S7. 0 earthquake: A blind reserve-fault event. Chin. Sci. Bull. 2013, 58, 3437–3443. [Google Scholar] [CrossRef]
  34. Mi, S.; Chen, G.; Gao, Z.; Lv, X. Research on seismic safety evaluation of underground pipelines between cities. Chin. J. Eng. Geol. 2006, 14 (Suppl. 1), 404–408. (In Chinese) [Google Scholar]
  35. Hussain, H.; Shuangxi, Z.; Usman, M.; Abid, M. Spatial variation of b-values and their relationship with the fault blocks in the western part of the Tibetan plateau and its surrounding areas. Entropy 2020, 22, 1016. [Google Scholar] [CrossRef]
  36. Hu, Y.; Zhang, M. Estimation method of ground motion parameters in areas lacking strong earthquake observation data. Earthq. Eng. Eng. Vib. 1984, 4, 1–11. (In Chinese) [Google Scholar]
  37. Yu, Y.; Wang, S. Attenuation of response spectrum of horizontal bedrock acceleration in eastern and western China. Earthq. Disaster Prev. Technol. 2006, 1, 206–217. (In Chinese) [Google Scholar] [CrossRef]
  38. Albarello, D.; D’Amico, V. Attenuation relationship of macroseismic intensity in Italy for probabilistic seismic hazard assessment. Boll. Di Geofis. Teor. Ed Appl. 2004, 45, 271–284. [Google Scholar]
  39. Mohanty, W.K.; Prakash, R.; Suresh, G.; Shukla, A.K.; Yanger Walling, M.; Srivastava, J.P. Estimation of coda wave attenuation for the national capital region, Delhi, India using local earthquakes. Pure Appl. Geophys. 2009, 166, 429–449. [Google Scholar] [CrossRef]
  40. Li, C.; Su, L. Influence of critical acceleration model on assessments of potential earthquake–induced landslide hazards in Shimian County, Sichuan Province, China. Landslides 2021, 18, 1659–1674. [Google Scholar] [CrossRef]
  41. Wang, T.; Liu, J.M.; Shi, J.S.; Gao, M.T.; Wu, S.R. Probabilistic seismic landslide hazard assessment: A case study in Tianshui, Northwest China. J. Mt. Sci. 2020, 17, 173–190. [Google Scholar] [CrossRef]
  42. Cornell, C.A. Engineering seismic risk analysis. Bull. Seismol. Soc. Am. 1968, 58, 1503–1606. [Google Scholar] [CrossRef]
  43. Kramer, S.L. Geotechnical earthquake engineering. In Upper Saddle River; Prentice-Hall Civil Engineering and Engineering Mechanics Series; Prentice Hall: Hoboken, NJ, USA, 1996. [Google Scholar]
  44. Kiureghian, A.; Ang, A. A fault-rupture model for seismic risk analysis. Bull. Seismol. Soc. Am. 1977, 67, 1173–1194. [Google Scholar]
  45. Zhang, Q.; Zhang, P. Application of Geographic Information System (GIS) in Seismic Hazard Analysis. Crustal Deform. Earthq. 1999, 19, 82–86. (In Chinese) [Google Scholar]
  46. Lindholm, C.D.; Bungum, H. Probabilistic seismic hazard: A review of the seismological frame of reference with examples from Norway. Soil Dyn. Earthq. Eng. 2000, 20, 27–38. [Google Scholar] [CrossRef]
  47. Xu, W.; Gao Meng, T. Analysis of background earthquake risk in Mongolia. Chin. J. Earthq. Eng. 2014, 36, 256–260. (In Chinese) [Google Scholar]
  48. Caccavale, M.; Matano, F.; Sacchi, M. An integrated approach to earthquake-induced landslide hazard zoning based on probabilistic seismic scenario for Phlegrean Islands (Ischia, Procida and Vivara), Italy. Geomorphology 2017, 295, 235–259. [Google Scholar] [CrossRef]
  49. Chang, M.; Liu, Y.; Zhou, C.; Che, H.X. Hazard assessment of a catastrophic mine waste debris flow of Hou Gully, Shimian China. Eng Geol 2019, 275, 105733. [Google Scholar] [CrossRef]
  50. Ni, H.Y.; Zheng, W.M.; Song, Z.; Xu, W. Catastrophic debris flows triggered by a 4 July 2013 rainfall in Shimian, SW China: Formation mechanism, disaster characteristics and the lessons learned. Landslides 2014, 11, 909–921. [Google Scholar] [CrossRef]
  51. Pei, W.; Zhou, S.; Zhuang, J.; Xiong, Z.; Piao, J. Application and discussion of statistical seismology in probabilistic seismic hazard assessment studies. Sci. China Earth Sci. 2021, 65, 257–268. [Google Scholar] [CrossRef]
  52. Ji, C.; Dong, B. Probabilistic seismic hazard analysis of a site in Shandong. Earthq. Geomagn. Obs. Res. 2017, 38, 53–64. (In Chinese) [Google Scholar]
Figure 1. Tectonic map. The red rectangular indicates the study area. The background colored in pink indicates the Tibet autonomous region, and the green part indicates the Qinghai province, China. Black lines indicate the boundaries of the earthquake statistical area. The dashed red lines indicate the main faults and terrain boundaries. YZSZ: Yarlung–Zangpo suture zone; BNSZ: Bangong–Nujiang suture zone; JRSZ: Jinsha River suture zone; MBT: Main Boundary Thrust.
Applsci 12 09394 g001
Figure 2. Division map of 18 potential seismogenic zones (red lines) according to this study. The numbers indicate the zone number. Black curves indicate the county boundaries.
Applsci 12 09394 g002
Figure 3. Transcendence probability curve of the horizontal peak acceleration of bedrock at the engineering site of Najin Lhasa.
Applsci 12 09394 g003
Figure 4. Response spectrum curve of the bedrock horizontal acceleration at the engineering site of Najin Lhasa.
Applsci 12 09394 g004
Figure 5. Horizontal bedrock PGA decay curve with epicentral distance (R).
Applsci 12 09394 g005
Figure 6. Attenuation curve of the response spectrum of horizontal bedrock acceleration (epicentral distance R = 50 km).
Applsci 12 09394 g006
Figure 7. Attenuation curve of the response spectrum of horizontal bedrock acceleration (epicentral distance R = 100 km).
Applsci 12 09394 g007
Table 1. Parameters of 18 potential source areas.
Earthquake Statistical RegionNo.Potential Source RegionsArea (km2) m u z   1
Central Tibet earthquake statistical region1Gangsang Duodi18,2808.0
2Nima North62567.0
3Qinglong26447.0
4Jiangcuo35568.5
5Namucuo42927.0
6Sangxiong21388.0
7Dangxiong50458.5
8Kangma94017.5
9Rikaze65327.0
10Naqu43677.0
11Jiali42137.5
12Jinda14937.0
13Qushui40617.5
14Qusong61807.5
15Jiacha36507.5
Himalayan earthquake statistical region16Yadong83647.5
17Luozha81287.5
18Jiayu79328.0
1  m u z is the upper limit of the earthquake magnitude.
Table 2. Activity parameters of the earthquake statistical area.
Earthquake Statistical RegionMaximum
Magnitude Limit
Threshold
Magnitude
Background Earthquakeb ValueRM ≥ 4
Central Tibet earthquake statistical region8.54.06.50.8125
Himalayan earthquake statistical region8.54.06.50.8583
Table 3. Spatial distribution functions of the main potential source areas.
No.Region m u z   1 4.0~5.45.5~5.96.0~6.46.5~6.97.0~7.4≥7.5
1Gangsang Duodi8.00.04430.04430.04430.04450.11380.4881
2Nima North7.00.01360.01360.01360.013800
3Qinglong7.00.00540.00540.00540.005600
4Jiangcuo8.50.00860.00860.00860.00840.02210.0949
5Namucuo7.00.00880.00880.00880.008900
6Sangxiong8.00.00520.00520.00520.00510.01330.0571
7Dangxiong8.50.01220.01220.01220.01230.03140.1347
8Kangma7.50.02280.02280.02280.02270.05850
9Rikaze7.00.01420.01420.01420.014500
10Naqu7.00.00900.00900.00900.008900
11Jiali7.50.00920.00920.00920.00950.02360
12Jinda7.00.00360.00360.00360.003700
13Qushui7.50.00840.00840.00840.00850.02150
14Qusong7.50.01500.01500.01500.01530.03850
15Jiacha7.50.00800.00800.00800.00810.02040
16Yadong7.50.00900.00900.00900.00910.00920
17Luozha7.50.00870.00870.00870.00880.00900.0099
18Jiayu8.00.00760.00760.00760.00770.00800.0139
1  m u z is the upper limit of the earthquake magnitude.
Table 4. Relational coefficient of bedrock ground motion attenuation (major axis).
Period (/s)c1c2c3c4c5c6σlgY
PGA0.6171.163−0.046−2.2071.6940.4460.232
0.041.2080.952−0.033−2.0561.6940.4460.225
0.051.1960.941−0.033−2.0021.6940.4460.226
0.071.6560.826−0.024−2.0371.6940.4460.226
0.102.2070.731−0.016−2.0901.6940.4460.231
0.122.1150.749−0.017−2.0471.6940.4460.251
0.142.1450.745−0.016−2.0521.6940.4460.258
0.162.1310.750−0.016−2.0501.6940.4460.253
0.181.9460.797−0.018−2.0681.6940.4460.259
0.201.8290.798−0.018−2.0011.6940.4460.268
0.241.6570.809−0.019−1.9441.6940.4460.269
0.261.6450.815−0.019−1.9521.6940.4460.276
0.301.6930.796−0.017−1.9651.6940.4460.292
0.341.6570.796−0.017−1.9701.6940.4460.308
0.361.4900.826−0.018−1.9571.6940.4460.318
0.401.3900.835−0.019−1.9371.6940.4460.324
0.441.1530.864−0.020−1.9051.6940.4460.331
0.500.8040.930−0.023−1.9111.6940.4460.337
0.600.3650.982−0.026−1.8281.6940.4460.339
0.700.0111.063−0.029−1.8901.6940.4460.340
0.80−0.1601.083−0.030−1.8771.6940.4460.348
1.00−0.6061.164−0.033−1.8961.6940.4460.345
1.20−0.8111.192−0.034−1.9151.6940.4460.338
1.50−1.2041.249−0.036−1.9231.6940.4460.334
1.70−1.5851.279−0.037−1.8481.6940.4460.333
2.00−1.7921.298−0.037−1.8481.6940.4460.329
2.40−0.6030.8400.000−1.8401.6940.4460.322
3.00−0.9120.8640.000−1.8411.6940.4460.306
4.00−1.1070.8830.000−1.8731.6940.4460.307
5.00−1.4320.8940.000−1.8211.6940.4460.324
6.00−1.6990.9040.000−1.7801.6940.4460.328
Table 5. Relational coefficient of bedrock ground motion attenuation (minor axis).
Period (/s)c1c2c3c4c5c6σlgY
PGA−0.6441.080−0.043−1.6260.2550.5700.232
0.04−0.0050.884−0.031−1.5150.2550.5700.225
0.050.0160.872−0.030−1.4750.2550.5700.226
0.070.4770.757−0.021−1.5010.2550.5700.226
0.100.9410.674−0.015−1.5400.2550.5700.231
0.120.8700.695−0.016−1.5090.2550.5700.251
0.140.8940.691−0.015−1.5130.2550.5700.258
0.160.8780.699−0.015−1.5110.2550.5700.253
0.180.6800.745−0.017−1.5240.2550.5700.259
0.200.6030.748−0.017−1.4750.2550.5700.268
0.240.4840.758−0.018−1.4330.2550.5700.269
0.260.4470.768−0.018−1.4380.2550.5700.276
0.300.4840.749−0.016−1.4480.2550.5700.292
0.340.4420.750−0.016−1.4520.2550.5700.308
0.360.2840.780−0.017−1.4420.2550.5700.318
0.400.1970.789−0.018−1.4280.2550.5700.324
0.44−0.0200.819−0.019−1.4040.2550.5700.331
0.50−0.3740.885−0.022−1.4080.2550.5700.337
0.60−0.7620.939−0.025−1.3460.2550.5700.339
0.70−1.1531.017−0.028−1.3920.2550.5700.340
0.80−1.3161.038−0.029−1.3830.2550.5700.348
1.00−1.7731.118−0.032−1.3960.2550.5700.345
1.20−1.9901.147−0.033−1.4100.2550.5700.338
1.50−2.3901.204−0.035−1.4160.2550.5700.334
1.70−2.7271.236−0.036−1.3600.2550.5700.333
2.00−2.9351.255−0.036−1.3610.2550.5700.329
2.40−1.7700.8070.000−1.3550.2550.5700.322
3.00−2.0800.8310.000−1.3550.2550.5700.306
4.00−2.2960.8500.000−1.3790.2550.5700.307
5.00−2.5870.8620.000−1.3400.2550.5700.324
6.00−2.8280.8720.000−1.3090.2550.5700.328
Table 6. Peak value of the horizontal bedrock ground motion acceleration under different probabilities of transcendence.
Transcendence Probability50 Years in the Future100 Years in the Future
63%10%2%63%10%2%
PGA (cm/s2)90.4185.9265.9118.5216.4306.6
Table 7. Response spectrum values of the bedrock horizontal acceleration at the engineering site (cm/s2).
T (/s)50 Years in the Future100 Years in the Future
63%10%2%63%10%2%
0.0492.5192.5275.4122.7222.5320.5
0.0593.3206.2299.2130.4239.5350.3
0.07110.8240.5363.8150.6284.1428.8
0.10136.9295.0461.0182.5353.9549.3
0.12152.4332.1512.5205.8395.5610.1
0.14164.6362.0552.3224.3428.9655.6
0.16174.0384.7576.1239.0452.9679.6
0.18181.5402.3587.9251.5469.8684.2
0.20186.6415.7595.2261.0482.1684.0
0.24195.6421.9595.8265.0488.0676.9
0.26196.2415.7586.6261.0481.1665.9
0.30196.2413.0587.3273.5479.8698.8
0.34200.0416.7633.1267.4500.1711.0
0.36201.7415.8627.1271.4493.9723.6
0.40190.7401.2608.9259.7491.8697.1
0.44182.1386.4590.2248.0470.0676.7
0.50170.9364.8581.2235.5434.4669.3
0.60152.3332.8522.0217.2393.1615.3
0.70135.8304.2482.0203.9367.3565.0
0.80122.1288.7440.4186.8345.1529.0
1.00103.0242.8373.9161.0293.2452.3
1.2087.0210.6325.3134.4254.1389.3
1.5070.9169.8268.4108.7208.7319.2
1.7059.8150.8234.191.7186.0287.5
2.0049.4128.2205.375.8158.5244.7
2.4039.2104.4163.760.5125.7197.6
3.0029.883.7127.645.9101.7153.7
4.0022.363.198.034.878.5117.5
5.0017.149.580.826.964.795.6
6.0014.040.668.821.753.083.2
Publisher’s Note: MDPI stays neutral with regard to jurisdictional claims in published maps and institutional affiliations.

