Article

Context-Aware Complex Human Activity Recognition Using Hybrid Deep Learning Models

1
Department of Computing, Sheffield Hallam University, Sheffield S1 2NU, UK
2
Department of Computer Science, College of Science, and Information Technology, University of Al-Qadisiya, Al Diwaniyah 58002, Iraq
*
Author to whom correspondence should be addressed.
Appl. Sci. 2022, 12(18), 9305; https://doi.org/10.3390/app12189305
Submission received: 29 July 2022 / Revised: 8 September 2022 / Accepted: 13 September 2022 / Published: 16 September 2022
(This article belongs to the Special Issue Advances in Artificial Intelligence (AI)-Driven Data Analytics)

Abstract

:
Smart devices, such as smartphones, smartwatches, etc., are examples of promising platforms for automatic recognition of human activities. However, it is difficult to accurately monitor complex human activities on these platforms due to interclass pattern similarities, which occur when different human activities exhibit similar signal patterns or characteristics. Current smartphone-based recognition systems depend on traditional sensors, such as accelerometers and gyroscopes, which are built-in in these devices. Therefore, apart from using information from the traditional sensors, these systems lack the contextual information to support automatic activity recognition. In this article, we explore environmental contexts, such as illumination (light conditions) and noise level, to support sensory data obtained from the traditional sensors using a hybrid of Convolutional Neural Network and Long Short-Term Memory (CNN–LSTM) learning models. The models performed sensor fusion by augmenting low-level sensor signals with rich contextual data to improve the models’ recognition accuracy and generalization. Two sets of experiments were performed to validate the proposed solution. The first set of experiments used triaxial inertial sensing signals to train baseline models, while the second set of experiments combined the inertial signals with contextual information from environmental sensors. The obtained results demonstrate that contextual information, such as environmental noise level and light conditions using hybrid deep learning models, achieved better recognition accuracy than the traditional baseline activity recognition models without contextual information.

1. Introduction

In the last decade, the study of Human Activity Recognition (HAR) has significantly improved due to the emergence of smart computing devices, availability of massive datasets, and unprecedented breakthroughs in the development of machine learning/artificial intelligence algorithms capable of providing accurate real-time predictions of various daily human activities and movements [1,2]. Today, the number of smartphone users worldwide has surpassed the predicted six billion, and it is projected to increase by several hundred million in the next few years [3] This surge has resulted in the rapid development of several intelligent application domains that leverage the use of built-in sensing capabilities of smartphones. These domains, among others, include smart homes [4], healthcare [5,6], personalized content recommendations [7,8,9], manufacturing [10], self-driving cars [11], etc. While these domains may have certain peculiarities regarding the activities involved, each domain, within its contexts, involves several combinations of simple and complex activities, particularly in the domain of human activity monitoring in ambient environments. Although significant progress has been achieved in HAR, most works have focused largely on simple activities compared to complex activities that reflect people’s real daily lives [2,11,12,13,14,15,16]. Even though complex activities are characterized by several simple activities, they are prone to interclass similarity problems. According to [11], an interclass similarity occurs when signals of dissimilar activities exhibit similar patterns. Because of these similar signal patterns, discriminating between simple and complex activities becomes increasingly more difficult for HAR systems. To address the interclass similarity problem, not just the use of more sensory data is required but also the use of algorithms capable of discriminating patterns in these activity signals, including the consideration of contexts in which such activities occur [11].
To emphasize the interclass problem in HAR and other related problems, let us consider the following scenarios to illustrate typical situations where a mix of simple and complex activities can be misclassified if they exhibit interclass similarity without considering contextual information. A driver, for example, might be distracted by a personalized mobile content recommendation because a model confuses driving with running, where both activities involve movements. Another example is lying in bed and sunbathing at the beach. These are two examples of activities that involve lying down, but the latter is a complex activity typically involving a substantial amount of sunshine (illumination) and sometimes the level of noise/sound in a specific location, usually on a beach. A final example is walking and mountain climbing. Again, these are two activities that are quite similar but contextually different. Mountain climbing involves walking, but at the same time, the contexts are quite different. Usually, factors such as high altitudes are associated with low temperature and humidity. Therefore, to effectively discriminate between these similar activities, information, such as spatial–temporal and environmental contexts could be exploited.
The examples above demonstrate clearly that simple and complex activity recognition from sensor data does pose significant challenges. First, the underlying activities of a complex activity are mostly dependent [14]. Particularly, in one complex activity, the temporal relatedness of several simple activities often manifests in different forms. Consequently, the complicated temporal combinations often have semantic issues for understanding a complex activity [15]. Second, multiple complex activities share one or more common and related simple activities. The driving and eating examples above clearly illustrate this. Another good example is making sandwiches, which is expected to exhibit signal patterns as with other activities, such as making a coffee and cycling, in terms of activity patterns. Third, complex activities, compared to simple activities, contain higher level semantics that is often more complicated and is known to be more reflective of our daily lives, e.g., driving, eating, and relaxing. Thus, complex activities often take longer time to detect compared to simple ones [15,16].
In the past, as illustrated in Figure 1, researchers have solved several HAR problems using traditional machine learning techniques and handcrafted feature extraction methods [17,18,19]. Although this process is known to help reduce the learning models’ overfitting problem, reduce training time, and improve accuracy, the downside is that when features are handcrafted, the model becomes susceptible to generalization problems. Handcrafted feature extraction is also limited by human domain expertise, i.e., a deep knowledge of the application domain is required. Lastly, because this approach only helps extract shallow features, the performance of the model is largely compromised, resulting in poor generalization [12].
Recently, Deep Convolutional Neural Networks (DNNs) began to deliver on their promises of automatic feature extraction to achieve state-of-the-art results for HAR. When a DNN is applied to raw time-series data, for example, it often outperforms models trained on heuristic handcrafted features [19] because of its automatic feature extraction capabilities. Deep learning models also have capabilities to extract high-level representation within the deep layer making them more applicable to complex activity recognition problems [12]. The most common DNNs for HAR are the Convolutional Neural Network (CNN), Recurrent Neural Network (RNN), and the Long Short-Term Memory (LSTM) networks [2,20].
CNNs are specifically designed to effectively process image data, solving computer vision problems, such as image classification, image captioning, object localization, etc. [21]. Compared to CNNs, RNNs can learn and keep memories of temporal dependencies of time-series data by relying on their dynamic temporal behaviors. LSTM networks are an extension of RNNs, possessing complex memory cells, which help to avoid the long-term dependency problem of vanilla RNNs. Since DNNs can adaptively learn spatial hierarchies of features to discover low- and high-level patterns in the dataset, new datasets and new sensor modalities can be quickly adapted with minimal configurations. Several authors have demonstrated the effectiveness of DNNs in HAR systems with state-of-the-art results, and with some recently using hybrid deep learning models [22] as we discuss in Section 2.
Considering the identified problems above, the goal of this article is to develop context aware HAR models, capable of discriminating between simple and complex human activities of daily living, and for addressing the associated interclass similarity problems using a combination of traditional motion and environmental sensing data with hybrid deep neural networks. The proposed deep hybrid HAR model combines rich context-aware data from ambient sensors with low-level inertial sensor signals as illustrated in Figure 2. The motion sensors include the accelerometer, gyroscope, and other sensors, such as the magnetometer, while the context signals, which serve as the context data, include signals from sound and light sensors of smartphones.
The hybrid model effectively combines diverse and important capabilities of CNNs and LSTM to form a CNN–LSTM hybrid model [21,22,23]. Existing works using this type of hybrid model have proven to provide very good accuracy [23,24]. While the CNN model provides the proposed solution with the advantage of extracting discriminative features dynamically without the use of handcrafted feature extraction processes, the LSTM helps to extract temporal information from context-dependent human activities containing latent temporal and spatial information. The CNN-based approach has demonstrated its efficiency when dealing with fixed and short sequence HAR datasets, but it is not the best when dealing with long and complex HAR problems [21]. Therefore, we used the CNN–LSTM hybrid model because the convolutional layer of the proposed model uses its capability to learn the internal representations of sensor signals; the LSTM learns the long-term and short-term temporal dependencies in the context-infused time-series data.
The key question therefore addressed in this article is “can rich contextual information infused into the traditional inertial sensing data improve the accuracy of deep hybrid learning models in generalizing simple and complex activities of daily living while also addressing the interclass similarity problems?” To answer this question, the main contributions of this article are four-fold:
  • The article proposes a deep hybrid feature model capable of discriminating between simple and complex activity signal patterns by augmenting low-level inertial sensing signals with contextual data to improve recognition and generalization accuracy.
  • An extensive review of state-of-the-art human activity recognition, context awareness, deep learning algorithms, and interclass similarity problems in human activity recognition.
  • We demonstrate through extensive experiments the efficacy of the context-aware CNN–LSTM model for realizing state-of-the-art results using raw sensor signals without heuristic handcrafted features.
  • We demonstrate the efficacy of smartphone-rich contextual data for solving interclass similarity problems of simple and complex activities.
The main novelty is the use of environmental noise level and light conditions as context information to generate context-aware CNN–LSTM models capable of discriminating between simple and complex activities, particularly those activities that exhibit similar signal patterns.
The remainder of the article is structured as follows: In Section 2, we review related works focusing on aspects covered by the proposed solution. In Section 3, we present the methodology of the proposed solution. Experimental validation of the proposed solution is presented in Section 4. In Section 5, we analyze and discuss the experimental results and their significance. Finally, Section 6 concludes and presents recommendations for future work.

2. Literature Review

In this section, the article provides the context and background for the work presented in this article. It also examines the existing literature in simple and complex activity recognition, machine learning, and context awareness for complex HAR systems.

2.1. Simple and Complex Human Activities

The HAR domain has witnessed huge attention by research studies involving simple activity recognition. However, limited studies focus on complex activities. This is evident in several independent surveys conducted by other researchers [2,6,11,12,24,25]. They have suggested that the lack of studies is attributed to the data associations inherent in complex activities. For instance, the authors in [2] categorized complex activities into three broad groups: composite activities comprising a series of simple activities; concurrent activities occurring when users engage in more than one simple activity at the same time; and multi-occupant activities suggesting more than one user is engaging in a set of activities in a multi-resident environment. Moreover, using an approach based on tree-structured taxonomy, [23] categorized human activities into two broad groups: single-layered and hierarchical activities. The single-layered activities are likened to simple activities, such as gestures and actions with sequential characteristics, while the hierarchical activities are high-level activities with multiple single-layered activities. Another definition given by the authors of [25] argues that the differentiating factor is the duration. In their paper, they referred to simple activities as single-person actions with a short duration, while complex activities are regarded as a complex sequence of actions performed by several individuals over a long time. Although several authors have used different terminologies for their categorization, the authors of [26] argue that the boundaries of these classes are still not clearly demarcated. One thing that these existing studies agree on is that human activities can be further categorized into simple and complex activities to better reflect the activities of daily living. In this article, we adopted the classification taxonomy developed by [2,25].
For HAR models to achieve state-of-the-art performance when discriminating between simple and complex activities, Blanke et al. [27] argue that collecting data from multiple sensors should be explored because of the hierarchical structures in determining the diverse levels of physical activities. Although the authors of [11] agree with this heterogenous data collection approach, they also identify the prevalent interclass similarity challenges associated with HAR, particularly when the dataset comprises both simple and complex activities. They define interclass similarity as the potential for activity classes that are fundamentally different to exhibit similar signal patterns. Finally, they recommend applying an Activity Recognition Chain (ARC) to mitigate these challenges. An ARC is a specific activity recognition system behavior that comprises signal processing, pattern recognition, and machine learning algorithms.

2.2. Context Awareness and Intersimilarity in Complex HAR

The role of context recognition in complex activity recognition cannot be overemphasized. Therefore, understanding the context in which an activity is performed can enhance the capability of HAR models to identify the complexity of such activity [28,29,30,31,32]. Researchers have, over the years, developed models for activity recognition using additional sensor signals other than the traditional inertial sensors (accelerometer, gyroscope, magnetometer, etc.) [29,30,33,34,35]. The rationale is to acquire as much information as possible from integrated or nearby ambient sensing devices to train deep neural networks.
Using this rich contextual information, existing research works have been able to recognize different activities that are difficult to identify using fewer sensor modalities. In recent research conducted by the authors of [29], they used ambient signals from audio sensors combined with inertial signals to pretrain a CNN model for automatic human activity recognition. The work, however, used only audio signals as contextual information and a CNN model compared to the one presented in this article. Similarly, reference [30] combines ambient signals from audio sensors and video cameras in addition to other inertial sensors to detect the activities of the elderly to recommend early interventions and rehabilitation. To address the interclass similarity in HAR, [31] relied on camera signals and developed a model that explored hierarchical matching using a consistency correlation-driven feature selection. However, these two works have the potential for intruding on people’s privacy.
To address the same challenge, authors in [32] combine sensing information from multiple sensor modalities including traditional sensors (accelerometer and gyroscope) and ambient sensors (atmospheric pressure, temperature, and humidity sensors) with location information. However, compared to the work presented in this article, they only explored handcrafted feature extraction processes and traditional machine learning algorithms. One of the latest works, [33], added context information to enhance HAR accuracy in logistics using identities and location as contextual data. Unlike the works in [32,33], we used environmental sensing data specifically, noise level and illumination conditions, as contextual information to enhance the accuracy of human activity recognition.
In summary, the current work differs from these works in that we not only used inertial sensor signals from smartphones, but we also investigated the significance of context data in conjunction with the inertial sensors to address the challenge of interclass similarity in the datasets. Thus, in addition to the traditional inertial sensors, we proposed two (2) extra signals (environmental light conditions and noise level signals) to augment the traditional inertial sensing signals with contextual information, using a combination of CNN and LSTM algorithms to generate a more accurate HAR model.

2.3. Machine Learning for Complex HAR

In 2012, [26] conducted one of the first studies that focuses on simple and complex activity recognition using data collected from smartphone accelerometers and gyroscope sensors. Although the model had a poor 50% accuracy rate at recognizing complex activities, it achieved over 93% for simple activities, suggesting that relying on smartphone sensors alone may be inadequate for detecting complex activities. However, other studies argue that the size of the segmentation window could lead to inferior performance of the model for classifying complex activities, suggesting that some efforts are required to determine the optimal window size [34,35]. The model is designed such that it automatically detects the appropriate window size, thus obviating the need for a prespecified window length.
In addition, the recognition of several different complex activities has contributed significantly to providing context-aware feedback in various well-being mobile applications [36]. Unlike the proposed model, most of these works focus on one complex activity and several simple activities. For instance, Ramos-Garcia and Hoover [37] focused on eating, while [38] concentrated on smoking. In addition, most of these studies used data from accelerometers and gyroscopes only, while this work explores a few more complex activities using additional sensors, such as the smartphone magnetometer. Although another work combined data from the accelerometer, gyroscope, and magnetometer on the wrist to detect smoking puffs, the models were only able to detect smoking activity [39]. The proposed solution in this article explores the application of context-aware deep learning models to generalize more than one complex activity in human activities of daily living.
So, how has deep learning helped to provide a better generalization of complex activities? Some existing works have explored the application of DNNs to HAR models. Early works conducted by some authors [18,19,20,21,22,40,41,42] to examine the feasibility of deep learning in the HAR space allowed other related studies in this field. Motivated by this, other scholars [17,18] attempted activity classification by relying on handcrafted feature extraction processes. The models on the one hand performed very poorly simply because the CNN was only explored as a classification model and certainly not used for feature extraction. On the other hand, Hammerla et al. [43] achieved a better result when they employed a 5-hidden-layer CNN to conduct automatic feature extraction and classification. Similarly, other studies have achieved similar results [19,29,42]. This novel approach allows feature extraction and model building tasks to be performed through the network at the same time, thus making it suitable for classifying composite activities. Although the work also leverages CNN’s automatic feature extraction, we additionally investigated the impact of different window lengths on the recognition accuracy as suggested by [42]. Furthermore, we explored the recommendations from other studies [11,43,44,45] by incorporating temporal and environmental contexts, such as noise level and light conditions, as contextual data into the model.
In addition, other works explored the RNN a deep learning model known to be widely applicable in natural language processing and speech recognition. However, these works have some limitations. They consume a lot of computational resources and time [46,47,48,49]. The authors in [50] applied the RNN successfully on several HAR datasets with very good results. They conclude on the limitation of CNNs to operate effectively on fixed-size windows of sensor data, a limitation that LSTM Networks do not suffer from. LSTM is a specific type of RNN widely used with time-series data because of its ability to learn temporal dependencies in a sequence. In a related study conducted to detect anomalies in time series in [51], authors demonstrated the ability of the LSTM networks to maintain long-term memory and learn sequences of data containing long-term patterns of unspecified length. This capability of LSTM makes it a suitable candidate for the complex activity recognition system. Often, complex activities take longer to detect compared to their simple counterparts [15,16]. LSTM models are well-suited for sequence learning as they allow to input sequence data into the network thereby helping to make more accurate predictions using the time steps in the sequence data [52]. By splitting the window sequences into subsequences, we can reuse the same CNN model when reading each subsequence of data separately. We achieved this by wrapping the CNN layers in a time-distributed wrapper and applying the entire model once per input subsequence. The extracted features are then flattened and fed to the LSTM model, extracting its features before a final mapping to activity.
Apart from those early works, more recent works have explored the combination of an LSTM with a CNN to address the identified challenges resulting in a CNN–LSTM or ConvLSTM model [21,22,52,53,54,55,56,57,58,59]. CNN–LSTM hybrid models have been considered as effective in other domains apart from the HAR domain. For example, Zhou et al. [57] use the hybrid CNN–LSTM model to predict people’s personality using user-generated contents and emojis. This combination of CNNs and RNNs is an emerging methodology adopted lately by researchers to replace the previous conventional independent learning with multiple related activities. One such work by [53] implemented the hybrid model: a combination of CNN- and RNN-based LTSM recurrent layers to classify activities from Kinect v2 sensors. Although they conclude that the combination of both CNN and LSTM produced better results than individual deep neural networks, human activity recognition using videos is considered intrusive.
In [55], the authors present a novel approach using a combination of both the CNN and LSTM by including an attention mechanism by merging the output of the upstream layer and then filtering the important representation by redistributing the weights of feature representations. However, this work did not consider the importance of context information as we did in our proposed solution. Another recent and similar work is presented by Huan et al. [56] where multilayer features were extracted from sensory data using a hybrid of the CNN and BLSTM networks. This is a similar work in that the sensory data were infused with location information to enhance recognition accuracy. However, we used two forms of context information, namely light conditions, and environmental noise levels, to enhance the recognition accuracy of hybrid HAR models.
The results obtained by these recent works conclude that combining the CNN network with the LSTM network can achieve higher generalization accuracy than just using either of them alone. These works provide the basis for the research although not one of these studies explores the combination of rich contextual information provided by the smartphone ambient sensors to augment the inertial sensing signals. The work presented in this article is unique in that it tried to improve recognition accuracy significantly by exploring these contextual dependencies.
More specifically, the proposed solution only uses sensor data from smartphones as opposed to other models that require multiple wearable and nonwearable sensors, such as video cameras, which are far from ideal and quite intrusive. Although there are similar works that demonstrate the adequacy of smartphone sensor data in activity recognition [53,54,55,56,60,61,62,63,64,65], to the best of our knowledge, the proposed work is the first to combine rich contextual information from environmental sensors with low-level sensor signals from the inertial sensors to distinguish between simple and complex activities and address associated interclass similarity problems using the combination of temporal features from both sliding window and LSTM.

3. Methodology

In this section, we present the approach and methods of the proposed solution for generalizing simple and complex activities using raw sensing signals from smartphone sensors.

3.1. Problem Definition

We start by clarifying a few terminologies. Figure 3 represents the high-level workflow of the work. Experiments on smartphone-based activity recognition require activity signals to be collected from the user via smartphone sensors [2]. The sensing signals are usually multivariate time-series data. Multivariate refers to multiple input; for example, the accelerometer signals come in 3 axes (x, y, and z). Moreover, the smartphone has several sensors ranging from inertial to environmental sensors. When signals are collected from multiple sensors, such a dataset is referred to as multimodal, i.e., multiple sensor modes. State-of-the-art HAR models are usually trained using a multimodal multivariate dataset [18]. As previously illustrated in Figure 2, Section 1, the input data consists of a combination of inertial and environmental sensing data signals. In the next section, we describe the input data in detail.

3.2. Inertial Sensor Signals

According to a recent survey conducted by [2], inertial sensors are the most used for HAR systems. This set of sensors, compared to the video cameras, captures body movements effectively without posing any privacy issues. The accelerometer, gyroscope, and magnetometer are the most popular examples of inertial sensors, which are now freely integrated into smartphones, smartwatches, and clothes. In this work, we utilized sensing signals from the 3 inertial sensors to train the baseline model, just like many other studies [39,65]. The raw signals from the inertial sensors were preprocessed and fed into the convolutional layers for feature extraction.
The accelerometer, for example, is used to measure acceleration, the same as the rate of change of velocity of an object. The unit of measurement is meters per second squared (m/s2) along the 3 axes (x, y, and z). Therefore, each sample is made up of a tri-variate time series. The gyroscope is another motion sensor used for measuring orientation and angular velocity. The unit of measurement is degree per second (°/s). In contrast to the accelerometer that measures changes in linear velocity, the gyroscope is a more advanced sensor that captures angular and lateral orientations of an object. Lastly, the magnetometer is a motion sensor often installed together with an accelerometer and gyroscope into an inertial unit. It helps measure changes in the magnetic field at specific locations. Recently, the magnetometer has become common sensing equipment in mobile devices to detect orientation relative to the Earth’s magnetic north [2]. Similarly, the magnetometer captures signals in three axes as the accelerometer and gyroscope.

3.3. Environmental Contextual Signals

With their built-in sensors, smartphones have proven to be an indispensable component of a lot of HAR research and applications [41,61,62,63,66]. Interactions between humans and the environment, therefore, can be easily captured using environmental sensors embedded in devices, such as smartphones present in their physical locations. These sensors are good at detecting multi-occupant activities [2]. Examples of environmental sensors include sound, light, humidity, pressure sensors, etc. In this work, the approach is to augment traditional inertial sensing data with rich contextual data captured by environmental sensors to train the classifier to distinguish between simple and complex activities. Several other works used a similar approach to achieve state-of-the-art results [29,30]. However, their work did not combine the audio and light sensors as proposed in this article. In addition to the inertial signals, we used sensory signals from the audio and light sensors to train and improve the baseline model to create a context-aware model.
The sound or audio sensors are usually made up of microphones and speakers. The microphone receives ultrasound signals, while the speaker transmits the same. The idea is that human movement activities and interactions create different levels of environmental sounds, and these can be captured by the microphone as noise level contexts. Likewise, the light sensor captures the intensity of light, i.e., the illumination level at the time these interactions occur. Together, these two sensors provide rich contextual data that can be fed to the CNN–LSTM models.
Having discussed the sensors used, Figure S1 illustrates how data from these multiple sensors were fed into the hybrid model through the CNN model, which extracts the feature representation of the signals. In Figure S1, the representations of single axis light and microphone signals are depicted as i and n, respectively, whereas the representations of signals from the triaxial accelerometer, gyroscope, and magnetometer are denoted by x i j ,   y i j   ,   and   z i j serving as input to the context aware HAR model.

3.4. The CNN–LSTM Hybrid Model

The proposed CNN–LSTM ensemble model uses the time-distributed CNN sub model for automatic learning and extraction of discriminatory features from raw input signals and the LSTM networks for frequency and temporal modeling. First, a CNN is made up of the following components: an input layer, multiple hidden layers, and an output layer (Figure S2). The input layer is determined by the input signals. Each of the multiple hidden layers can either be a convolutional layer followed by an activation function, a pooling layer, or a fully connected layer (FC). The main difference between the two models is that at the time-distributed input layer, the baseline model trains on 9 input features, while the context-aware model trains on 11.

3.4.1. The Convolutional Layer

Between the CNN model, data processing happens layer by layer as the output of one layer is the input of another layer. Let us assume that
x i a = [ x 1 ,   x 2 , , x N ]
are the input from the sensors, and a represents the axis of the sensor. For the sensors used in this work, three of them, namely accelerometer, gyroscope, and magnetometer, are triaxial sensors. The other two, namely the light and microphone sensors, are single axis sensors.
  • The Pooling layers
We added a pooling layer to the CNN sub model to reduce the spatial size of representations, i.e., a form of nonlinear down sampling operation to help reduce the feature maps. It is a common practice to have a pooling layer between successive convolutions in a CNN [14]. In this article, we used the max pooling operation in mapping the output of the preceding layer.
  • The Flatten layer
We included a flatten layer in the model just immediately after the pooling layer. The flatten layer, upon receiving the output of the pooling layer, converts the reduced feature maps into a single column vector.
  • The LSTM Networks
An interesting part of the model is the introduction of the LSTM networks immediately after the flatten layer. This is where the current work differs significantly to that conducted recently by the researchers in Otebolaku et al. in [64]. According to [22], for models that need to learn the temporal patterns in input data, preceding an LSTM network with a CNN sub model always outperforms models with only one of the two. LSTM, like any other recurrent neural network, supports forward and backward propagation within its networks. Made up of several LSTM units, the LSTM networks use their memory cells to master the temporal context in input data. Each of the units has a memory cell c t   , which is readable, updatable, and erasable [15]. As mentioned earlier, LSTMs comprise the input gate i t , forget gate f t , and output gate o t , which control reading, memory update, and writing operations, respectively.
We implemented a single-layer LSTM network (Figures S3 and S4). By passing the output of the previous LSTM unit into the next, the network can begin to perform frequency and temporal modeling of the activity contexts. The input is the one-dimensional vector of features from the flatten layer of the time-distributed CNN sub model. As argued by [22,58], we fed the output of the single-layer LSTM network to a fully connected dense layer with a SoftMax activation function.

3.4.2. The Fully Connected (FC) Layer

This is a dense layer, known for producing higher-order feature representation that is easily interpreted into the different activity classes by a SoftMax classifier. Finally, we were ready to predict the activity labels. Before that, let us see how the dense layer implements the probability distribution. Given the output from the LSTM layer, i.e., h t , predictions can be performed, and the activity probability distribution vector pc = [ p c 1 , p c 2 , , p c m ] is derived as follows:
p c = s ( W h m T h t + b m )
where m is the number of activity classes; W h m and b m are the weight and bias, respectively, for the output layer. The s ( ) is the softmax function with the following equation:
  f ( x ) = P ( x ) = e p c y a l j = 1 n e p c j
where a l is an activity label; y is the output of the activity classifier f(x); n is the number of activity labels, and p c j means the j-th element of unnormalized log probability vector p c . The predicted activity label is assigned to the one with the highest probability, i.e., alargma x a l = 1 n P(y = al|x). In this case, both the simple and complex activities are learned concurrently. We used the classification methodology suggested by [23,58] to categorize activities within the dataset into simple and complex labels.

3.4.3. Data Preprocessing and Segmentation

To achieve the fixed length windows, one key requirement is to divide the standardized data into segments using a temporal sliding window algorithm. The algorithm divides the data into windows of signals, where a given window is associated with a specific activity and usually has one to a few seconds of observation data [18]. Two parameters were configured to achieve this: the size of the window and the shift [65]. The shift parameter helps create the overlap between windows as seen in Figure 4. In the case of a 50% shift, which is commonly used in much of the HAR literature, an overlap is created such that the first half of a window contains the observations from the last half of the previous window [32,64,65]. In this work, we used a window length of 32 (circa 0.75 s of sensor signals) and a 50% shift. A detailed analysis of the different window sizes and how we arrived at the choice of 32 window size can be found in Section 4.

3.4.4. Hyperparameter Tuning

To ensure optimal performance for the model, we evaluated the influence of several hyperparameter settings on the performance of the model. We adopted the grid search methodology, a tested and reliable method for tuning hyperparameters [59]. Grid search methodology proved to be the optimal approach for setting the hyperparameters by creating a grid of a certain range and then looping through the candidate elements to find the best values for each hyperparameter.
Several studies provide sufficient guidance on how to approach grid search, especially when a hybrid CNN–LSTM model is involved [22,67]. Both works analyzed the effect and shared the many benefits of adding the CNN layers before the LSTM to solve speech and activity recognition problems. We approached the hyperparameter tuning by first optimizing specific components of the model, and then we moved on to tuning the model for overfitting.
For the subcomponent tuning, a common practice is to have 2 consecutive CNN layers followed by a dropout and a max pooling layer [18]. We adopted this simple structure for the CNN–LSTM model and trained the 2 fully connected convolutional layers with 9 feature maps representing the 3 (x, y, and z) axes of the 3 inertial sensors (accelerometer, gyroscope, and magnetometer). The number of nodes in the hidden layer was replaced by the number of filter maps and kernel size, which we grid searched as well. The number of filters was (16, 32, 64, 128, and 256), while the kernels investigated were between 2 and 7 in the following order (2, 3, 4, 5, and 7).
Moreover, for the convolutional layers, the input data must be in the form of (samples, timesteps, and features) where features map onto the channels, and in this case, it was 9 for the 9 variables that we had from the 3D inertial sensors. The approach to implementing this model was to split each window of 64-time steps, for example, into subsequences for the CNN model to process. The 64-time steps in each window could then be split into 4 subsequences of 16-time steps. As a result, we defined a CNN model that read in sequences with a length of 16-time steps and 9 features. The entire CNN model was also wrapped in a time-distributed layer to allow the same CNN model to read in each of the subsequences in the window. The extracted features were then flattened and fed into the LSTM extracting its features before a final mapping to the activity.
Another important parameter that requires tuning is the batch size. The training data were fed to the model in one or more batches. A batch represents the collection of samples that the model processes prior to its weights being updated. Depending on the dataset, adequate measures were taken to ensure that the model was fed with the right batch size for it to learn optimally [68]. Using the grid search, we passed batches ranging from 16 to 512 to train the model for each window length since the interaction between the two parameters affects model performance.
To prevent overfitting, we optimized several parameters including weight decay, dropout regularization, number of epochs, and learning rate. Weight decay or weight regularization provides an approach to reduce overfitting of the training data and improve generalization capability of new data. We tuned the L2 weight regularization for both the CNN layers and the LSTM cells. We confirmed from the literature that the CNN layers usually require small L2 weight decay to perform optimally [64,69].
Dropout regularization is another way to prevent the model from overfitting. This is often referred to as the dropout rate, which can be specified for different layers of the model, and it defines the probability of setting each input to the layer to zero [70]. In other words, a dropout rate of 0.3 informs the hidden layer to set 30% of input to zero. For the hybrid model, we grid searched between 0 and 0.9 dropout rates for each of the hidden layers, i.e., the CNN layers and the LSTM cells.
Models often overfit or underfit when they train continuously to the end of a fixed number of epochs. Two things happen when a fixed number of epochs is set: either the model is interrupted while it is still learning, i.e., underfitting, or it learns so much that it starts memorizing the training data, i.e., overfitting. The literature identifies two methods suitable for preventing this: early stopping and ModelCheckpoint [63]. We invoked the Keras early stopping call-back and specified the validation loss as the performance metric to monitor and end training. We also set a patience of epochs to 8 to add a delay before stopping. We also added a second call-back called ModelCheckpoint to save the best model achieved during the training process.
Finally, deep neural networks were trained using the stochastic gradient descent optimization algorithm, which estimates the error gradient of the model being trained and then updates the model’s weights using backpropagation [16,22,43]. The amount of the model’s weight that is being updated during this training is known as the learning rate. It is often regarded as the most important hyperparameter for deep neural networks [43]. The value is usually between 0.0 and 1.0, and choosing the suboptimal rate is always a challenge. Masters and Luschi in [68], in one of their papers, recommend tuning the learning rate after all other parameters. They suggested that even if the learning rate had been tuned earlier, effort should still be made to further reoptimize it at the end of all other parameter tuning because the learning rate tends to interact slightly with other parameters. In this article, we tuned the learning rate twice, one time before tuning the subcomponents of the model and the other time at the very end of all other hyperparameters.

4. Experiments and Results

In this section, we present the evaluation experiments of the proposed solution. First, we discuss the two main types of datasets used in the experiments: the traditional inertial sensors datasets and the environmental contextual data.

4.1. Experimental Setup

The dataset for this experiment was collected exclusively from the built-in inertial and environmental sensors of a smartphone. A comprehensive description of the entire data collection process can be found in these papers [44,71]. To the best of our knowledge, there is not one publicly available HAR dataset that was exclusively collected with a smartphone, comprising both traditional sensor signals and rich contextual information from the environmental sensors. Similarly, other authors who have used custom datasets in their work also corroborated this fact [33,72].
To answer the research question, two experiments were conducted in this study. What differentiates the two experiments is the dataset used. In the first set of experiments, we trained the deep hybrid model using traditional inertial sensor signals, while in the second set of experiments, we used a richer dataset containing additional signals from the environmental sensors as contextual data. The model was consistent for the two experiments; only the datasets changed.

4.1.1. Traditional Inertial Sensory Data

For this experiment, we used data collected from the traditional inertial sensors, i.e., accelerometer and gyroscope. We also used data from the magnetic sensors, unlike previous studies that used data from one or two of these sensors [26,33,36,37,73]. Subsequently, we referred to this experiment as the noncontextual experiment. The dataset was collected using a mobile app developed by Otebolaku and Andrade [71] and customized specifically for collecting context-aware human activities. Figure 5 highlights the dataset’s distribution per activity class. A basic exploratory data analysis revealed that the dataset suffered from class imbalance with only about four activity classes representing approximately 77% of the entire dataset. The choice of evaluation metric thus considers this.

4.1.2. Inertial and Contextual Data

For the second experiment, which we refer to as contextual, additional sensing data were introduced compared to the noncontextual experiment. To increase the sensor modality and investigate the significance of rich contextual information on the model, we augmented the inertial sensing data in the noncontextual experiment with additional sensor signals from the ambient sensors. The ambient sensors used include the audio (microphones) and the light sensors in addition to the traditional inertial sensors used initially. This made a total of five sensor modalities—accelerometer, gyroscope, magnetometer, audio, and light—altogether collecting sensing signals for 12 activity classes. Further processing was carried out on the audio and light sensor signals to transform them into representations of environmental noise level and illumination data. The absence of other similar datasets relevant to the research was one drawback that we plan to address in future research. Lastly, all the experiments were implemented in Python using the TensorFlow machine learning framework, which comes bundled with Keras high-level API [74].

4.2. Simple and Complex Activity Taxonomy

Given that the dataset is a mix of both simple and complex activities and following the classification approach suggested by other researchers [2,23], we were able to identify the simple activities in the dataset to include Sitting, Standing, and Walking. Others are Jogging, Lying, and Running. The complex activities, which fell under either composite, concurrent, or multi-occupant activities include Elevator Up, Elevator Down, Ascending Stairs, Descending Stairs, Mountain Climbing, and Riding in a car.
We determined the simple activity category by analyzing which activities are atomic, i.e., those that cannot be further split into simple activities, and nonatomic activities were categorized as complex. For instance, riding in a car can easily be broken down into sitting down and in motion. Table 1 presents the simple and complex activities for the breakdown of both the simple and complex activities.

4.3. Evaluation Metrics

We evaluated the classifiers from the two experiments using a hold-out test dataset. The hold-out test data came from users whose data were not used as part of the training and validation data. As part of the data preprocessing stage, the entire dataset was split into training, validation, and testing sets. The test data came from a user; validation data came from two other users, while the remaining data from four other users were used during training. This approach is often referred to as leave-one-subject-out validation in the literature [11]. For both experiments, we used the following metrics: Precision, Recall, F-score, and the confusion matrix. According to many authors, these are the most used metrics for activity recognition [11,74,75].
Before discussing Precision, Recall, and the F-score, we defined the confusion matrix. This is because the precision and recall values, as well as the harmonic mean of precision and recall, i.e., the F-score, can all be computed from the confusion matrix. The confusion matrix provides a summary of the number of instances of different activity classes that the model is confused about, i.e., misclassified by the model [11]. For a more fine-grained analysis of the predictions by the model, the confusion matrix not only provides insight into the performance of a predictive model, but also a breakdown of which classes are being predicted correctly (True Positive and True Negative), incorrectly (False Negative and False Positive), and the error values. However, the numbers can be strongly biased by dominant activity classes compared to the minority classes and more so when a class imbalance dataset is involved.
The precision is computed as the sum of True Positive (TP) predictions across all classes divided by the sum of True Positive predictions and False Positive (FP) predictions across all classes. Precision is defined as:
P = TP/(TP + FP)
The recall is another metric that computes the number of True Positive predictions divided by the sum of True Positive and False Negative predictions, i.e.,
R = TP/(TP + FN)
Finally, once the precision and the recall metrics were known, we then computed the F-score, which is the harmonic mean between the recall and precision. The F-score provides a way to combine the precision and recall measures into a single measure that reflects both properties. The F-score remains the commonly used metric for class imbalanced datasets [74]. Considering the imbalanced nature of the dataset and the tendency of the classifier to skew toward the more frequent classes during training, we adopted the macro-average F-score previously used successfully by other scholars [49,76]. This metric truly reflects the representation of small classes within the dataset, and it is calculated as follows:
F-Score (R, P) = 2*RP/(R + P)
Just like the Precision and Recall measures, a perfect F-score is 1.0, and a poor F-score is 0.

4.4. Experiments and Performance Evaluation

We conducted the experiments using the Google Colab environment, an open-source python-based machine learning platform that leverages the power of Google hardware, including GPUs and TPUs. Google Colab is known for its tremendous support for training neural networks. Moreover, it requires zero configuration, free access to GPUs, and is much faster than any other easily accessible hardware. This environment also provides leverage on the open-source interfaces, such as the TensorFlow machine learning framework, which comes bundled with Keras high-level API [74].
In this article, two different models were built, one from the noncontextual experiment and the other from the contextual experiment. We refer to the noncontextual model as the baseline model. The baseline model was trained using the inertial signals only, while the contextual model was trained on both the inertial and ambient signals. We compared the results from the two different models using the F-measure. We trained the models on the training data and validated the model with the validation dataset. Class prediction using test data that are totally new to the model is the approach adopted to test the performance of the final model. In a bid to ensure that all the different activity classes were well-represented in each of the sets, we split the custom dataset into train and test sets using the ratio 85:15. A further split on the train set to create train and validation sets was at the ratio 80:20, giving us a 68:17:15 split among the train, validation, and test sets. Figure 6 illustrates the splits showing training (blue signals), validation (orange signals), and test (green) samples of the accelerometer x-axis for Ascending Stairs activity.

4.5. Hyperparameter Tuning

Before the two main experiments, a series of preliminary experiments were carried out to investigate the impact of several different hyperparameters on the performance of the model. Moreover, we tuned the model appropriately to prevent overfitting. For the noncontextual experiment, we investigated the performance of the model in distinguishing between simple and complex activities using a dataset with interclass similarity.
Lastly, the contextual experiment helped us evaluate the extent to which rich contextual information can help improve the model’s performance in recognizing simple and complex activities.

4.5.1. Tuning the filter and kernel

After conducting a grid search to determine the number of neurons for the CNN, the model’s performance by optimal number of filters and kernel size, respectively, were decided (Figures S5 and S6). The model performance continued to improve as the number of filters increased. A decline was, however, noticed after the 256-mark, suggesting this might be the peak. Accuracy was on a steady downward trend as the number of kernels increased, also suggesting smaller kernels give better performance. Table 2 shows the performance of filter size 64 for various numbers of kernels. We examined the interaction between the two and discovered that, once again, a larger kernel size does not appear to yield better accuracy. Kernel size 3 and filter size 64 (Figure S7) provide a good balance between classification accuracy and computational efficiency. Although there are a few other pairs with better average accuracy, for instance, filter size 256 and kernel size 2, this does come at the expense of more computational cost.

4.5.2. Window Size Segmentation Tuning

As part of the hyperparameter tuning, we investigated the optimal window size for the baseline model. For the dataset, about 128 samples were captured every 3 s from both the inertial and context sensors on the smartphone [8,68]. Some scholars suggested that sensing a complex activity from the smartphone sensors may require a longer window length compared to simple activities [15,16]. How true, and if true, how long is suitable for the dataset? It was important that we experiment with different window lengths to ascertain the optimal window segmentation required to capture the complex activities in the dataset. Using the sliding window algorithm, we investigated several different window lengths ranging between 32 and 256. Concurrently, we examined the interaction between the window length and various batch sizes on a model’s performance since the model learns from one batch of data at a time before its weight is updated [20]. The results show that increasing the window length does not guarantee superior performance (Figures S8 and S9), whereas increasing the batch size proves contrary. However, there is no significant improvement once the batch size passes the 64-mark. The drop in performance as window length increases may not have come as a surprise as some authors suggested that models containing LSTM layers suffer from poor parallelism across longer window lengths [67]. Although we did not investigate further, Chambers and Yoder [67] argue that increasing the LSTM layers can enhance the model’s capacity to learn longer window lengths. Instead, we investigated the relationship between the two parameters. The results demonstrate that that a window length of 32 and any batch size between 64, 128, and 512 are good for the proposed model (Figures S8 and S9).
We chose the smallest of the three, i.e., 64, for the subsequent experiments following similar work of [62]. Experiments show that smaller batch sizes help improve accuracy with stable convergence (Figure S10). Although batch size 64 slowed down the learning process significantly, it does, in the final stages, converge to a more stable model characterized by lower variance in generalization accuracy.

4.5.3. Mitigating Overfitting

  • Weight Decay
Regarding measures to prevent overfitting, we benchmarked model performance against weight decay ranging between 1e−6 and 1e−1. Setting the model’s weight decay at 1e−6 and 1e−5 for the CNN and the LSTM, respectively, results in suboptimal performance for the model (Figure S11).
  • Dropout Regularization
The learning performance of the model as we grid-searched for the dropout rate for the two main submodels, i.e., the CNN layer and the LSTM networks, continued to decline as we increased the dropout for the CNN layer and the LSTM networks (Figure S12). We therefore set the CNN dropout rate at 0.1 and the LSTM to none since the LSTM cells appear to perform optimally without dropout.
  • Number of Epochs
We used the Keras early stopping of training via a call-back. Several experiments were conducted to gauge the range of epochs required for the model to prevent overfitting. Consequently, we set the number of epochs to 100 with a patience of eight to add a delay before stopping. Finally, we added a second call-back called ModelCheckpoint to save the best model achieved during the entire training process.
  • Tuning for Learning Rate
The learning rate plays a substantial role in the model’s overall learning capability. Therefore, it is important to thoroughly investigate the best learning rate for the baseline model. Instead of choosing a fixed learning rate, we evaluated the learning rate between 10−8 and 10−1 using the learning rate scheduler. The model recorded its lowest learning loss at the 10−3 mark (Figure S13). While it is recommended that the learning rate should be reoptimized at the end of all the other hyperparameter tuning [64], the suboptimal learning rate remained the same before and after the hyperparameter tuning. Consequently, and based on this result, we set the learning rate at 1e−4. Once hyperparameter tuning was concluded, we were left with the baseline model, i.e., the noncontextual model. Table 3 shows the optimized parameter values used in the tuning process. In Section 5, we analyze and discuss the results of the two models, i.e., noncontextual and contextual models.

5. Result and Discussion

In the previous section, we analyzed the impact of several different hyperparameters on the performance of the model. We also discussed a series of tuning to prevent the model from overfitting, which finally led us to the baseline model. The baseline model, which doubles as the noncontextual model, was trained using the traditional inertial sensing signals from three axes, each of accelerometer, gyroscope, and magnetometer sensors, altogether making nine channels of signals. In the second experiment, while keeping all parameters at optimal settings (as shown in Table 3), we trained another model using a combination of traditional inertial sensing signals and additional contextual data from the ambient sensors, resulting in 11 channels of signals (two additional channels for audio and light sensors).
We tagged the model from the second experiment contextual simply because it uses contextual data to create a context-aware model. In this section, using the hold-out test set, we analyze results from these models by measuring the significance of performance differences and investigate how accurate the models are in generalizing simple and complex activities.

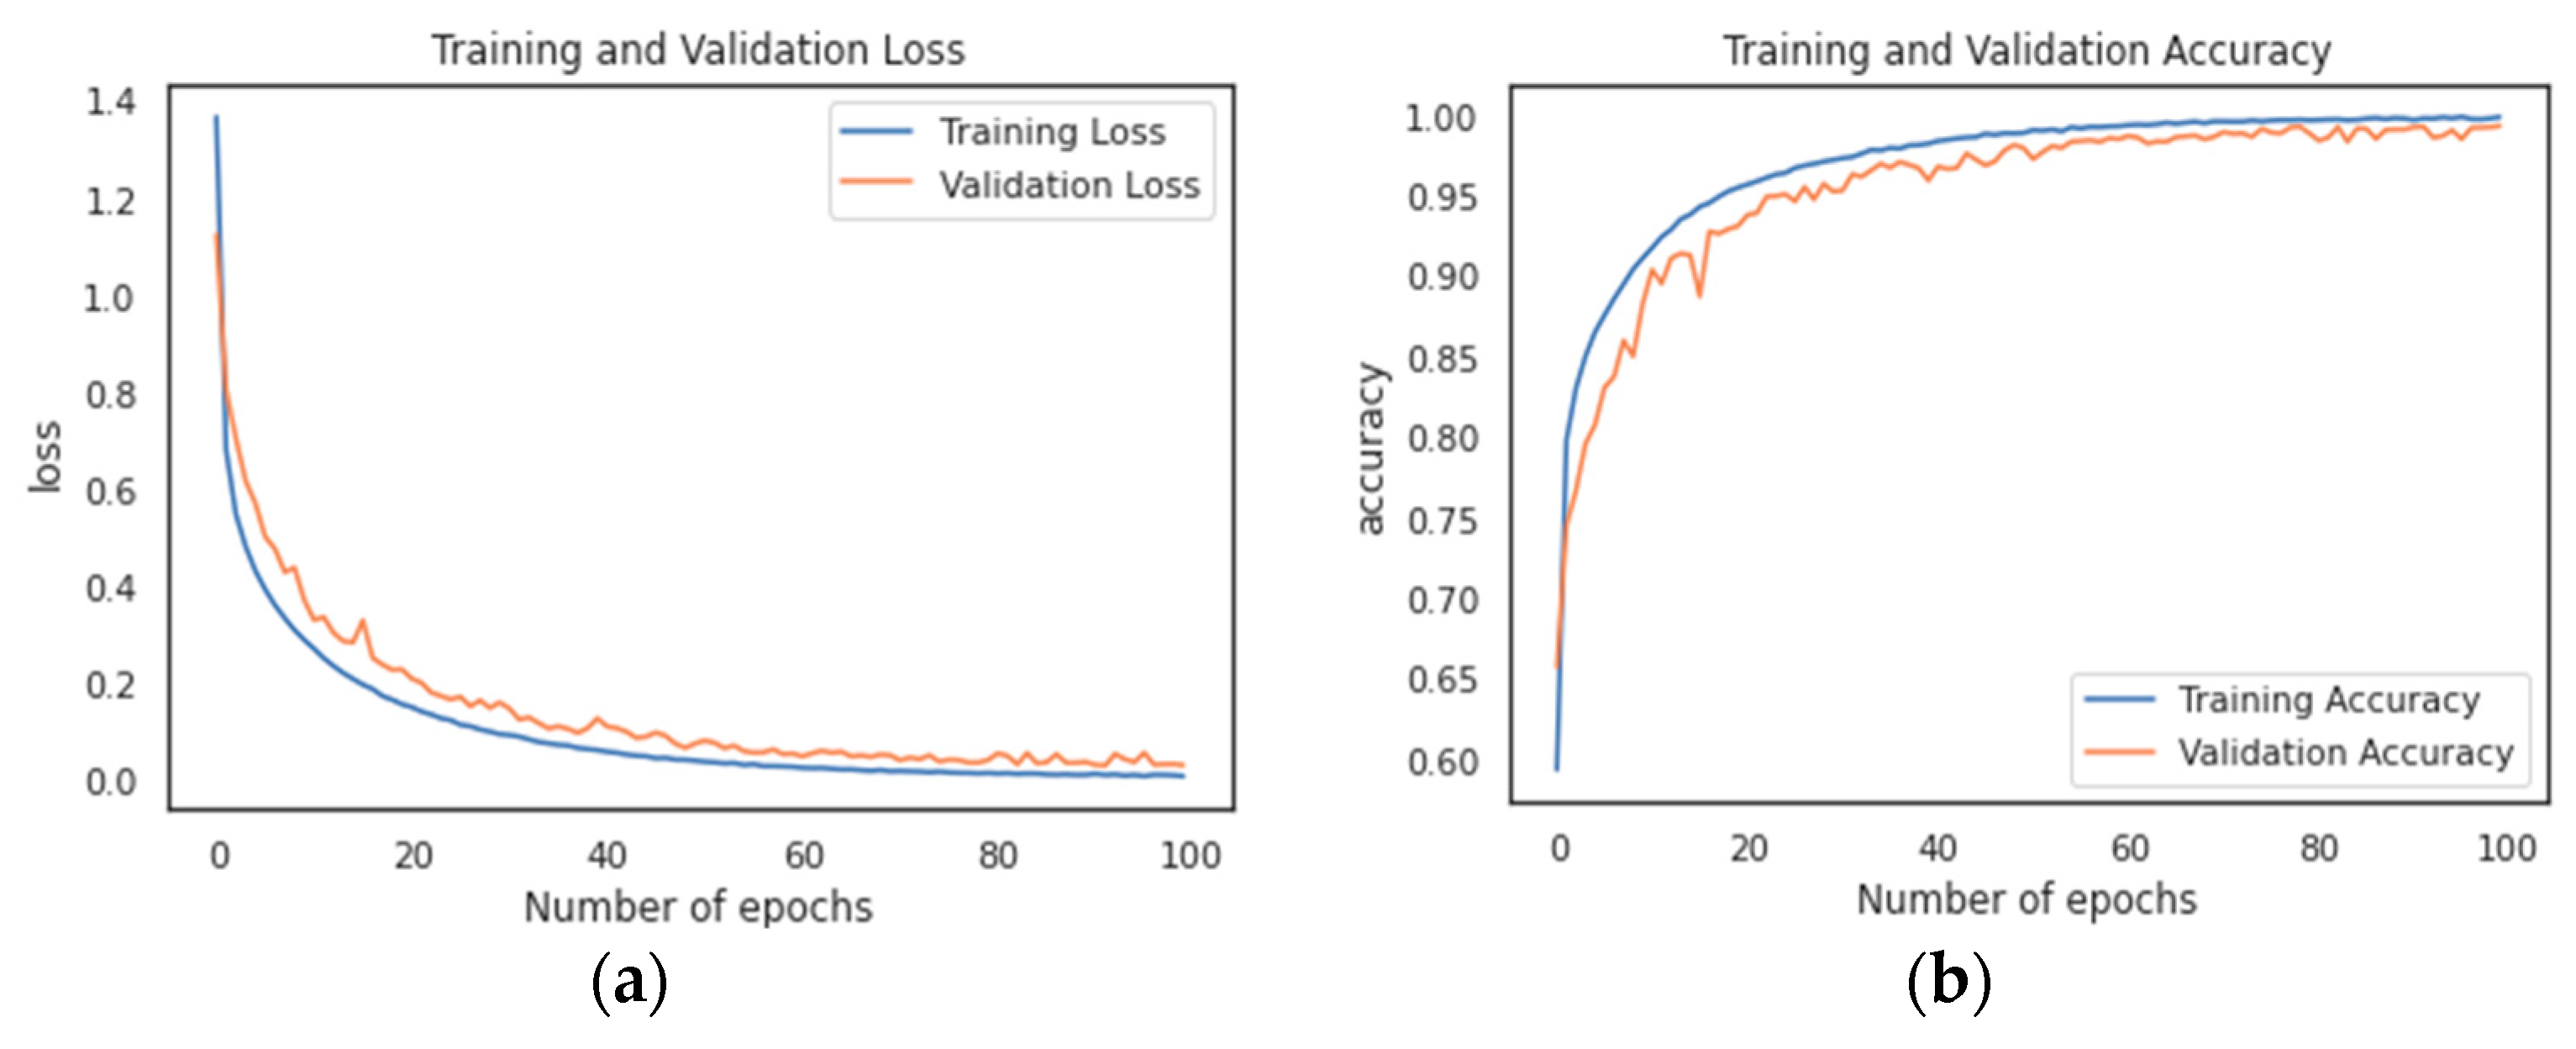
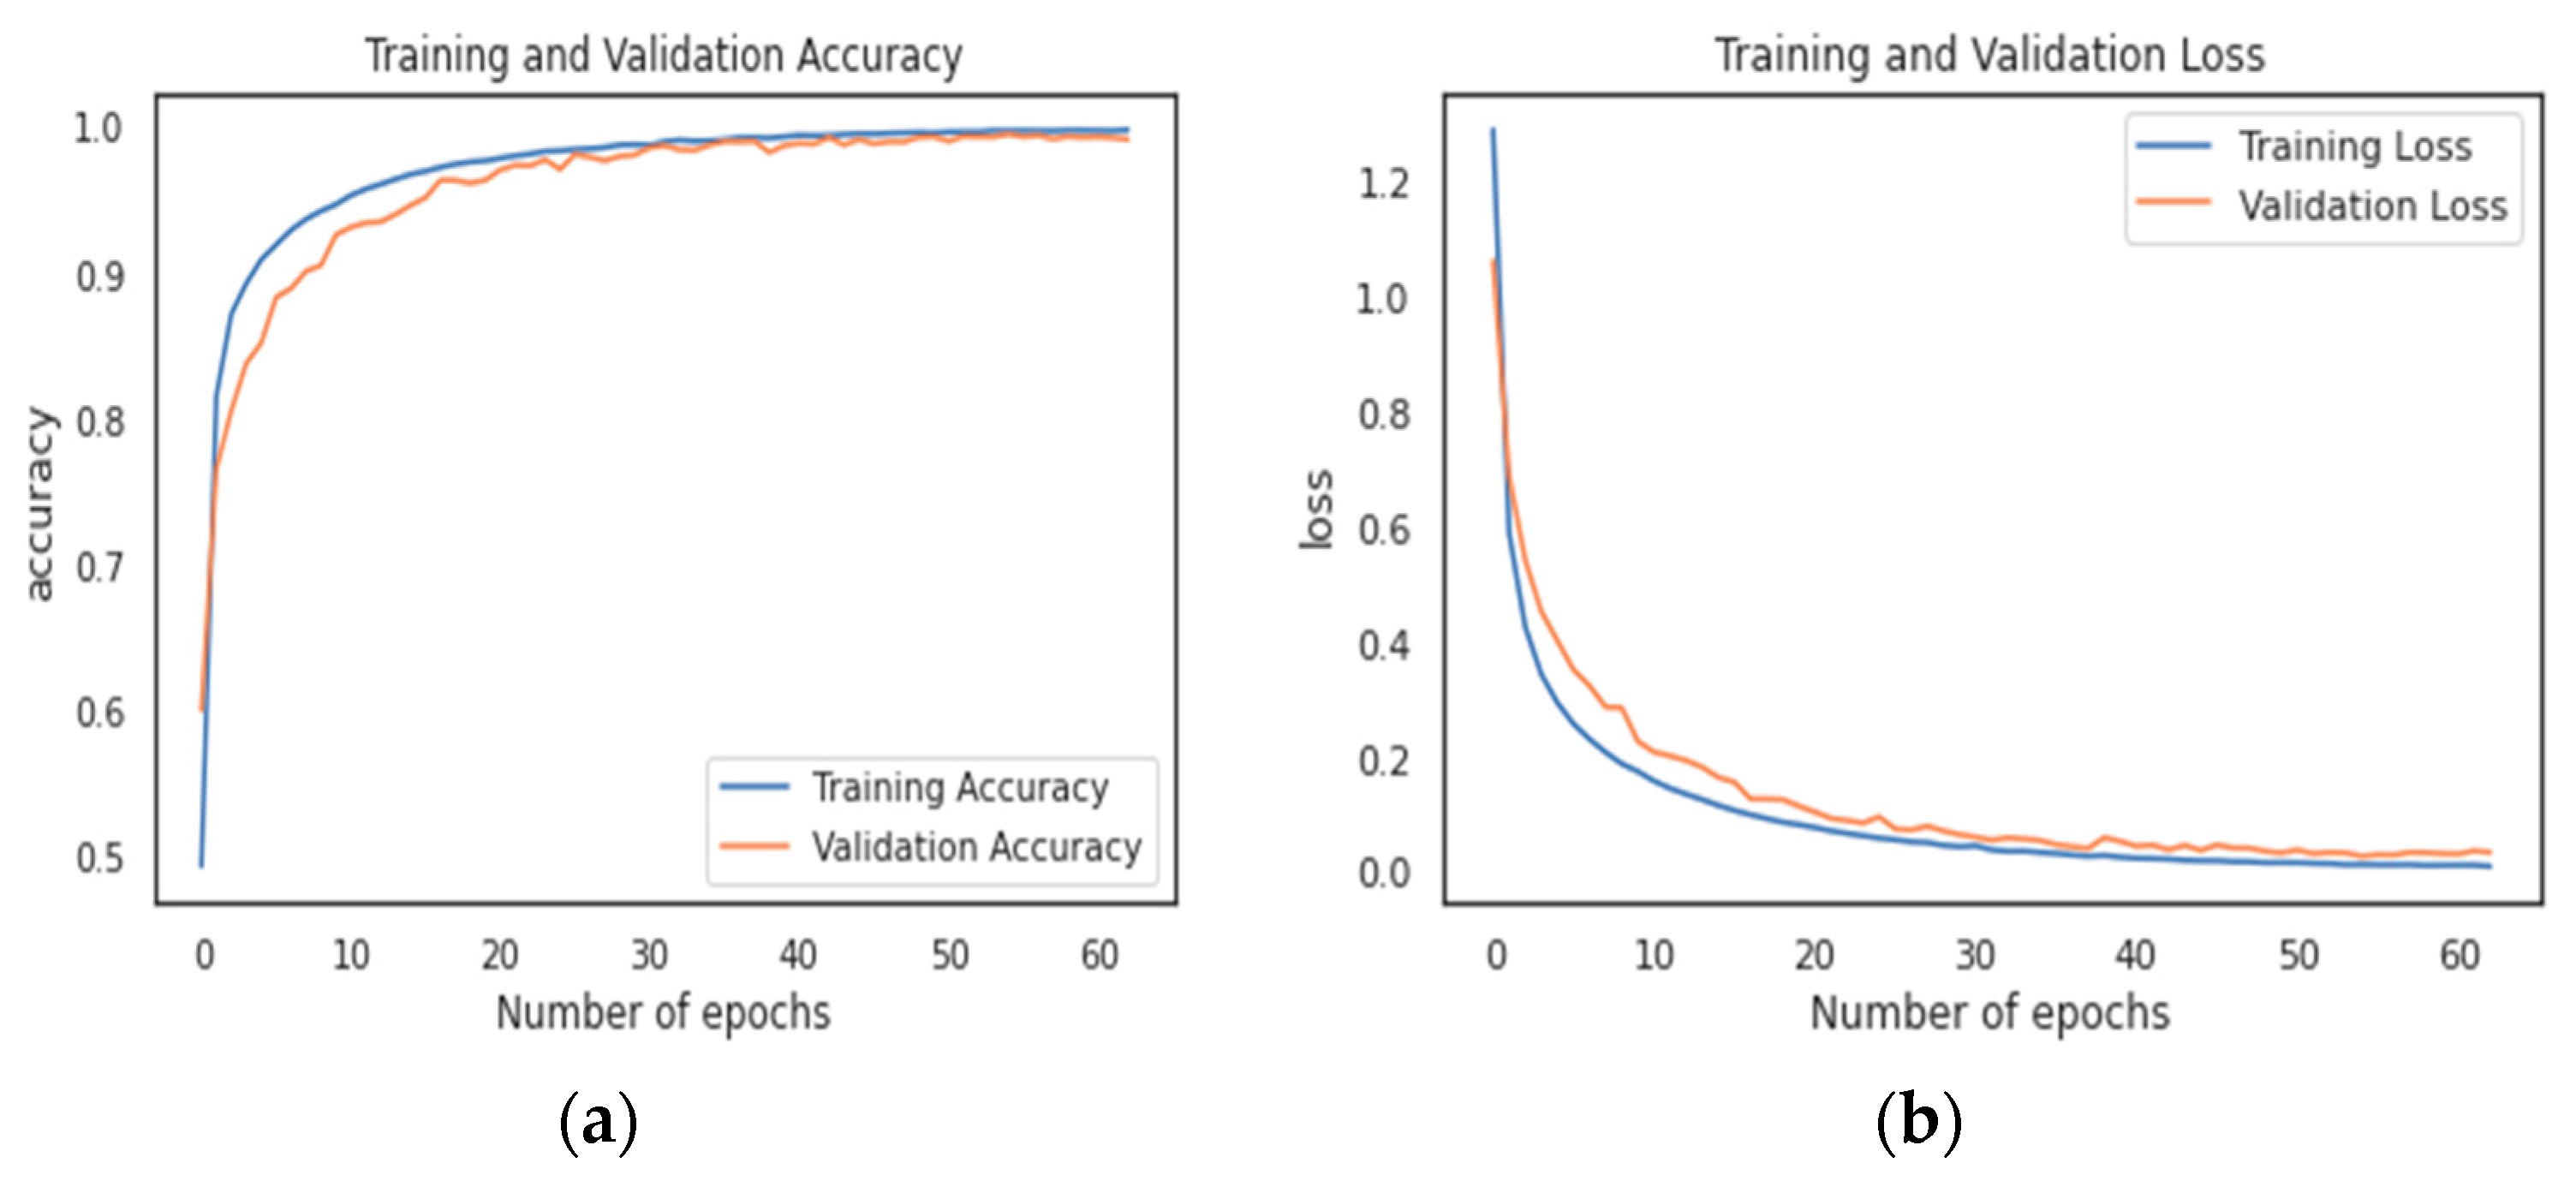
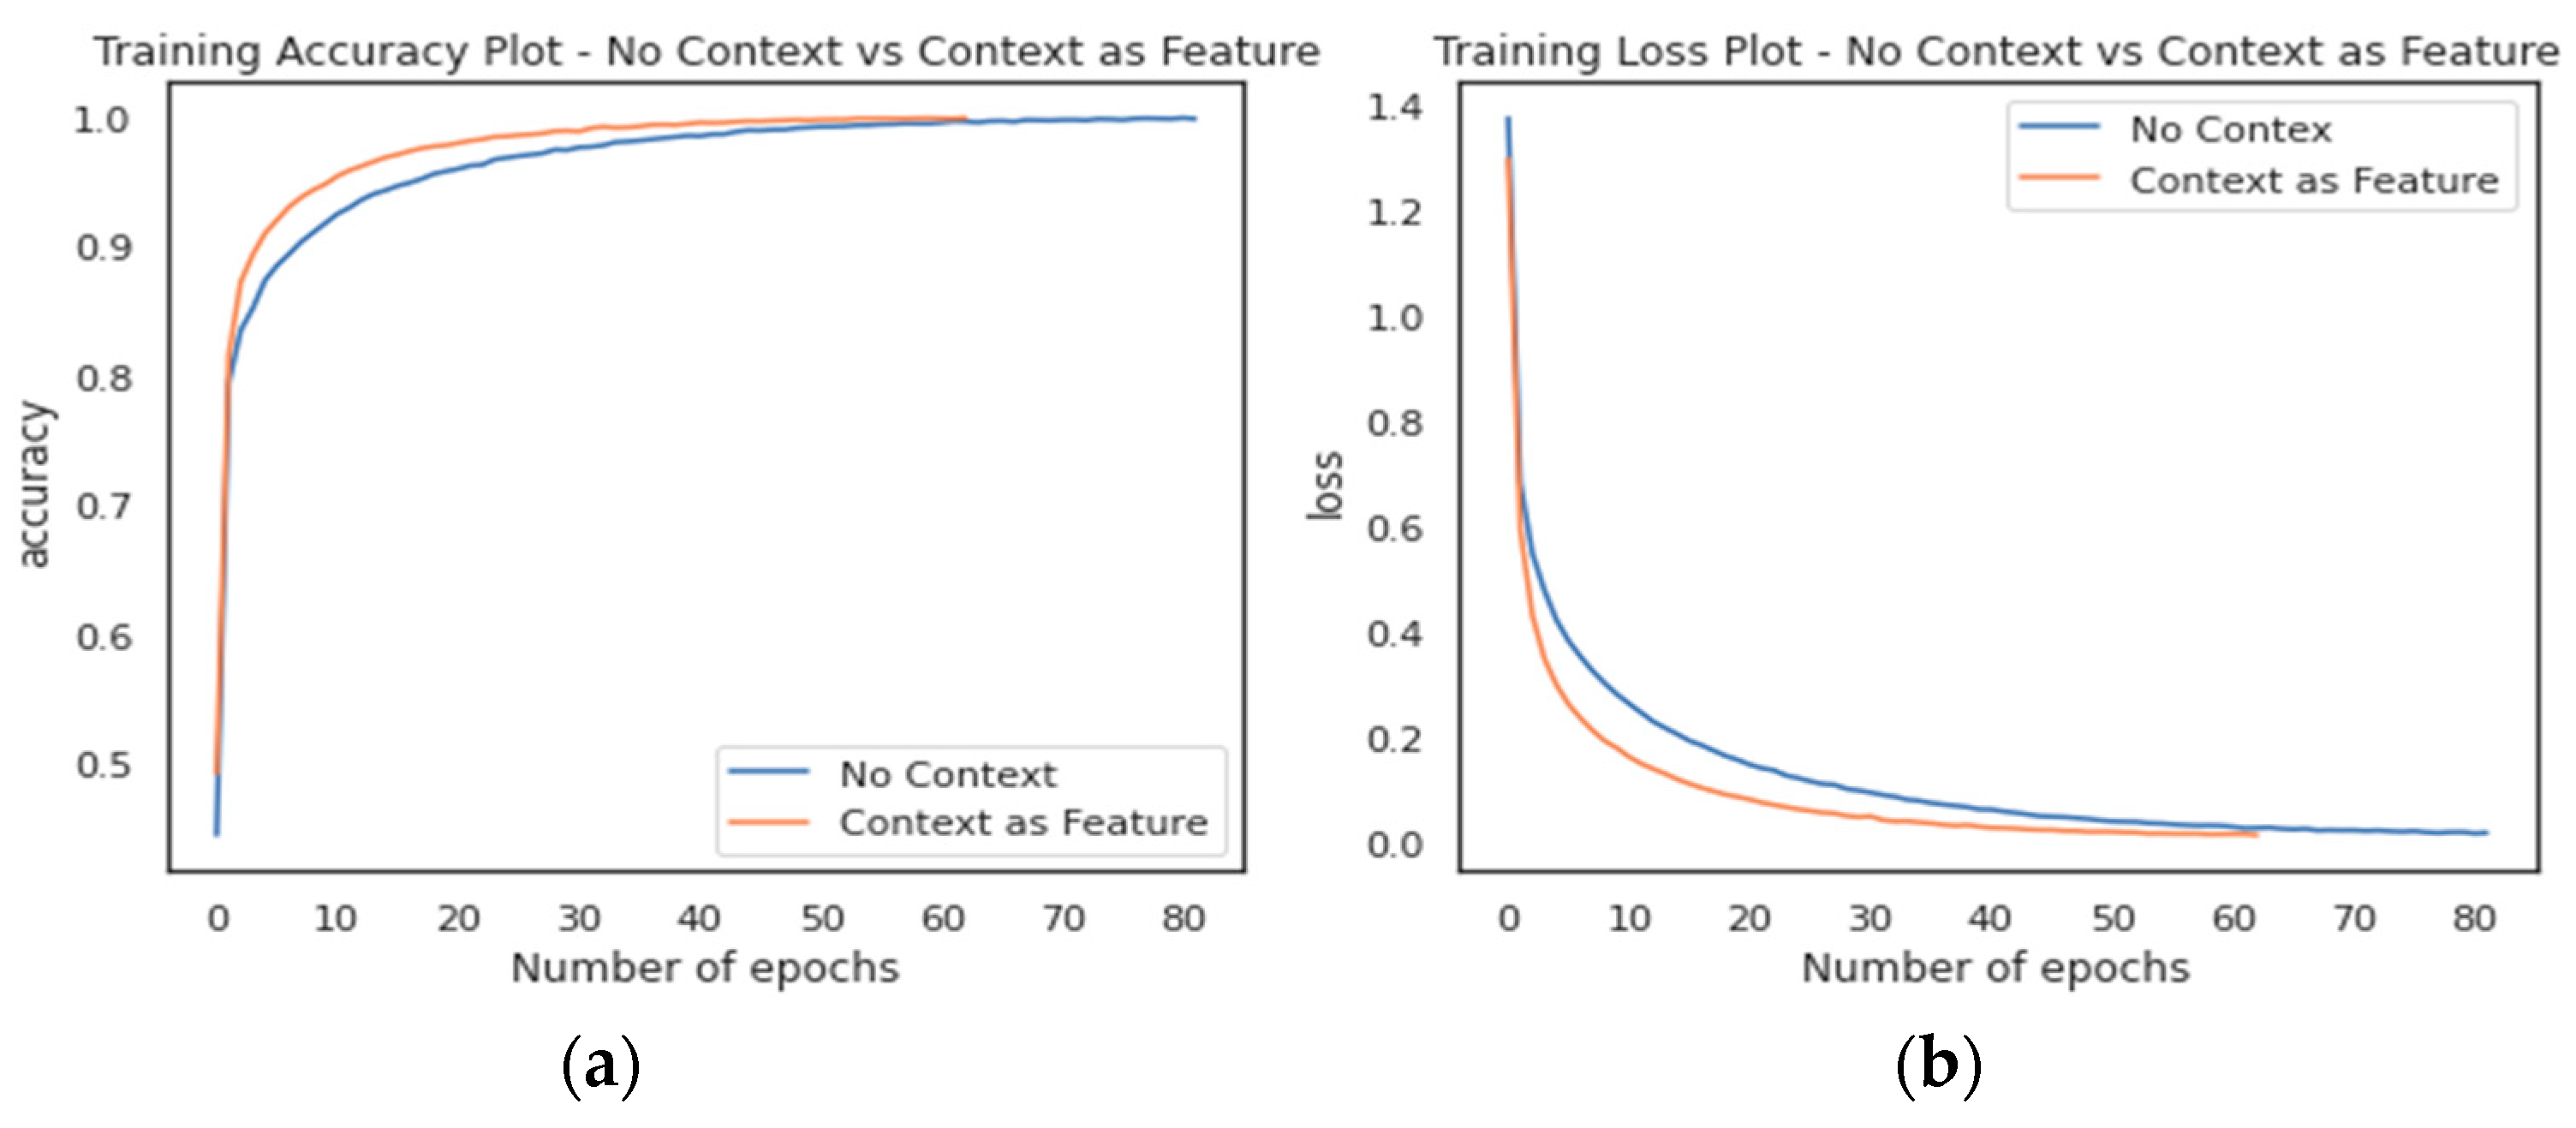
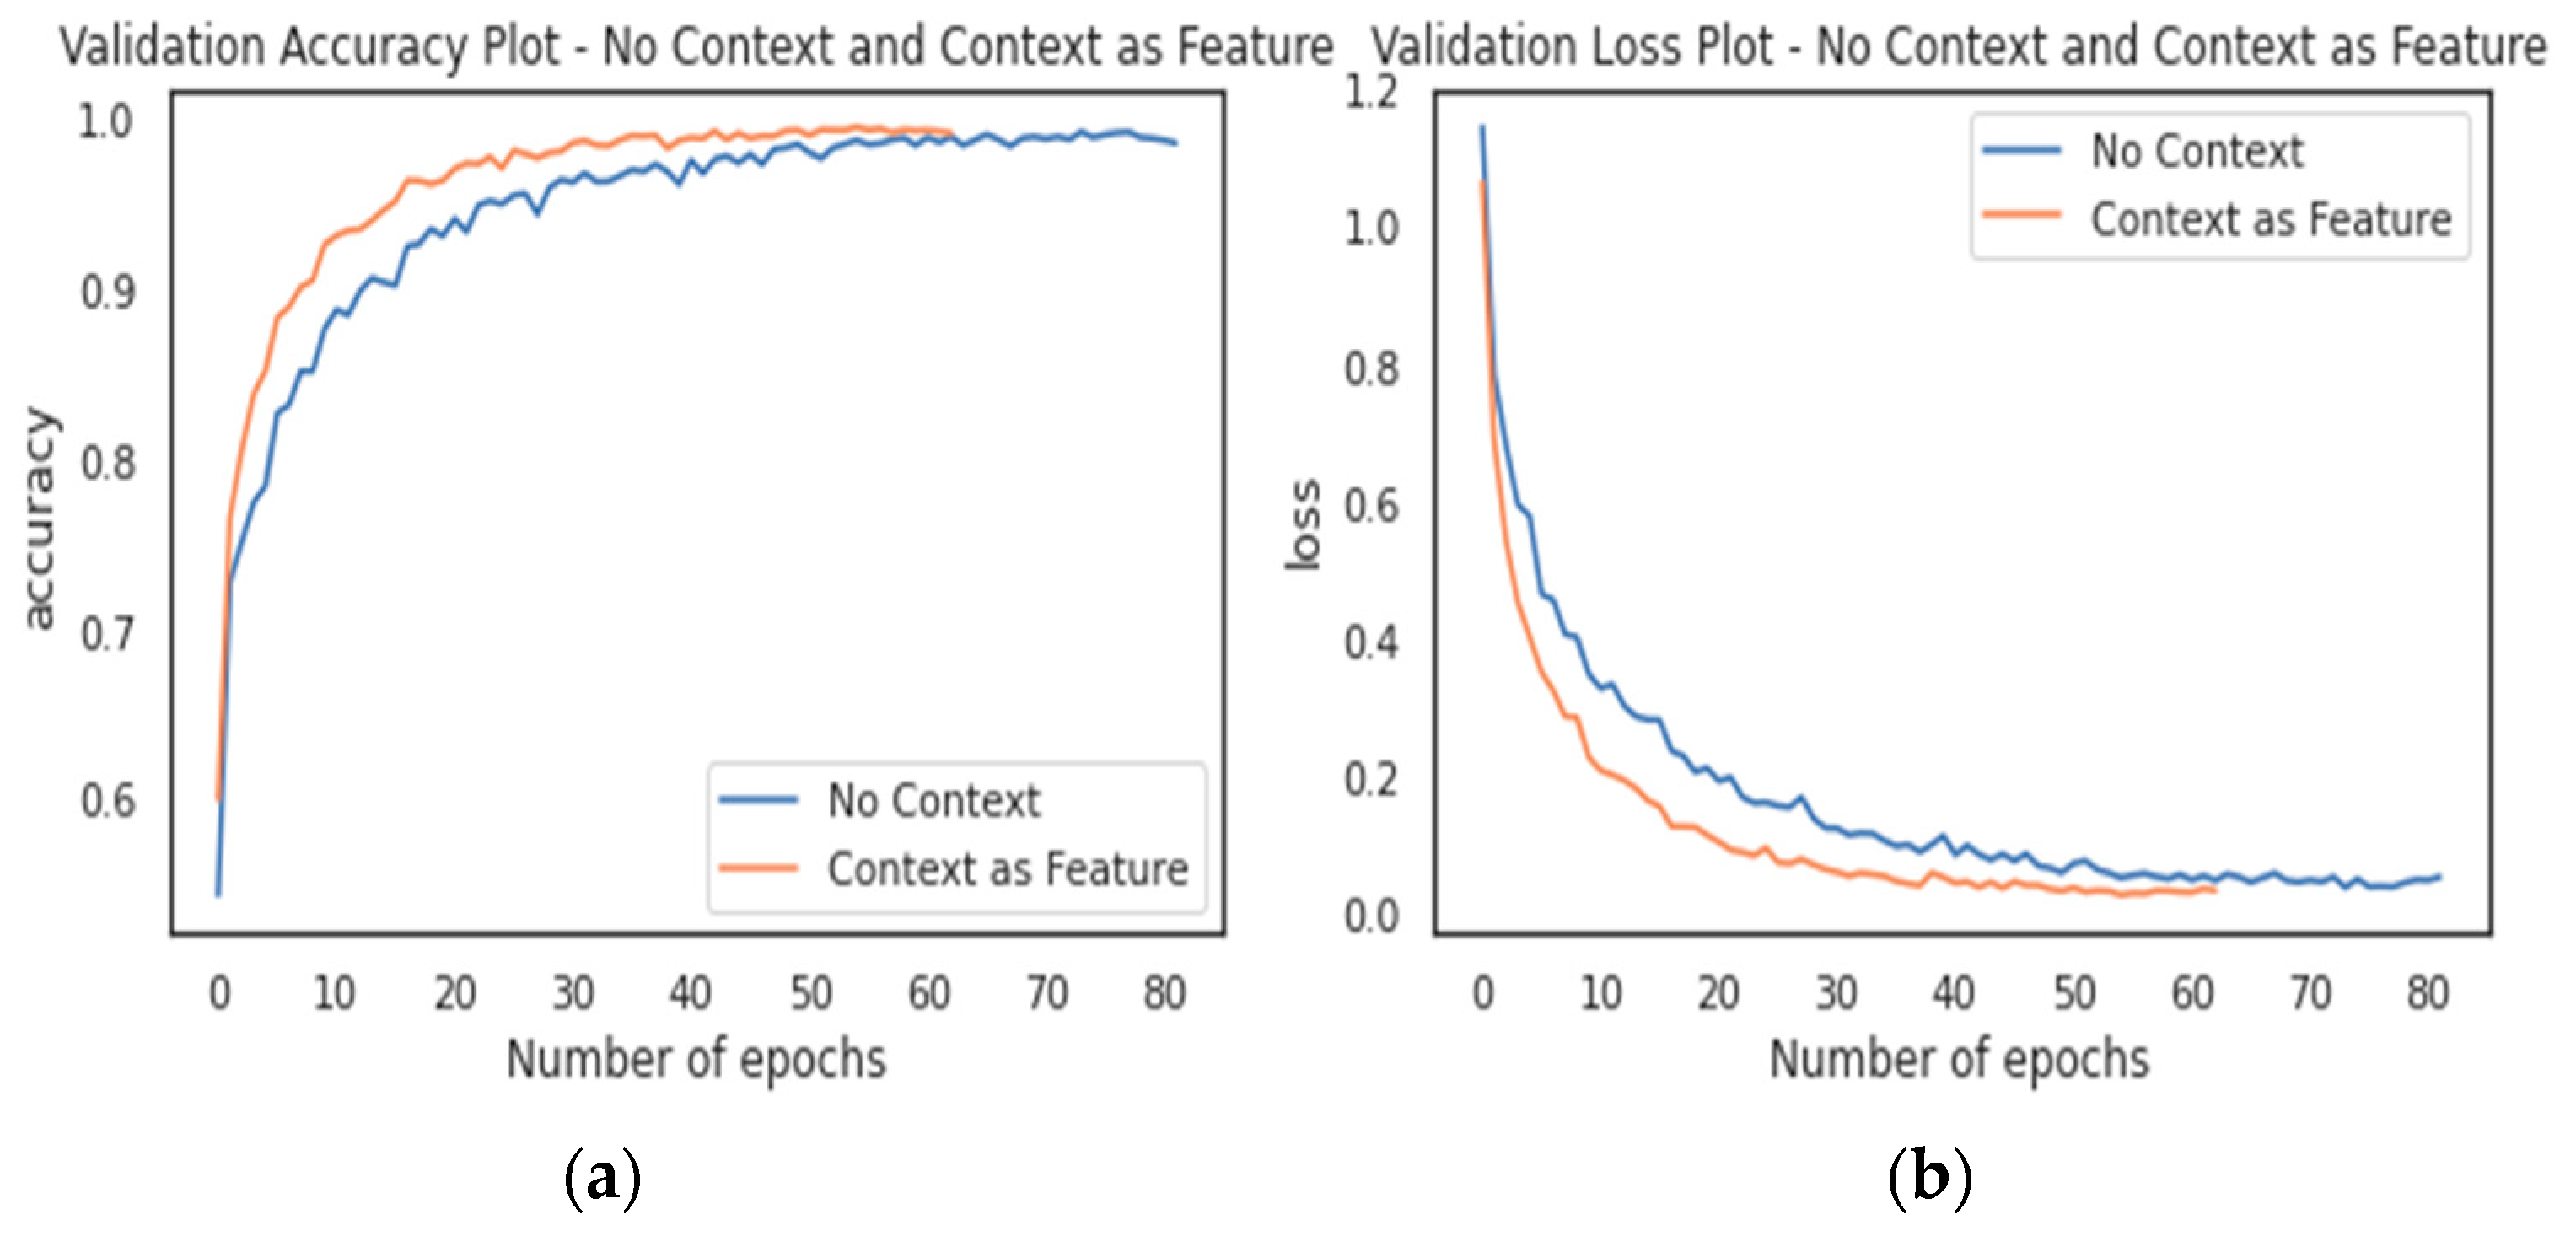
5.1. Analysis of Training and Validation Data

The noncontextual model started converging after about 60 epochs as indicated in the accuracy and loss plots in Figure 7a,b. Compared to the noncontextual, the contextual model as shown in Figure 8a, b converged much earlier at about 30 epochs.
Although it took the contextual model about 161 s to be interrupted by the early-stopping call-back, the noncontextual model ran for another 100 s more before being interrupted. This is, however, surprising given that the contextual model is exposed to more input signals and is expected to take a longer time to train. This suggests that the contextual model was faster at discovering the temporal relatedness between the signals using the additional ambient signals. Although given the stochastic nature of deep learning algorithms, convergence as a function of number of epochs sometimes varies [24].
Moreover, the training accuracy and loss plots (Figure 9) show how the two models compare during training. Figure 9 clearly shows that the contextual model, for most of the training process, continues to outperform the noncontextual model. Although the two models seemed to match one another in performance toward the tail end, at the point in time the noncontextual model trained better. In Figure 10, we compare the two models’ performance with the validation data. Once more, the contextual model outperforms the noncontextual model in the first 10 epochs and even throughout the validation process confirming that the additional input signals from the context sensors produced superior performance to the noncontextual model.
While neural networks are known to be robust to noise, model accuracy often improves when time-series data are preprocessed for noise reduction and smoothing using median filters [32].

5.2. Recognition Accuracy for Simple and Complex Activities

The confusion matrices in Figure 11 and Figure 12 provide insights into the classification errors by the noncontextual and contextual models, respectively. This result is based on the performance of the models’ classifier after being evaluated on the hold-out test dataset that was never used during the training and validation phases. From these figures, accuracies of the models were computed as shown in Table 4 and Table 5 for overall performance and performance of the activity’s categories. The results clearly demonstrate that context aware HAR models produce better recognition accuracy than the noncontextual models.
Table 5 provides the percentage accuracy by class using the macro average F-score.
It is not surprising to see the weighted average or the micro-average having higher percentages; this is often due to the skewness in the dataset. As earlier noted in Section 5.1, the macro-average percentage ensures that, despite the imbalanced dataset, each class has equal representation in the overall accuracy percentage considering the size of class samples. Overall, the contextual model achieved 98.72% accuracy, while the noncontextual model trailed behind at 96.19%, indicating that the rich context data provided by the ambient sensors are instrumental to the improved performance. Table 6 shows that there is about 2.62% overall model improvement by infusing context data into the models. As shown in Table 4, for both simple and complex activities, the context-aware model produced higher recognition accuracies.
From Figure 11, the noncontextual model achieved an outstanding recognition accuracy of 98.7% on simple activities and a modest 93.7% on complex activities. However, the contextual model was able to achieve a state-of-the-art performance in both simple and complex activities recording an average performance of 99.6% and 97.8, respectively. Both models were able to distinguish between several different simple activities effectively. Although the two models recorded their individual lowest accuracies for simple activities in the Jogging and Sitting labels, the contextual model still managed to record at least 99% in these two classes (Table 6). In the complex activity category, the noncontextual model performed woefully generalizing the Mountain Climbing activity with a 77.4% accuracy compared to 98.1% by the contextual model. Interestingly, the two models performed equally well in recognizing Driving activity. Nevertheless, the contextual model did not perform less in any activity class under the simple and complex activity categories (Figure 12).
Instead, it continues to prove that a model trained with rich contextual data from ambient sensors can consistently outperform the same model trained with only traditional inertia signals.
To answer the research question regarding the improvement observed, the contextual model, going by Table 5, demonstrated about 0.91% and 4.38% improvement in simple and complex activities, respectively, compared to the noncontextual model. To test the hypothesis that combining inertial and environmental sensing signals would produce better performance for the hybrid model, the significance of the performance differences was computed using a pairwise t-test at a 5% significance level. To have adequate samples to carry out the hypothesis tests, two models were trained and evaluated repeatedly 20 times. Each time, we noted the macro-average F-score for both models. Nevertheless, we obtained an extremely small p-value, which prompted us to reject the null hypothesis that the noncontextual model is at par with the contextual average performance. In other words, with a 95% confidence interval, the noncontextual model’s mean performance F-score was significantly lower than that of the contextual model. As a result, we conclude that the average generalization ability of the contextual model is superior to that of the noncontextual model. Given that both models share the same architecture, matching parameters, and training environment, we can only attribute this improvement to the main difference between the two models, which is the additional signal input. The contextual data proved to be the distinguishing factor in this study. The contextual model, despite the additional sensor modalities, was able to achieve convergence well before the noncontextual model. The noncontextual model had a significant 2.77% improvement in generalization accuracy compared to the work by [71] using traditional machine learning models. Their model architecture did not combine LSTM with CNN as we did; it only managed to achieve about 93.6% accuracy. Another similar work in [55] used a hybrid model but without context-aware models and achieved an overall performance of 96.71% compared to the 98.72% accuracy of our context-aware models. In addition, the work in [56] achieved up to 99.74% accuracy; however, their conclusion is that even though their model is effective for both complex and simple activities, but it especially more suitable for complex activities, whereas ours is not only effective but also more suitable for both complex and simple activities. The inclusion of LSTM as well as context awareness in the network models clearly demonstrates a significant improvement in the performance of the models.

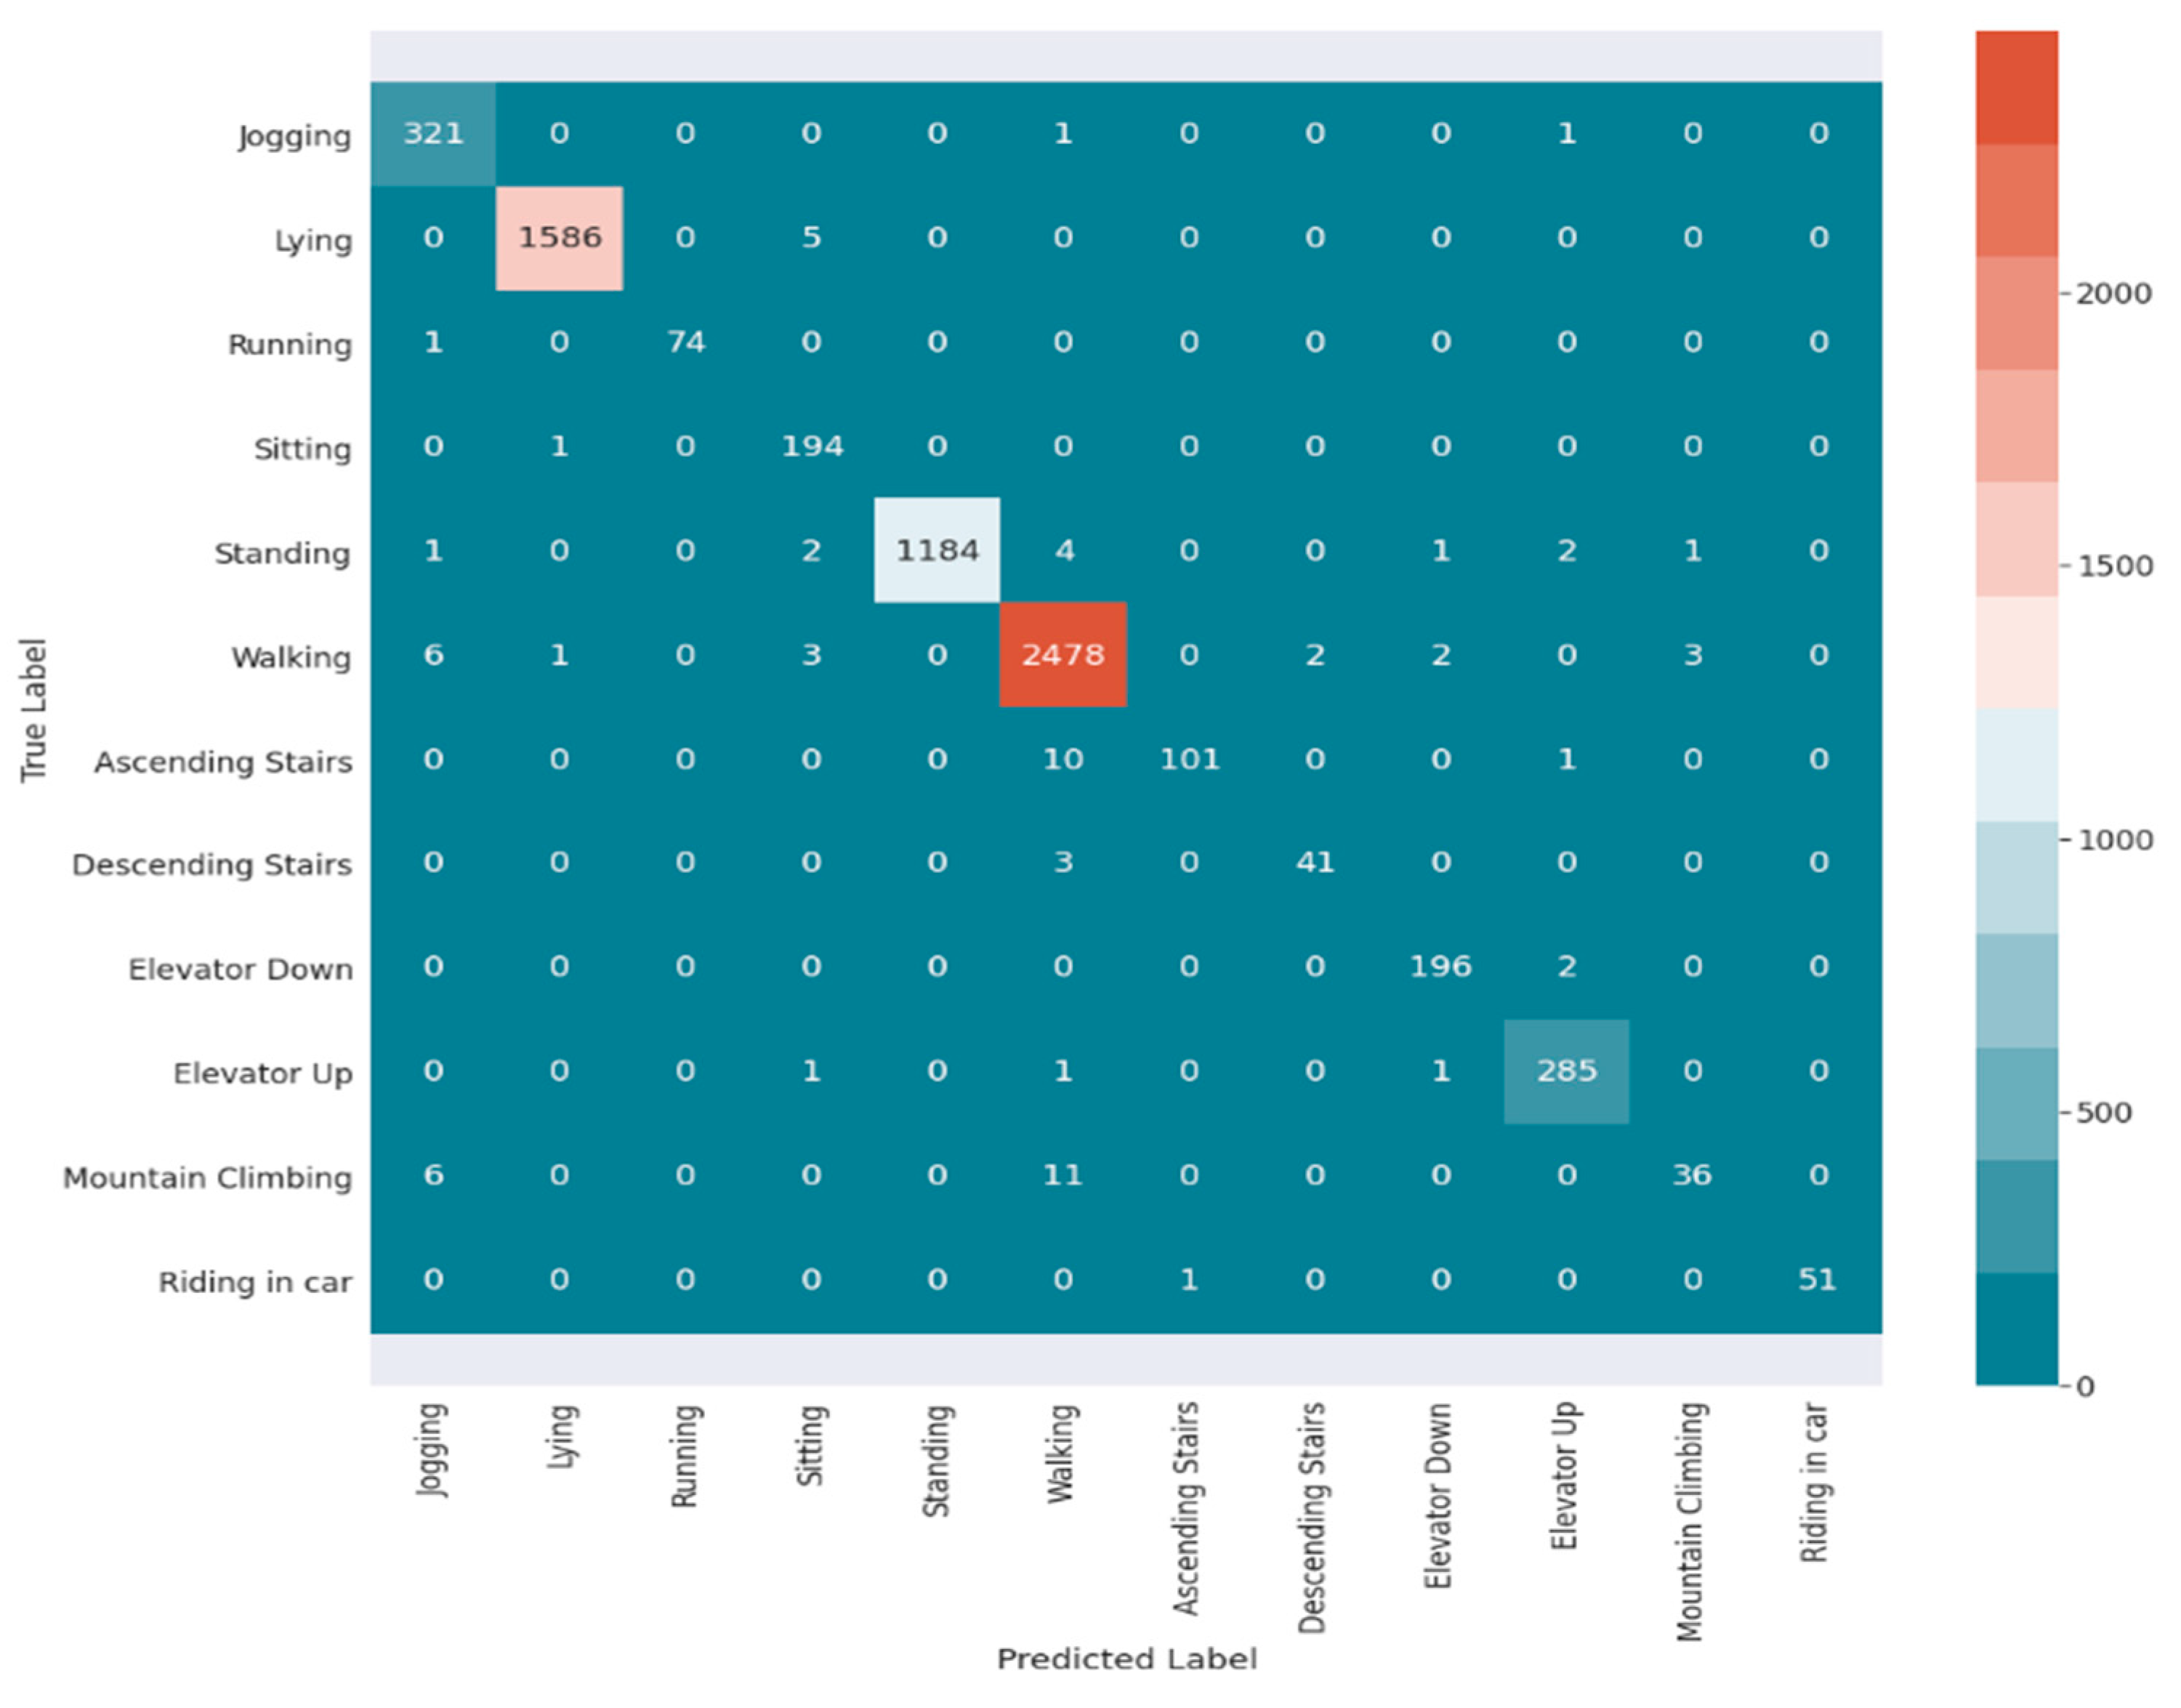
5.3. Interclass Similarity Analysis

In this section, experimental evidence that details performance results concerning prevalent interclass similarity issues between simple and complex activities is presented. Mindful of the fact that it is not uncommon for models to experience poor classification in the presence of highly correlated input data [31] and using Table 1 in Section 4 as a guide, we compared how the two models performed with activities that appear similar. The noncontextual model, for example, recorded the highest classification error with the Mountain Climbing activity. A quick look at the confusion matrix (Figure 11) for the noncontextual model reveals that the model confuses the Mountain Climbing activity with Walking at least once every three tries. The model also had some difficulties with Ascending and Descending Stairs, which it often confuses with Walking. This is not surprising since Walking is obviously a sub activity of these other complex activities (Table 1). In the case of the contextual model, there was a slight improvement in the classification error regarding the Ascending and Descending stairs being confused with Walking. With about 27% improvement compared to the noncontextual model, the contextual model recorded its single biggest generalizability improvement in the Mountain Climbing activity. Once again, the contextual data helped the model minimize the interclass similarity confusion during classification.
Other interclass similar activities, such as Standing, Elevator Up and Down, Driving, and Sitting, do not seem to pose any challenge to either of the models. Following the recommendation from [31] to combine multiple sensor modalities was instrumental in addressing the interclass similarity challenge. Together, this indicates that models trained with both inertial and context data consistently outperform models trained with only inertial data. In the next section, we discuss the conclusion and recommendations for future work.

6. Conclusions and Future Work

In this article, we investigated the benefits of combining environmental sensor signals as contextual data with traditional inertial sensing data to distinguish between simple and complex human activities of daily living. We designed and implemented a context-aware hybrid deep learning model that can discriminate between similar class labels by adding rich contextual signals. To the best of our knowledge, this is the first study to have focused on utilizing raw sensing data collected exclusively from smartphone sensors to generalize simple and complex human activities using contextual information.
Two versions of the CNN–LSTM hybrid model were designed and implemented: the noncontextual and contextual CNN–LSTM models. The noncontextual model represented the baseline model for experimental evaluation purposes, while the contextual model was the improved model. The experimental results confirm that the context-based CNN–LSTM model produced better overall recognition accuracy (98.2%) than the noncontextual CNN–LSTM model’s accuracy of 96.19%. Similarly, for simple and complex activities, the contextual model achieved average overall F-scores of 99.6% and 97.8%, respectively, compared to the noncontextual (baseline) model. This is a significant result because it answers the research question “can rich contextual information infused into the traditional inertial sensing data improve the accuracy of deep hybrid learning models in generalizing simple and complex activities of daily living while also addressing the interclass similarity problems?” A pairwise t-test to compare the performance difference between the two models proved significant, further confirming that the generalization performance of context-aware HAR models is better compared to noncontextual models.
Finally, in the future, we plan to deploy the model on a mobile phone to evaluate its effectiveness in helping people track and collect time use data (TUD). We also plan to tweak the architecture of the CNN–LSTM hybrid model to include bidirectional LSTM stacks, multiheaded CNNs, and perhaps a deep multitasking learning model to improve the overall recognition accuracy for complex activities. This will require expanding the dataset by collecting a multilabel classification dataset using the smartphone exclusively. In this dataset, we will have the opportunity to annotate, with wide-ranging contextual data, several simple activities that make up a specific complex activity, e.g., Sitting, Eating, and Drinking to represent a complex activity, such as dining with friends. Given the current lack of rich contextual datasets collected entirely over the smartphone sensors, this will allow us to test several different combinations of rich contextual data for developing a fine-grain complex activity recognition system.

Supplementary Materials

The following supporting information can be downloaded at: https://www.mdpi.com/article/10.3390/app12189305/s1.

Author Contributions

Conceptualization, A.O. (Abayomi Otebolaku); methodology, A.O. (Abayomi Otebolaku) and A.O. (Adebola Omolaja); software, A.O. (Adebola Omolaja); validation, A.O. (Adebola Omolaja) and A.O. (Abayomi Otebolaku); formal analysis, A.O. (Adebola Omolaja); investigation, A.O. (Adebola Omolaja) and A.O. (Abayomi Otebolaku); resources, A.O. (Abayomi Otebolaku); data curation, A.O. (Abayomi Otebolaku), A.O. (Adebola Omolaja), and A.A.; writing—original draft preparation, A.O. (Adebola Omolaja) and A.O. (Abayomi Otebolaku); writing—review and editing, A.O. (Adebola Omolaja), A.O. (Abayomi Otebolaku), and A.A.; visualization, A.O. (Adebola Omolaja); supervision, A.O. (Abayomi Otebolaku); project administration, A.O. (Abayomi Otebolaku); All authors have read and agreed to the published version of the manuscript.

Funding

This research received no external funding.

Institutional Review Board Statement

Not applicable.

Informed Consent Statement

Not applicable.

Data Availability Statement

The dataset used in this work is available https://github.com/debosky007/S2C_HAR/blob/main/S2C_cnn_lstm.ipynb, and the complete implementation code of the system is also available https://drive.google.com/file/d/1cU_k3ZYQPTAI6f9jXCMoz6585dnw7hl1/view?ts=630a02b7.

Conflicts of Interest

The authors declare no conflict of interest.

References

  1. Alawneh, L.; Al-Ayyoub, M.; Al-Sharif, Z.A.; Shatnawi, A. Personalized human activity recognition using deep learning and edge-cloud architecture. J. Ambient Intell. Humaniz. Comput. 2022. [Google Scholar] [CrossRef]
  2. Chen, K.; Zhang, D.; Yao, L.; Guo, B.; Yu, Z.; Liu, Y. Deep Learning for Sensor-based Human Activity Recognition: Overviews and Challenges and Opportunities. ACM Comput. Surv. 2022. [Google Scholar] [CrossRef]
  3. Number of Smartphone Subscriptions. Available online: https://www.statista.com/statistics/330695/number-of-smartphone-users-worldwide (accessed on 15 September 2022).
  4. Jalal, A.; Kim, J.T.; Kim, T. Development of a Life Logging System via Depth Imaging-based Human Activity Recognition for Smart Homes. In Proceedings of the 8th International Symposium on Sustainable Healthy Buildings, Seoul, Korea, 19 September 2012; pp. 91–104. [Google Scholar]
  5. Foubert, N.; McKee, A.M.; Goubran, R.A.; Knoefel, F. Lying and sitting posture recognition and transition detection using a pressure sensor array. In Proceedings of the 2012 IEEE International Symposium on Medical Measurements and Applications Proceedings, Budapest, Hungary, 18–19 May 2012; pp. 1–6. [Google Scholar] [CrossRef]
  6. Gu, F.; Chung, M.H.; Chignell, M.; Valaee, S.; Zhou, B.; Liu, X. A Survey on Deep Learning for Human Activity Recognition. ACM Comput. Surv. 2022, 54, 1–34. [Google Scholar] [CrossRef]
  7. De Pessemier, T.; Dooms, S.; Martens, L. Context-aware recommendations through context and activity recognition in a mobile environment. Multimed. Tools Appl. 2014, 72, 2925–2948. [Google Scholar] [CrossRef]
  8. Otebolaku, A.M.; Andrade, M.T. Context-aware media recommendations for smart devices. J. Ambient Intell. Humaniz. Comput. 2015, 6, 13–36. [Google Scholar] [CrossRef]
  9. Thakur, D.; Biswas, S.; Ho, E.S.L.; Chattopadhyay, S. ConvAE-LSTM: Convolutional Autoencoder Long Short-Term Memory Network for Smartphone-Based Human Activity Recognition. IEEE Access 2022, 10, 4137–4156. [Google Scholar] [CrossRef]
  10. Grzeszick, R.; Lenk, J.M.; Rueda, F.M.; Fink, G.A.; Feldhorst, S.; Hompel, M.T. Deep neural network based human activity recognition for the order picking process. In Proceedings of the Proceedings of the 4th international Workshop on Sensor-based Activity Recognition and Interaction, Rostock, Germany, 21–22 September 2017. [Google Scholar] [CrossRef]
  11. Bulling, A.; Blanke, U.; Schiele, B. A tutorial on human activity recognition using body-worn inertial sensors. ACM Comput. Surv. 2014, 46, 1–33. [Google Scholar] [CrossRef]
  12. Wang, J.; Chen, Y.; Hao, S.; Peng, X.; Hu, L. Deep learning for sensor-based activity recognition: A survey. Pattern Recognit. Lett. 2019, 119, 3–11. [Google Scholar] [CrossRef] [Green Version]
  13. Hasan, H.; Roy-Chowdhury, A.K. Context Aware Active Learning of Activity Recognition Models. In Proceedings of the 2015 IEEE International Conference on Computer Vision (ICCV), Santiago, Chile, 7–13 December 2015; pp. 4543–4551. [Google Scholar] [CrossRef]
  14. Liu, Y.; Nie, L.; Han, L.; Zhang, L.; Rosenblum, D.S. Action2Activity: Recognizing complex activities from sensor data. In Proceedings of the International Joint Conference on Artificial Intelligence, Buenos Aires, Argentina, 25–31 July 2015; pp. 1617–1623. [Google Scholar]
  15. Peng, L.; Chen, L.; Ye, Z.; Zhang, Y. AROMA: A Deep Multi-Task Learning Based Simple and Complex Human Activity Recognition Method Using Wearable Sensors. Proc. ACM Interact. Mobile Wearable Ubiquitous Technol. 2018. [Google Scholar] [CrossRef]
  16. Cheng, W.; Erfani, S.; Zhang, R.; Kotagiri, R. Predicting Complex Activities from Ongoing Multivariate Time Series. In Proceedings of the Twenty-Seventh International Joint Conference on Artificial Intelligence, Stockholm, Sweden, 13–19 July 2018; pp. 3322–3328. [Google Scholar] [CrossRef]
  17. Dharaskar, V.; Thakare, V.M. PCA based optimal ANN classifiers for human activity recognition using mobile sensors data. In Proceedings of the First International Conference on Information and Communication Technology for Intelligent Systems: Volume 1; Springer: Berlin, Germany, 2016; pp. 429–436. [Google Scholar]
  18. Brownlee, J. Deep Learning for Time Series Forecasting: Predict the Future with MLPs, CNNs and LSTMs, Retrieved from Machine Learning Mastery. Available online: https://machinelearningmastery.com/deep-learning-for-time-series-forecasting (accessed on 20 October 2021).
  19. Yang, J.B.; Nguyen, M.N.; San, P.P.; Li, X.L.; Krishnaswamy, S. Deep convolutional neural networks on multichannel time series for human activity recognition. In Proceedings of the 24th International Conference on Artificial Intelligence, Buenos Aires, Argentina, 25–31 July 2015. [Google Scholar]
  20. Irfan, S.; Anjum, N.; Masood, N.; Khattak, A.S.; Ramzan, N. A Novel Hybrid Deep Learning Model for Human Activity Recognition Based on Transitional Activities. Sensors 2021, 21, 8227. [Google Scholar] [CrossRef]
  21. Khan, I.U.; Afzal, S.; Lee, J.W. Human Activity Recognition via Hybrid Deep Learning Based Model. Sensors 2022, 22, 323. [Google Scholar] [CrossRef] [PubMed]
  22. Sainath, T.N.; Vinyals, O.; Senior, A.; Sak, H. Convolutional, Long Short-Term Memory, fully connected Deep Neural Networks. In Proceedings of the 2015 IEEE International Conference on Acoustics, Speech, and Signal Processing (ICASSP), South Brisbane, Australia, 19–24 April 2015; pp. 4580–4584. [Google Scholar] [CrossRef]
  23. Aggarwal, J.K.; Ryoo, M.S. Human Activity Analysis: A Review. ACM Comput. Surv. 2011. [CrossRef]
  24. Vrigkas, M.; Nikou, C.; Kakadiaris, I.A. A review of human activity recognition methods. Front. Robot. AI 2015. [Google Scholar] [CrossRef]
  25. Turaga, P.; Chellappa, R.; Subrahmanian, V.S.; Udrea, O. Machine Recognition of Human Activities: A Survey. IEEE Trans. Circuits Syst. Video Technol. 2008, 18, 1473–1488. [Google Scholar] [CrossRef]
  26. Dernbach, S.; Das, B.; Krishnan, N.C.; Thomas, B.L.; Cook, D.J. Simple and Complex Activity Recognition through Smart Phones. In Proceedings of the 2012 Eighth International Conference on Intelligent Environments, Washington, DC, USA, 26–29 June 2012; pp. 214–221. [Google Scholar] [CrossRef] [Green Version]
  27. Blanke, U.; Schiele, B.; Kreil, M.; Lukowicz, P.; Sick, B.; Gruber, T. All for one or one for all? Combining heterogeneous features for activity spotting. In Proceedings of the 2010 8th IEEE International Conference on Pervasive Computing and Communications Workshops (PERCOM Workshops), Mannheim, Germany, 19 March–2 April 2010; pp. 18–24. [Google Scholar] [CrossRef]
  28. Vaizman, Y.; Ellis, K.; Lanckriet, G. Recognizing Detailed Human Context in the Wild from Smartphones and Smartwatches. IEEE Pervasive Comput. 2017, 16, 62–74. [Google Scholar] [CrossRef]
  29. Cruciani, F.; Vafeiadis, A.; Nugent, C.; Cleland, I.; McCullagh, P.; Votis, K.; Giakoumis, D.; Tzovaras, D.; Chen, L.; Hamzaoui, R. Feature learning for Human Activity Recognition using Convolutional Neural Networks. CCF Trans. Pervasive Comput. Interact. 2020, 2, 18–32. [Google Scholar] [CrossRef]
  30. Schrader, L.; Toro, A.V.; Konietzny, S.; Rüping, S.; Schäpers, B.; Steinböck, M.; Krewer, C.; Müller, F.; Güttler, J.; Bock, T. Advanced Sensing and Human Activity Recognition in Early Intervention and Rehabilitation of Elderly People. J. Popul. Ageing 2020, 13, 139–165. [Google Scholar] [CrossRef]
  31. Akila, K.; Chitrakala, S. Highly refined human action recognition model to handle intraclass variability & interclass similarity. Multimed. Tools Appl. 2019, 78, 20877–20894. [Google Scholar] [CrossRef]
  32. Bharti, P.; De, D.; Chellappan, S.; Das, S.K. HuMAn: Complex Activity Recognition with Multi-Modal Multi-Positional Body Sensing. IEEE Trans. Mobile Comput. 2019, 18, 857–870. [Google Scholar] [CrossRef]
  33. Niemann, F.; Lüdtke, S.; Bartelt, C.; ten Hompel, M. Context-Aware Human Activity Recognition in Industrial Processes. Sensors 2022, 22, 134. [Google Scholar] [CrossRef]
  34. Shoaib, M.; Scholten, H.; Havinga, P.J. Towards Physical Activity Recognition Using Smartphone Sensors. In Proceedings of the 2013 IEEE 10th International Conference on Ubiquitous Intelligence and Computing and 2013 IEEE 10th International Conference on Autonomic and Trusted Computing, Vietri sul Mare, Italy, 18–21 December 2013; pp. 80–87. [Google Scholar] [CrossRef]
  35. Shoaib, M.; Bosch, S.; Incel, O.D.; Scholten, H.; Havinga, P.J. Fusion of smartphone motion sensors for physical activity recognition. Sensors 2014, 14, 10146. [Google Scholar] [CrossRef] [PubMed]
  36. Chen, G.; Ding, X.; Huang, K.; Ye, X.; Zhang, C. Changing health behaviors through social and physical context awareness. In Proceedings of the 2015 International Conference on Computing, Networking and Communications (ICNC), Garden Grove, CA, USA, 16–19 February 2015; pp. 663–667. [Google Scholar] [CrossRef]
  37. Ramos-Garcia, R.I.; Hoover, A.W. A Study of Temporal Action Sequencing during Consumption of a Meal. In Proceedings of the International Conference on Bioinformatics, Computational Biology and Biomedical Informatics, Washington, DC, USA, 22–25 September 2013; pp. 68–75. [Google Scholar] [CrossRef]
  38. Scholl, P.M.; van Laerhoven, K. A Feasibility Study of Wrist-Worn Accelerometer Based Detection of Smoking Habits. In Proceedings of the 2012 Sixth International Conference on Innovative Mobile and Internet Services in Ubiquitous Computing, Washington, DC, USA, 4–6 July 2012; pp. 886–891. [Google Scholar] [CrossRef]
  39. Parate, A.; Chiu, M.C.; Chadowitz, C.; Ganesan, D.; Kalogerakis, E. RisQ: Recognizing Smoking Gestures with Inertial Sensors on a Wristband. In Proceedings of the 12th Annual International Conference on Mobile Systems, Applications, and Services, Bretton Woods, NH, USA, 16–19 July 2014; pp. 149–161. [Google Scholar] [CrossRef]
  40. Ha, S.; Yun, J.; Choi, S. Multi-modal Convolutional Neural Networks for Activity Recognition. In Proceedings of the 2015 IEEE International Conference on Systems, Man, and Cybernetics, Hong Kong, China, 9–12 October 2015; pp. 3017–3022. [Google Scholar] [CrossRef]
  41. Lima, W.S.; Souto, E.; El-Khatib, K.; Jalali, R.; Gama, J. Human activity recognition using inertial sensors in a smartphone: An overview. Sensors 2019, 14, 3213. [Google Scholar] [CrossRef] [PubMed]
  42. Ignatov, A. Real-time human activity recognition from accelerometer data using convolutional neural networks. Appl. Soft Comput. J. 2018, 62, 915–922. [Google Scholar] [CrossRef]
  43. Hammerla, N.Y.; Halloran, S.; Ploetz, T. Deep, Convolutional, and Recurrent Models for Human Activity Recognition using Wearables. In Proceedings of the IJCAI 2016, New York, NY, USA, 9–15 July 2016; pp. 1533–1540. [Google Scholar]
  44. Otebolaku, A.M.; Andrade, M.T. User context recognition using smartphone sensors and classification models. J. Netw. Comput. Appl. 2016, 66, 33–51. [Google Scholar] [CrossRef]
  45. Das, B.; Seelye, A.B.; Thomas, B.L.; Cook, D.J.; Holder, L.B.; Schmitter-Edgecombe, M. Using smart phones for context-aware prompting in smart environments. In Proceedings of the 2012 IEEE Consumer Communications and Networking Conference (CCNC), Las Vegas, NV, USA, 14–17 January 2012; pp. 399–403. [Google Scholar] [CrossRef]
  46. Vaizman, Y.; Weibel, N.; Lanckriet, G. Context Recognition In-the-Wild: Unified Model for Multi-Modal Sensors and Multi-Label Classification. Proc. ACM Interact. Mob. Wearable Ubiquitous Technol. 2018. [Google Scholar] [CrossRef]
  47. Edel, M.; Köppe, E. Binarized-BLSTM-RNN based Human Activity Recognition. In Proceedings of the 2016 International Conference on Indoor Positioning and Indoor Navigation (IPIN), Alcalá de Henares, Spain, 4–7 October 2016; pp. 1–7. [Google Scholar] [CrossRef]
  48. Inoue, M.; Inoue, S.; Nishida, T. Deep Recurrent Neural Network for Mobile Human Activity Recognition with High Throughput. Artif. Life Robot. 2018, 23, 173–185. [Google Scholar] [CrossRef]
  49. Guan, Y.; Ploetz, T. Ensembles of Deep LSTM Learners for Activity Recognition using Wearables. Proc. ACM Interact. Mobile Wearable Ubiquitous Technol. 2017. [Google Scholar] [CrossRef]
  50. Murad, A.; Pyun, J.-Y. Deep Recurrent Neural Networks for Human Activity Recognition. Sensors 2017, 17, 2556. [Google Scholar] [CrossRef]
  51. Malhotra, P.; Vig, L.; Shroff, G.; Agarwal, P. Long Short-Term Memory Networks for Anomaly Detection in Time Series. In Proceedings of the European Symposium on Artificial Neural Networks, Computational Intelligence and Machine Learning, Bruges, Belgium, 22–24 April 2015. [Google Scholar]
  52. Alhussein, M.; Aurangzeb, K.; Haider, S.I. Hybrid CNN-LSTM Model for Short-Term Individual Household Load Forecasting. IEEE Access 2020, 8, 180544–180557. [Google Scholar] [CrossRef]
  53. umaei, A.; Hassan, M.M.; Alelaiwi, A.; Alsalman, H. A Hybrid Deep Learning Model for Human Activity Recognition Using Multimodal Body Sensing Data. IEEE Access 2019, 7, 99152–99160. [Google Scholar]
  54. Mohd Noor, M.H.; Tan, S.Y.; Ab Wahab, M.N. Deep Temporal Conv-LSTM for Activity Recognition. Neural Process Lett. 2022. [Google Scholar] [CrossRef]
  55. Yin, X.; Liu, Z.; Liu, D.; Ren, X. A Novel CNN-based Bi-LSTM parallel model with attention mechanism for human activity recognition with noisy data. Sci. Rep. 2022, 12, 7878. [Google Scholar] [CrossRef] [PubMed]
  56. Huan, R.; Jiang, C.; Ge, L.; Shu, J.; Zhan, Z.; Chen, P.; Chi, K.; Liang, R. Human Complex Activity Recognition with Sensor Data Using Multiple Features. IEEE Sens. J. 2022, 22, 757–775. [Google Scholar] [CrossRef]
  57. Zhou, L.; Zhang, Z.; Zhao, L.; Yang, P. Attention-Based Bi-LSTM Models for Personality Recognition from User-Generated Content. Inf. Sci. 2022, 596, 460–471. [Google Scholar] [CrossRef]
  58. Ordóñez, F.J.; Roggen, D. Deep Convolutional and LSTM Recurrent Neural Networks for Multimodal Wearable Activity Recognition. Sensors 2016, 16, 115. [Google Scholar] [CrossRef]
  59. Zhao, Y.; Yang, R.; Chevalier, G.; Xu, X.; Zhang, Z. Deep Residual Bidir-LSTM for Human Activity Recognition Using Wearable Sensors. Math. Probl. Eng. 2018, 2018, 7316954. [Google Scholar] [CrossRef]
  60. Chen, L.; Zhang, Y.; Peng, L. METIER: A Deep Multi-Task Learning Based Activity and User Recognition Model Using Wearable Sensors. Proc. ACM Interact. Mob. Wearable Ubiquitous Technol. 2020. [Google Scholar] [CrossRef]
  61. Bragança, H.; Colonna, J.G.; Lima, W.S.; Souto, E. A Smartphone Lightweight Method for Human Activity Recognition Based on Information Theory. Sensors 2020, 20, 1856. [Google Scholar] [CrossRef]
  62. Gani, M.O.; Fayezeen, T.; Povinelli, R.J.; Smith, R.O.; Arif, M.; Kattan, A.J.; Ahamed, S.I. A lightweight smartphone based human activity recognition system with high accuracy. J. Netw. Comput. Appl. 2019, 141, 59–72. [Google Scholar] [CrossRef]
  63. Hassan, M.M.; Uddin, M.Z.; Mohamed, A.; Almogren, A. A robust human activity recognition system using smartphone sensors and deep learning. Future Gen. Comput. Syst. 2018, 81, 307–313. [Google Scholar] [CrossRef]
  64. Otebolaku, A.; Enamamu, T.; Alfoudi, A.S.; Ikpehai, A.; Marchang, J.; Lee, G.M. Deep Sensing: Inertial and Ambient Sensing for Activity Context Recognition Using Deep Convolutional Neural Networks. Sensors 2020, 20, 3803. [Google Scholar] [CrossRef] [PubMed]
  65. Laguna, J.O.; Garc, A.; Borrajo, D. A Dynamic Sliding Window Approach for Activity Recognition. In Proceedings of the 19th International Conference on User modeling, Adaption, and Personalization, Girona, Spain, 11–15 July 2011; pp. 219–220. [Google Scholar]
  66. Almaslukh, B.; Artoli, A.M.; Al-Muhtadi, J. A Robust Deep Learning Approach for Position-Independent Smartphone-Based Human Activity Recognition. Sensors 2018, 18, 3726. [Google Scholar] [CrossRef] [PubMed]
  67. Chambers, R.D.; Yoder, N.C. FilterNet: A Many-to-Many Deep Learning Architecture for Time Series Classification. Sensors 2020, 20, 2498. [Google Scholar] [CrossRef] [PubMed]
  68. Masters, D.; Luschi, C. Revisiting Small Batch Training for Deep Neural Networks. arXiv 2018, arXiv:1804.07612. [Google Scholar]
  69. Chollet, F. Xception: Deep Learning with Depthwise Separable Convolutions. In Proceedings of the 2017 IEEE Conference on Computer Vision and Pattern Recognition (CVPR), Honolulu, HI, USA, 21–26 July 2017; pp. 1251–1258. [Google Scholar]
  70. Srivastava, N.; Hinton, G.; Krizhevsky, A.; Sutskever, I.; Salakhutdinov, R. Dropout: A simple way to prevent neural networks from overfitting. J. Mach. Learn. Res. 2014, 15, 929–1958. [Google Scholar]
  71. Otebolaku, A.M.; Andrade, M.T. Recognizing High-Level Contexts from Smartphone Built-In Sensors for Mobile Media Content Recommendation. In Proceedings of the 2013 IEEE 14th International Conference on Mobile Data Management, Milan, Italy, 3–6 June 2013; pp. 142–147. [Google Scholar] [CrossRef]
  72. Bettini, C.; Civitarese, G.; Presotto, R. CAVIAR: Context-driven Active and Incremental Activity Recognition. Knowl. Based Syst. 2020, 196, 105816. [Google Scholar] [CrossRef]
  73. Weiss, G.M.; Yoneda, K.; Hayajneh, T. Smartphone and Smartwatch-Based Biometrics Using Activities of Daily Living. IEEE Access 2019, 7, 133190–133202. [Google Scholar] [CrossRef]
  74. Carneiro, T.; Medeiros Da NóBrega, R.V.; Nepomuceno, T.; Bian, G.B.; De Albuquerque, V.H.C.; Filho, P.P.R. Performance Analysis of Google Collaboratory as a Tool for Accelerating Deep Learning Applications. IEEE Access 2018, 6, 61677–61685. [Google Scholar] [CrossRef]
  75. Ward, J.A.; Lukowicz, P.; Gellersen, H.W. Performance metrics for activity recognition. ACM Trans. Intell. Syst. Technol. 2011, 2, 1–23. [Google Scholar] [CrossRef]
  76. Agarwal, P.; Alam, M. A Lightweight Deep Learning Model for Human Activity Recognition on Edge Devices. Procedia Comput. Sci. 2020, 167, 2364–2373. [Google Scholar] [CrossRef]
Figure 1. An overview of traditional activity recognition processes.
Applsci 12 09305 g001
Figure 2. High-level view of the hybrid model with sensory signals from various sensors.
Applsci 12 09305 g002
Figure 3. Overview of the proposed context-aware smartphone-based human activity recognition using hybrid CNN–LSTM model.
Applsci 12 09305 g003
Figure 4. Sliding window with 50% overlaps.
Applsci 12 09305 g004
Figure 5. Activity classes by number of samples.
Applsci 12 09305 g005
Figure 6. Accelerometer (x-axis) data samples for Ascending Stairs activity.
Applsci 12 09305 g006
Figure 7. Line graph showing (a) accuracy plot and (b) loss plot as a function of number of epochs for the noncontextual model.
Applsci 12 09305 g007
Figure 8. Line graph showing (a) accuracy plot and (b) loss plot as a function of number of epochs for the contextual model.
Applsci 12 09305 g008
Figure 9. Line plot comparing (a) training accuracy and (b) training loss between the two models during training.
Applsci 12 09305 g009
Figure 10. Line plot comparing (a) validation accuracy and (b) validation loss between the two models during training.
Applsci 12 09305 g010
Figure 11. Confusion matrix for the noncontextual model.
Applsci 12 09305 g011
Figure 12. Confusion matrix for the contextual model.
Applsci 12 09305 g012
Table 1. Simple and complex activities within dataset.
#ActivityCategorySubactivity
1JoggingSimpleN/A
2LyingSimpleN/A
3RunningSimpleN/A
4SittingSimpleN/A
5StandingSimpleN/A
6WalkingSimpleN/A
7Ascending StairsComplexWalking + in motion against gravity
8Descending StairsComplexWalking + in motion in line with gravity
9Elevator DownComplexStanding + in motion in line with gravity
10Elevator UpComplexStanding + in motion against gravity
11Mountain ClimbingComplexWalking + under high altitude
12Riding in carComplexSitting + in motion
Table 2. Accuracy per kernel size for filter size 64.
kernel = 2: 97.674% (+/0.395)
kernel = 3: 97.900% (+/0.307)
kernel = 4: 97.703% (+/0.423)
kernel = 5: 97.514% (+/0.273)
kernel = 7: 97.099% (+/0.513)
Table 3. Training parameters (tuned and default) configuration used for the baseline model.
ParameterRecommendedFeasibleTuned
CNN layers2 No
CNN—Kernel Size32Yes
CNN—Filter Size64256Yes
LSTM Cells100 No
OptimizerAdam Yes
DropoutCNN = 0.1 Yes
Weight DecayCNN = 1 × 10⁻⁶
LSTM = 1 × 10⁻⁵
Yes
Window Length (size of input vector)3264Yes
Number of Input Channels9
Batch Size6432Yes
Subsequence Steps4 No
Learning Rate1 × 10−43 × 10−4Yes
Early StoppingPatience: 10
epoch: 50–100
Patience: 8
epoch: 40–80
Yes
ModelCheckpointsave_best_only: True No
Table 4. Model accuracy by activity category.
ModelActivity Category
SimpleComplex
Noncontextual98.7%93.7%
Contextual99.6%97.8%
Table 5. Model accuracy by activity class.
#ActivityF-Score
NoncontextualContextual
1Jogging0.9760.992
2Lying0.9981.000
3Running0.9931.000
4Sitting0.9700.990
5Standing0.9950.997
6Walking0.9910.996
7Ascending Stairs0.9440.961
8Descending Stairs0.9430.955
9Elevator Down0.9850.992
10Elevator Up0.9840.991
11Mountain Climbing0.7740.981
12Riding in car0.9900.990
accuracy0.9890.995
macro-average0.9620.987
weighted average0.9890.995
Table 6. Overall model accuracy.
ModelAccuracy
Noncontextual96.19%
Contextual98.72%
Publisher’s Note: MDPI stays neutral with regard to jurisdictional claims in published maps and institutional affiliations.

