Article

Genetic Diversity and Population Structure of the Endangered Ulmusvillosa in Pakistan Revealed by DNA Barcode Markers

1
Department of Botany, Hazara University, Mansehra 21300, Khyber Pakhtunkhwa, Pakistan
2
Department of Computer Science & Bioinformatics, Khushal Khan Khattak University, Karak 27200, Khyber Pakhtunkhwa, Pakistan
3
Department of Botany, Khushal Khan Khattak University, Karak 27200, Khyber Pakhtunkhwa, Pakistan
4
Missouri Botanical Garden, P.O. Box 299, St. Louis, MO 63166, USA
5
Botany and Microbiology Department, College of Science, King Saud University, Riyadh 11451, Saudi Arabia
6
Department of Plant Production, College of Food and Agriculture Science, King Saud University, Riyadh 11451, Saudi Arabia
7
Agrobiology and Bioresources Department, School of Agriculture, Utsunomiya University, 350 Mine-machi, Utsunomiya 321-8505, Tochigi, Japan
8
Department of Botany, Bacha Khan University, Charsadda 24461, Khyber Pakhtunkhwa, Pakistan
9
Department of Agriculture, Hazara University, Mansehra 21300, Khyber Pakhtunkhwa, Pakistan
*
Authors to whom correspondence should be addressed.
Appl. Sci. 2022, 12(18), 9293; https://doi.org/10.3390/app12189293
Submission received: 20 June 2022 / Revised: 22 August 2022 / Accepted: 27 August 2022 / Published: 16 September 2022

Abstract

:
Ulmus villosa Brandis ex Gamble, an economically and ecologically important forest tree, is native to the western Himalayas of Pakistan. The long pressure imposed by unsustainable utilization and market demands has resulted in the rapid decline of the U. villosa population in the wild. To date, very limited information on the genomic diversity of U. villosa is available and this can tremendously limit our understanding of distribution and future conservation of U. villosa. Therefore, the current study aimed to assess genetic diversity within U. villosa wild populations of the Hazara Division using four barcoding markers (i.e., rbcL, matK XF + 5R, matK 390F + 1326R and trnH-psbA). A total of six high quality sequences were obtained with rbcL, four with matK XF + 5R, four with matK 390F + 1326R, and fourteen with trnH-psbA. The sequenced regions contained insertions and deletions as well as several SNPs across the length of sequences, and PCR-based markers may be developed from these novel SNPs markers. The phylogenetic results supported the polyphyletic origin of the genus Ulmus, and the data indicated that multiple speciation events may have led to the evolution of U. villosa in this region. For deeper understanding of the origin and evolution of U. villosa, sequencing of the complete nuclear and chloroplast genomes will be pivotal. The results herein provide novel insights into the genomic diversity as well as phylogenetic relationships of U. villosa with other species, and may facilitate both in situ and ex situ conservation efforts for this endangered species.

1. Introduction

Ulmus villosa Brandis ex Gamble is a medium to large size tree, distributed in the northwest and western Himalayas and is relatively common in Hazara Division of Pakistan. These trees have a deep root system that resists wind and drought conditions [1].
The wood of U. villosa is highly prized and utilized in construction as well as in the furniture industry. Due to its excessive and non-sustainable utilization, the populations of this species are declining rapidly in Pakistan and therefore the national IUCN extinction risk assessments for this species classified it as endangered [2]. This unsustainable utilization of wood and the concomitant habitat fragmentation imposed are regarded as the major contributors to its decline in the wild. Despite its decline at local levels, there is almost no available information regarding possible genetic bottlenecks and/or its poor adaptation to new climatic conditions and it largely remains unknown whether these factors add further to the depletion of U. villosa. Genetic diversity allows the species adaptation to new climatic conditions and shapes the evolutionary processes [3,4]. Furthermore, conservation and management of a species require knowledge of its ecological characteristics and genetic variation within and between populations [4,5,6]. To obtain such information, particularly the better understanding of genetics of U. villosa, integration of powerful biological and computational techniques is required [7,8,9].
Due to the controversial taxonomy of the genus Ulmus attributed to the high morphological variability within species [1], previous studies have focused on taxonomic research, based on morphological and biochemical markers [10]. However, recently DNA and protein markers such as allozyme [11,12], RAPDs, ISSRs [13] and AFLP [14] have been used to investigate the genetic diversity of the members of Ulmaceae family. Additionally, microsatellite markers have been used due to their high reproducibility, multi-allelic nature and extensive genome distribution [15,16].
Recently, DNA barcoding techniques that employ small, standardized portions of the genome, e.g., matK, rbcL, trnHpsbA and ITS as substitutes for morphology, have been widely applied for species identification as well as phylogeny. These genes are universally present in lineages and the unique sequence diversity allows for discriminating among and between species [17,18]. Although, DNA barcodes have been widely used to study the Ulmaceae members in other regions, still there is hardly any available information on the genomic diversity of U. villosa in Pakistan. Therefore, the current study focuses on DNA barcoding genes aiming to assess genetic architecture and population structure of U. villosa that may allow identification of elite genotypes and may provide insights into the speciation of U. villosa in this region. To the best of our knowledge, this will be the first report on these aspects of U. villosa and thus may facilitate both its in situ and ex situ conservation efforts.

2. Materials and Methods

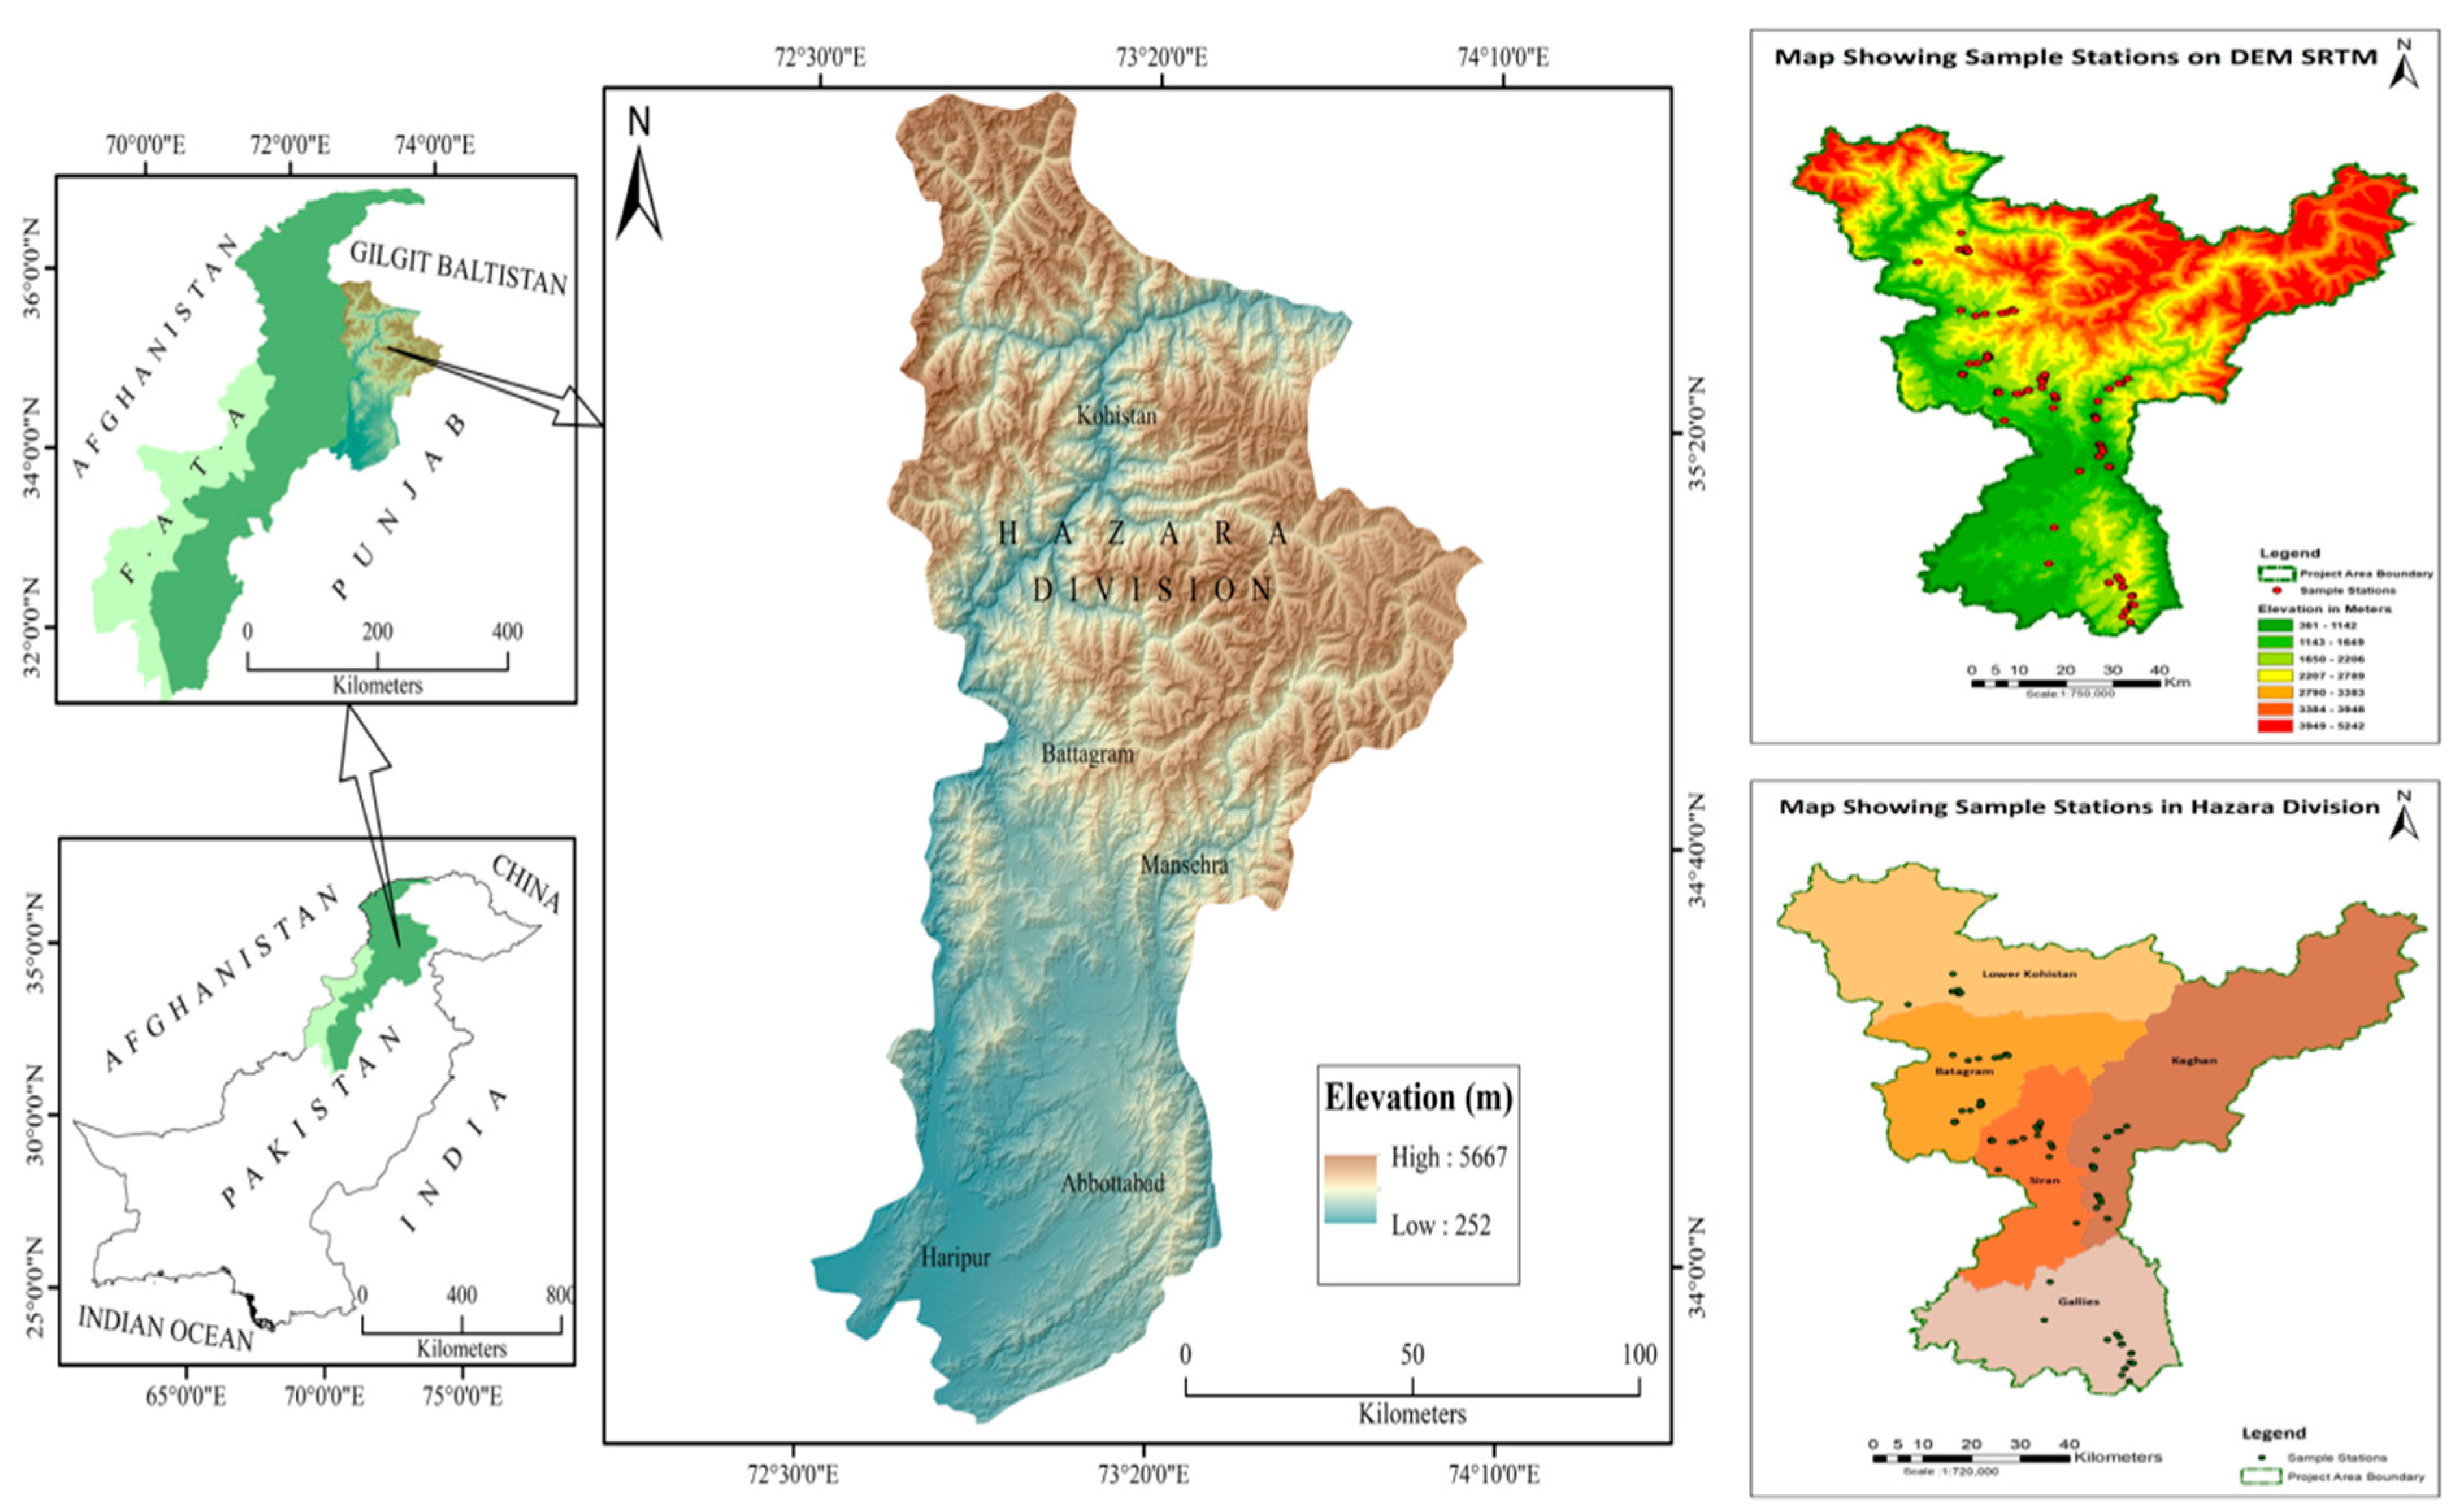
2.1. Study Area and Plant Materials

The current study was authorized by the Directorate of Advance Studies and Research Board (ASRB) of Hazara University, Mansehra Pakistan. During field surveys from 2017 to 2019, U. villosa was recorded in 66 localities with a total population size of 283 individuals from different areas of Hazara Division, Pakistan. Boundaries of the sampling area join the northern areas and Azad Kashmir in the north and east. The river Indus runs through the division in a north–south line, forming most of the western boundary of the division. It comprises of six (06) districts, Abbottabad, Battagram, Haripur, Mansehra, Kohistan and Torghar (Figure 1).
Identification of plant samples followed the flora of Pakistan and the samples were collected and processed following standard herbarium techniques [2] and voucher specimens were deposited in the herbarium of Hazara University Mansehra, Pakistan (HUP).

2.2. Genomic DNA Extraction and DNA Quantification

Genomic DNA was extracted from freshly collected young green leaves of Ulmus species using the cetyltrimethylammonium bromide (CTAB) method previously outlined [19]. The extracted DNA was incubated at 37 °C for 1 h with 1 μL of 10 mg/mL RNase A and then stored in a freezer (−20 °C).

2.3. Molecular Markers Selection and PCR Analyses

Here, previously known DNA barcoding markers were used, and all these markers and related information were mentioned in Table 1. For PCR markers, amplification conditions given in [20] were followed. DNA was amplified using a Gradient Thermocycler in a 15 µL reaction mixture and 0.6 µM of each primer. PCR amplified products were separated by 2% agarose.

2.4. Gel Purification and Confirmation of Eluted PCR Products

Selected barcoding bands were excised with sterile scalpel and purified with the QIAquick Gel extraction kit (Qiagen, Valencia, CA, USA) following manufacturer’s protocol. 1 μL of the recovered DNA was reloaded on 0.8% agarose gel to ascertain elution before products were sent for direct sequencing. Purified DNA fragments were commercially sequenced at Beijing Genomic Institute (BGI), China by sending the PCR products directly along custom primers.

2.5. Data Analyses

DNA sequences in the form of chromatograms were cleaned using BioEdit software (version 7.0.5), and multiple sequence alignment was performed using ClustalW multiple alignment tools embedded in Geneious R6 (v6.1.8, Biomatters Ltd., Auckland, New Zealand). Phylogenetic reconstruction and estimation of nucleotide variability were carried out in Geneious R6 [21] or MEGA6 [22]. The evolutionary history was inferred by using Neighbor joining model. Nodal support was assessed via bootstrapping, and the bootstrap consensus tree was inferred from 1000 replicates [23].

3. Results

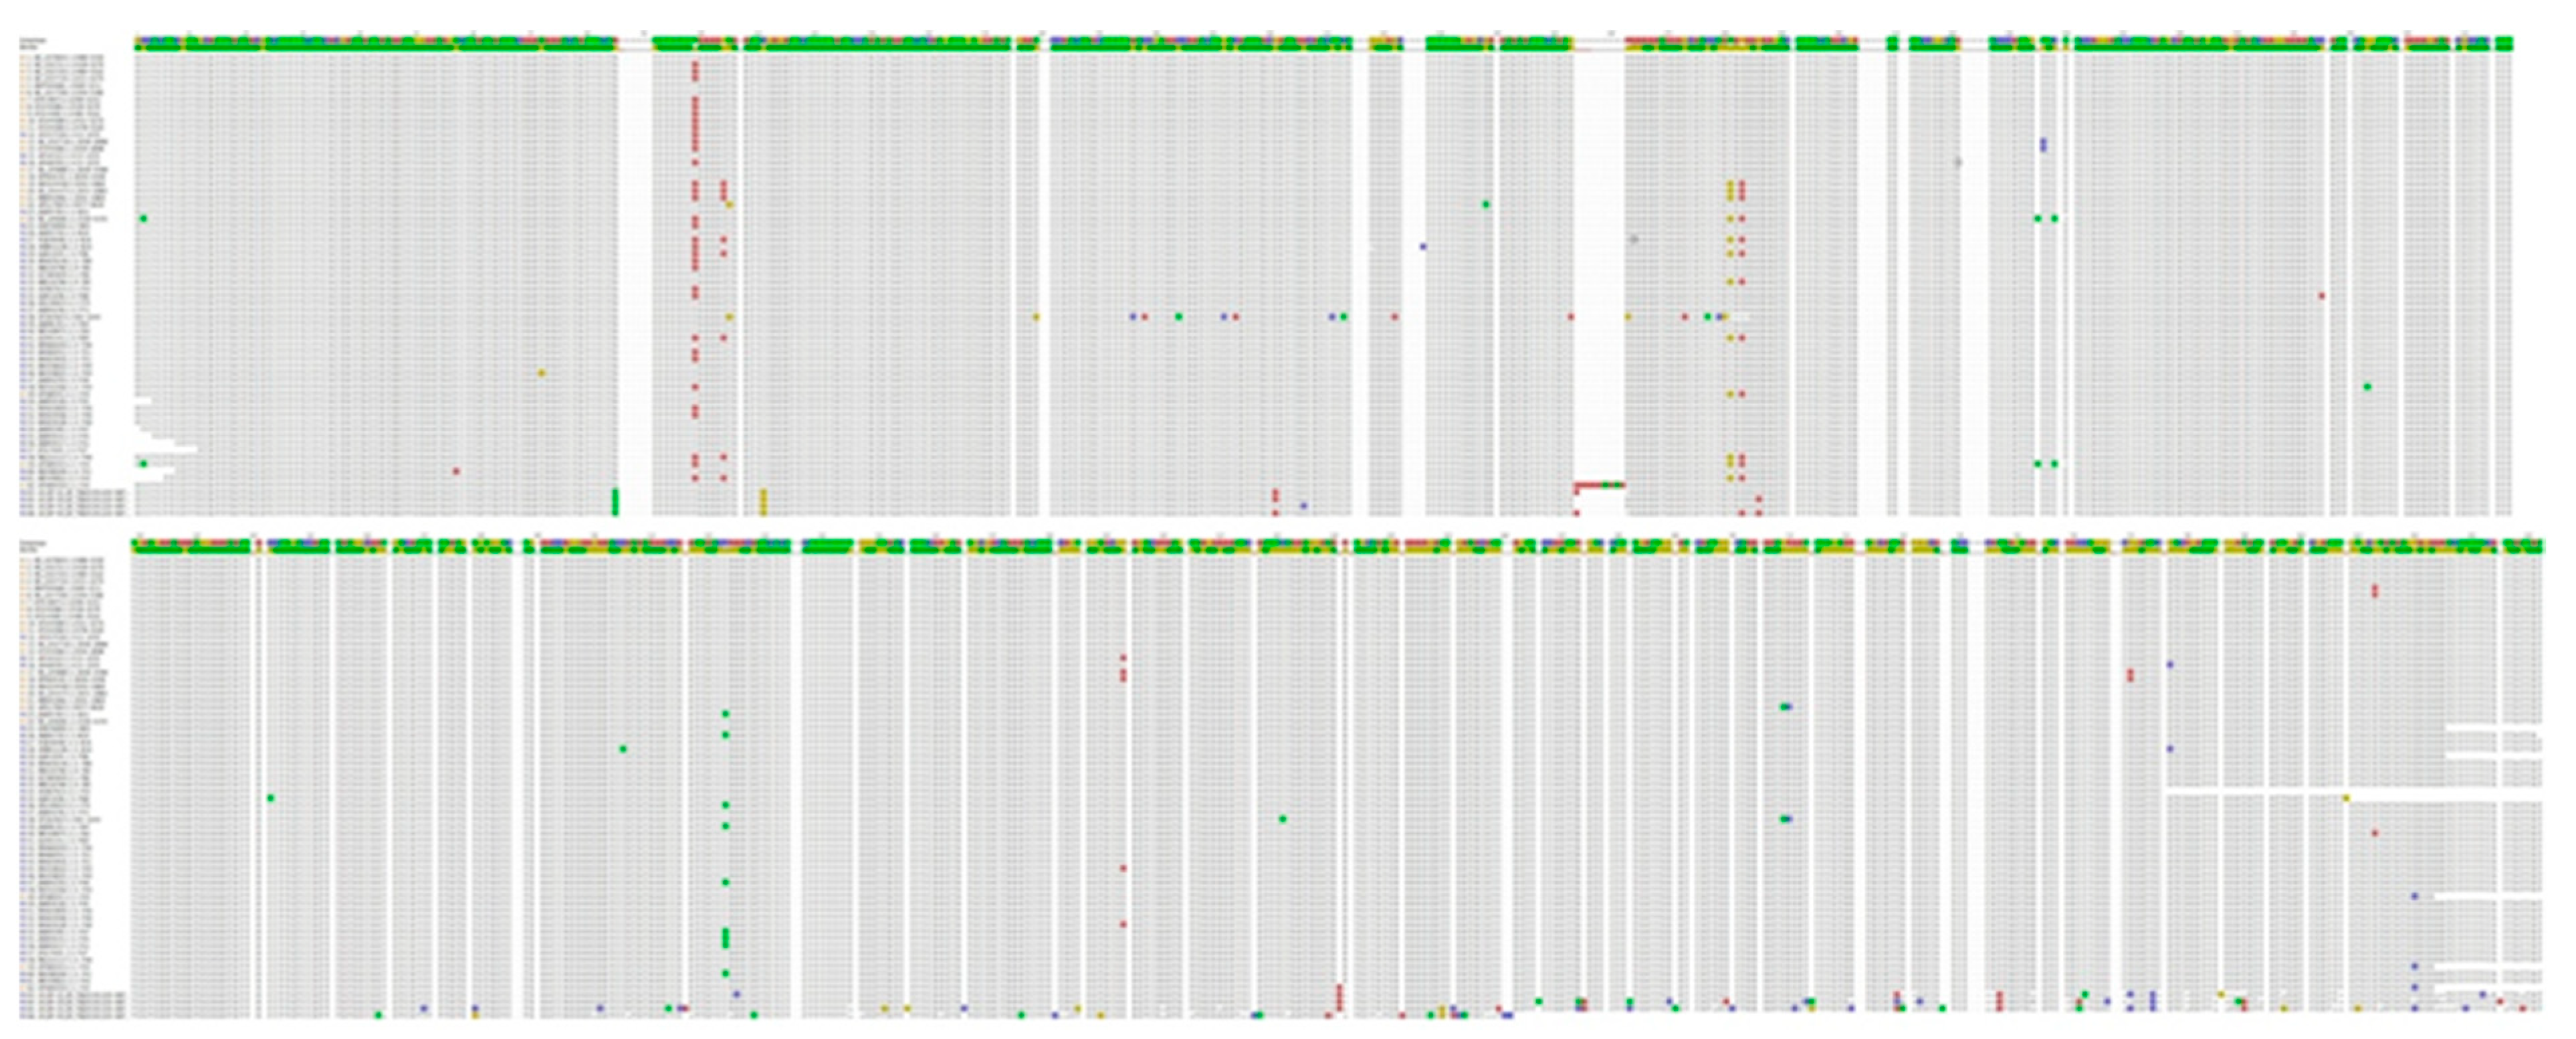
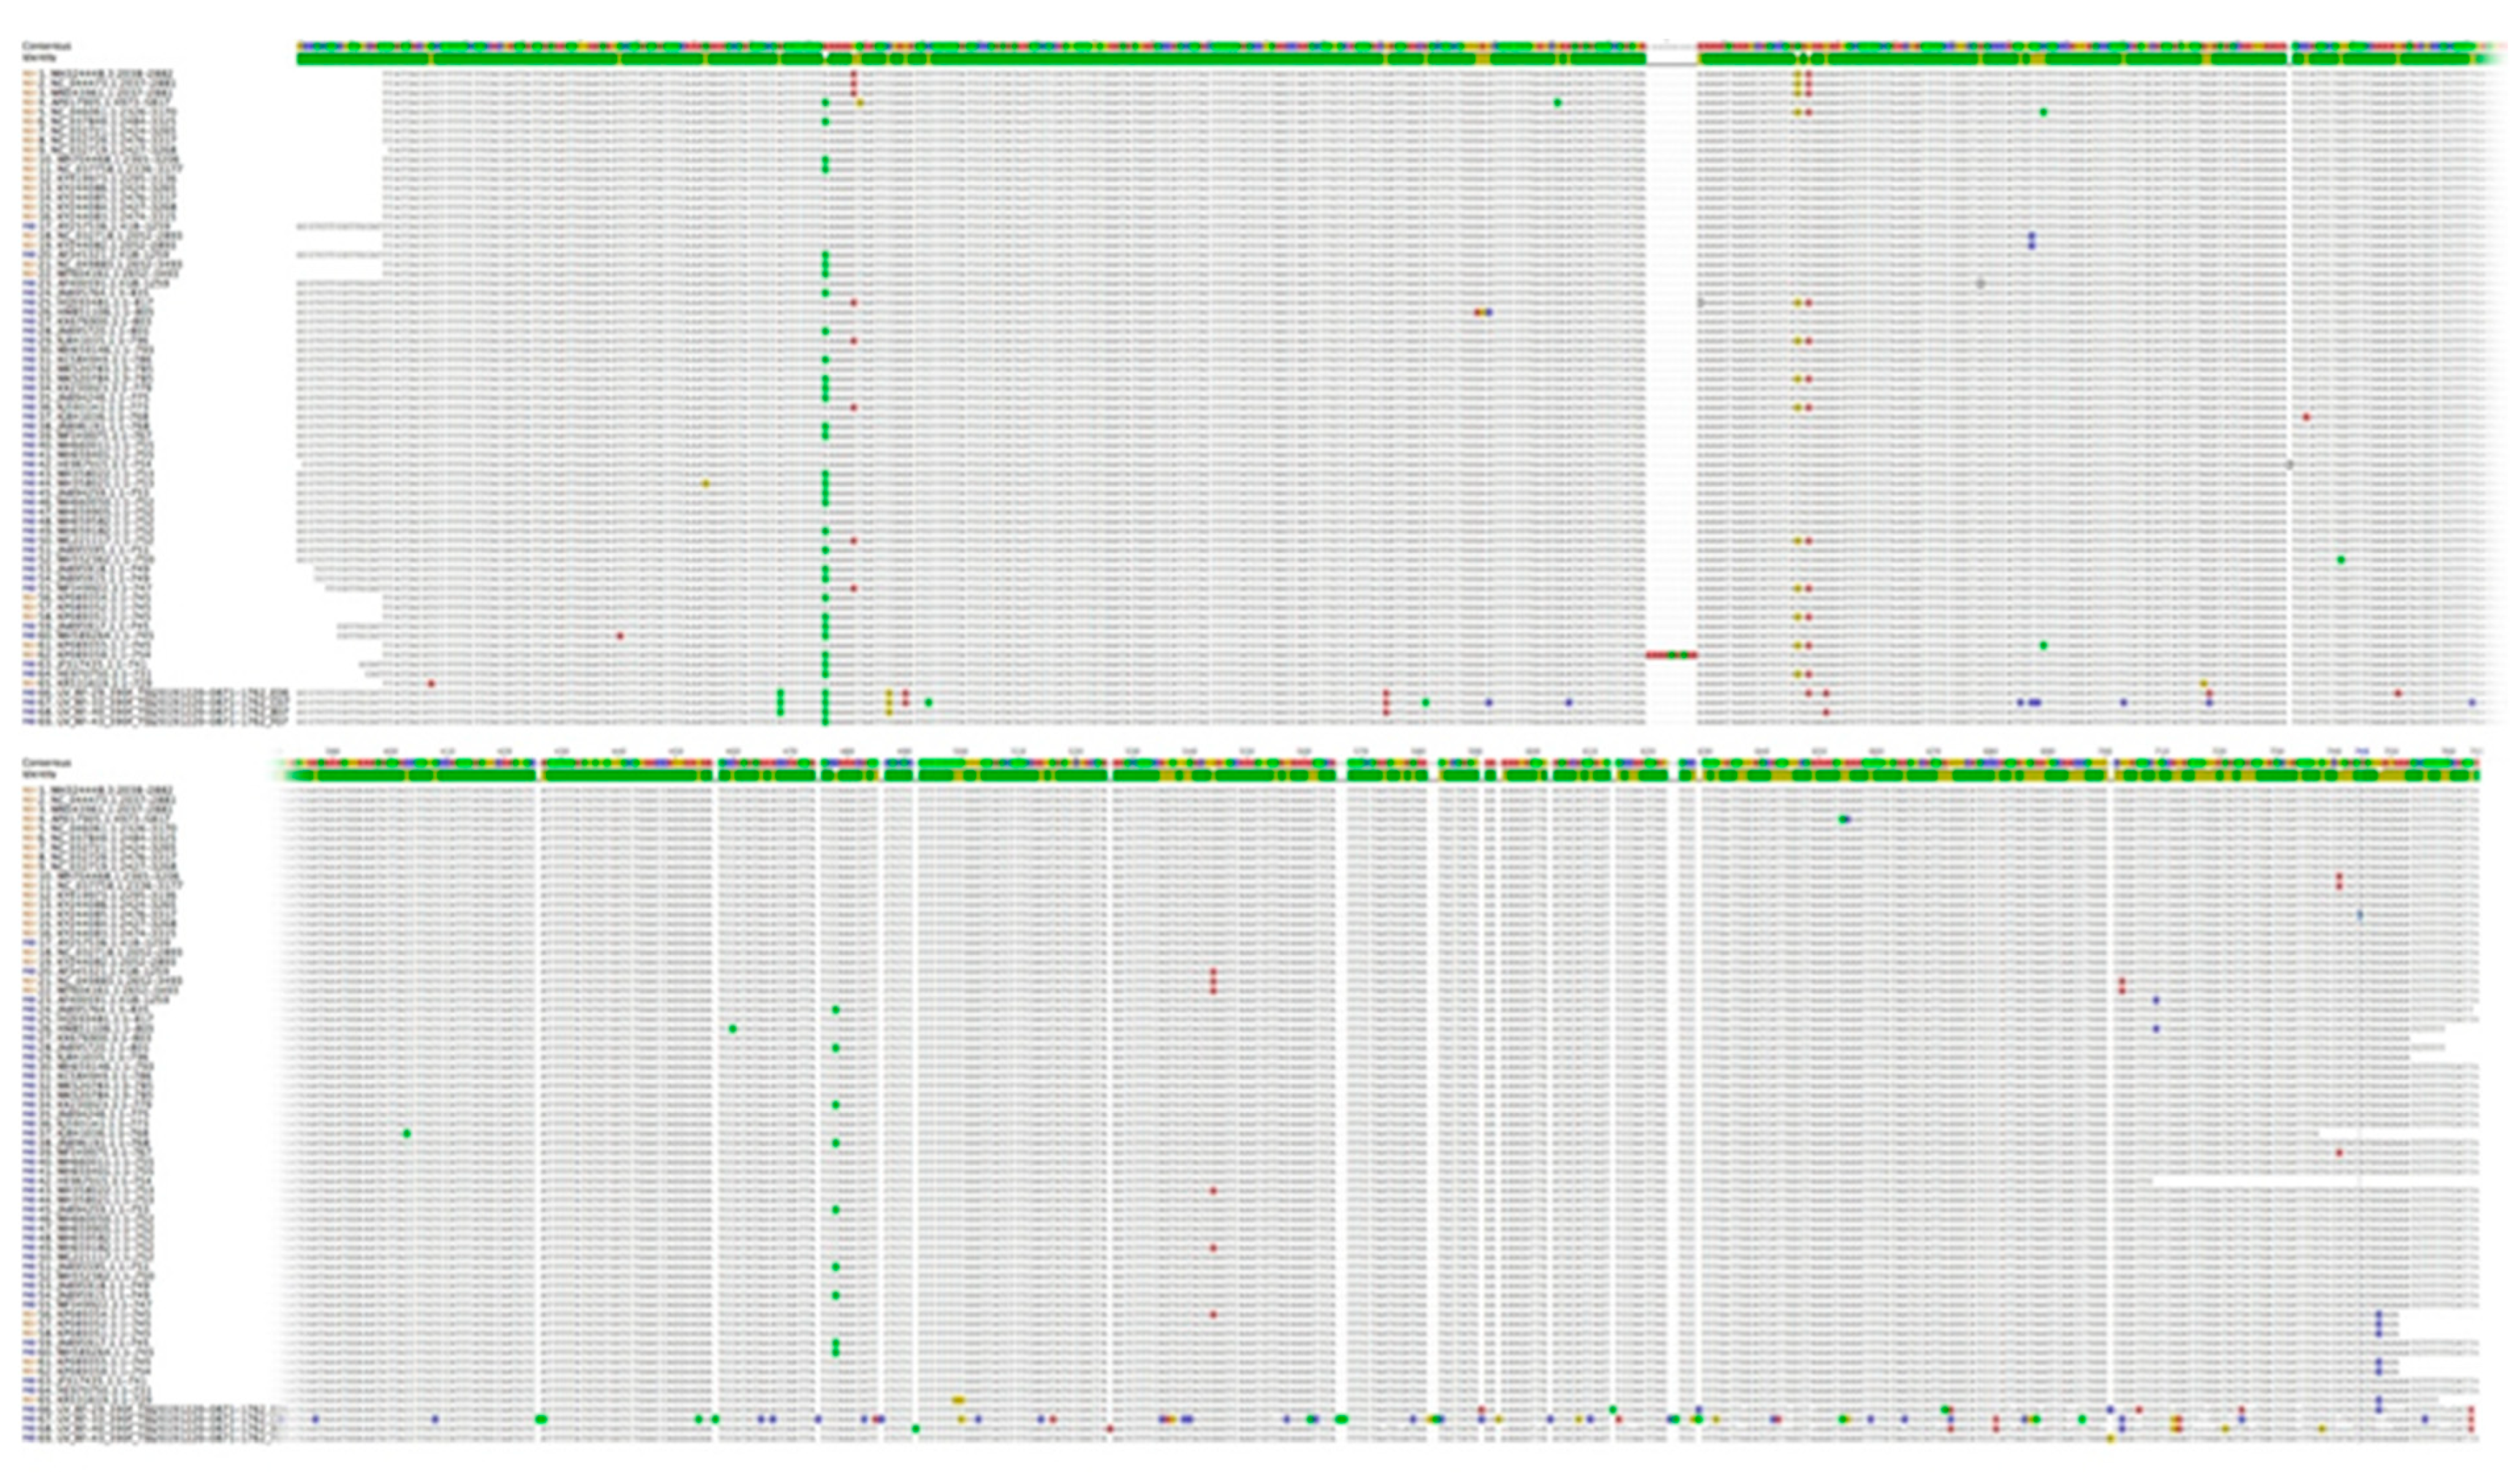
3.1. Molecular Markers (Barcoding Genes) Analyses

A total of four barcoding genes from U. villosa samples were investigated. All four markers tested have successfully amplified regions from selected samples. For molecular analyses, U. villosa samples selected are spaced by an elevation of 50 m maximum. Thus, for PCR amplification, 27 U. villosa samples were used. Furthermore, all markers have produced a single band within the range of expected sizes; however, there were rare missing bands most probably due to DNA loading errors (Figures S1 and S2).
Successful amplification of the rbcL region resulted in a single band from all samples except lane number. 8 (Figure S1A). Similarly, matK markers also resulted in a single band except lanes 12–15 and 18 (Figure S2B). It was interesting to see that the matK region produced a faint secondary band in a few lanes (e.g., see lanes 12–15 Figure S1B), that could potentially indicate to multiple copies of different origin or truncated regions. The trnH-psbA amplification also resulted in a single band with a slight variation in sizes of the amplicons from samples (Figures S1 and S2).

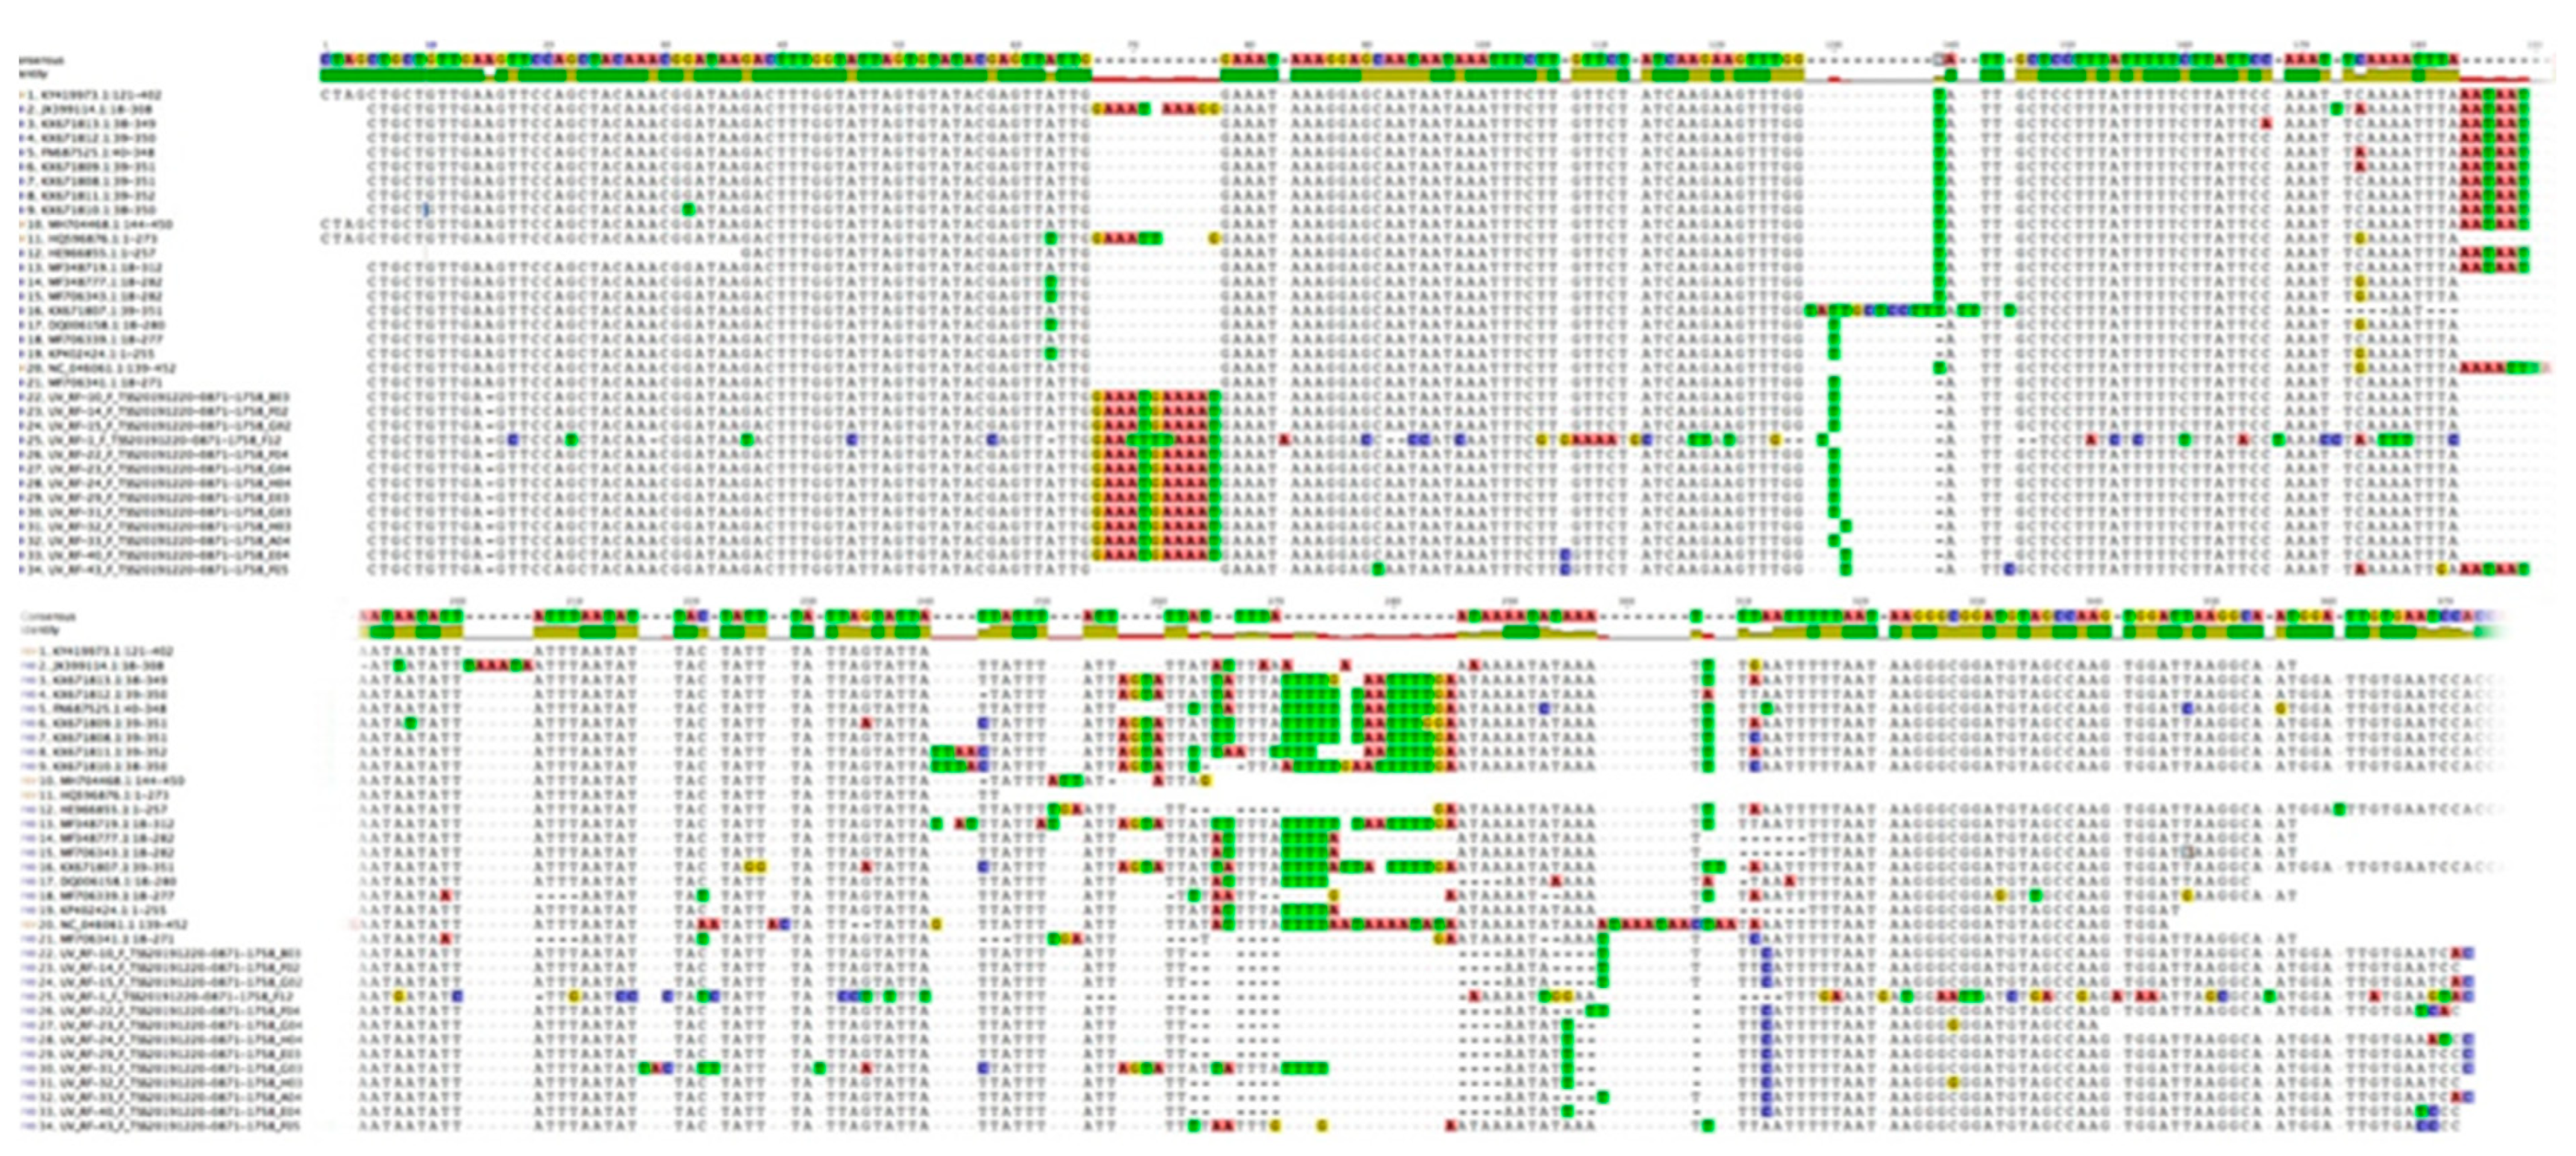
3.2. Nucleotide Sequence Variation and Phylogeny of U. villosa

Samples of U. villosa were used to test universality of the matK, trnH and rbcL regions (Table 2). All markers have amplified regions of the expected sizes, but all sequencing reactions were not successful, or the obtained sequences were too short to be included in the final analyses. The overall analyses are based on six high quality sequences form rbcL region, four matK XF + 5R, four matK 390F + 1326R sequences and fourteen trnH-psbA sequences of U. villosa samples. The overall hits were almost identical, and therefore, consensus sequence generated from the alignment of U. villosa was used for all the analyses. Furthermore, before NJ phylogenetic trees were developed the overhanging sequences were deleted from both ends to make the sequences uniform and the Zelkova species was used as an out group.

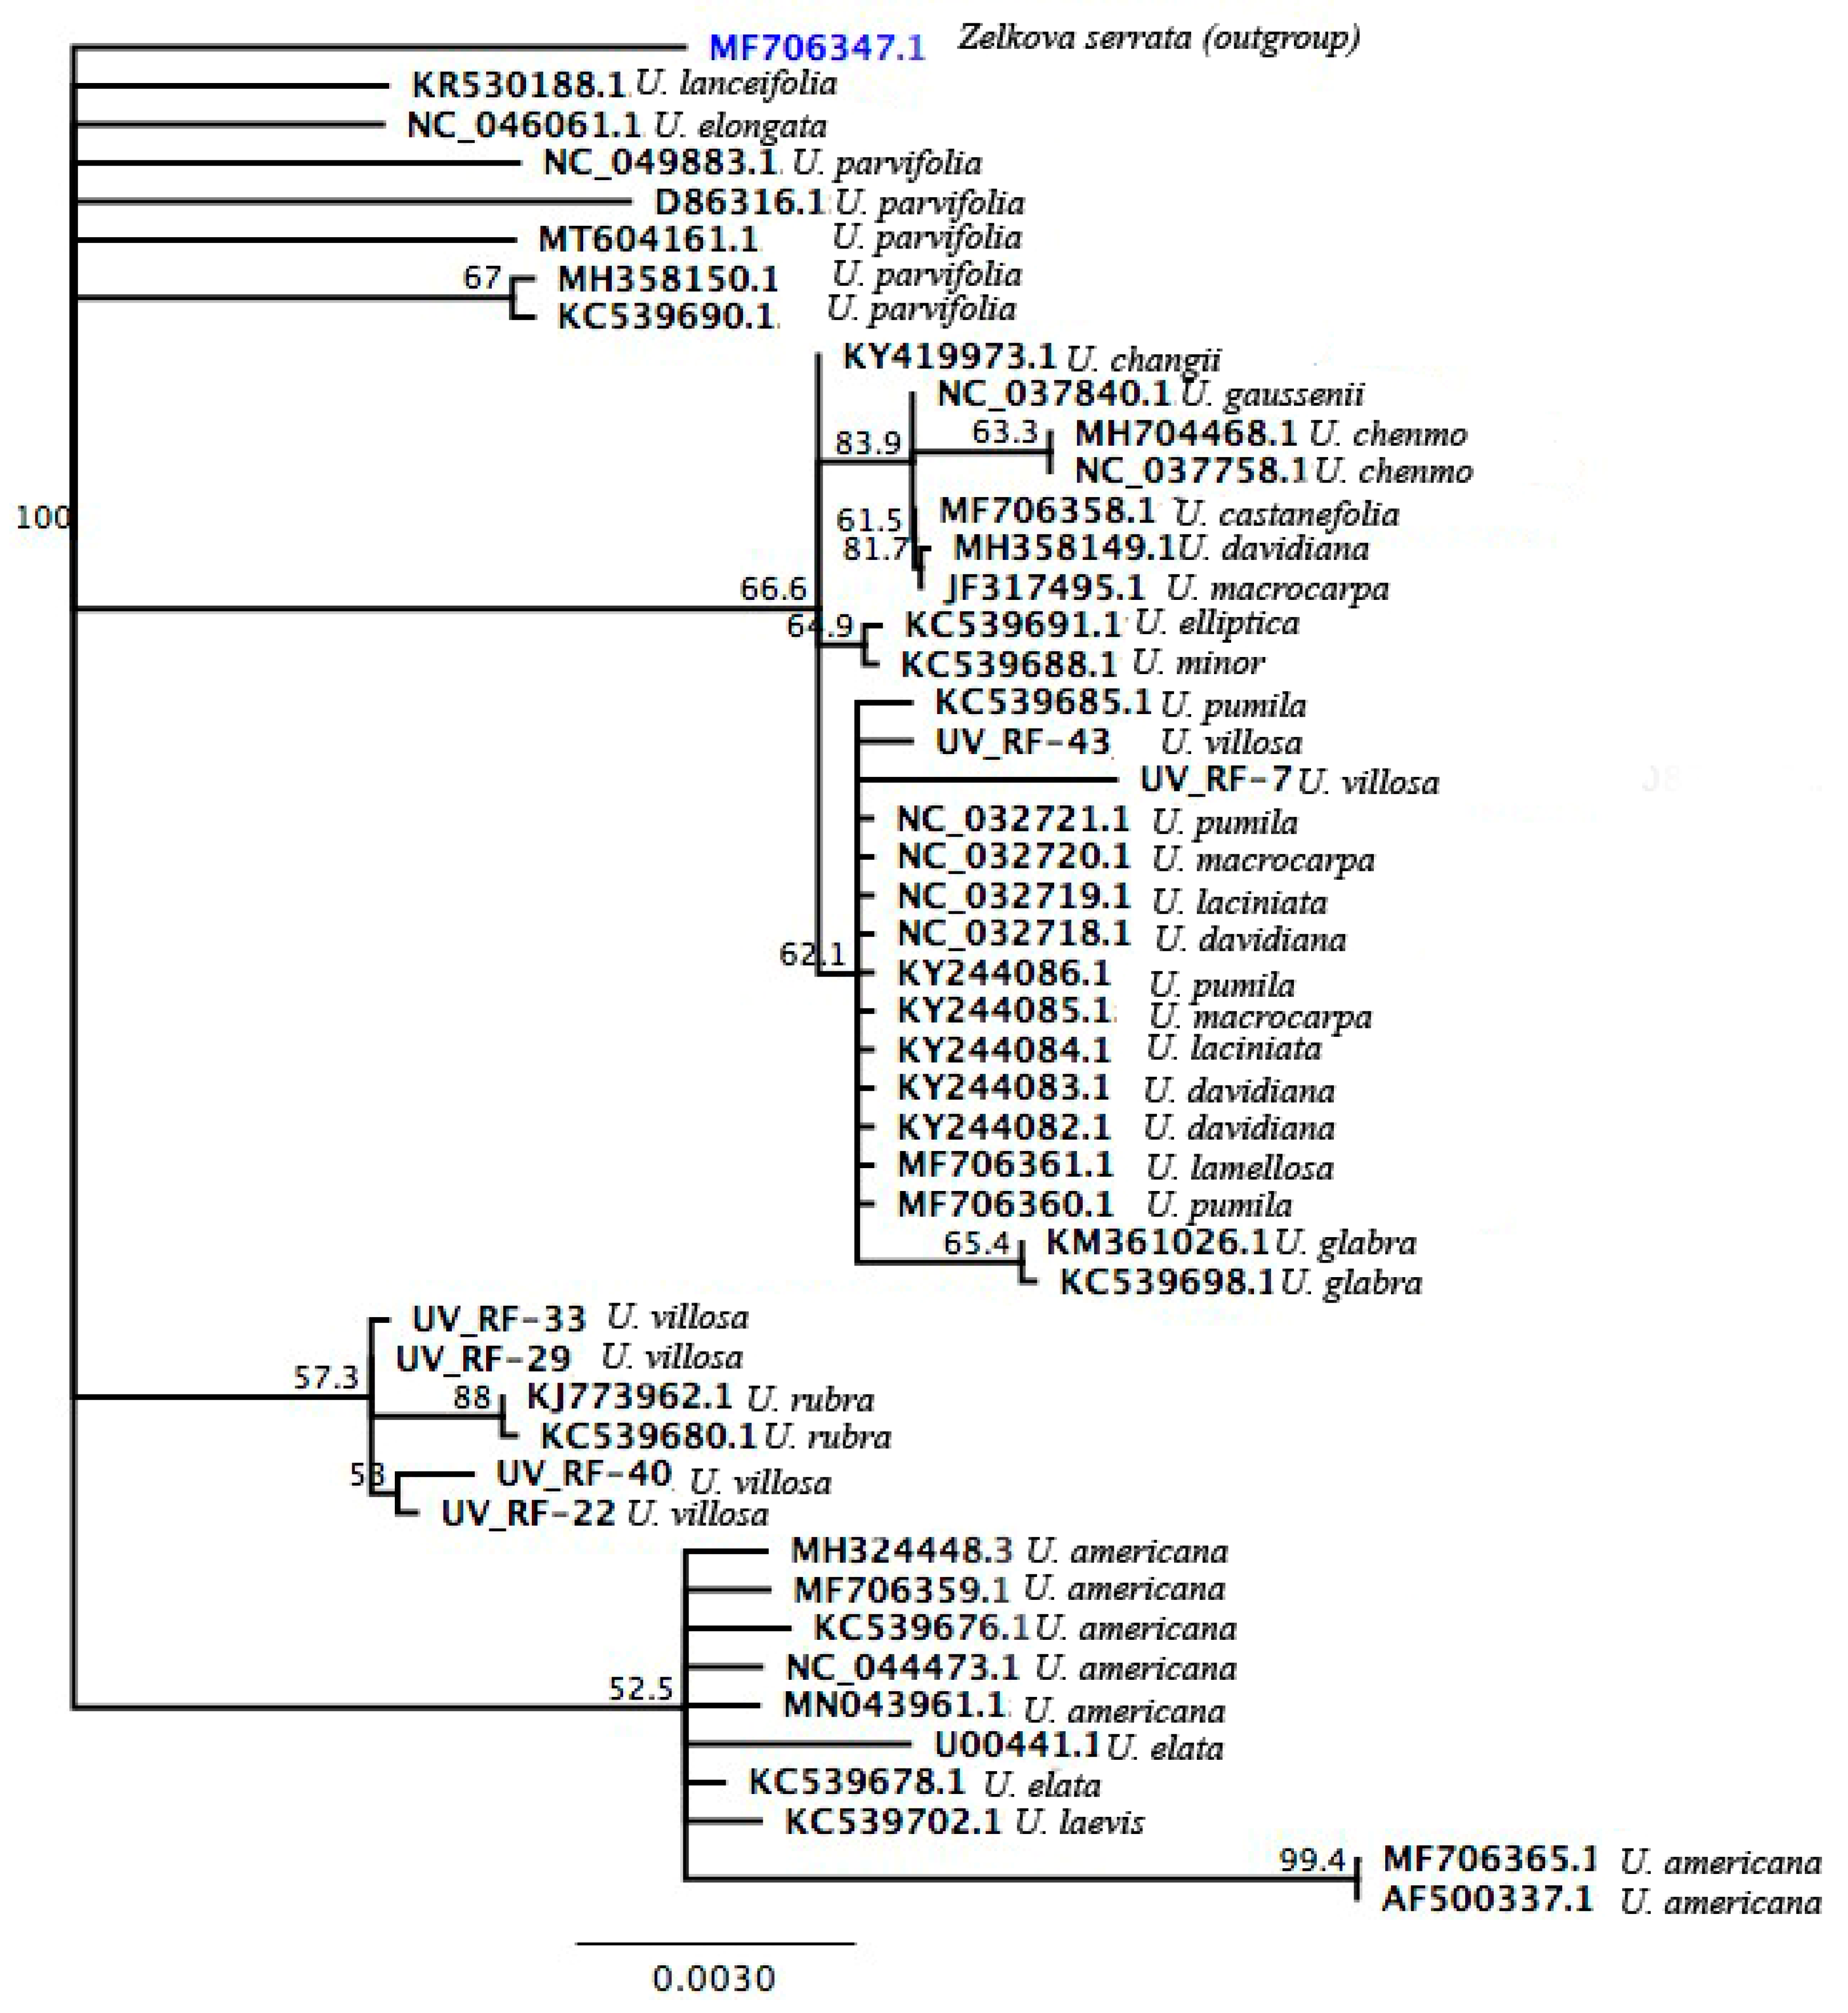
3.2.1. rbcL Sequences

The rbcL analysis included 49 sequences ranging from 630–686 bp, whereas six sequences were from the current study. Only those sequences are included from the NCBI that had at least 85% query cover and 90% identity to the query sequence. Percent (%) pairwise identity and identical sites were 99.2% and 95.8%, respectively. The rbcL region contained several insertions, deletions as well as a number of single nucleotide polymorphisms (SNPs) among the sequences (Figure 2).

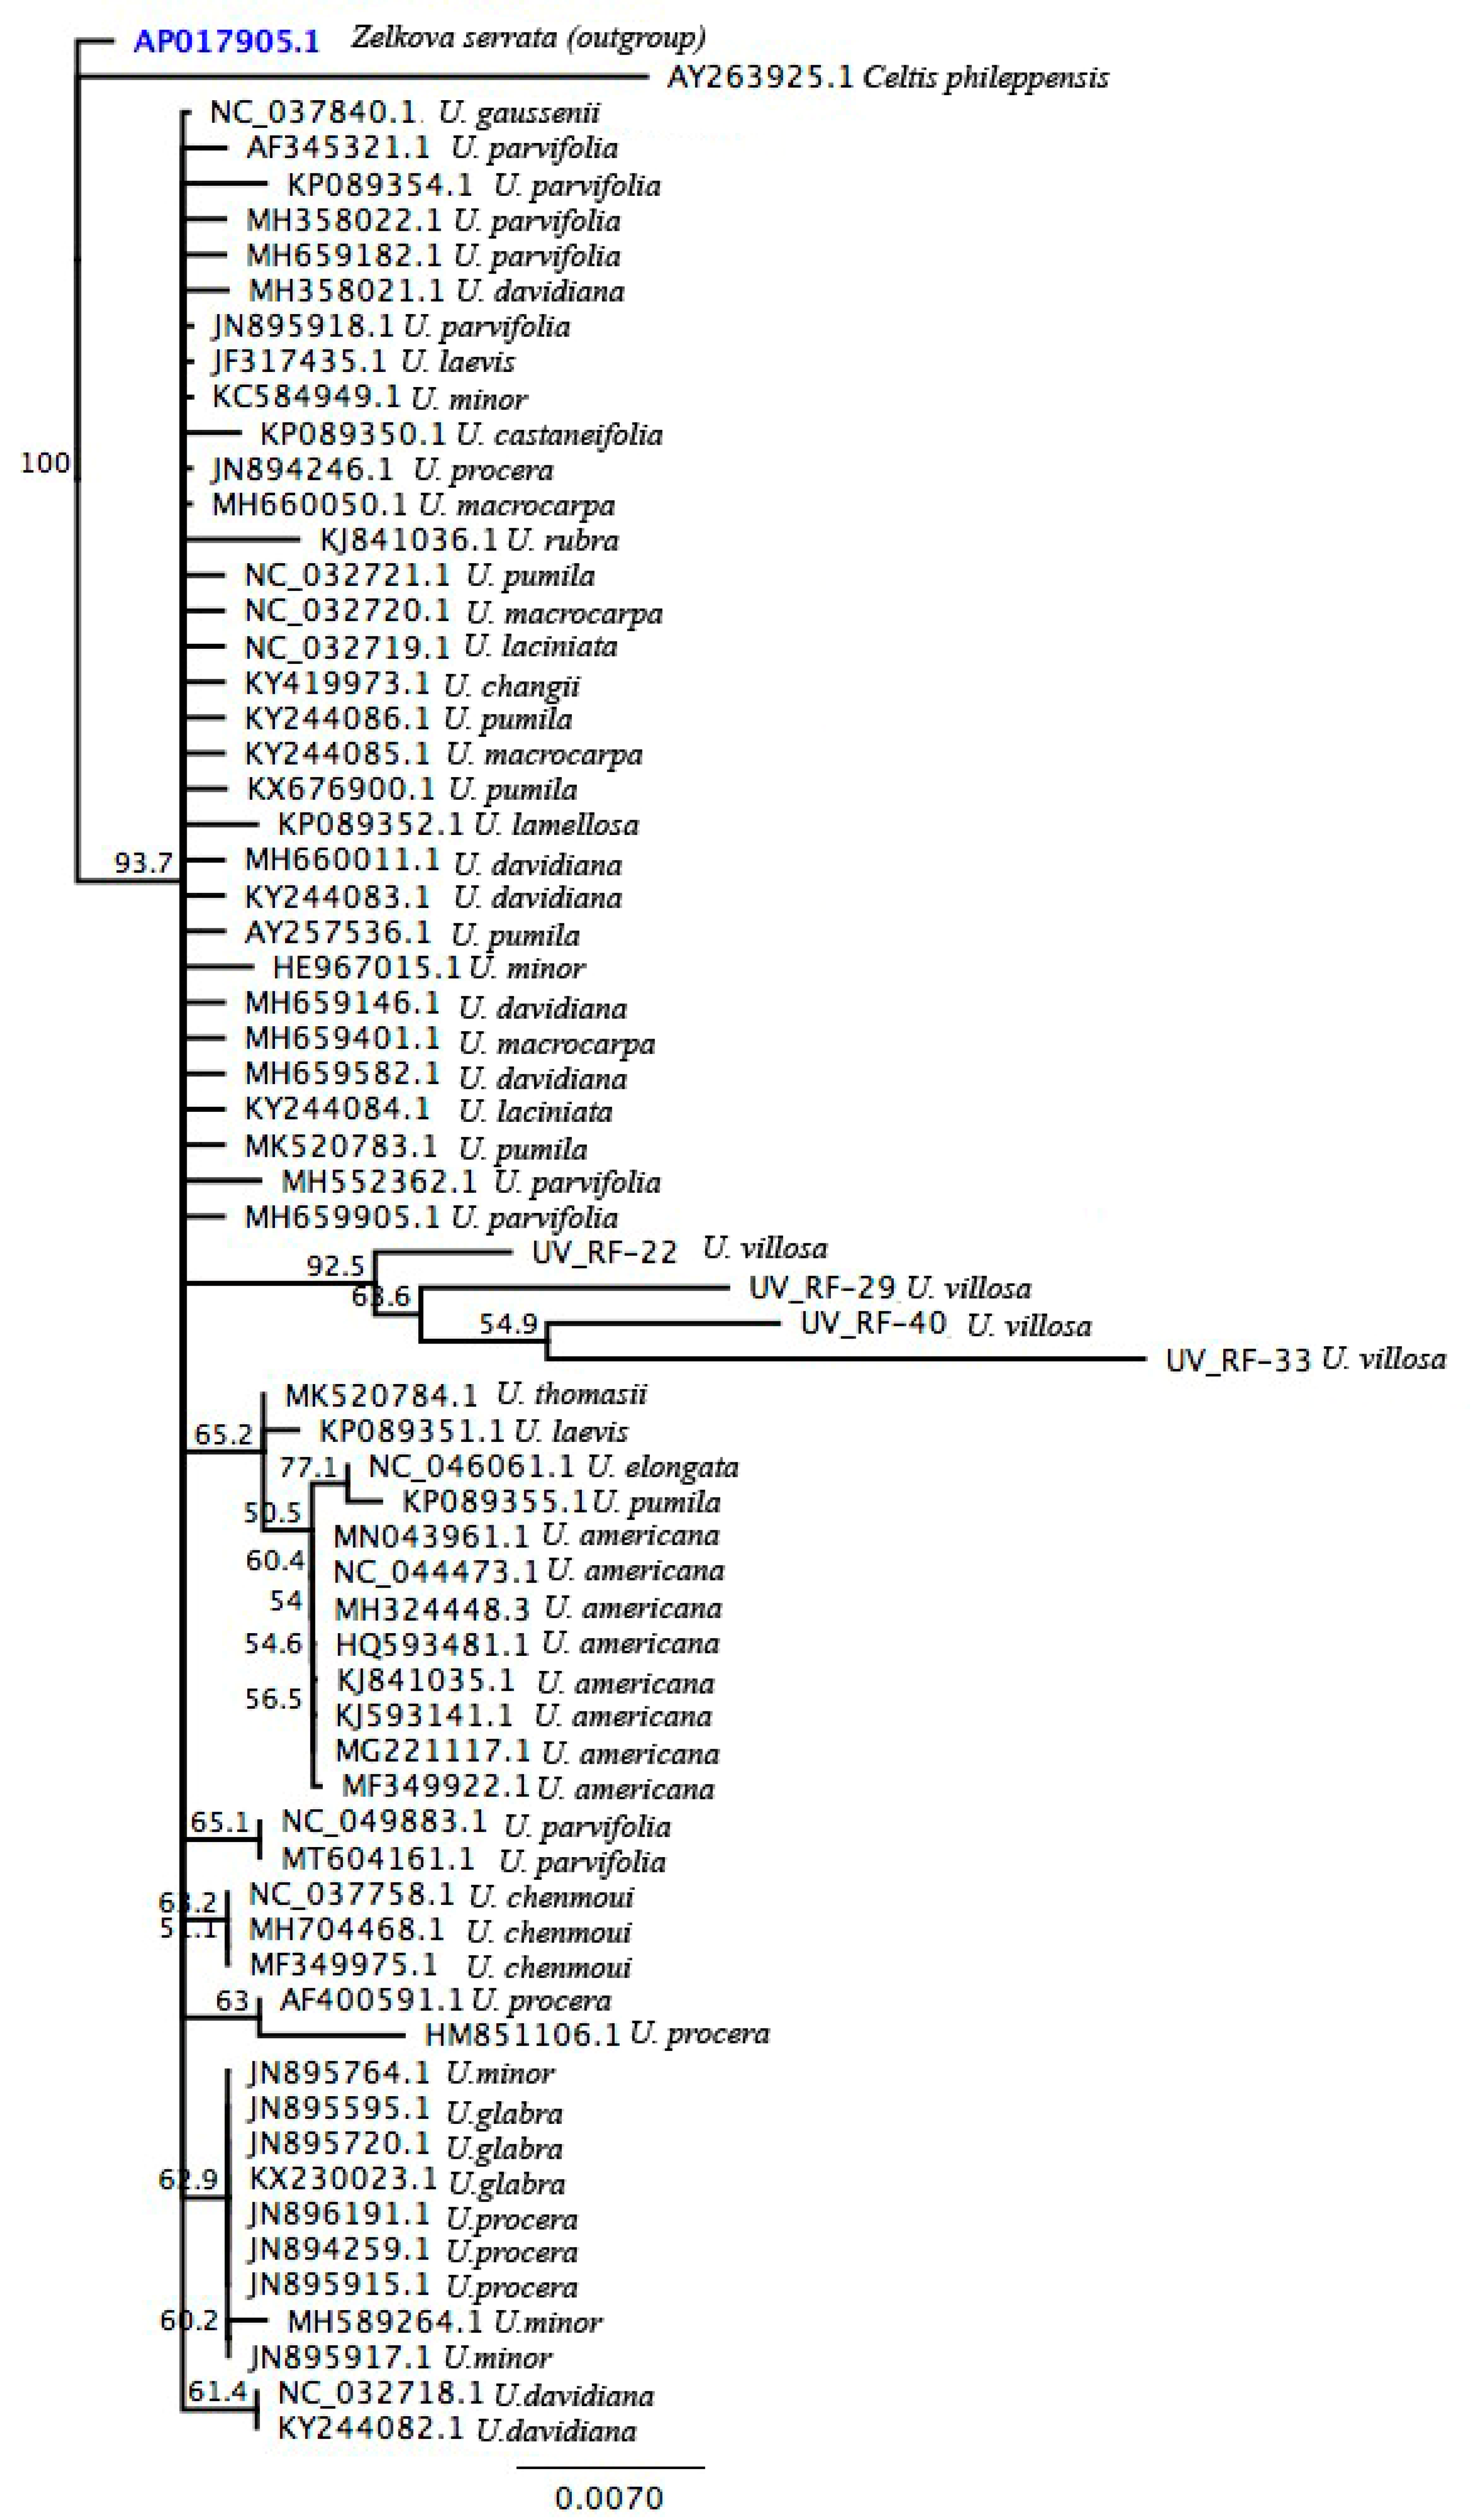
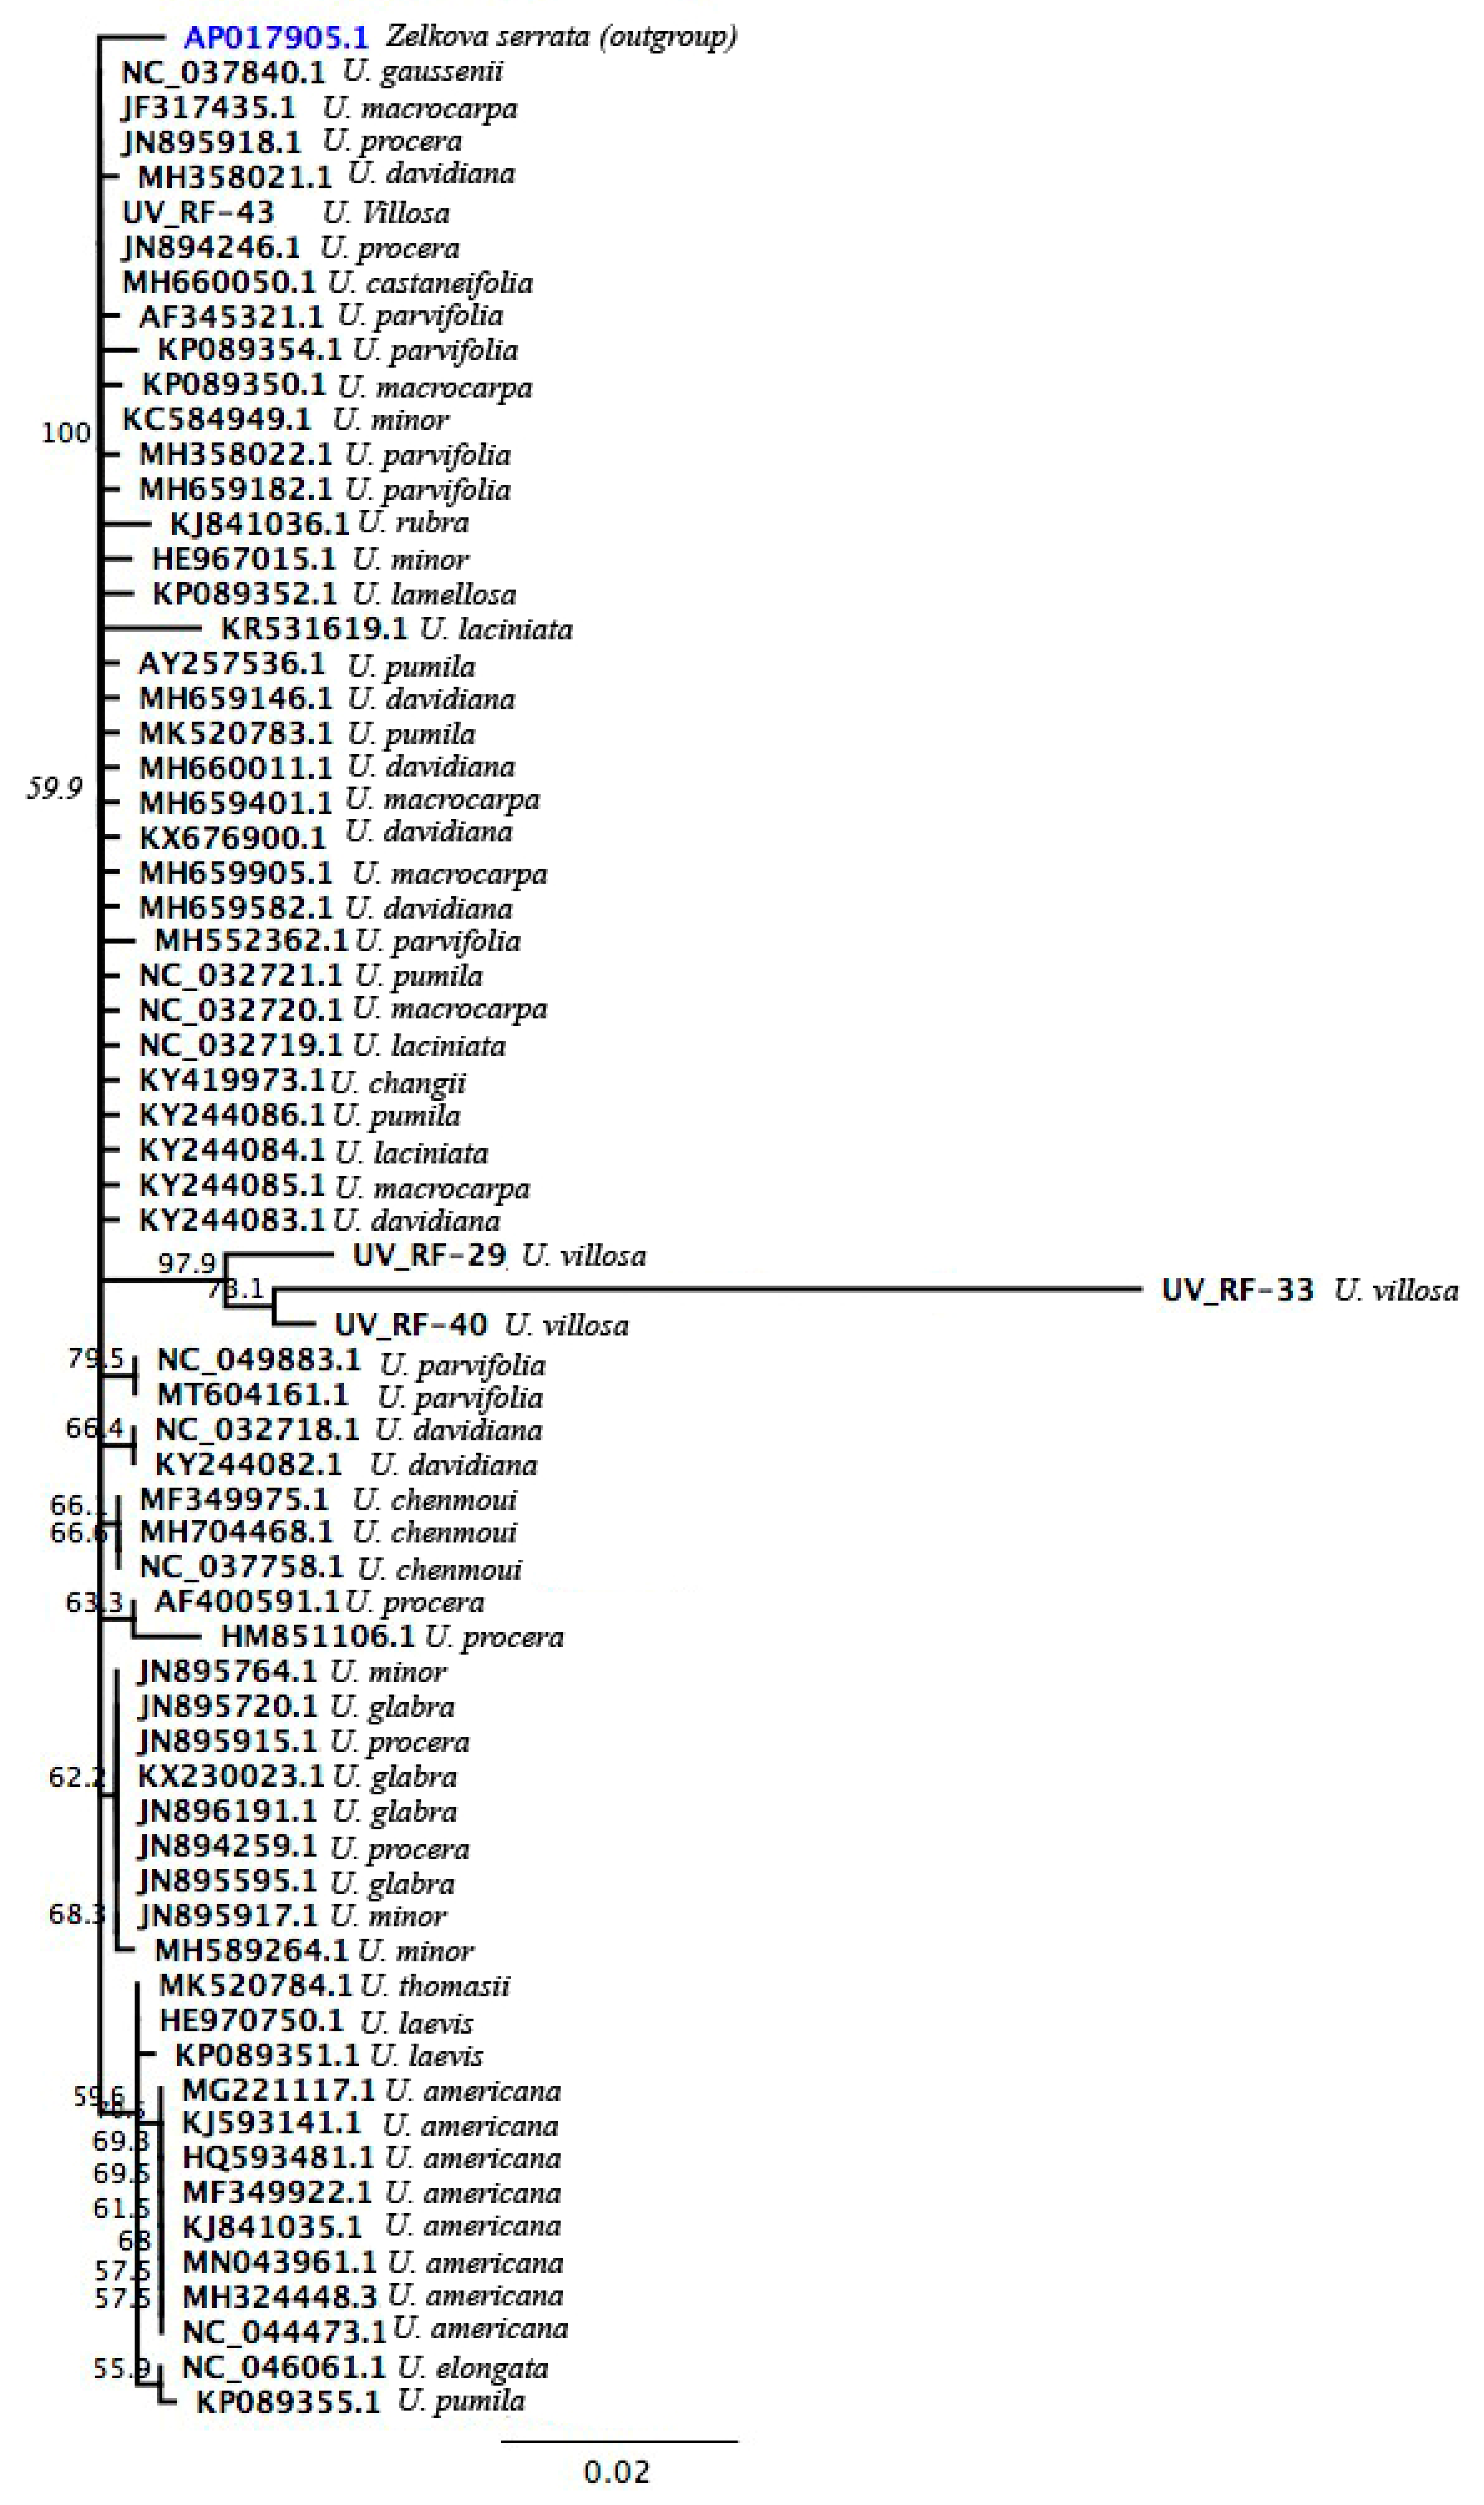
3.2.2. matK XF + 5R and matK 390F + 1326R Sequences

The matK region was amplified with two sets of primers: XF + 5R and 390F + 1326R. A total of four and four samples were respectively sequenced with matK XF + 5R and matK 390F + 1326R primers, whereas the overall analyses based on XF + 5R included 68 and 390F + 1326R included 69 sequences. Length of matK XF + 5R sequences ranged from 574–784 bp, whereas matK 390F + 1326R sequences were of 680–739 bp. Sequences downloaded from NCBI for both markers had at least 85% query cover and 90% identity to the query sequence. Percent (%) pairwise identity and identical sites were 99%, 81.5%, 98.9% and 80.3% (Table 2). The matK region contained insertions and deletions as well as a number of SNPs dispersed within the whole region (Figure 3 and Figure 4).

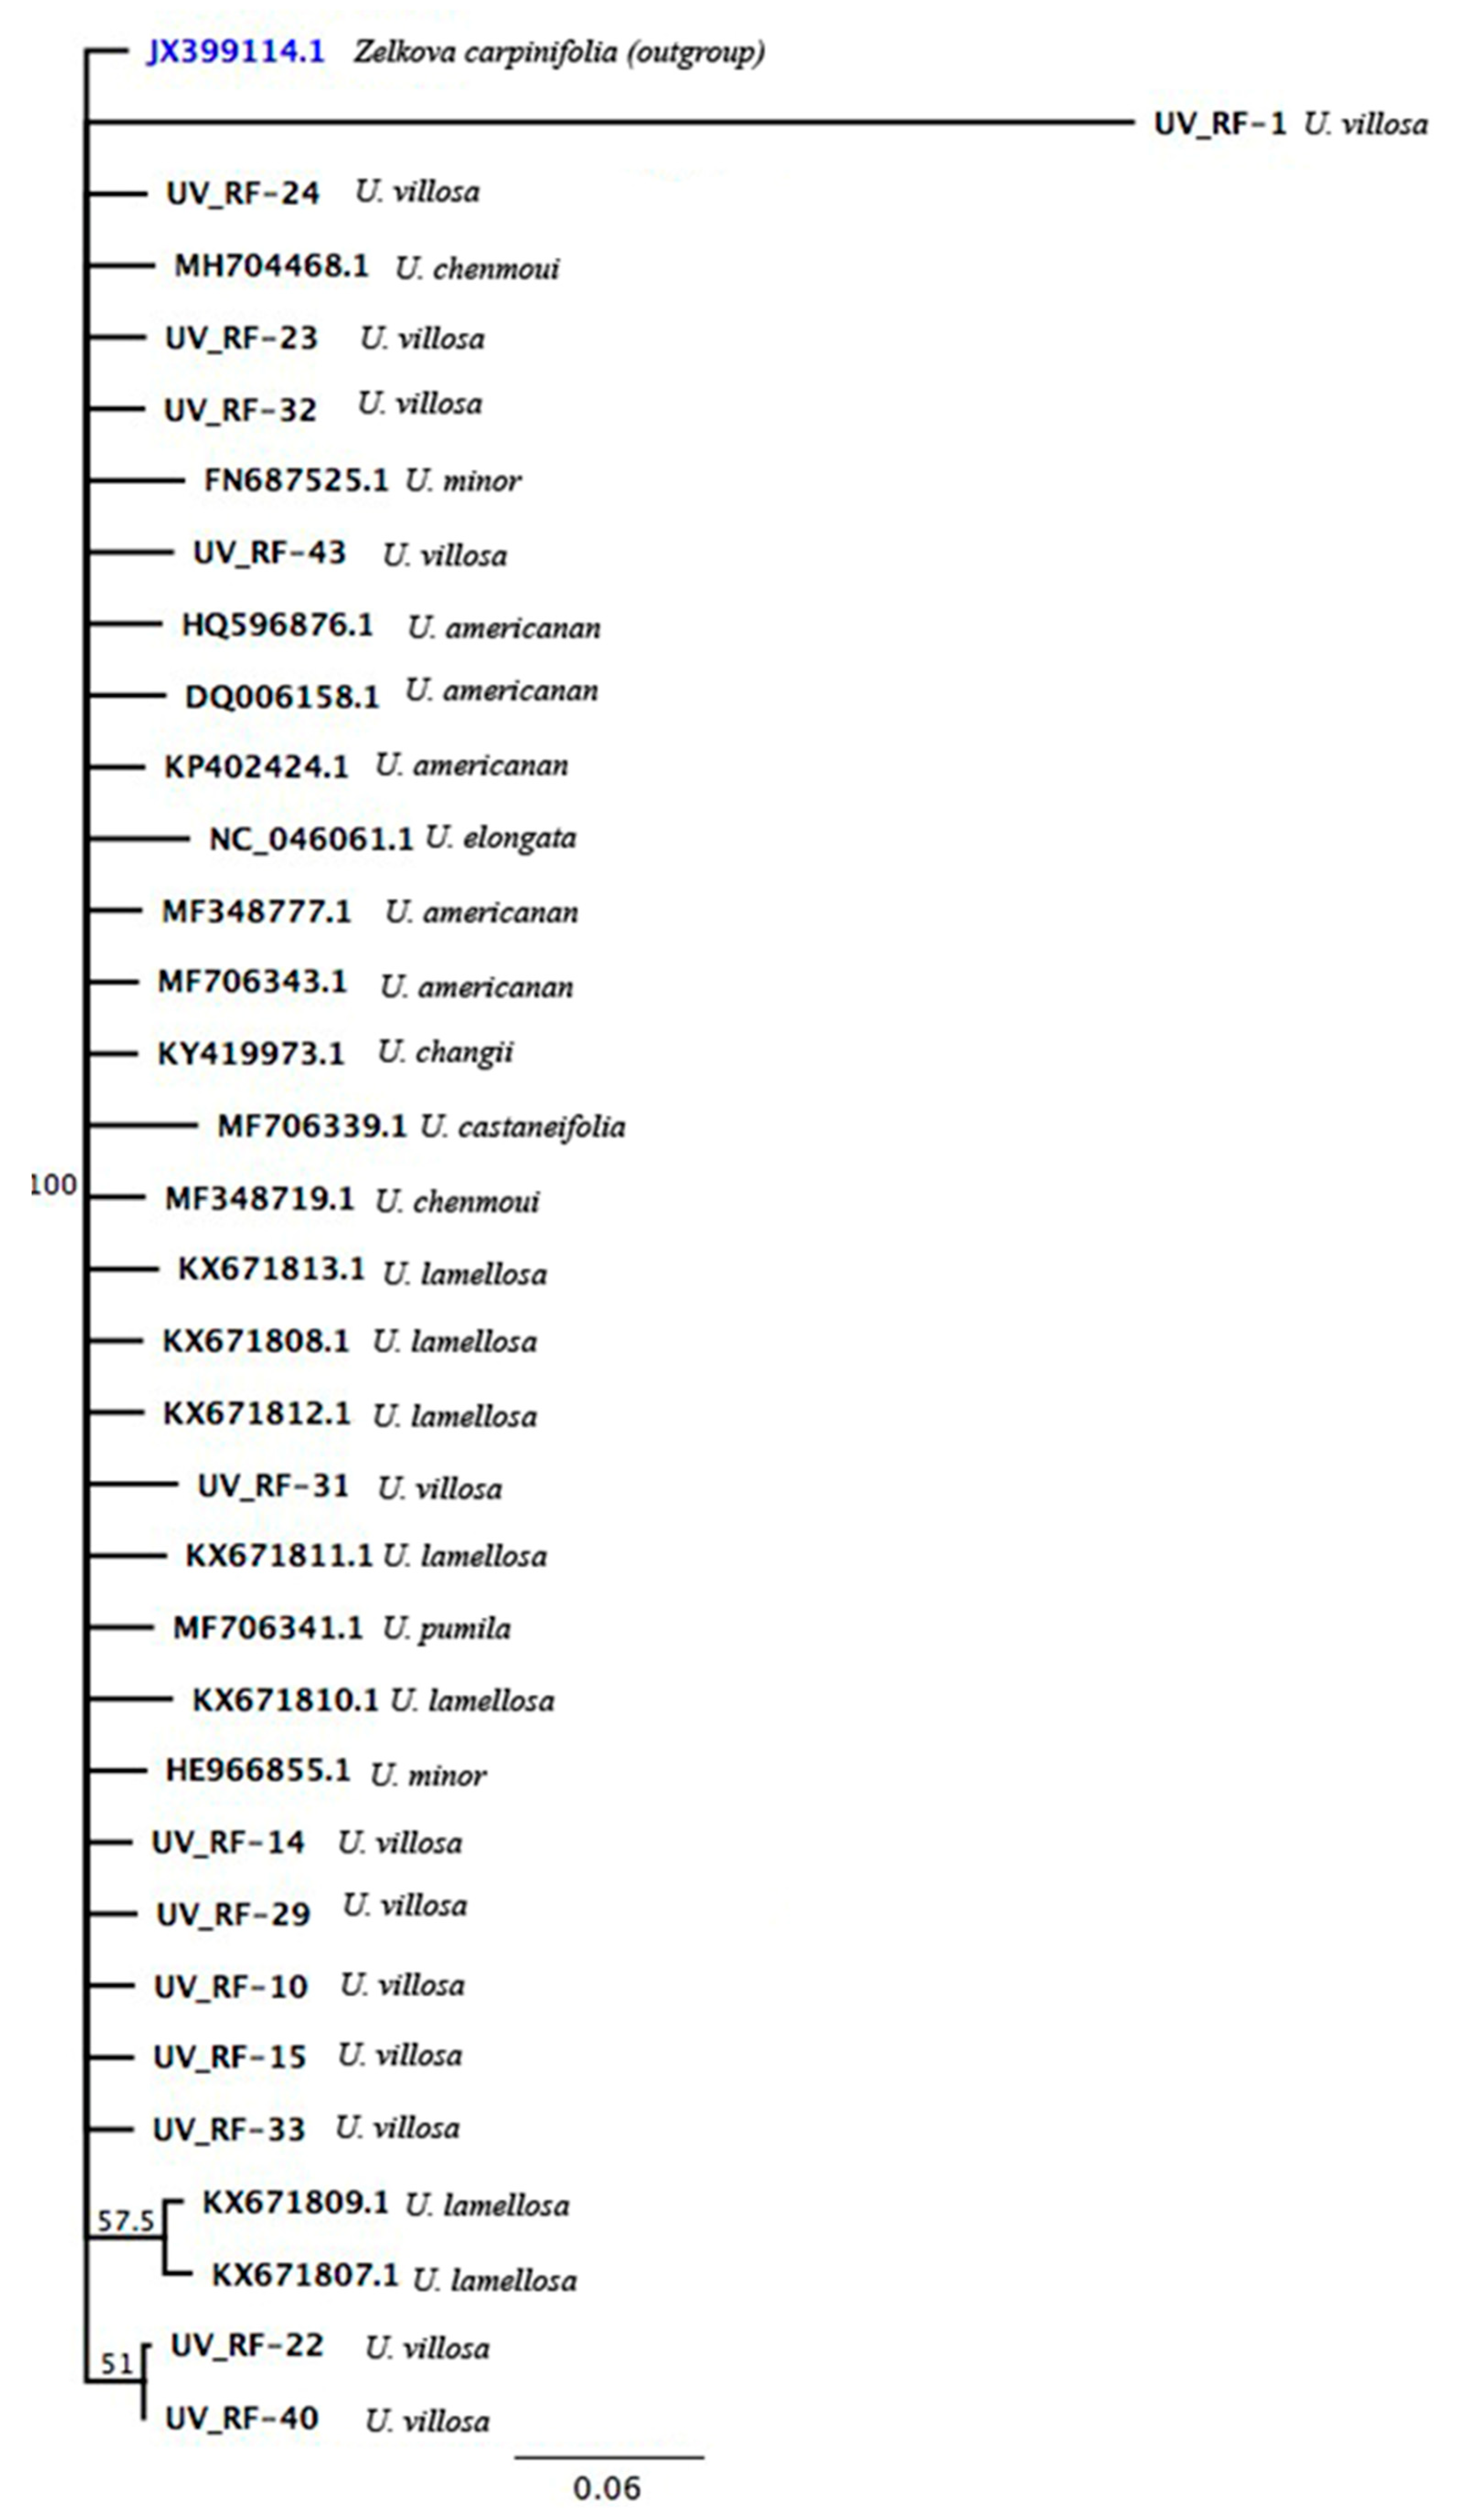
3.2.3. trnH-psbA Sequences

The trnH-psbA analysis included 34 sequences ranging from 195–310 bp, whereas 14 sequences were from the current study. Only those sequences are included that had at least 85% query cover and 86% identity to the query sequence. Percent (%) pairwise identity and identical sites were 85.1% and 43.4% respectively within the 50 sequences (Table 2). The trnH-psbA region contained several insertions, deletions as well as a number of single nucleotide polymorphisms (SNPs) among the sequences (Figure 5).

3.3. Phylogenetic Analysis

The barcode regions sequenced here or those downloaded from NCBI were very much identical except for the SNPs and discriminated different samples and species (Figure 6, Figure 7, Figure 8 and Figure 9). Sequences of Zelkova (Z. serrata (Thunb) Makino or Z. schneideriana Hand.-Mazz.) were used as the outgroup. All the four regions rbcL, matK XF + 5R, matK 390F + 1326R and trnH-psbA were used alone, and NJ tree were developed to discriminate species and samples of Ulmus. Furthermore, all regions independently have successfully resolved species into discrete cluster distinctly, though there were few exceptions (Figure 6), Figure 7, Figure 8 and Figure 9.
NJ tree based on rbcL region divided all sequences into one major clade and the Zelkova serrata sequence was selected as the outgroup, and it radiated out separately. There was deep branching within the tree, compared to the matK 390F + 1326R region indicative of the overall stability of rbcL region among the members of the genus Ulmus. As of 20 September 2020, no single sequence of rbcL region deriving from U. villosa was found in the NCBI. Successful sequencing resulted in six high quality samples for U. villosa. There was enough diversity within the rbcL region and samples of U. villosa were dispersed within two sub-clades. There is enough diversity within the U. villosa as indicated by the depressiveness of the samples and the samples like UV-RF-7, and UV-RF-43 revealed maximum similarity within their rbcL region and were placed closely along U. pumila L. sequences (Figure 6).
NJ tree based on matK XF + 5R region divided all sequences into one major clade, with no deep divisions of the sub-clades. To see the discriminating power of this region, Zelkova serrata was used as the outgroup whereas sequence as Celtis phileppensis Blanco was used to see the genetic affinity. Both sequences radiated out as separate branches. The remaining sequences of Ulmus species were resolved in mosaic including the all four sequences of U. villosa (UV-RF) in the middle flanked by U. parvifolia Jacq. And U. thomasii Sarg. Only the matK XF + 5R region/sequences of U. americana L. (eight sequences) were clustered into a closed group indicating to their potential shared maternity. Interestingly, U. villosa (UV-RF) sequences revealed variability, and the sequences of the species were dispersed in one sub-clade. It was interesting that U. villosa and U. parvifolia are genetically related, and this was evident from the co-localizaion of the two sequences at the periphery of the clade (Figure 7). Further, U. villosa is an endangered species, and sequences from samples like UV-RF-33 reveal highest variability within this sequenced region (Figure 3 and Figure 7), and conservation of such clones/genotypes of U. villosa will be of very high priority.
NJ tree based on matK 390F + 1326R region divided all sequences into two major clades Throughout there was no deep branching within the tree indicative of the overall diversity of matK 390F + 1326R region the genus. Zelkova serrata sequence was selected as an outgroup and it radiated out separately. As mentioned above, no single sequence of matK 390F + 1326R region deriving from U. villosa was found in the BLAST results of the NCBI. Successful sequencing of high quality was obtained for four U. villosa sequences. Although, three U. villosa were grouped in one major cluster here, but one UV-RF-43 associated with U. davidiana Planch and U. minor Mill. Subsp. Minor (Figure 8). It is notable that the U. villosa sample UV-RF-33 that revealed maximum diversity among the studied samples is worth of further assessing (Figure 8).
There was relatively fewer sequence of trnH-psbA region submitted to the NCBI database, and only 21 hits were obtained from related or somewhat related species. On the contrary among the sequences, high quality sequences from 14 samples of U. villosa were obtained for this region here. The NJ tree based on trnH-psbA region divided all 35 sequences into one major clade. Ulmus villosa sequences were dispersed within the whole tree, which is indicative of the very high variation within this region. Indeed, the multiple sequence alignment also revealed insertions, deletions and SNPs throughout the trnH-psbA region. Sequence of Zelkova caprinifolia (Pall.) K. Koch was used as an outgroup and it radiated out separately. Interestingly, it was flanked by U. vaillosa sequence (UV-RF-1) and then U. chenmoui W. C. Cheng in between other U. villosa sequences obtained here (Figure 9).

4. Discussion

Universal DNA barcoding is a widely used and effective tool for distinguishing diverse groups of plants and animal species [24]. This method can quickly and accurately identify plant species, and has improved our understanding of their genomic and phylogenetic relationships. However, land plants barcoding is more puzzling as the substitution rates within plant genomes are considerably lower than those of animals [25,26]. Still, there are exciting examples where the barcoding genes have been remarkably successful in resolving relationships of taxonomically complex groups or species-level molecular systematics [27]. The same principle is proposed for customs officers where the use of DNA barcodes might identify plant samples or species where trade is governed or prohibited by international agreements such as CITES [28].
Herein, for gaining insights into the diversity, potential origin and putative ancestry of U. villosa, universal barcoding genes, i.e., rbcL, matK and trnH regions were used (Table 1). More recently, the ITS as well as the rbcL regions of plants have provided a baseline for comparing other genes and intergenic spacers to be used as DNA barcodes. Similarly, the matK region has the potential to speed up the exploration and there are a number of studies where DNA barcoding have enhanced conservation efforts [26]. With all four barcode regions assessed here, at least one sequence of Zelkova species was selected as a reference (outgroup). Phylogenomic analysis based on chloroplast genome have revealed the close relationships of Z. serrata and Z. schneideriana to the genus Ulmus, and it forms a well-supported monophyletic clade sister to genus Ulmus [29]. Therefore, in all barcodes investigated here, Zelkova sequences were used as outgroup and it radiated out separately, this highlights the importance and robustness of DNA barcode at species or population level identification.
For the current study, four barcode regions were selected, and universal primers were used to amplify these loci [20,27]. The success rate of amplification was 100% and all primers were able to amplify genomic regions of the expected lengths (Figures S1 and S2). By and large, there was agreement to the previously published literature regarding size of the amplicons [27,28]. However, sequencing results were not uniform, and out of 27 samples of U. villosa for sequencing (Table 2), only six, four, four and 14 high quality reads were obtained for rbcL, matK XF + 5R, matK 390F + 1326R and trnH-psbA, respectively (Figure 2, Figure 3, Figure 4 and Figure 5).
For sequencing, samples collected from at least 50 m of elevation were used; interesting, the barcode loci indicated enough variability within the U. villosa regions. Indels and SNPs were found across the whole length of the regions used (Figure 2, Figure 3, Figure 4 and Figure 5). In addition to standard DNA barcodes (i.e., rbcL, matK and of trnH-psbA), other single-copy genes such as leafy and waxy genes are gaining importance at species-level systematics [25]. However, for these regions, lack of universal primers and the low success rate of the existing oligonucleotides have significantly reduced their potential use as barcodes [28]. Furthermore, a low success rate of amplification of these genes with existing primers is likely due to their lower copy number and DNA extraction of poor quality from degraded plant samples. Additionally, from a number of plant species, DNA extraction with the general CTAB method is not ideal as it results in low quality DNA with cellular contaminants, and this requires cloning of the PCR products before such regions could be sequenced [30,31].
Constraints imposed by time, and more specifically by resources, did not allow us to exploit the above regions or endeavor cloning, and thus chloroplast and mitochondrial genes were investigated in the current study. Kress and Erickson have criticized matK region mainly because no universal primers were available, in our case there was no issue with the amplification [20] and all samples have resulted in a PCR product of expected size (Figure S2B,C). Further, the matK primers XF and 5R or 390F and 1326R [32] had the same success rate of sequencing, and both have amplified the same region with a 100% success rate (Figure S2). The trnH-psbA loci is of low desire due to the extensive length variation and existence of pseudogene that are hosted by some species; this makes the alignment of sequences very difficult [32].
In some instances, trnH-psbA might indeed be problematic; however, in our case we found that it was one of the most useful regions with highest success rate of sequencing. On the contrary, ITS regions are the most frequently used barcode for plants, the success rate of sequencing here with ITS was the lowest and it was not accounted for even in the final analyses. Similarly, the success rate of sequencing using the same DNA quantity varied with every barcode. Thus, the simple looking task of selecting an appropriate locus to serve as a plant barcode has been much more complex, and there are no available DNA barcodes with likewise efficiency or that could work across all species [26].
Despite the current lack of consensus on a universal plant barcode, application of a genetic identifier to a wide set of research and applied programs has been projected [30,31,32]. More recently, it has been argued that single-locus DNA barcodes lack adequate variations in closely related taxa and might not serve the aim of precise species level identification; more stress is placed on the use of whole chloroplast genomes [29]. Over the years, chloroplast sequences are becoming more readily available because of improvements in sequencing technologies and cost [27,29]. No doubt, the chloroplast genome sequencing can deliver a reliable barcode for accurate plant identification, though it is not yet resource effective, and cannot serve or replace the single-locus barcodes [26,27,28,29,30,31,32].
Nucleotide sequence analysis of the four genes revealed high levels of polymorphism. Additionally, the unconventional use of the assembly algorithm to group the most similar sequences that does not account for random nucleotide variations, and the phylogenetic trees built using the NJ algorithm revealed some important patterns of relationships within Ulmus species. In addition, recombinant sequences (or at least very diverse) were identified (e.g., UV-RF-33 using matK) by the NJ algorithm and such features of sequence evolution would be extremely interesting to confirm it with additional markers.
The overall phylogenetic results indicated that Ulmus is not a monophyletic genus, and these results are in agreement with some of the most recent reports [26,29]. Notably, no U. parvifolia was found in the study area and only sequences were included from the NCBI, but within the NJ trees here, U. villosa constituted a well-supported clade sister to U. parvifolia indicating that in both trees, it resulted from matK region and indicative to their close relationships and possible shared ancestry. Further, it is reasoned that there have been multiple speciation events that have resulted in the evolution of U. villosa. We suggest that complete chloroplast genome of U. villosa may provide important information for phylogenetic and evolutionary studies in Ulmaceae, as well as in other closely related families.

5. Conclusions

Here, 27 U. villosa samples were investigated with four barcoding markers. The sequenced regions contained insertions and deletions as well as several SNPs across the length of sequences, and now PCR based markers may be developed for these novel SNPs markers. The phylogenetic results support the polyphyletic origin of the genus Ulmus, and the data indicated that there is enough genetic variability within the U. villosa population that has resulted from possible multiple speciation events or subsequent evolution during acclimatization of U. villosa in the region. The results presented here provide novel insights into the genomic diversity as well as phylogenetic relationships of U.villosa with other species and may facilitate future sustainable conservation efforts.

Supplementary Materials

The following supporting information can be downloaded at: https://www.mdpi.com/article/10.3390/app12189293/s1, Figures S1 and S2: PCR amplification of rbcL”.

Author Contributions

R.U.K. and S.U.R.: conceptualization, methodology, software, data curation, writing—original draft preparation. N.A.: supervision, N.A. and I.U.R.: helped in writing and editing and validation. N.u.H. and I.U.R.: methodology, visualization, validation. I.U.R., A.H., K.F.A., E.F.A. and W.H.: discussion, reviewing and editing, validation. N.u.H., M.A.K., F.R. and F.U.K.: helped in gathering literature and editing. All authors have read and agreed to the published version of the manuscript.

Funding

The authors would like to extend their sincere appreciation to the Researchers Supporting Project Number (RSP-2021/356), King Saud University, Riyadh, Saudi Arabia.

Institutional Review Board Statement

The current study did not include Human or Animal samples and was authorized by the Directorate of Advance Studies and Re-search Board (ASRB) of Hazara University, Mansehra Pakistan.

Informed Consent Statement

Not applicable.

Data Availability Statement

Not applicable.

Acknowledgments

We would like to thank Azhar Hussain Shah member of the Department of Biotechnology & Genetic Engineering, Hazara University, Mansehra, Pakistan for providing lab facilities and useful input. The authors would like to extend their sincere appreciation to the Researchers Supporting Project Number (RSP-2021/ 356), King Saud University, Riyadh, Saudi Arabia.

Conflicts of Interest

All the authors declare that they have no conflict of interest.

References

  1. Richins, M.L. Negative Word-of-Mouth by Dissatisfied Consumers: A Pilot Study. J. Mark. 1983, 47, 68–78. [Google Scholar] [CrossRef]
  2. Khan, R.; Ali, N.; Hussain, M.; Rahman, I.U.; Majid, A.; Romman, M.; Ahmed, T.; Shah, A.H. Evaluation of the Conservation Status of Ulmus wallichiana and U. vilosa in Pakistan. Pakistan J. Bot. 2021, 53, 2127–2134. [Google Scholar] [CrossRef]
  3. Reisch, C.; Hartig, F. Species and Genetic Diversity Patterns Show Different Responses to Land Use Intensity in Central European Grasslands. Divers. Distrib. 2021, 27, 392–401. [Google Scholar] [CrossRef]
  4. Vu, D.D.; Bui, T.T.X.; Nguyen, M.T.; Vu, D.G.; Nguyen, M.D.; Bui, V.T.; Huang, X.; Zhang, Y. Genetic Diversity in Two Threatened Species in Vietnam: Taxus chinensis and Taxus wallichiana. J. For. Res. 2017, 28, 265–272. [Google Scholar] [CrossRef]
  5. Vu, D.D.; Bui, T.T.X.; Nguyen, M.D.; Shah, S.N.M.; Vu, D.G.; Zhang, Y.; Nguyen, M.T.; Huang, X.H. Genetic Diversity and Conservation of Two Threatened Dipterocarps (Dipterocarpaceae) in Southeast Vietnam. J. For. Res. 2019, 30, 1823–1831. [Google Scholar] [CrossRef]
  6. Nguyen, T.M.; Vu, D.D.; Dang, H.P.; Bui, X.T.T.; Nguyen, H.P.L.; Nguyen, D.M. Population Genetic Structure and Demographic History of the Dipterocarp Species Anisoptera Costata Korth Revealed by Microsatellite Analysis. Planta 2021, 253, 66. [Google Scholar] [CrossRef] [PubMed]
  7. Frankham, R.; Ballou, J.D.; Briscoe, D.A.; McInnes, K.H. Introduction to Conservation Genetics; Cambridge University Press: Cambridge, UK, 2002. [Google Scholar]
  8. Petit, R.J.; El Mousadik, A.; Pons, O. Identifying Populations for Conservation on the Basis of Genetic Markers. Conserv. Biol. 1998, 12, 844–855. [Google Scholar] [CrossRef]
  9. Wiegrefe, S.J.; Sytsma, K.J.; Guries, R.P. Phylogeny of Elms (Ulmus, Ulmaceae): Molecular Evidence for a Sectional Classification. Syst. Bot. 1994, 19, 590–612. [Google Scholar] [CrossRef]
  10. Machon, N.; Lefranc, M.; Bilger, I.; Mazer, S.J.; Sarr, A. Allozyme Variation in Ulmus Species from France: Analysis of Differentiation. Heredity 1997, 78, 12–20. [Google Scholar] [CrossRef]
  11. Cogolludo-Agustín, M.Á.; Agúndez, D.; Gil, L. Identification of Native and Hybrid Elms in Spain Using Isozyme Gene Markers. Heredity 2000, 85, 157–166. [Google Scholar] [CrossRef] [Green Version]
  12. Goodall-Copestake, W.P.; Hollingsworth, M.L.; Hollingsworth, P.M.; Jenkins, G.I.; Collin, E. Molecular Markers and Ex Situ Conservation of the European Elms (Ulmus Spp.). Biol. Conserv. 2005, 122, 537–546. [Google Scholar] [CrossRef]
  13. Pooler, M.R.; Townsend, A.M. DNA Fingerprinting of Clones and Hybrids of American Elm and Other Elm Species with AFLP Markers. J. Environ. Hortic. 2005, 23, 113–117. [Google Scholar] [CrossRef]
  14. Collada, C.; Fuentes-Utrilla, P.; Gil, L.; Cervera, M.T. Characterization of Microsatellite Loci in Ulmus minor Miller and Cross-Amplification in U. Glabra Hudson and U. Laevis Pall. Mol. Ecol. Notes 2004, 4, 731–732. [Google Scholar] [CrossRef]
  15. Zalapa, J.E.; Brunet, J.; Guries, R.P. Isolation and Characterization of Microsatellite Markers for Red Elm (Ulmus rubra Muhl.) and Cross-Species Amplification with Siberian Elm (Ulmus pumila L.). Mol. Ecol. Resour. 2008, 8, 109–112. [Google Scholar] [CrossRef]
  16. Hebert, P.D.N.; Cywinska, A.; Ball, S.L.; deWaard, J.R. Biological Identifications through DNA Barcodes. Proceedings. Biol. Sci. 2003, 270, 313–321. [Google Scholar] [CrossRef]
  17. Kress, W.J.; Erickson, D.L. A Two-Locus Global DNA Barcode for Land Plants: The Coding RbcL Gene Complements the Non-Coding TrnH-PsbA Spacer Region. PLoS ONE 2007, 2, e508. [Google Scholar] [CrossRef]
  18. De Moraes Russo, C.A.; Selvatti, A.P. Bootstrap and Rogue Identification Tests for Phylogenetic Analyses. Mol. Biol. Evol. 2018, 35, 2327–2333. [Google Scholar] [CrossRef]
  19. Kress, W.J.; Erickson, D.L. DNA Barcodes: Genes, Genomics, and Bioinformatics. Proc. Natl. Acad. Sci. USA. 2008, 105, 2761–2762. [Google Scholar] [CrossRef]
  20. Kearse, M.; Moir, R.; Wilson, A.; Stones-Havas, S.; Cheung, M.; Sturrock, S.; Buxton, S.; Cooper, A.; Markowitz, S.; Duran, C.; et al. Geneious Basic: An Integrated and Extendable Desktop Software Platform for the Organization and Analysis of Sequence Data. Bioinformatics 2012, 28, 1647–1649. [Google Scholar] [CrossRef]
  21. Tamura, K.; Stecher, G.; Peterson, D.; Filipski, A.; Kumar, S. MEGA6: Molecular Evolutionary Genetics Analysis Version 6.0. Mol. Biol. Evol. 2013, 30, 2725–2729. [Google Scholar] [CrossRef] [Green Version]
  22. Tuimala, J. A Primer to Phylogenetic Analysis Using the PHYLIP Package; Center for Scientific Computing Ltd: Espoo, Finland, 2004. [Google Scholar]
  23. Kress, W.J. Plant DNA Barcodes: Applications Today and in the Future. J. Syst. Evol. 2017, 55, 291–307. [Google Scholar] [CrossRef]
  24. Nithaniyal, S.; Parani, M. Evaluation of Chloroplast and Nuclear DNA Barcodes for Species Identification in Terminalia L. Biochem. Syst. Ecol. 2016, 68, 223–229. [Google Scholar] [CrossRef]
  25. Li, M.; Chen, Q.; Zhang, L.; Guo, P.; Wang, Y. The Complete Chloroplast Genome Sequence of Ulmus parvifolia (Ulmaceae). Mitochondrial DNA. Part B Resour. 2020, 5, 2957–2958. [Google Scholar] [CrossRef] [PubMed]
  26. Yu, M.; Jiao, L.; Guo, J.; Wiedenhoeft, A.C.; He, T.; Jiang, X.; Yin, Y. DNA Barcoding of Vouchered Xylarium Wood Specimens of Nine Endangered Dalbergia Species. Planta 2017, 246, 1165–1176. [Google Scholar] [CrossRef] [PubMed]
  27. Lahaye, R.; van der Bank, M.; Bogarin, D.; Warner, J.; Pupulin, F.; Gigot, G.; Maurin, O.; Duthoit, S.; Barraclough, T.G.; Savolainen, V. DNA Barcoding the Floras of Biodiversity Hotspots. Proc. Natl. Acad. Sci. USA 2008, 105, 2923–2928. [Google Scholar] [CrossRef]
  28. Wang, L.; Zhang, R.; Geng, M.; Qin, Y.; Liu, H.; Li, M. The Complete Chloroplast Genome of Zelkova Serrata and Its Phylogenetic Position within Ulmaceae. Mitochondrial DNA. Part B Resour. 2020, 5, 2182–2183. [Google Scholar] [CrossRef]
  29. Shuvaev, S.A.; Başerdem, B.; Zador, A.M.; Koulakov, A.A. Network Cloning Using DNA Barcodes. Proc. Natl. Acad. Sci. USA 2019, 116, 9610–9615. [Google Scholar] [CrossRef]
  30. Healey, A.; Furtado, A.; Cooper, T.; Henry, R.J. Protocol: A Simple Method for Extracting next-Generation Sequencing Quality Genomic DNA from Recalcitrant Plant Species. Plant Methods 2014, 10, 21. [Google Scholar] [CrossRef]
  31. Cuénoud, P.; Savolainen, V.; Chatrou, L.W.; Powell, M.; Grayer, R.J.; Chase, M.W. Molecular Phylogenetics of Caryophyllales Based on Nuclear 18S RDNA and Plastid RbcL, AtpB, and MatK DNA Sequences. Am. J. Bot. 2002, 89, 132–144. [Google Scholar] [CrossRef]
  32. Chase, M.W.; Cowan, R.S.; Hollingsworth, P.M.; Van Den Berg, C.; Madriñán, S.; Petersen, G.; Seberg, O.; Jørgsensen, T.; Cameron, K.M.; Carine, M.; et al. A Proposal for a Standardised Protocol to Barcode All Land Plants. Taxon 2007, 56, 295–299. [Google Scholar] [CrossRef]
Figure 1. GIS generated map of Hazara Division, western Himalayas indicating to neighboring regions. Sampling plots of U. villosa are represented with dots.
Applsci 12 09293 g001
Figure 2. Multiple sequence alignment of the rbcL region of Ulmus villosa from Pakistan. Different colors indicate SNPs within the rbcL region.
Applsci 12 09293 g002
Figure 3. Multiple sequence alignment of the matK XF + 5R region of U. vilosa from Pakistan. Different colors indicate the SNPs within the matK region.
Applsci 12 09293 g003
Figure 4. Multiple sequence alignment of the matK 390F + 1326R sequences of U. villosa from Pakistan. Different colors indicate the SNPs within the matK region.
Applsci 12 09293 g004
Figure 5. Multiple sequence alignment of the trnH-psbA sequences of U. villosa from Pakistan, different colors indicate insertions and deletions as well as SNPs within the trnH-psbA region.
Applsci 12 09293 g005
Figure 6. Neighbor joining (NJ) tree based on rbcL region. The bootstrap consensus tree was inferred from 1000 replicates.
Applsci 12 09293 g006
Figure 7. Neighbor joining (NJ) tree based on matK XF + 5R region. The bootstrap consensus tree was inferred from 1000 replicates.
Applsci 12 09293 g007
Figure 8. Neighbor joining (NJ) tree based on matK 390F + 1326R region. The bootstrap consensus tree was inferred from 1000 replicates.
Applsci 12 09293 g008
Figure 9. Neighbor joining (NJ) tree based on trnH-psbA region. The bootstrap consensus tree was inferred from 1000 replicates.
Applsci 12 09293 g009
Table 1. List of barcoding genes used for Polymerase Chain Reaction (PCR) and sequencing with experimentally optimized amplification temperature.
Sr.Barcode/Marker NameSequence (5-3′)Optimum Temperature °CAmplified Product Size
1rbcL *a1F: ATGTCACCACAAACAGAAAC
724R: TCGCATGTACCTGCAGTAGC
52726 bp
2matK *aXF: TAATTTACGATCAATTCATTC
5R: GTTCTAGCACAAGAAAGTCG
52802 bp
3matK *a390F: CGATCTATTCATTCAATATTTC
1326R: TCTAGCACACGAAAGTCGAAGT
49.5966 bp
4trnH-psbA *bF: GTTATGCATGAACGTAATGCTC
R: CGCGCATGGTGGATTCACAATCC
55651 bp
*a chloroplast genes (ribulose-bisphosphate carboxylase and maturase K). *b ribosomal gene.
Table 2. Summary of the sequences used as barcoding molecular markers in this study and relevant information after BLAST search in NCBI.
Region/Sequence NameTotal Sequences Included% Pairwise Identity% Identical SitesMax Length (bp)Min Sequence Length (bp)
matK 390F + 1326R6998.980.3739680
rbcL4999.295.8686630
trnH-psbA3485.143.4310195
matK XF + 5R6899.081.5784574
Publisher’s Note: MDPI stays neutral with regard to jurisdictional claims in published maps and institutional affiliations.

