1. Introduction
A group of farmers in Cisauk-Tangerang, Indonesia, have constructed a pilot greenhouse with the dimensions of length, width, and height being “20 m × 10 m × 3.5 m”, and it is equipped with a hydroponic system to cultivate mustard greens and watercress. The pilot greenhouse will be an example of a modern farming system for farmers in the region, especially in growing mustard greens and watercress. The hydroponic system will ensure adequate vegetable nutrients, while the greenhouse will ensure that the agriculture is free from insect pests. Cisauk is an area of Tangerang Regency, Banten Province, located on the island of Java, Indonesia, south of the equator, with a tropical climate, which is hot with high humidity [
1]. Geographically, Cisauk (6°19’50.7″ S 106°37’44.4″ E) is located 37 to 56 metres above sea level, with an average high/low temperature and humidity of “32/23 °C” and 86% [
2].
Mustard greens and watercress will grow well if the temperature is not more than “33 °C” and the humidity does not exceed 85% [
3,
4]. Temperatures that exceed these limits will inhibit the vegetable growth rate and quality, while excess moisture will cause the growth of fungus disease. The problem with the pilot greenhouse is that the air temperature during the day, from 7 a.m. to 5 p.m., is too high. A cooling system and simultaneously controlling the humidity in the greenhouse, which has relatively economical procurement and operational costs, is the way to solve this problem.
Much research has been conducted on horticultural agriculture and greenhouses, but most were conducted in geographical areas north of the equator [
5,
6,
7], with their hot temperature and low humidity—a challenge for researchers who engineer greenhouses. This condition differs from the geographical areas south of the equator, such as Indonesia, which is characterised by high temperatures and high humidity. Given the importance of controlling temperature and humidity in greenhouses, researchers have generally identified three standard methods: a forced convection system with a wall/roof ventilator, an air conditioning system, and a misting system [
7,
8,
9].
In the first method, the wall/roof ventilator serves to circulate the hotter air in the greenhouse to the open air outside. There are two types of wall/roof ventilators: one that can rotate due to the difference in air temperature and another that is driven by an electric motor. One study by Nikolaou et al. was conducted in a “504 m
2” greenhouse in Cyprus that used a pad and fan cooling system [
7]. The study aimed to determine the effectiveness of using a pad and fan cooling system in greenhouses in boosting cucumber growth under Mediterranean climatic conditions. The results showed that the cucumbers could be harvested every harvest period for one year, and the system could prevent plants from overheating. The pad and fan cooling system could lower the plant’s leaf temperature by “3.3 °C” than the air temperature outside.
The second method is to use an air conditioning system to cool the air in the greenhouse using the cold air circulated by the air conditioning equipment. As this method can reduce the temperature significantly and quickly, it is suitable for fruit plants that require low temperatures, such as strawberries, tomatoes, or grapes. However, one possible disadvantage is that the humidity of the air may often be too low and that this method tends to waste a lot of energy. Sultans et al. researched a greenhouse in Multan, Pakistan, examining the temperature and humidity in a greenhouse that uses an air conditioning system [
9]. They revealed that the air conditioning system with a vapour compression air conditioning (VCAC) method could control the temperature as needed. They found that the indoor temperature of the greenhouse remained stable at “30 °C”, which was “10 °C” lower than the temperature outside the greenhouse (“40 °C”). Moreover, the indoor humidity was observed to increase, higher than the outside air humidity, 11 g per kg of dry air. The unit of moisture used in this study was the ratio of the mass of water vapour in grams to the mass of dry water in kilograms [
9].
The third method is to adjust the temperature and humidity with a misting system. The working principle relies on evaporation, by which water is converted into water mist sprayed evenly in the greenhouse. Hot air convection with this cold-water mist may decrease temperature [
10]. The misting method is the most common because it is energy efficient and relatively cheap regarding its installation cost. Nevertheless, it still has a disadvantage in that the high humidity levels may cause mould to grow, which will interfere with the growth of horticultural crops. One earlier study by Misra and Gosh used a misting system in a “250 m
2” greenhouse in West Bengal, India [
6]. They aimed to identify the optimal temperature reduction by adjusting the fogging cycle. They compared the misting systems that lasted 1 min and 1.5 min with variations in misting intervals of 2, 3, and 4 min. The results showed that the most optimal temperature reduction was the 1 min misting system with 2 min intervals because it allowed the temperature to drop by “4 °C” to ambient temperature.
This study aims to obtain a temperature reduction and humidity control system in a pilot greenhouse in Cisauk with a tropical climate south of the equator. We preferred the misting method because of the investment cost of equipment procurement and low operating prices. The parameters that will be optimised to obtain the ideal air temperature and humidity are not higher than “33 °C”, and 85% is the setting of the discharge of water for misting.
2. Materials and Methods
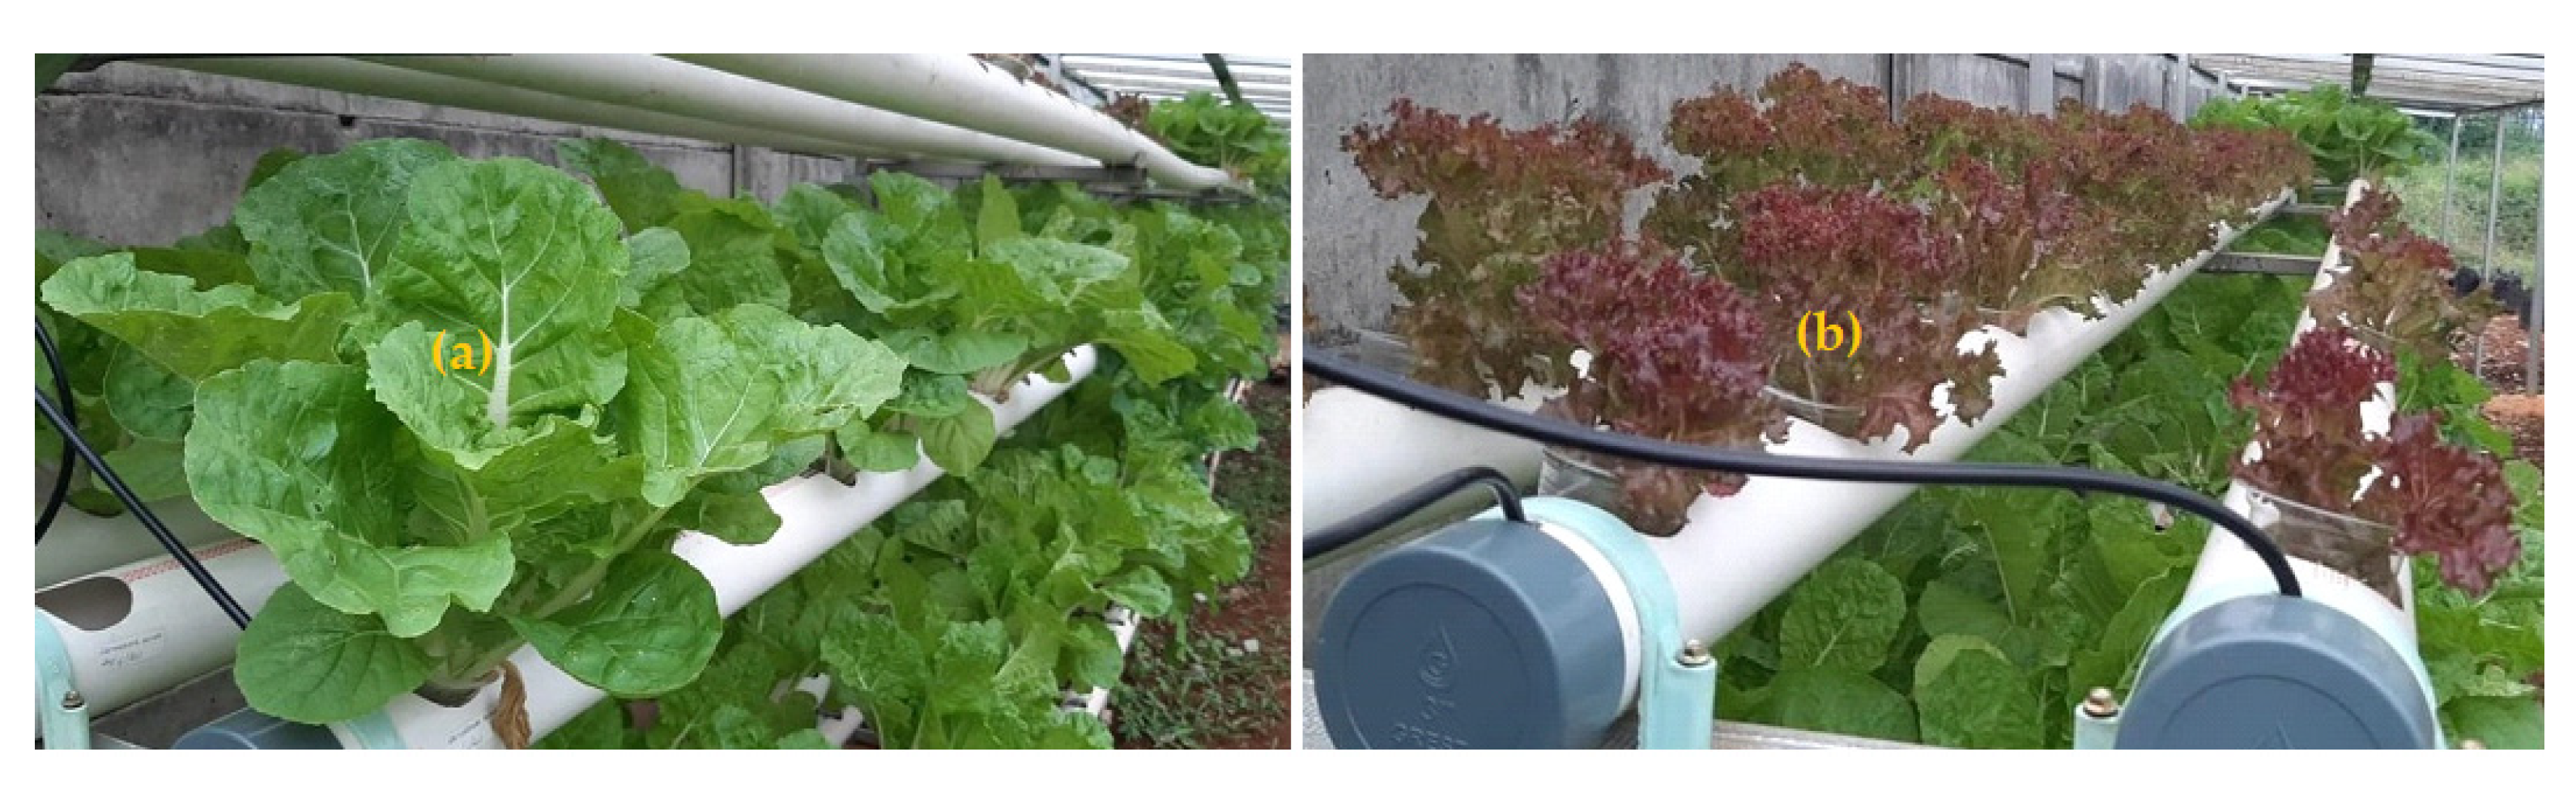
The greenhouse in this study is a pilot greenhouse owned by a group of farmers in Cisauk. It was equipped with a hydroponic system. The greenhouse roofs are made of translucent polymer sheets that transmit up to 70% sunlight, while the greenhouse wall is an insect screen made of polymer material that functions as a breather and insecticide barrier. Cisauk is located in Tangerang Regency, Banten Province, Indonesia, south of the equator, with a tropical climate, with an average high/low temperature and humidity of “32/23 °C” and 86%. The length–width–height dimensions of the greenhouse are “20 m × 10 m × 3.5 m”. Cultivated vegetables are mustard greens and watercress. Their seeds are from similar mustard greens and watercress in Cisauk.
Figure 1 depicts the cultivation of vegetables, mustard greens, and watercress.
The initial steps of the research were to design and make a prototype of the misting system from the greenhouse. We prioritised using local materials or equipment available in the market around the garden location. The next step was to measure the temperature and humidity of the air in the greenhouse when the misting system was not functioning. We used the temperature and humidity data that we obtained from this step to design the optimum water flow parameters of the misting system to adjust the temperature and humidity of the ideal air in the greenhouse in the next step of the research.
2.1. Design of Misting System
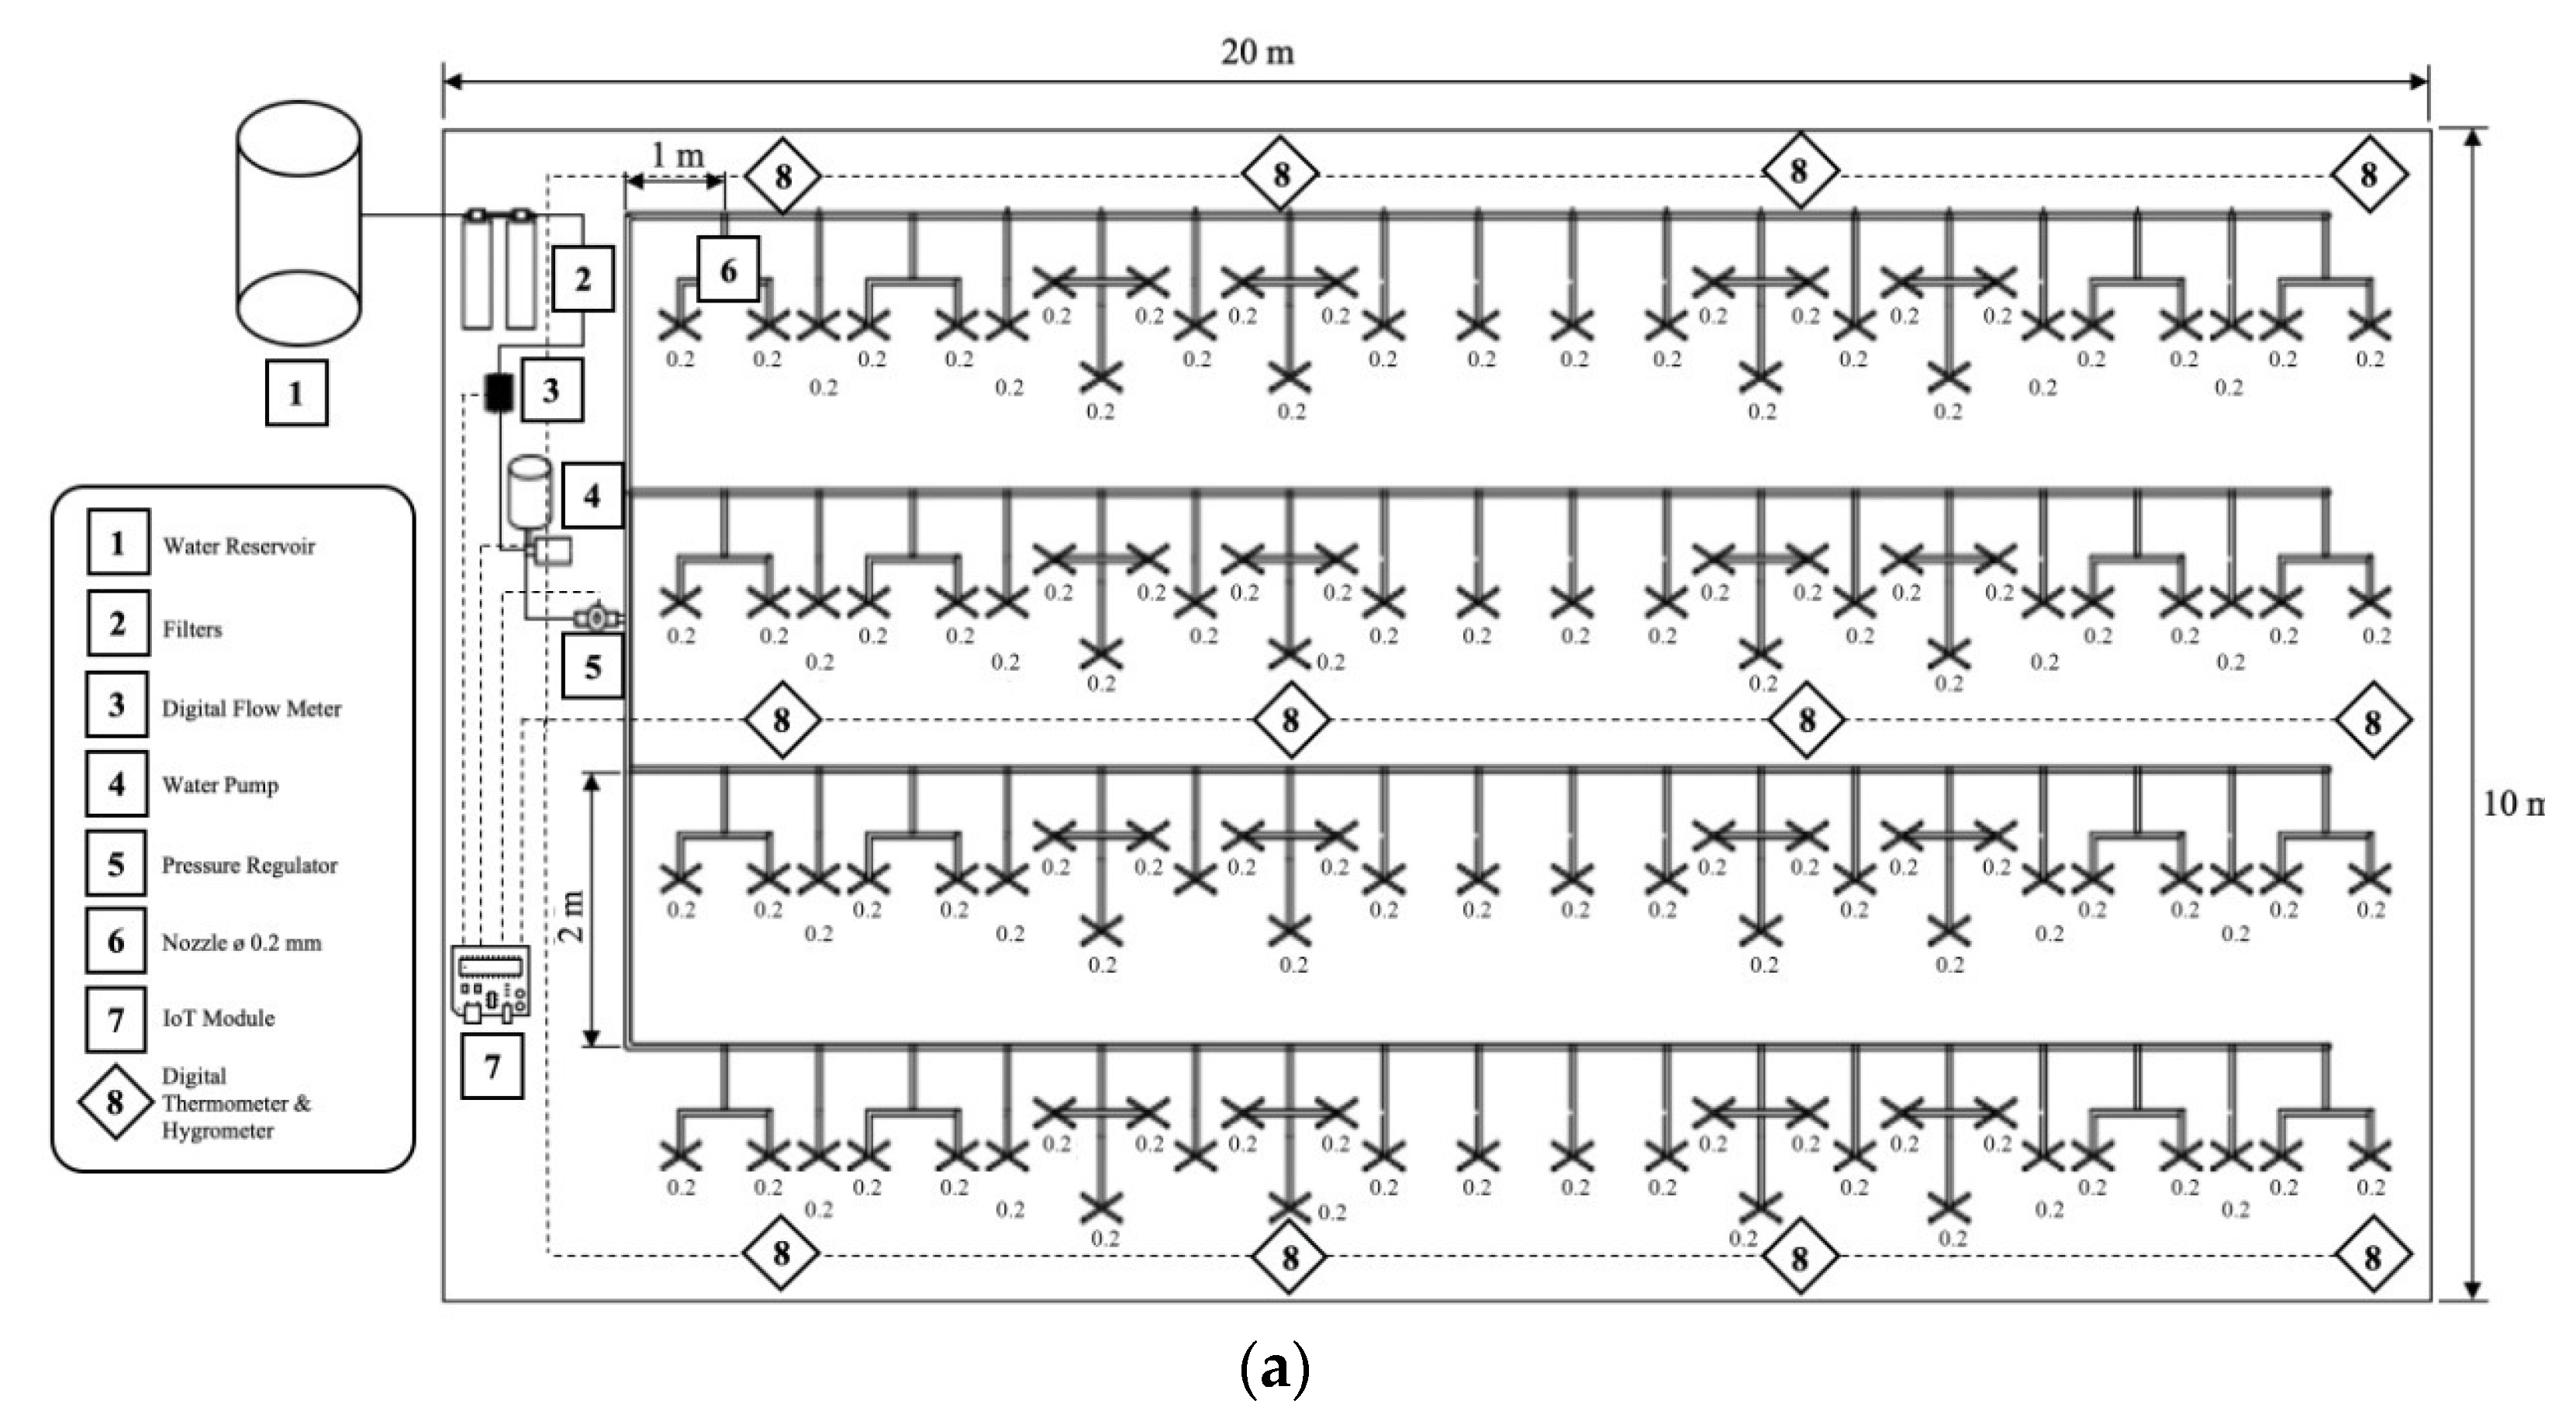
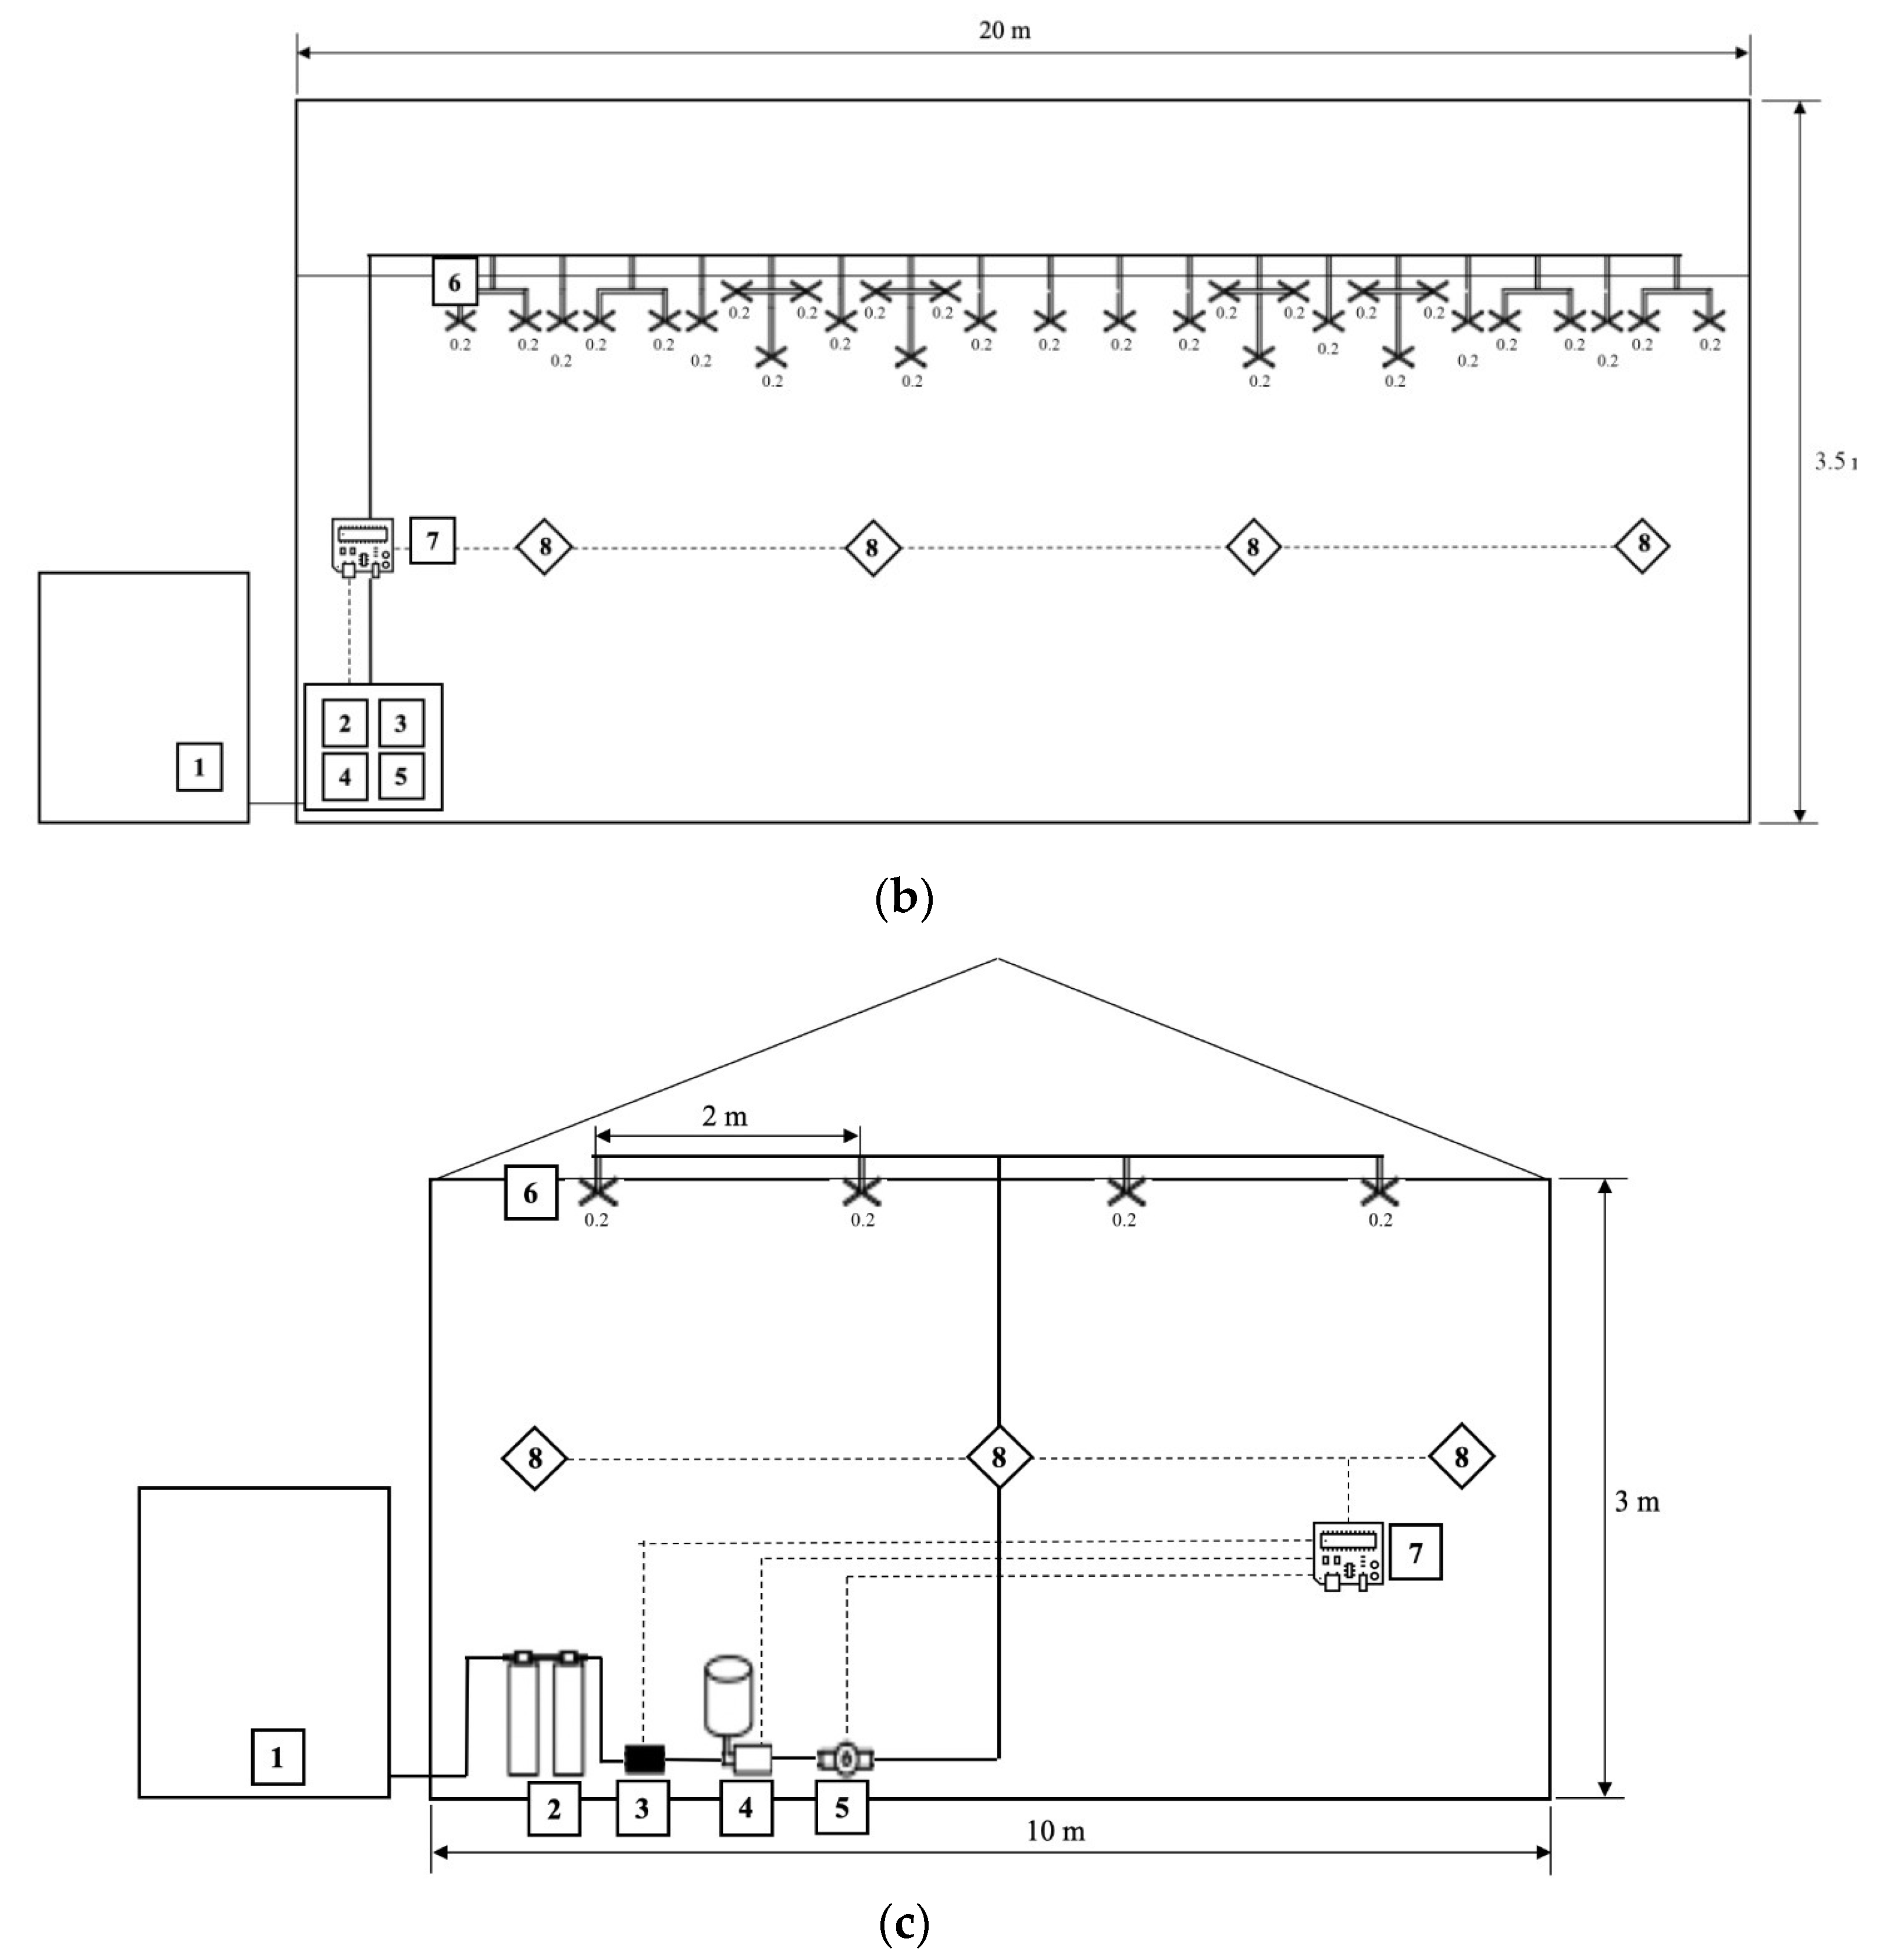
The misting system we designed to adjust the greenhouse air temperature and humidity is illustrated in
Figure 2a–c. The figures depict the top view, front view, and side view of the system.
As displayed in
Figure 2a–c, the equipment components consist of: (1) a 500-L reservoir tank (Penguin brand, Indonesia); (2) two units of metal water filters (Zernii brand, Indonesia); (3) one digital flow meter unit (K24 brand, Indonesia); (4) one unit of the water pump with water discharge capability of “0.5 to 2 L/min” (Hiu brand, Indonesia); (5) one unit of pressure regulator “3 to 5 bar” (Hiu brand, Indonesia); (6) 120 nozzle units with “0.2 mm” diameter slip lock type (Pearl brand, Indonesia); (7) one internet of thing (IoT) module (Sonoff WiFi TH-16 Smart Switch brand, China), and (8) twelve digital thermometer–hygrometer units (HTC-2 brand, China).
The misting system uses a diaphragm pump. These pumps include positive displacement pumps that use a membrane that pushes or sucks fluid. If the pump mains voltage is increased, the discharge will also increase [
11]. The pump’s specifications have a water discharge capability of “0.5 to 2 L/min” or “30 to 120 L/h”.
2.2. Recording Temperature and Humidity of the Air in the Greenhouse without Misting System
The temperature and humidity were recorded using twelve units of the digital thermometer–hygrometer. The air temperature and humidity in the greenhouse were recorded every hour from 7 a.m. to 5 p.m. for seven consecutive days during the week, from Monday to Sunday. Temperature and humidity data during the day from 7 a.m. to 5 p.m. are the average of the seven-day recording data.
2.3. Adjusting Temperature and Humidity of the Air in the Greenhouse with Misting System
As described above, the temperature and humidity data from the recording will be used to predict the amount of energy or cooling mass water flow to reduce the air temperature in the greenhouse using the misting system. Reducing air temperature in the greenhouse uses the heat transfer principles of specific heat of the cold feed water to hot boiling water and the latent heat of feed water from liquid to vapour when it meets hot air. Equations (1) and (2) are the two mechanisms of heat transfer. Meanwhile, the energy required to reduce the air temperature in the greenhouse to the reference temperature, 29 °C, is calculated using Equation (3). In this case, Q
1, Q
2, and Q
3 are specific heat (W), latent heat (W), and convection heat (W), respectively. Furthermore, m* (kg/s) is the mass flow of cold feed water for misting; c (4.200 J/kg °C) is the specific heat of water; ∆T
1 (100 °C–26 °C) is the difference between the temperature of the boiling water and the cold feed water; U (2.25 × 10
6 J/kg) is the latent heat coefficient, and h (25 W/m
2 K) is the coefficient of convection heat transfer; A (20 m × 10 m) is the area of the greenhouse, and ∆T
3 (°C) is the temperature difference between the hot air temperature in the greenhouse and the reference air temperature of 29 °C.
In this case, we determined the water discharge for misting in the greenhouse based on Formulas (1)–(3) and the temperature data from
Section 2.2. We also considered the experience of Misra and Gosh [
6]. The misting method was designed to use a pump discharge from “60 L/h” to “80 L/h” intermittently for five minutes ON and ten minutes OFF from 7 a.m. to 5 p.m.. This means that within an hour, the pump circulates water for 20 min. The water discharge was adjusted through the eWeLink application. In this case, for the mass flow of the cold feed water for misting (m*) in Equations (1) and (2), the calculation was adjusted to only 20 min per h. This means that the average discharge for 20 min for “60 L/h” is “20 L/h”.
We adjusted the system to reduce the temperature and control the humidity in the below steps. The misting system was set to be automatically on for 5 min and off for 10 min from 7 a.m. to 5 p.m. using the eWeLink application. In addition to the above settings, the misting system was programmed for the time when it is on or off, based on live monitoring of the temperature conditions in the greenhouse. If the air temperature in the greenhouse drops below “29 °C” or the humidity continues to rise to more than 85%, the misting system will shut down.
Every hour from 7 a.m. to 5 p.m., the IoT devices recorded temperature and humidity at the twelve points (8) inside the greenhouse space. Likewise, the total volume of water for misting for one day was recorded. The observations of these three test conditions were carried out each for one week or seven days from Monday to Sunday. The temperature and humidity data were recorded every hour from 7 a.m., 8 a.m., and so on until 5 p.m., as well as the hourly water volume data. Eventually, the average data for the seven days were also recorded.
3. Results and Discussion
3.1. The Misting System Design
Figure 2a–c are schematic diagrams representing the misting system’s design. The system has worked according to the program we designed. The way the system works is as follows. The water reservoir (1) serves to hold water for misting. Two water filter units (2) ensure that the water is free from contamination with impurities that can clog the nozzles. When the misting system is active, the IoT module (7) will give a command to the pump (4) to drain water from the water reservoir (1) and transfer it to the misting nozzle (6). The water discharge and the amount/volume of water for misting are seen and recorded by the digital flow meter (3), whose data are connected to the IoT Module (7). After going through the digital flow meter (3), the water will pass through the pump (4) and then to the pressure regulator (5). The pressure regulator regulates the pump pressure; therefore, the water discharge is issued as programmed.
The water that has passed the pressure regulator will flow to all (120 units) nozzles (6), which are scattered in the greenhouse. The water that comes out of the nozzles is in the form of water mist that can absorb heat in the greenhouse, allowing for changes in the temperature and humidity. Every hour, the digital thermometer-hygrometer (8) will measure the temperature and humidity and send the data to the IoT module. Electronic devices that are connected in parallel to the IoT module, namely, digital flow meters (3), water pumps (4), pressure regulators (5), and digital thermometer–hygrometers (8), will send data that can be viewed via a smartphone with eWeLink app. The eWeLink application is an application of the Sonoff WiFi TH16 Smart Switch (7) IoT system to manage and monitor data from each connected electronic device.
3.2. The Temperature and Humidity of the Greenhouse without Misting
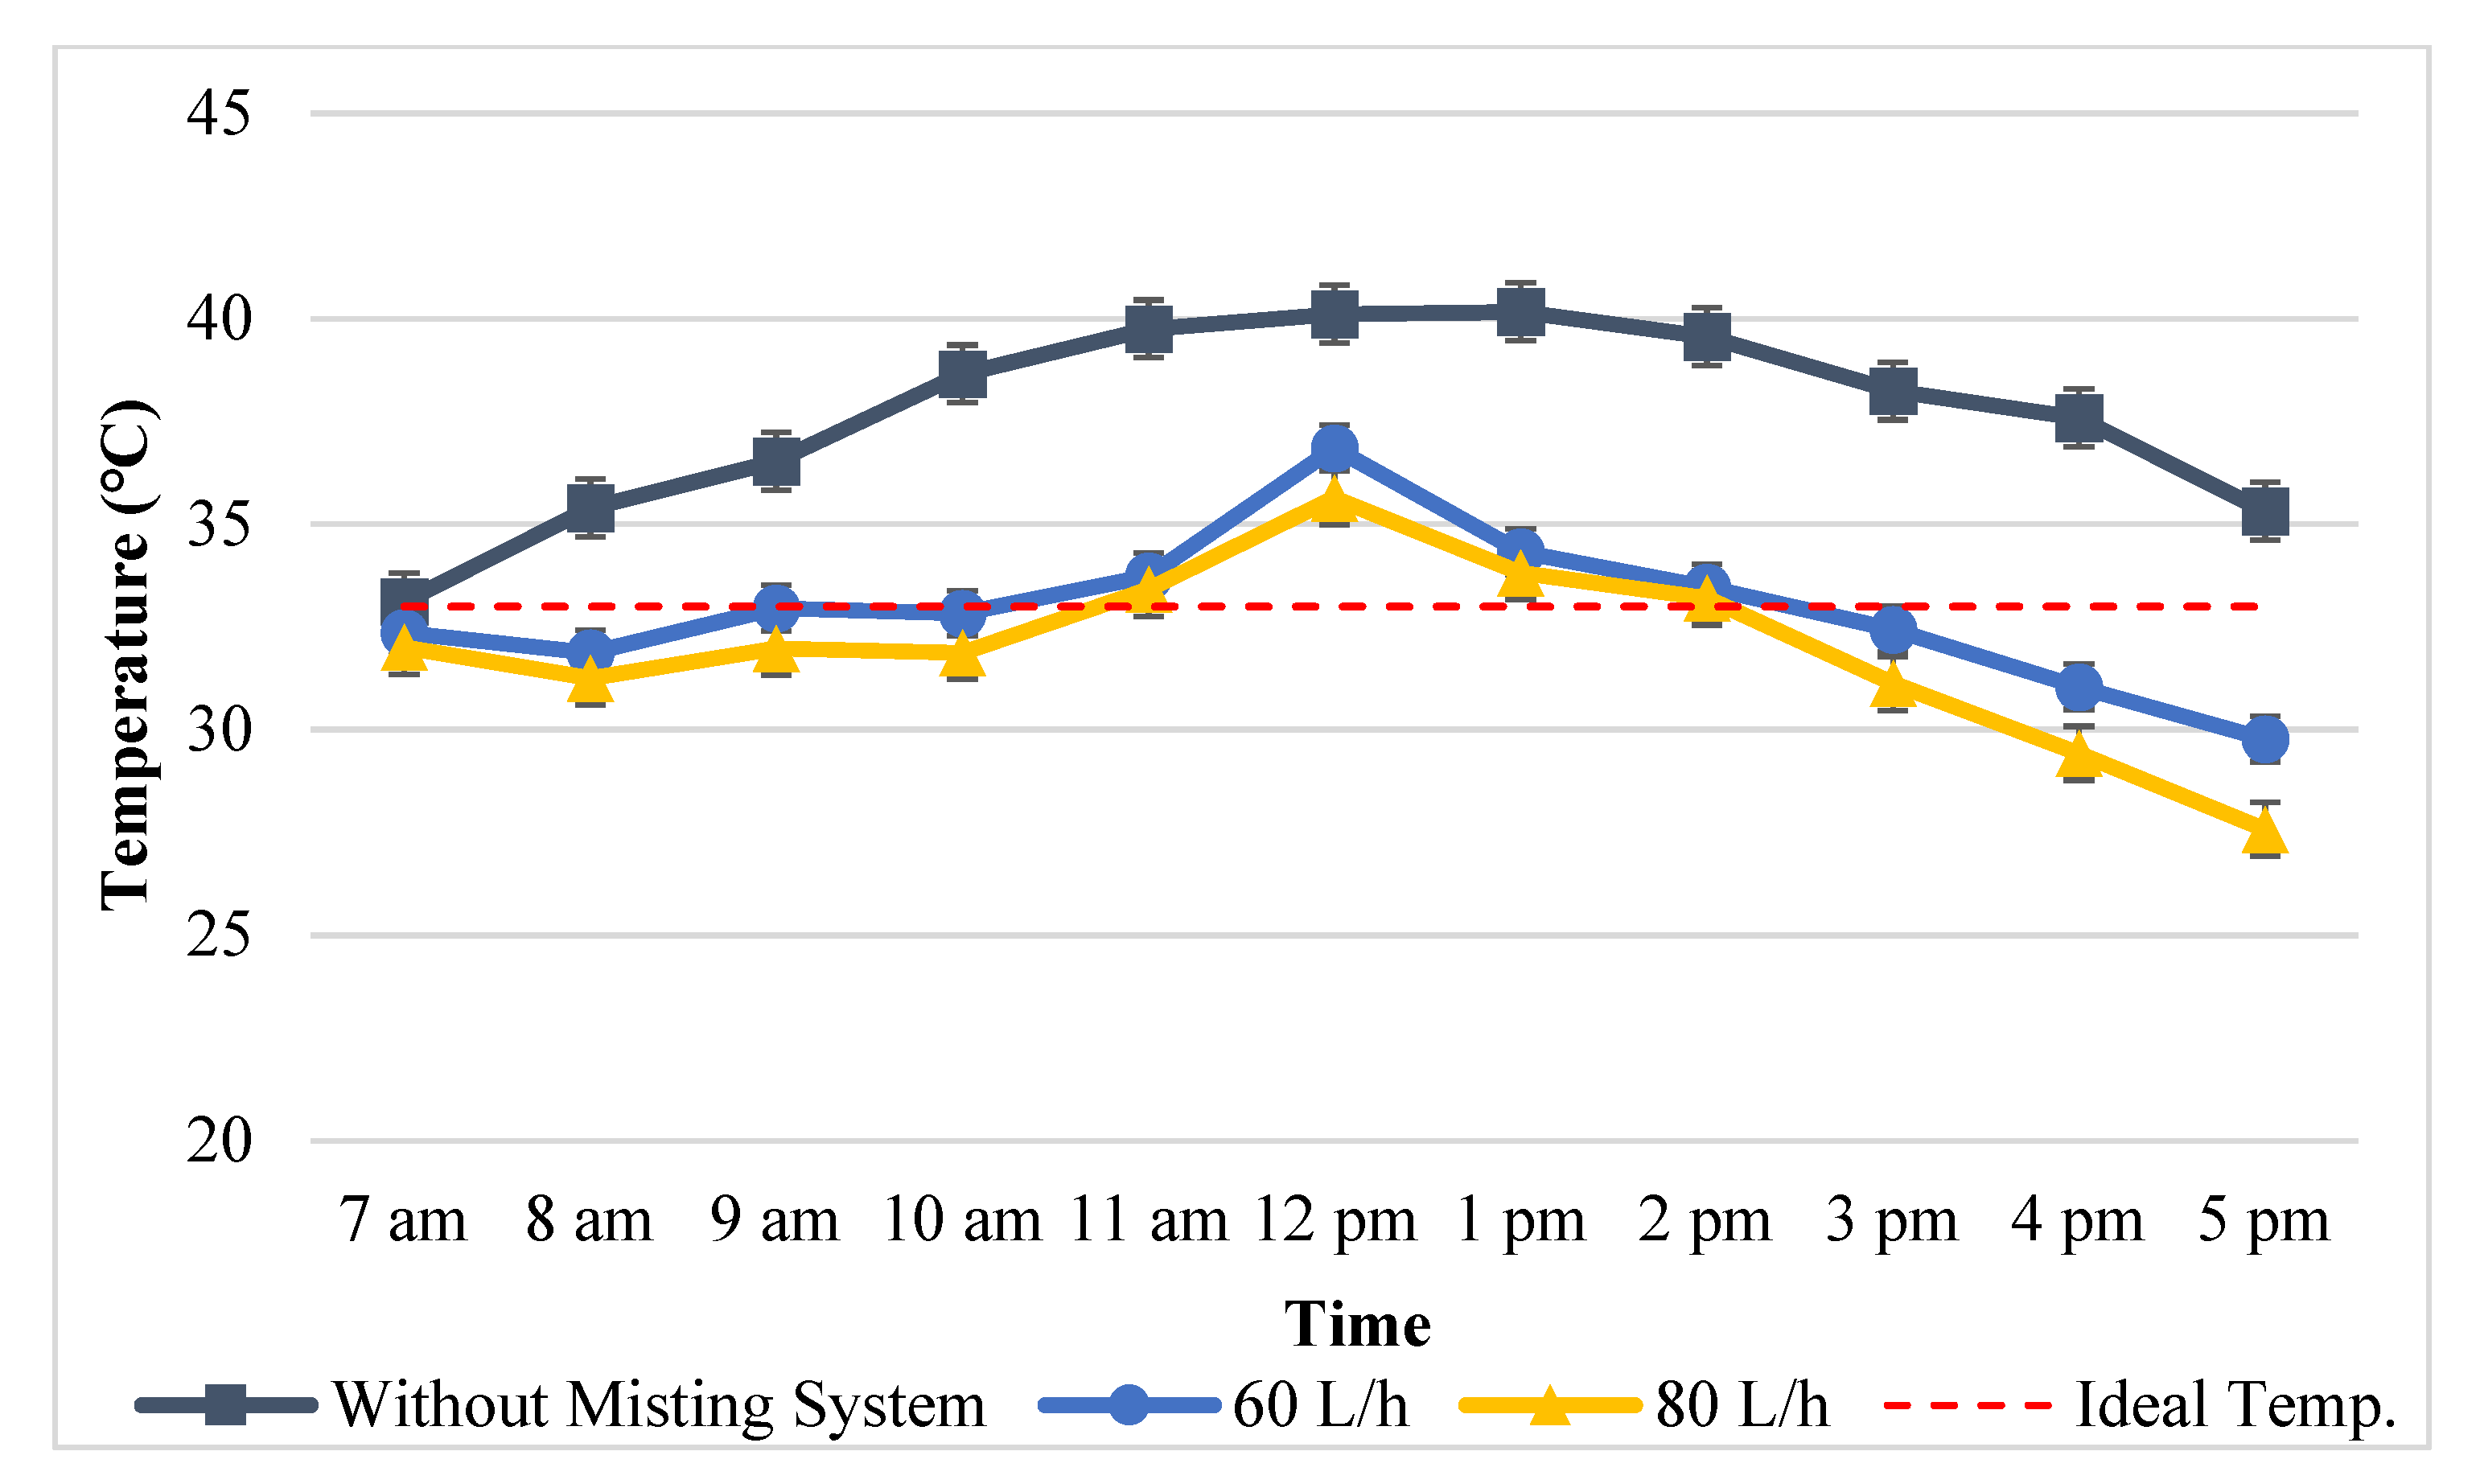
Figure 3 shows the temperature inside the greenhouse every hour from 7 a.m. during sunrise to 5 p.m. during sunset. The temperature in the greenhouse was always above 33 °C, with the highest temperature ranging from “38.2 °C” to “40.2 °C” and occurring from 11 a.m. to 3 p.m.. The greenhouse air temperature increase was in conjunction with the increase in solar heat radiation from 7 a.m. to 2 p.m.. On the other hand, the decrease in air temperature also paralleled the reduction in solar radiation from 2 p.m. to 5 p.m.. It can be concluded that the air temperature was not ideal for mustard greens and watercress, which typically require a temperature not exceeding “33 °C”.
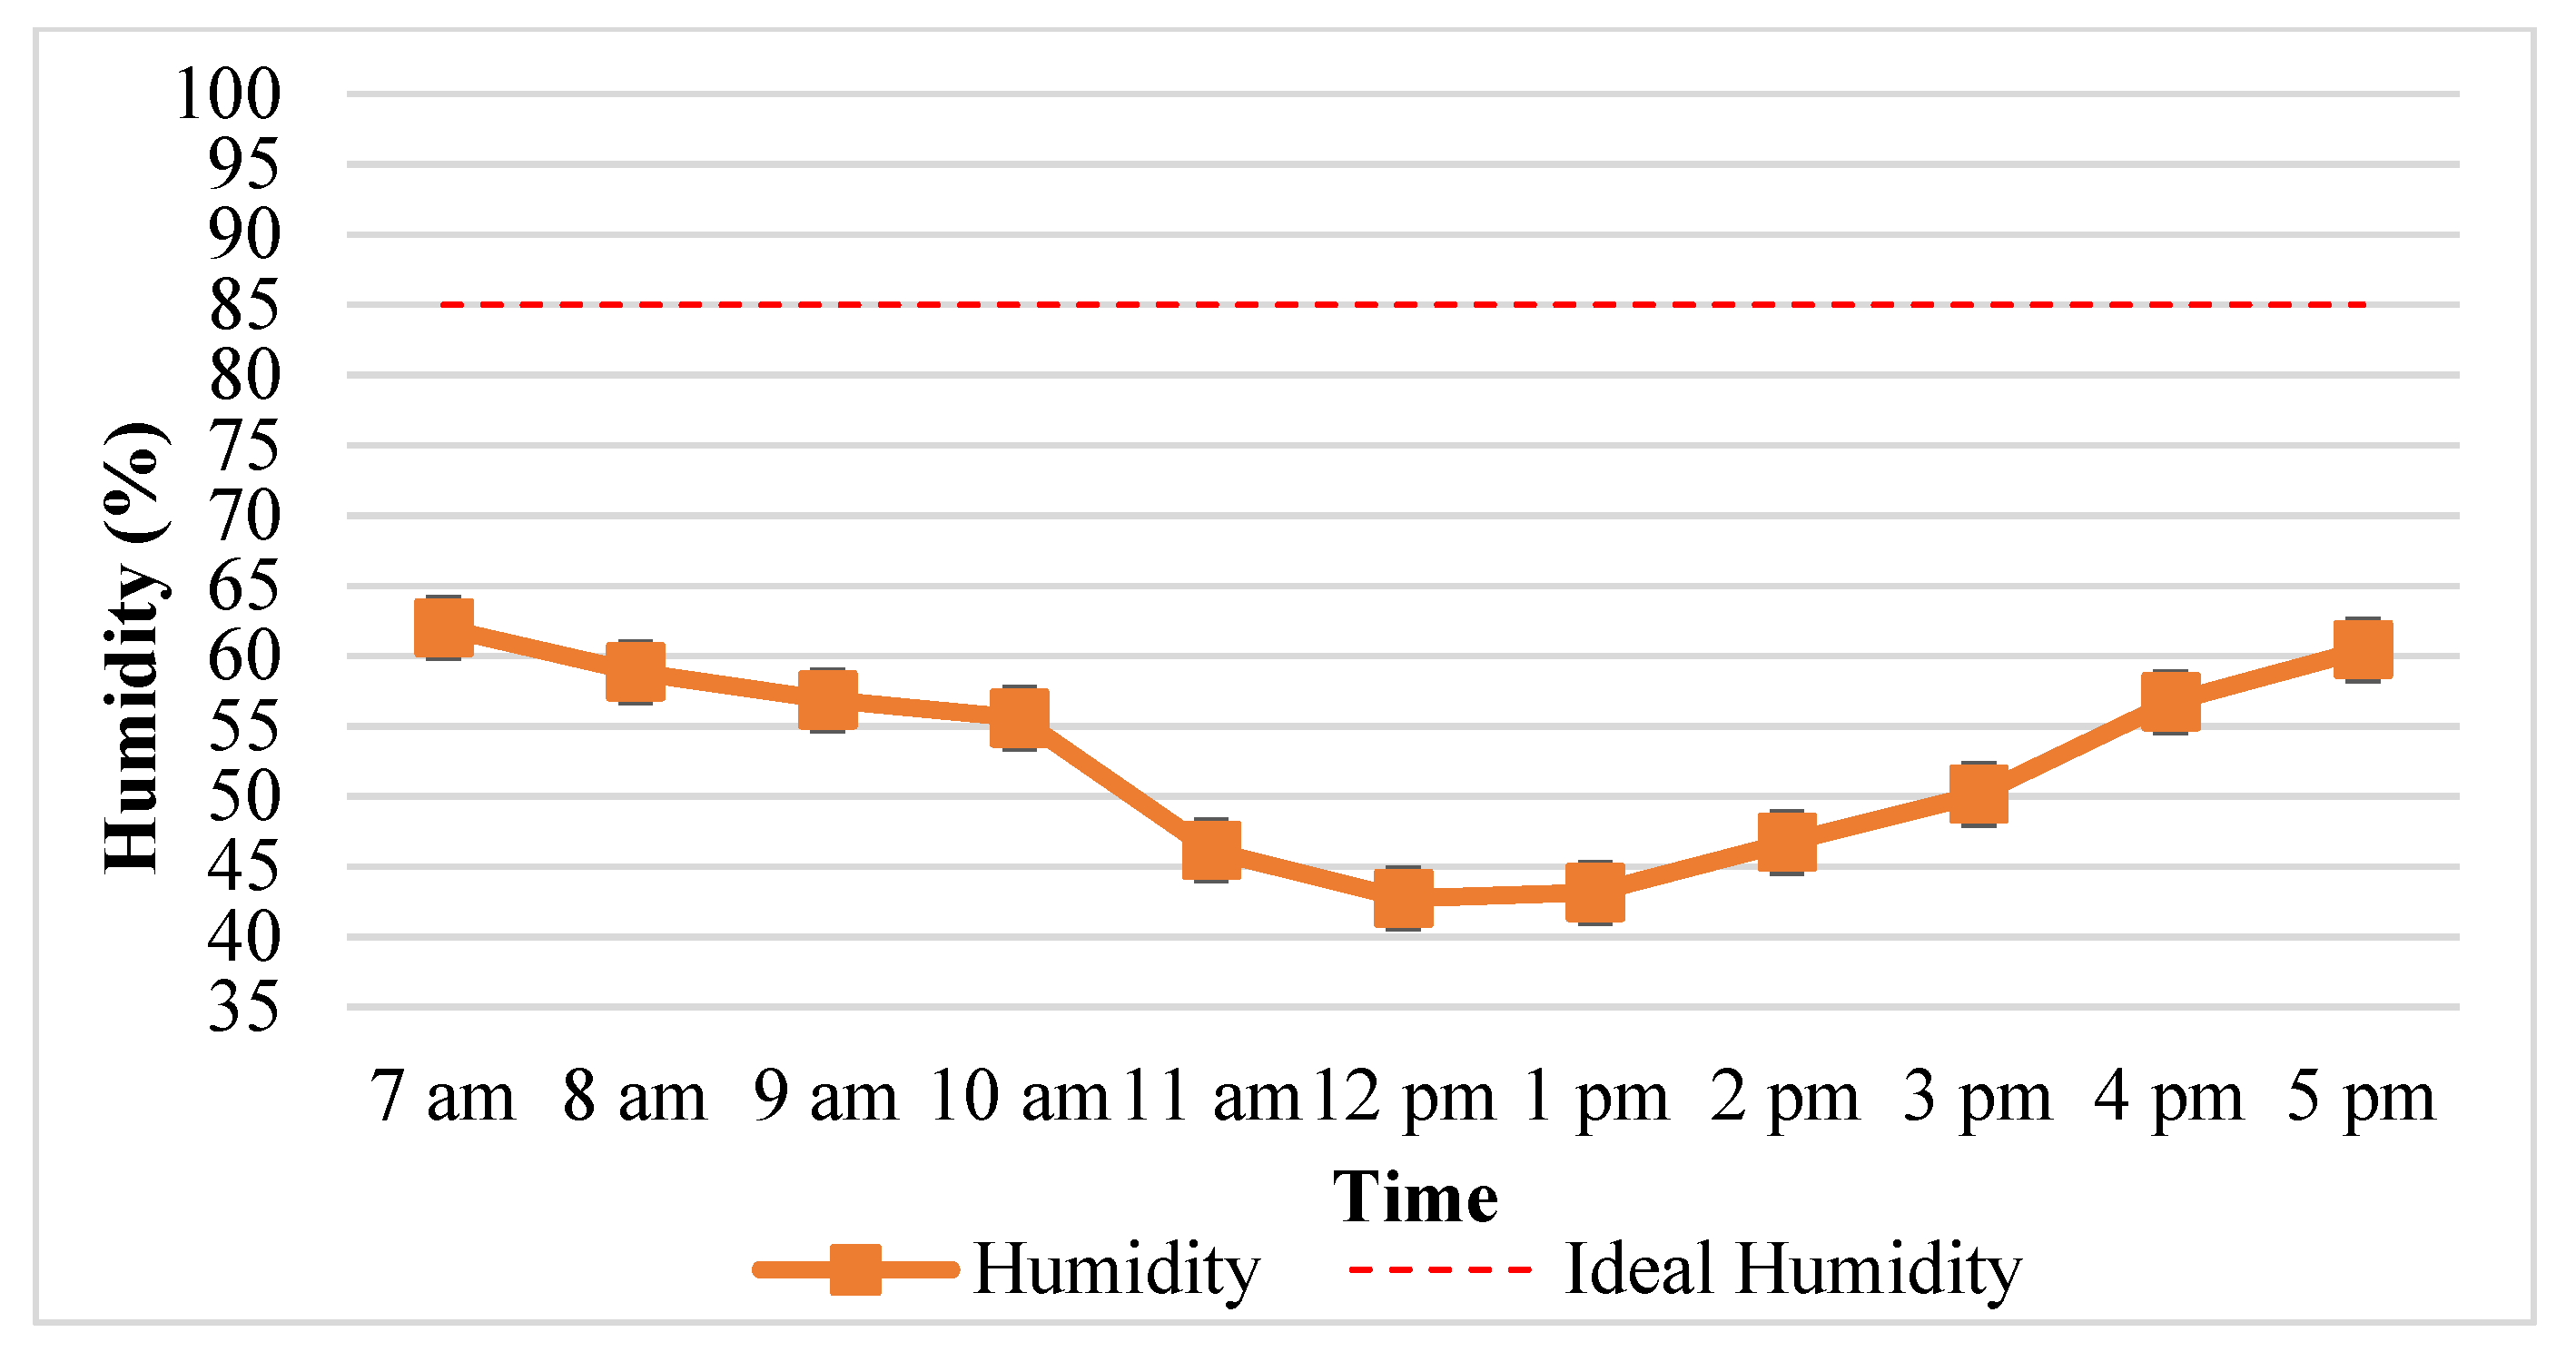
Meanwhile,
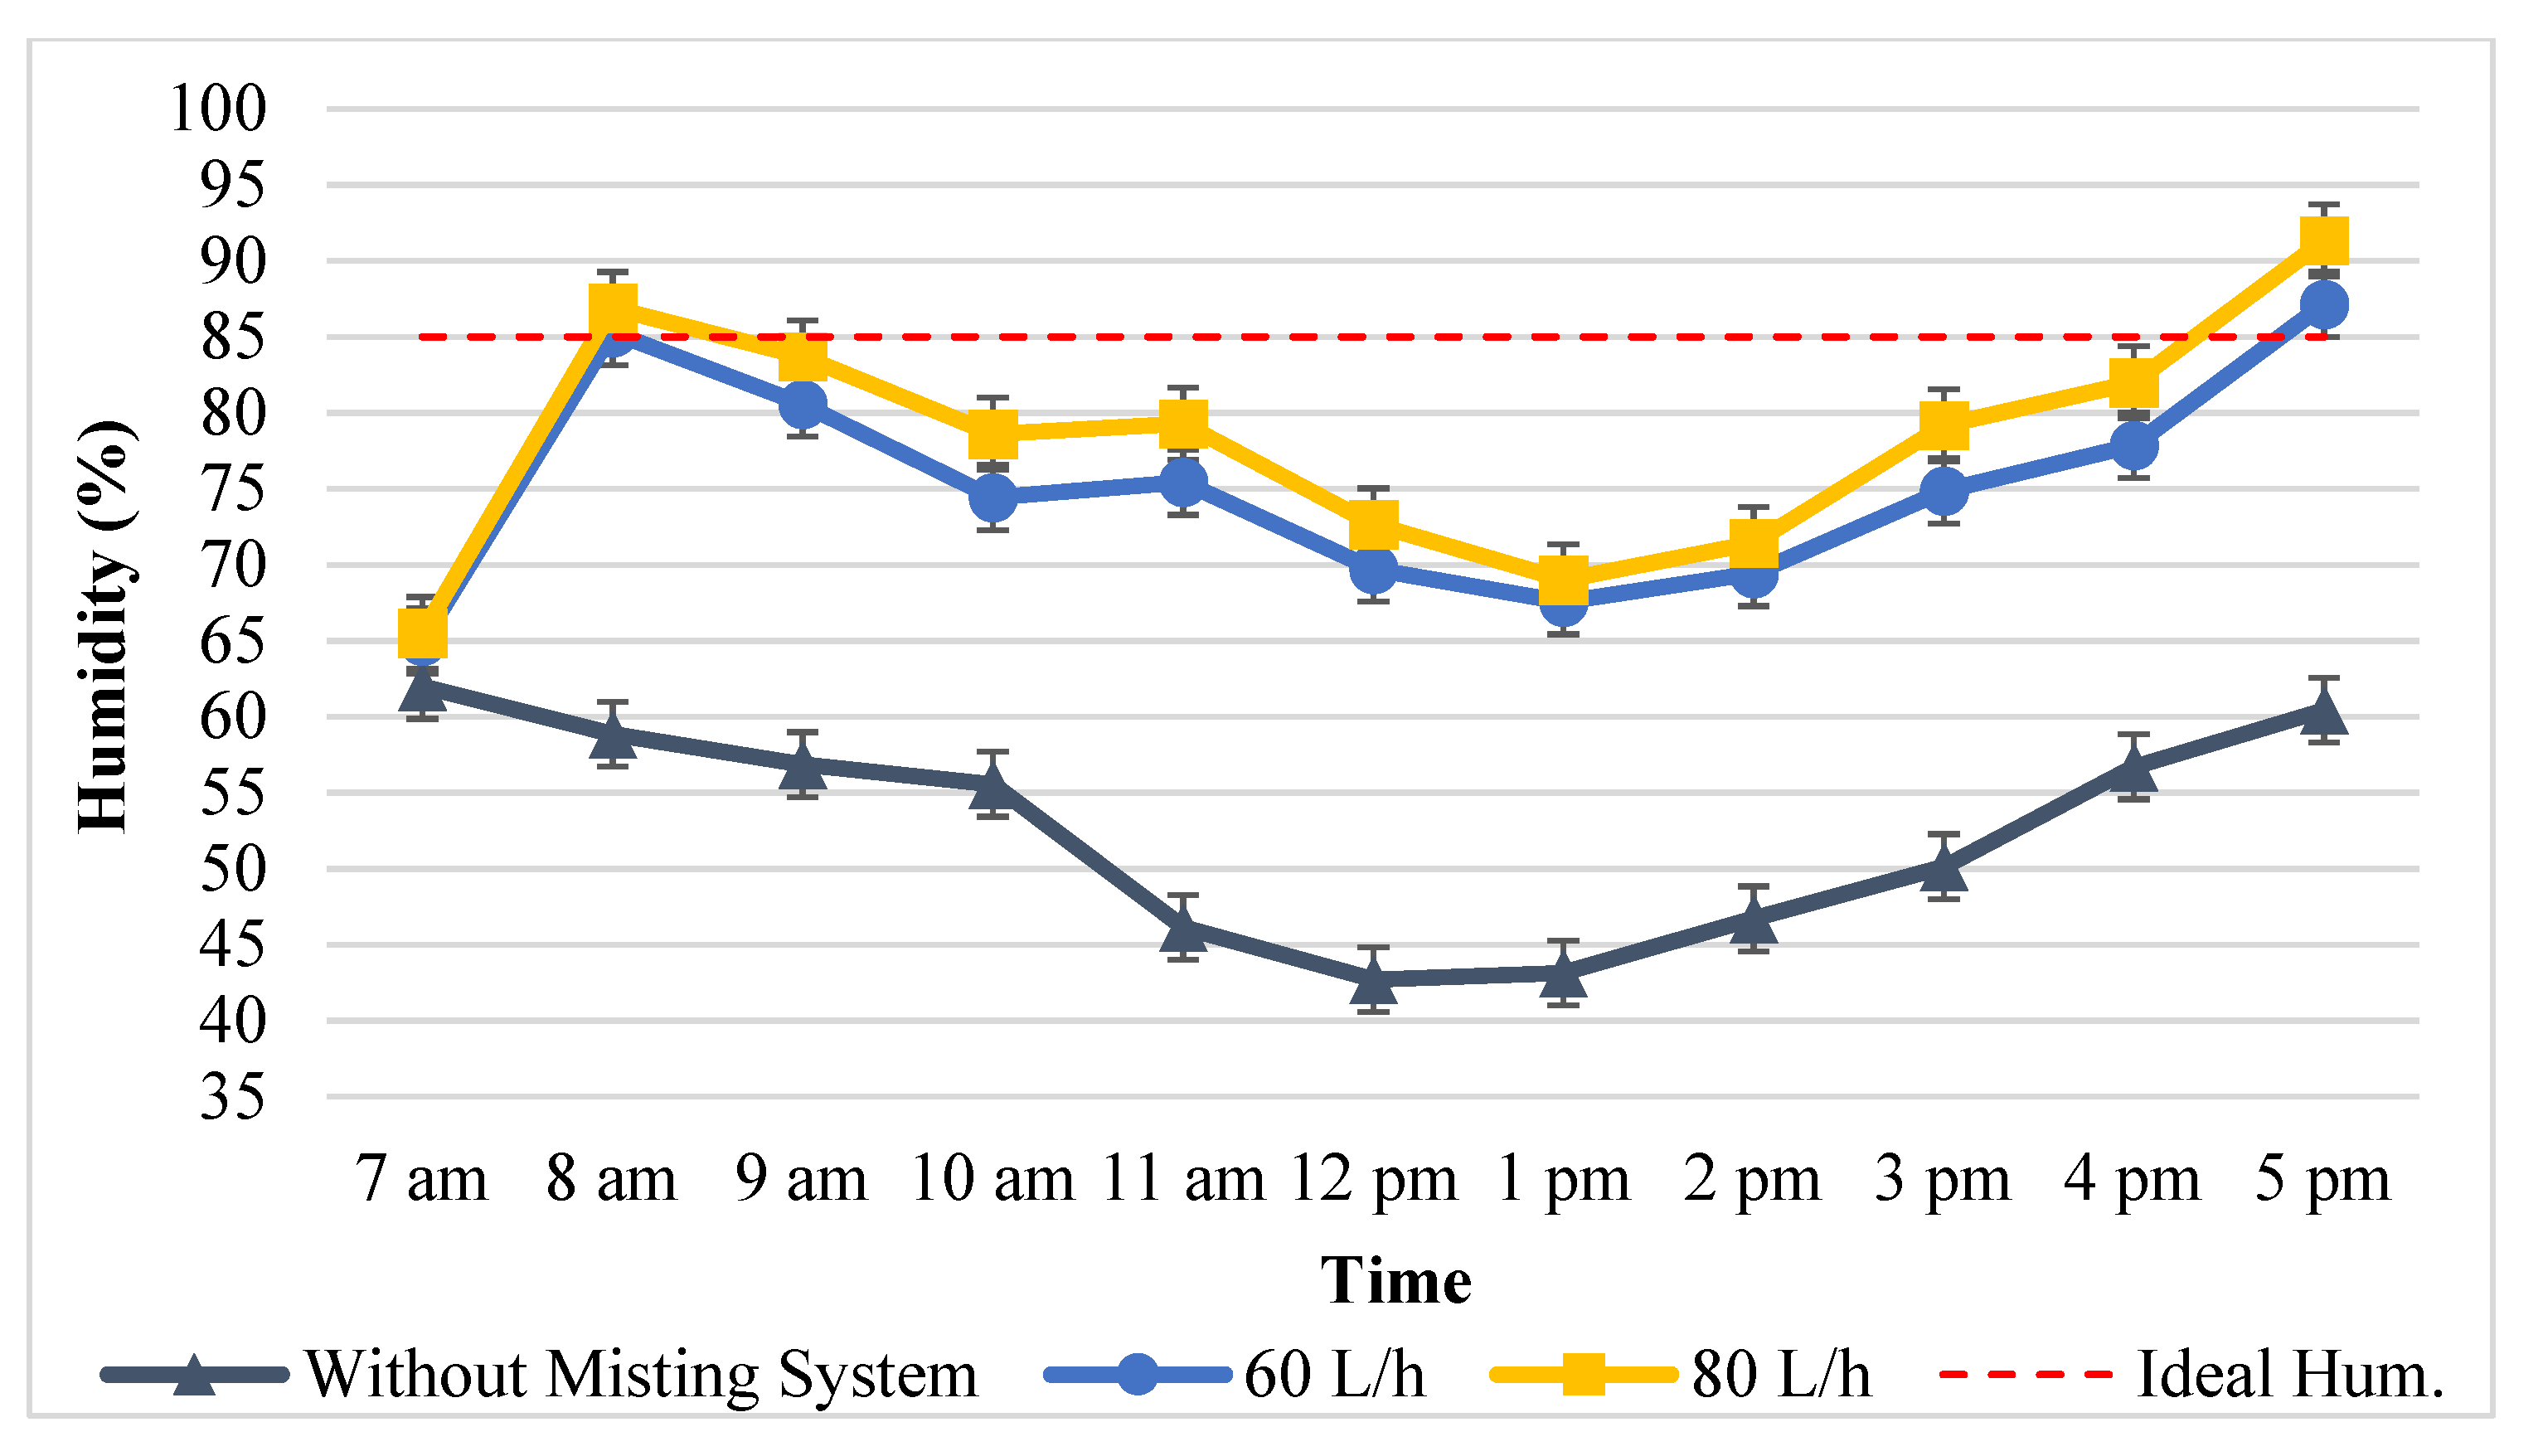
Figure 4 shows that the humidity was below 85%. The trends of decreasing humidity from 7 a.m. to 12 p.m., and increasing humidity from 12 p.m. to 5 p.m., resulted from the changes in temperature in the greenhouse. When the air temperature rises, the air can hold more water molecules, causing the humidity to decrease; conversely, if the temperature drops, the air cannot hold water molecules, causing the moisture to increase [
12]. The figure of 85% is the maximum humidity limit allowed, which could protect vegetables from disease fungus. As can be seen, the lowest humidity range, between 43% and 50%, occurred from 11 a.m. to 3 p.m.. Although the humidity was conducive to preventing the green mustard and watercress from growing disease fungus, the temperature was too high, rendering the plants unproductive.
The solar radiation heats the air in the greenhouse, increasing the temperature and decreasing the humidity. The findings show that the air temperature in the greenhouse rises alongside the increasing solar radiation from morning to afternoon and evening. The increase in the temperature is attributed to the hot air trapped in the greenhouse [
13]. It suggests that the roof and wall make it challenging to move the trapped air in the greenhouse into the open air. A similar phenomenon was reported by Dewi et al., who observed a “27 m
2” greenhouse in Bogor-West Java, Indonesia [
14].
Average air temperature data from 7 a.m. to 5 p.m. in the greenhouse without misting, as shown in
Table 1 and
Figure 3, are used to predict the heat/energy required to reduce the temperature to “29 °C”. The heat/energy from Equation (1) plus Equation (2) must be equal to Equation (3). The amount of the mass water flow for misting (m*) from 7 a.m. to 5 p.m. is shown in
Table 3. In this case, the mass flow of feed water for misting in
Table 3 is calculated based on the intermittent pump work, which is set 5 min ON and 10 min OFF or twenty minutes per hour.
3.3. The Temperature and Humidity in the Greenhouse with a Misting System with a Flow Rate of “80 L/h” and “60 L/h”
Table 3 was a theoretical prediction of determining the mass water flow for misting from 7 a.m. to 5 p.m.
Table 3 shows that the mass water flows intermittent misting with five minutes ON and ten minutes OFF requires a water flow rate of “28.9 kg/h” to “78.5 kg/h”. For this reason, we preferred the mass water flow of “80 L/h” and “60 L/h”.
Table 4,
Table 5,
Table 6 and
Table 7 and
Figure 5 and
Figure 6 depict temperature and humidity in the greenhouse for the two types of mass water flow.
Figure 5 and
Figure 6 show the curve of temperature and humidity in the greenhouse for discharge misting at “80 L/h” and “60 L/h”, respectively. Air temperatures above “33 °C” occur from 10 a.m. to 2.30 p.m. for a discharge of “60 L/h” and from 11.45 a.m. to 2 p.m. for a discharge of “80 L/h”. Meanwhile, humidity that exceeds 85% occurs from 8 a.m. to 8.40 a.m. and above 4.20 p.m. for a discharge of “80 L/h” and 4.45 p.m. for a discharge of “60 L/h”. The volume of water for misting for ten hours from 7 a.m. to 5 p.m., according to
Table 4 data, is “803.9 L” for “80 L/h” discharge and “604.8 L” for “60 L/h” discharge. The data show that the greater the misting discharge, the greater the heat absorbed by the mist grains; therefore, the air temperature decreases [
15,
16].
The increased humidity occurs due to the increase in temperature and a large number of water mist droplets in the greenhouse that do not evaporate and fall to the surface of the greenhouse floor [
10]. The humidity of more than 85% is not suitable for mustard greens and watercress because they are prone to disease fungus growth [
17,
18]. The setting of temperature and humidity with the misting system in this study reflects the findings of Misra and Ghosh [
6]. In this case, the low water discharge can still cause the air temperature to exceed the ideal temperature limit because vapour sprayed by the nozzle mixes with hot air; this water vapour plays a significant role in absorbing the air heat emitted by solar radiation [
19]. However, the humidity becomes too high if the water discharge is too excessive. Based on this experience, the amount of water mist drips onto the floor must be reduced. The trick is to modify the exit holes for all nozzles, which were originally directed vertically downwards, to rotate 60 degrees clockwise for all nozzles [
20]. The goal is to prevent the water mist from rapidly descending, reducing the number of mist droplets falling to the floor.
3.4. The Temperature and Humidity in the Greenhouse Using the Optimum Flow Rate of Water Misting
With the experience of misting discharges of “80 L/h” and “60 L/h” and by modifying the direction of the nozzle by rotating sixty degrees uniformly in a clockwise direction, the use of misting discharge in this step was set as follows. From 7 a.m. to 8 a.m., the water discharge is “50 L/h”; 8 a.m. to 10 a.m. “60 L/h”; 10 a.m. to 11 a.m. “100 L/h”; 11 a.m. to 1 p.m. “120 L/h”; 1 p.m. to 2 p.m. “80 L/h”; and 2 p.m. to 3 p.m. “60 L/h”. Furthermore, starting at 3 p.m., the misting system was turned off to maintain humidity not exceeding 85%, because the temperature does not exceed “33 °C”.
Table 8 and
Figure 7, as well as
Table 9 and
Figure 8, show the temperature and humidity data in the greenhouse for the new misting discharge setting conditions. Data on its comparison to the previous test conditions are also shown.
Setting the water discharge for misting that is adjusted to the needs of controlling temperature and humidity has resulted in a more efficient use of the total volume of water. The use of water for misting in a day is 652.9 litres or 150.9 litres more efficient than misting systems with a constant flow rate of “80 L/h”.
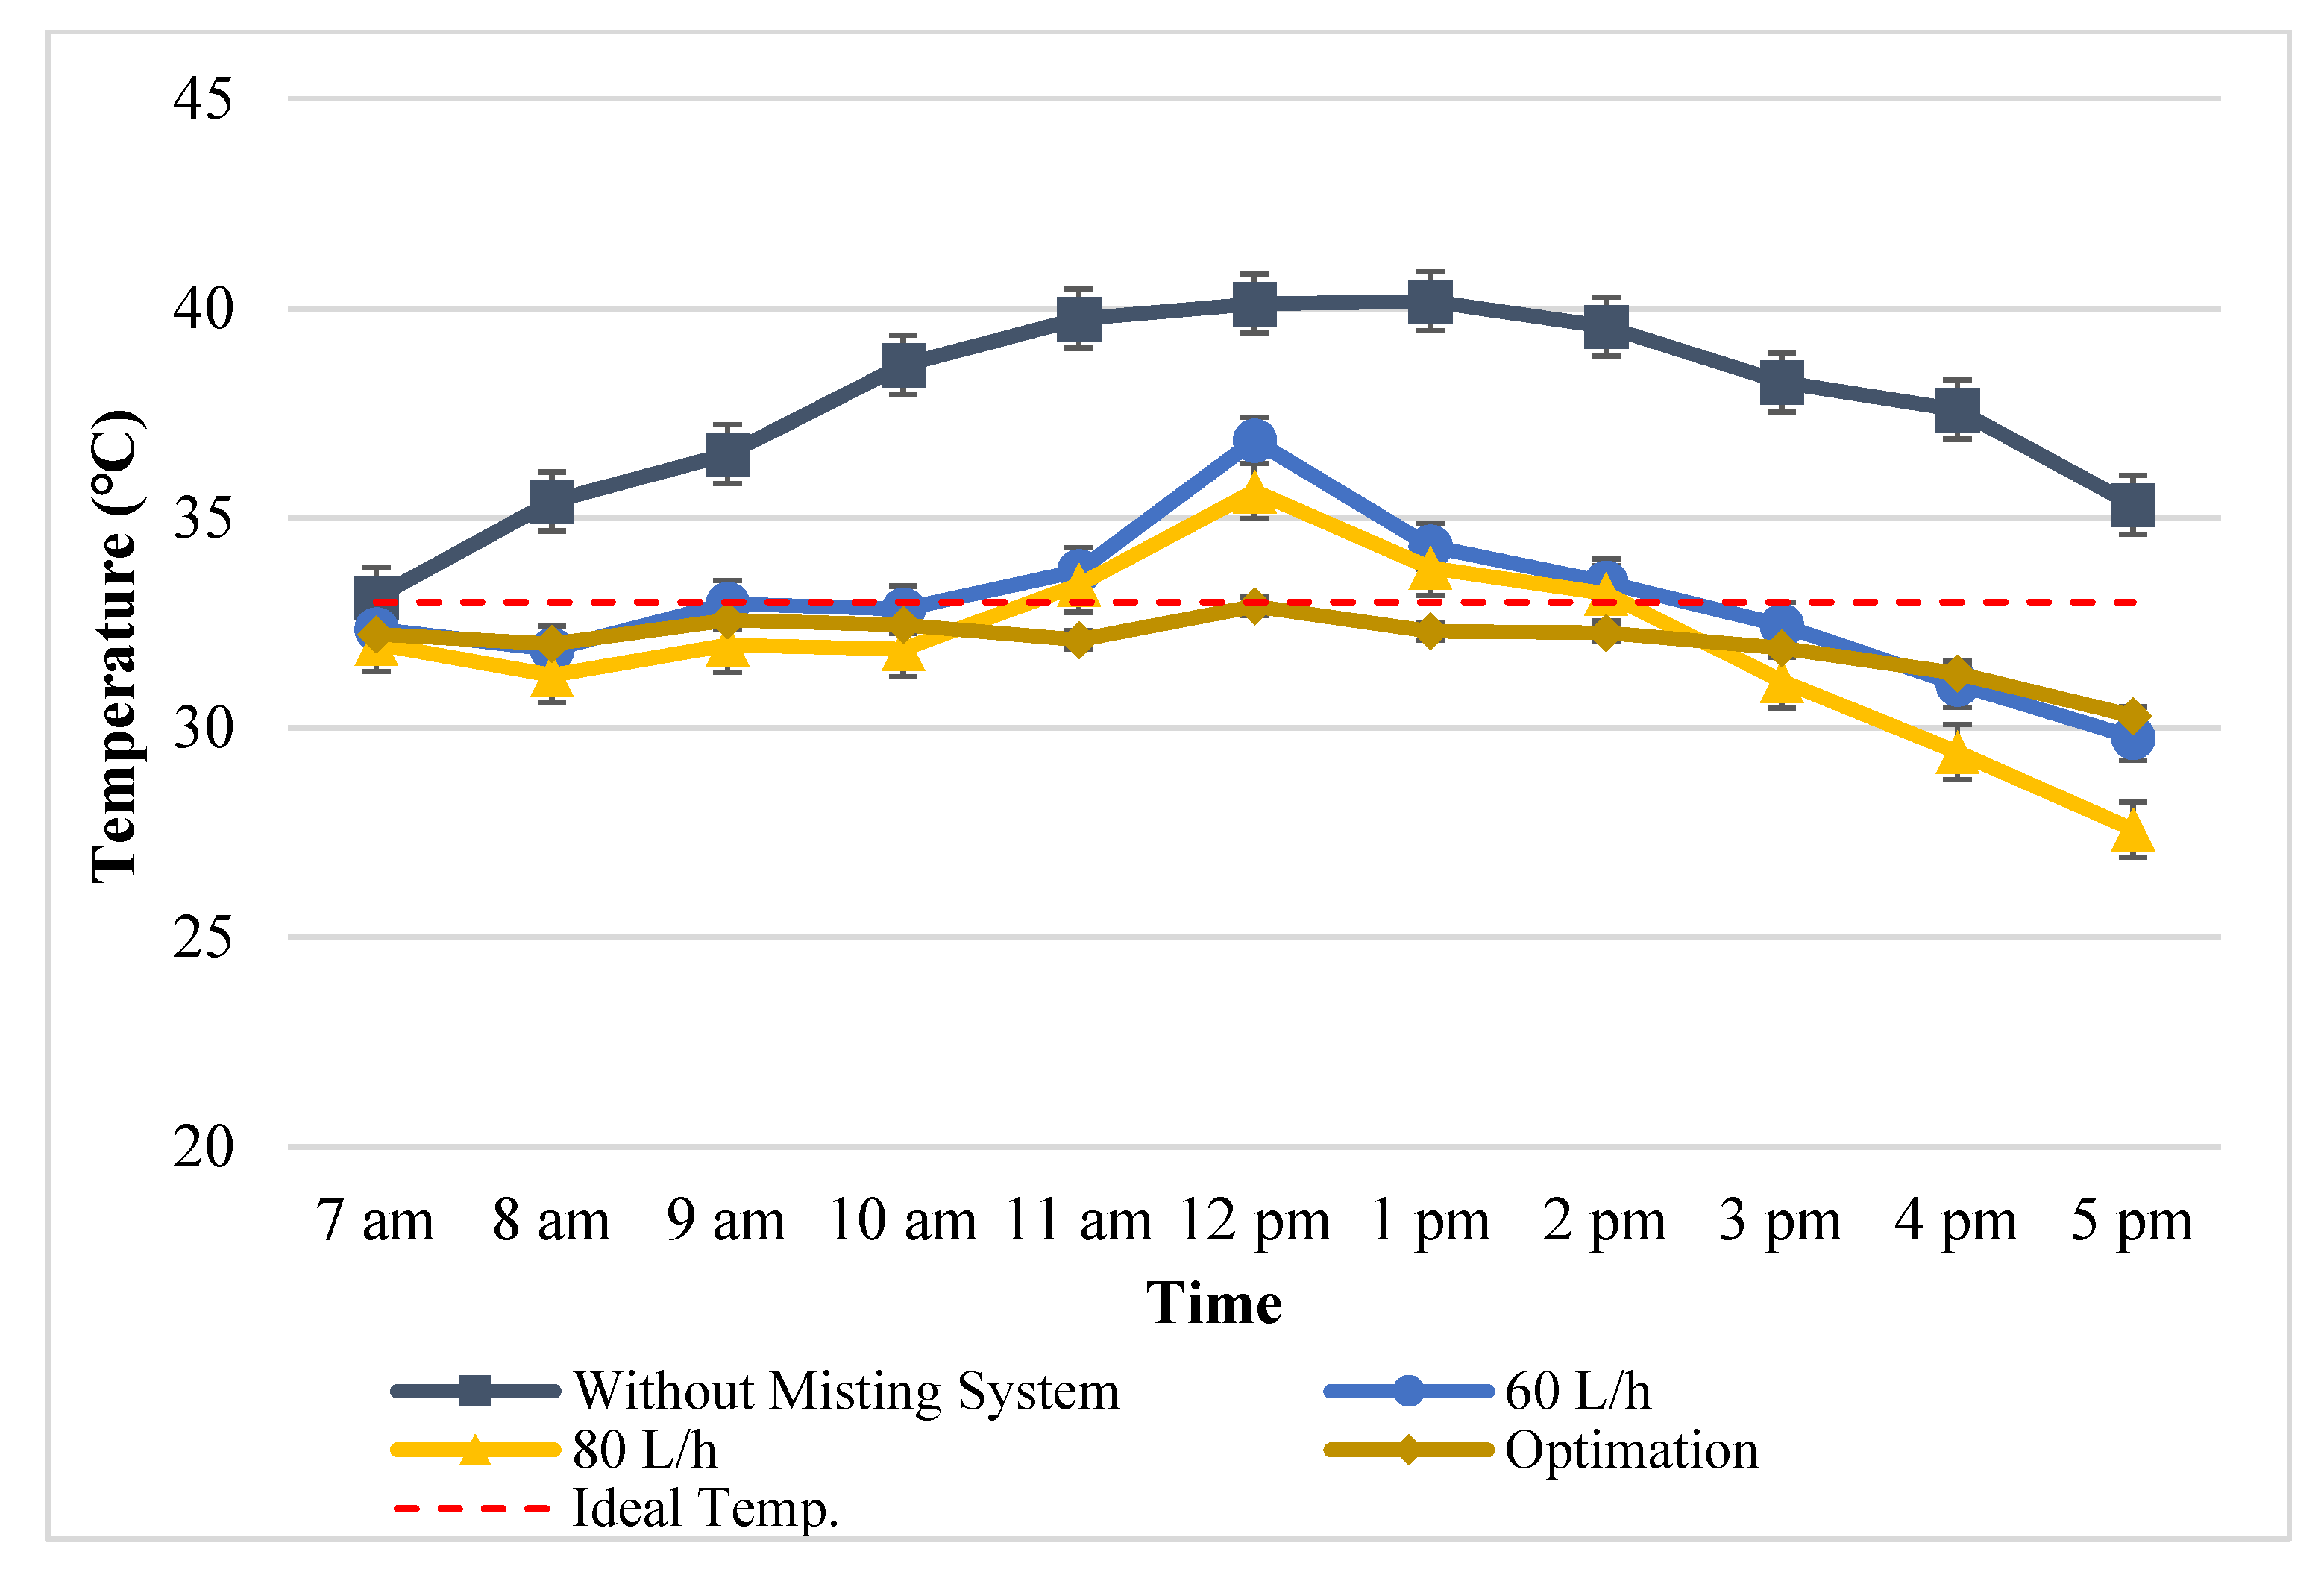
Figure 7 shows that the misting system can reduce the temperature more effectively than using a water flow rate of “80 L/h” and “60 L/h”. From 7 a.m. to 10 a.m., the temperature is already at an ideal condition that is not higher than “33 °C”. Starting at 10 a.m., the water flow is increased to “100 L/h” so that at 11 a.m., the temperature decreases. This is undertaken to maintain temperature spikes during the day, especially from 11 a.m. to 2 p.m., where, in the “80 L/h” and “60 L/h” tests at that time, the temperature consistently exceeded “33 °C”. At 11 a.m., the water flow was increased again to “120 L/h” because, during the day, the sun’s radiation increases the temperature in the greenhouse [
14]. At 1 p.m., the water flow is reduced to “80 L/h”; from 2 p.m. to 3 p.m., the water flow was “60 L/h”. By optimising the misting system, the temperature in the greenhouse can make the greenhouse temperature not exceed “33 °C” from 11 a.m. to 2 p.m.. The highest temperature of the greenhouse during the day was only “32.9 °C” at 12 p.m.. This was due to the longer time that the water mist fell from the nozzle to the ground surface because the length of the path travelled by the water mist with the nozzle tilt angle at 60 degrees is longer [
16,
20]. The falling water mist to the ground surface occurs in the process of evaporation of the water mist; therefore, the phase changes to a gas. At this stage, the water mist will absorb heat in the greenhouse so that the temperature inside the greenhouse becomes lower [
13].
Figure 8 also shows that humidity is maintained at ideal conditions from 7 a.m. to 5 p.m., which is not more than 85%. At 7 a.m., the water flow is “50 L/h”, so the humidity at 8 a.m. is not at the maximum limit. Based on tests with the “80 L/h” and “60 L/h” discharges, humidity at 8 a.m. is always at its maximum limit of 85%. The optimised misting system’s humidity at 5 p.m. did not exceed its maximum limit. The misting system stopped working at 3 p.m., when the temperature is also at an ideal condition. However, even though the misting system had stopped working, the humidity increased over time until it reached 83% at 5 p.m.. This phenomenon is similar to a greenhouse without a misting system, which can be seen in
Figure 3 and
Figure 4, where the temperature decreases from 2 p.m. and humidity increases from 1 p.m. It is also affected by the reduced radiation from the sun shining on the greenhouse. This research is in line with the research conducted by Dewi et al. [
14] in a greenhouse in Bogor-West Java, Indonesia. Their study revealed that the temperature at 3 p.m., which reached “36 °C”, decreased to “30 °C” at 5 p.m. This phenomenon occurs naturally when the greenhouse does not have the technology to manipulate the temperature [
10,
14].
4. Conclusions
This study discusses how to adjust the temperature and humidity in a greenhouse, to cultivate mustard greens and watercress, located south of the equator, with a tropical climate with high temperature and humidity characteristics. Setting the temperature and humidity in the greenhouse uses a misting system method, which has relatively low procurement and operational costs. The misting system we designed consists of the main equipment, namely, a unit diaphragm pump with discharge capability of “30 to 120 L/h”; twelve digital thermometer–hygrometer units; one hundred units of 120 nozzles with a “0.2 mm” diameter with a direction of sixty degrees to the vertical axis; and one unit controlling the internet of things (IoT) module.
Setting the temperature and humidity in the greenhouse during the day not higher than 33 °C and 85% was performed by using intermittent mass water flow with a five-minute ON and ten-minute OFF setting from 7 a.m. to 8 a.m. “50 L/h”; 8 a.m. to 10 a.m. “60 L/h”; 10 a.m. to 11 a.m. “100 L/h”; 11 a.m. to 1 p.m. “120 L/h”; 1 p.m. to 2 p.m. “80 L/h”; and 2 p.m. to 3 p.m. “60 L/h”. Furthermore, the misting system was turned off to maintain humidity not exceeding 85%, starting at 3 p.m.. The system was also equipped with a controller to turn off the pump if the air temperature reached less than 28 °C and the humidity was more than 85%.
The misting system in the greenhouse is expected to help farmers cultivate mustard greens and watercress through modern farming methods, especially for areas south of the equator. The temperature and humidity of the air inside the greenhouse during the day need to be continuously recorded. It needs to be undertaken for a year every month and every day, whether a hot or rainy day. This data will help optimise the system’s misting water flow adjusting system.


