Article

Community Battery Storage Systems Planning for Voltage Regulation in Low Voltage Distribution Systems

Department of Electrical Engineering, College of Engineering, Qassim University, Buraidah, Saudi Arabia
Appl. Sci. 2022, 12(18), 9083; https://doi.org/10.3390/app12189083
Submission received: 9 August 2022 / Revised: 31 August 2022 / Accepted: 7 September 2022 / Published: 9 September 2022
(This article belongs to the Special Issue Renewable Energy Systems: Optimal Planning and Design)

Abstract

:
The regulation of the grid voltage within operational limits becomes increasingly challenging as residential photovoltaic (PV) adoption rises. Therefore, this study proposes a method for the efficient planning of multiple community battery energy storage systems (BESS) in low voltage distribution systems embedded with high residential rooftop PV units. A bi-level optimization method based on a Neural Network Optimization Algorithm is developed to regulate the voltage in grid-connected solar PV. Since BESS characteristics are crucial for the reliable operation of the distribution networks, the objective of the bi-level optimization problem is to optimally place and operate BESS collectively at a distributed system level. The charging/discharging protocol of the batteries management system is obtained utilizing linear programming that minimizes the daily voltage signal. Simulations were carried out on a modified IEEE low voltage test feeder to examine the impact of PV integration and BESS installation on the voltage profile. Experimental results show the efficacy of the proposed method in enabling the utility to determine the optimal location, capacity, and number of BESS in the distribution system to keep the network voltage magnitude within acceptable bounds. In addition, results demonstrate that the network topology, load profiles, and amount of PV power highly influence the BESS characteristics.

1. Introduction

Since 2014, and for five consecutive years, the net annual addition power from renewable energy resources has exceeded the net addition power from fossil fuel and nuclear power capacity combined, making such resources count for 27.3% of the global electricity generation [1]. Solar photovoltaic (PV) and wind technology are considered the fastest in growth compared to all other renewable resources. Solar PV technology can be installed as large-scale centralized PV plants or distributed, e.g., as rooftop PV systems. On the other hand, the wind is usually in the form of a centralized onshore or offshore wind farm, consisting of groups of wind turbines. In 2019, one-fifth of the global renewable capacity was in the form of small to medium size solar PV panels deployed on residential or commercial building rooftops [2]. The rooftop PV systems can assist not only in deferring the need for distribution network reinforcement but also in providing various ancillary services [3].
However, the integration of the rooftop PV systems brings about various operational issues due to the stochastic behavior of the energy coming from the sun. For instance, the frequency deviates due to the variation in the load in the grid and is even more compromised as the fluctuation in PV power output increases. However, the voltage quality problem is considered the most severe obstacle to distribution system operators (DSO), which is the focus of this study. According to [4,5], the voltage problem represents the most significant issue that must be controlled for an efficient operation of grid-connected solar PV. Unlike traditional passive distribution systems where the load level is the only unpredictable element, PV systems integration poses additional uncertainty levels for the DSOs and utilities. In distribution systems, on-load tap-changing transformers and capacitor banks at the substation are typically employed to keep the network voltage magnitude within acceptable bounds [6]. Nevertheless, these devices cannot react as fast as required and may degrade their service life [7,8].
Expensive distribution upgrades are typically necessary when addressing voltage challenges. Nevertheless, battery energy storage systems (BESS) are regarded as potential solutions for controlling the voltage in distribution systems. The BESS applications have been increasing in the power system field, particularly after PV system penetration into distribution systems [9]. BESS can provide various services, such as voltage support [9], frequency regulation [10], load shifting [11], peak shaving [12], network expansion deferral [13], and greenhouse gas reduction [14]. Therefore, many countries are embracing the development of BESS and facilitating such deployment in their national programs [15]. In the distribution network, the battery converts electrical energy from the grid or the excess power from the PV system into a form that can be stored. After that, it discharges the energy back to the grid or load when required with almost zero emissions.
Nevertheless, the primary concern with BESS is the associated high initial cost. Yet, with the continuous developments in the batteries field, the BESS prices have been decreasing noticeably over time. Such developments permit their deployment in distribution systems to regulate the voltage. However, improper usage, misallocating, or the non-optimal operation of the BESS in distribution networks may affect the reliability and degrade the voltage quality. Therefore, the successful implementation of batteries depends mainly on the planning strategy where location, size, and operational characteristics should be considered. Some studies use BESS to improve distribution network load [16,17], while others discuss the BESS applications for peak load shaving [18,19].

1.1. Literature Review

The voltage control in the distribution system utilizing BESS has been studied by researchers in the past decade. The work in [20], for instance, proposes a mitigation strategy for voltage rise or drop in LV distribution networks with the installation of solar PV using battery storage. The authors assume that each of the rooftop PV systems is equipped with a battery. For the battery operation protocol, an iterative method is employed for dispatching the battery charging/discharging, which is based on local information. Two practical LV-distribution feeders located in Western Sydney, New South Wales, Australia, have been studied in connection with rooftop residential PV systems with rated capacities of 2–4 kW. The authors conclude that a proper selection of the charging/discharging rate is required for the effective daily utilization of the battery storage devices.
In [21], the authors use the Fourier series description based on a day-ahead energy forecast for the optimal daily charging/discharging of batteries to minimize battery losses, cyclic battery cost, and the network voltage profile. A total of 26 batteries are randomly placed along three phases of the LV distribution feeder. In this study, the management of batteries is accomplished by the data management system using hierarchical bi-directional communication infrastructures. The analysis reveals that the size and charging/discharging rates are significantly impacted by BESS locations and the number of controlled BESS. While [21] considered only an LV network, the same strategy is applied in [16] for the optimal siting of BESS in MV and LV distribution networks. The MV distribution network, the IEEE 33-test system, has a two wind distributed generation (DG) with a rate of 1 MW and seven PV DG; three of the PV have a rate of 400 kVA and four have a rate of 500 kVA. In this study, the optimal placement of BESS is based on centralized batteries in both MV and LV networks. Results reflect that the tradeoffs between desired services, including voltage regulation, loss reduction, and battery parameters, are greatly influenced by the battery storage location.
The optimal siting, sizing, and operation of BESS in distribution grids with renewable integration have a crucial impact on their overall efficiency and performance. Furthermore, the distributed BESS brings about better benefits to distribution networks if allocated in a distributed manner than in centralized ones [9]. Many studies have been conducted to tackle the ideal allocation and capacity of BESS. Reference [22], for instance, discusses the optimal allocation and sizing problem of 25 BESS in a distribution system. The goal of this study is to minimize voltage deviation and network losses while also addressing the capital and operation lifetime of BESS. The objective function is tackled by a genetic algorithm (GA) based on multilayer objective optimization. For battery operation, linear programming (LP) is utilized to minimize the daily non-coincident peak demand. Their study reveals a distinct relation between the BESS capacity and location decisions and voltage improvement. Furthermore, the researchers in [23] propose a controlling strategy to identify the optimal location, capacity, and operational characteristics of different BESS in a distribution system with PV generation. The latter objectives are achieved by maximizing the total net present value (NPV). In this study, the GA is utilized to maximize the NPV, while the battery charging/discharging strategy was managed by an iterative and analytical approach using the load following method. By determining the optimal location, size, and operation of BESS, results demonstrate that several economic benefits can be obtained, including energy arbitrage, peaking power generation, energy loss reduction, system upgrade deferral, a reduction in CO2 emissions, and reactive power support. The study assumed that PV units are placed at all system busses to represent rooftop solar PV with a total annual PV generation of 28.62%. The authors in [24] examine a hybrid approach by proposing a coordination technique between PV inverters and battery energy storage systems to solve the voltage rise and dip. The control approach is evaluated on LV rural and urban scenarios, which have different R/X ratios. The droop-based approach is used to control the battery charging and discharging operation. This study shows that in the case of the urban scenario (low R/X ratio), the reactive compensation utilizing the PV inverters is enough to keep the voltage within the acceptable voltage limits. However, for the rural scenario (high R/X ratio), the coordination between PV inverters and BESS is required. On the other hand, the authors in [25] perform a two-step optimization approach to find the optimal size and location of PV and BESS. The first step is to identify the optimal placement of the PV systems that lead to minimum loss, cost, and voltage deviation in the distribution system. The second step is to determine the optimal sites for BESS that result in minimizing the previous objectives. In this study, the optimization problem was solved by GA. For the charging and discharging rates, an analytical method is used through peak load checking. Results indicate that by installing 20 batteries of a lithium-ion power pack battery system manufactured by the Tesla company (assumed to be the battery technology), the peak power losses in significantly minimized and the network voltage is enhanced.
In addition, it is critical to re-evaluate the controlling approaches and analysis tools as the distribution networks become more dynamic as a result of continuing structural changes. The complexity and the sheer volume of data make the analysis of power systems using traditional methods difficult. In recent years, intelligent algorithms have experienced observable advancements and such modern approaches are being developed to better tackle engineering issues. Therefore, metaheuristic optimization algorithms, such as Particle Swarm Optimization [26], Genetic Algorithm [22], and Cuckoo Search Optimization (CSO) [27], have been applied for different distribution systems applications. These algorithms have demonstrated their ability to solve engineering problems with near-optimal solutions. The authors in [28], for example, use the Water Cycle Algorithm (WCA) to determine the size and location of the distributed generation and the optimal network reconfiguration. The IEEE 33-bus and IEEE 69-bus test feeders are used to validate the proposed method. Results show the effectiveness of the proposed approach and WCA displays its superiority over other algorithms, such as the Harmony Search Algorithm, Fireworks Algorithm, and CSO. On the other hand, the study in [29] employs the Harris Hawks Optimization (HHO) as the core optimizer of their proposed approach that tackles the reconfiguration problem in modern distribution networks. Results reveal that HHO outperforms other optimization algorithms, namely PSO and CSO.
Nevertheless, there is still no solid evidence to choose a specific algorithm. Therefore, this paper introduces the use of a recent optimization algorithm, called the Neural Network Algorithm (NNA) [30]. The NNA utilizes search operators and the distinctive structure of artificial neural networks (ANN) to solve challenging optimization issues. One of the advantages of NNA is that it eliminates the challenge of tuning the initial parameters, which represent the most important obstacle that encounters other metaheuristic algorithms.

1.2. Motivation and Major Contributions of the Paper

Based on the above discussion, the literature review demonstrates that adequate work has been carried out regarding BESS planning for voltage control. Nevertheless, there are some shortcomings that remain unresolved. Therefore, the objective of this study is to address these issues by providing a reliable control method for the voltage profile in LV distribution networks embedded with high residential rooftop PV units. The proposed model is called the open architecture model, meaning that other sources can be added if the user wants. In this study, voltage control is accomplished by developing a bi-level optimization approach consisting of upper and lower optimization levels. In the upper-level optimization, the Neural Network Optimization Algorithm (NNA) is used while the lower-level optimization is represented using LP. The proposed voltage mitigation strategy helps the distribution system planners decide on the location where the available BESS should be installed, the capacity of each BESS, and the optimal charging and discharging characteristics of the BESS in order to overcome the overvoltage and undervoltage problems. The main contributions of the paper compared to other studies can be summarized as follows:
  • Since most of the BESS-controlling strategies are based on local information, they did not provide a system-level optimality guarantee. That is, the optimum amount of active power to be stored by each installed battery in the network is absent. This study tackles this point by providing a network-level optimization for BESS operation in grid-connected solar PV.
  • Most of the studies use analytical approaches and local information to control the operation of the batteries. This research work, on the other hand, provides a charging/discharging strategy, taking into consideration all batteries in the distribution system to improve the voltage profile.
  • In addition, different daily charging/discharging strategies have been proposed in the literature. Some of them proposed a load-following control method, while others utilized a droop-based method. Therefore, the proposed method examines a new controlling approach that shows its effectiveness.
  • In addition, most papers have assumed predetermined sizes, numbers, and BESS locations in the distribution network. Their assumption may not be ideal since considering different sizes, numbers, or locations could result in better operation scenarios. Results indicate that the proposed voltage strategy is useful in the optimal planning of the BESS in the network.
The rest of this paper is structured as follows: Section 2 describes the overall framework of the proposed voltage management approach and BESS modeling. NNA is explained in Section 3. In Section 4, a case study with analytical findings is presented. In Section 5, the study is completed by summarizing the main conclusions and the importance of the work.

2. Materials and Methods

This section discusses the overall methodology for voltage control proposed in this work. The problem description and the framework of the voltage management strategy, as well as the BESS modeling and the NNA used in this work, are described.

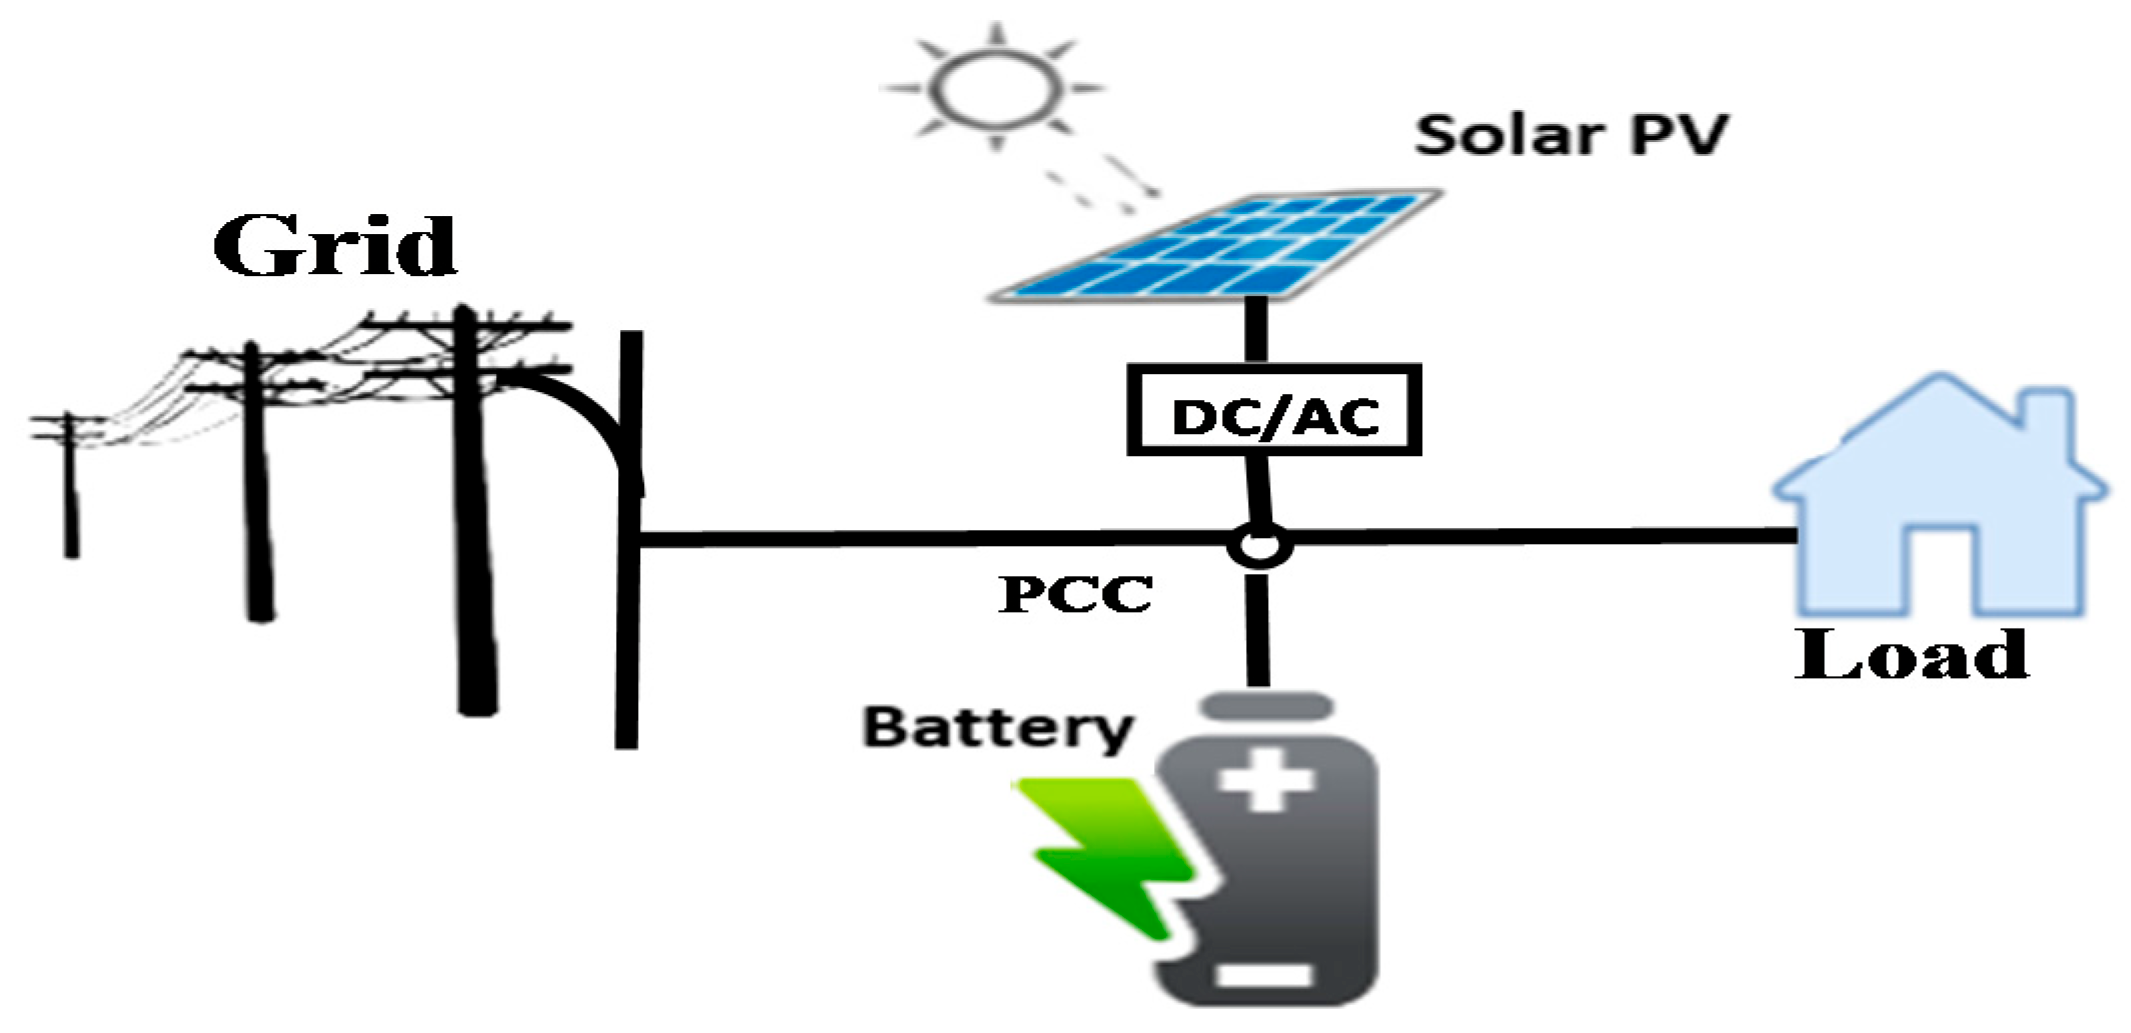
2.1. Problem Description

The main objective of this study is to maximize PV power harvesting while controlling the voltage in a low voltage distribution system. This is accomplished by optimal BESS deployment over a specific planning horizon. The PV power, home load, distribution system topology, and the total number of available BESS to be installed represent the input in the proposed methodologies. The optimal location, size, and numbers of BESS are the decision variables to be obtained in this study. The voltage rise/drop problems are demonstrated using a standard radial distribution feeder with many buses. A rooftop PV unit, BESS, and a local load—which is seen as a customer—are all included in each bus.

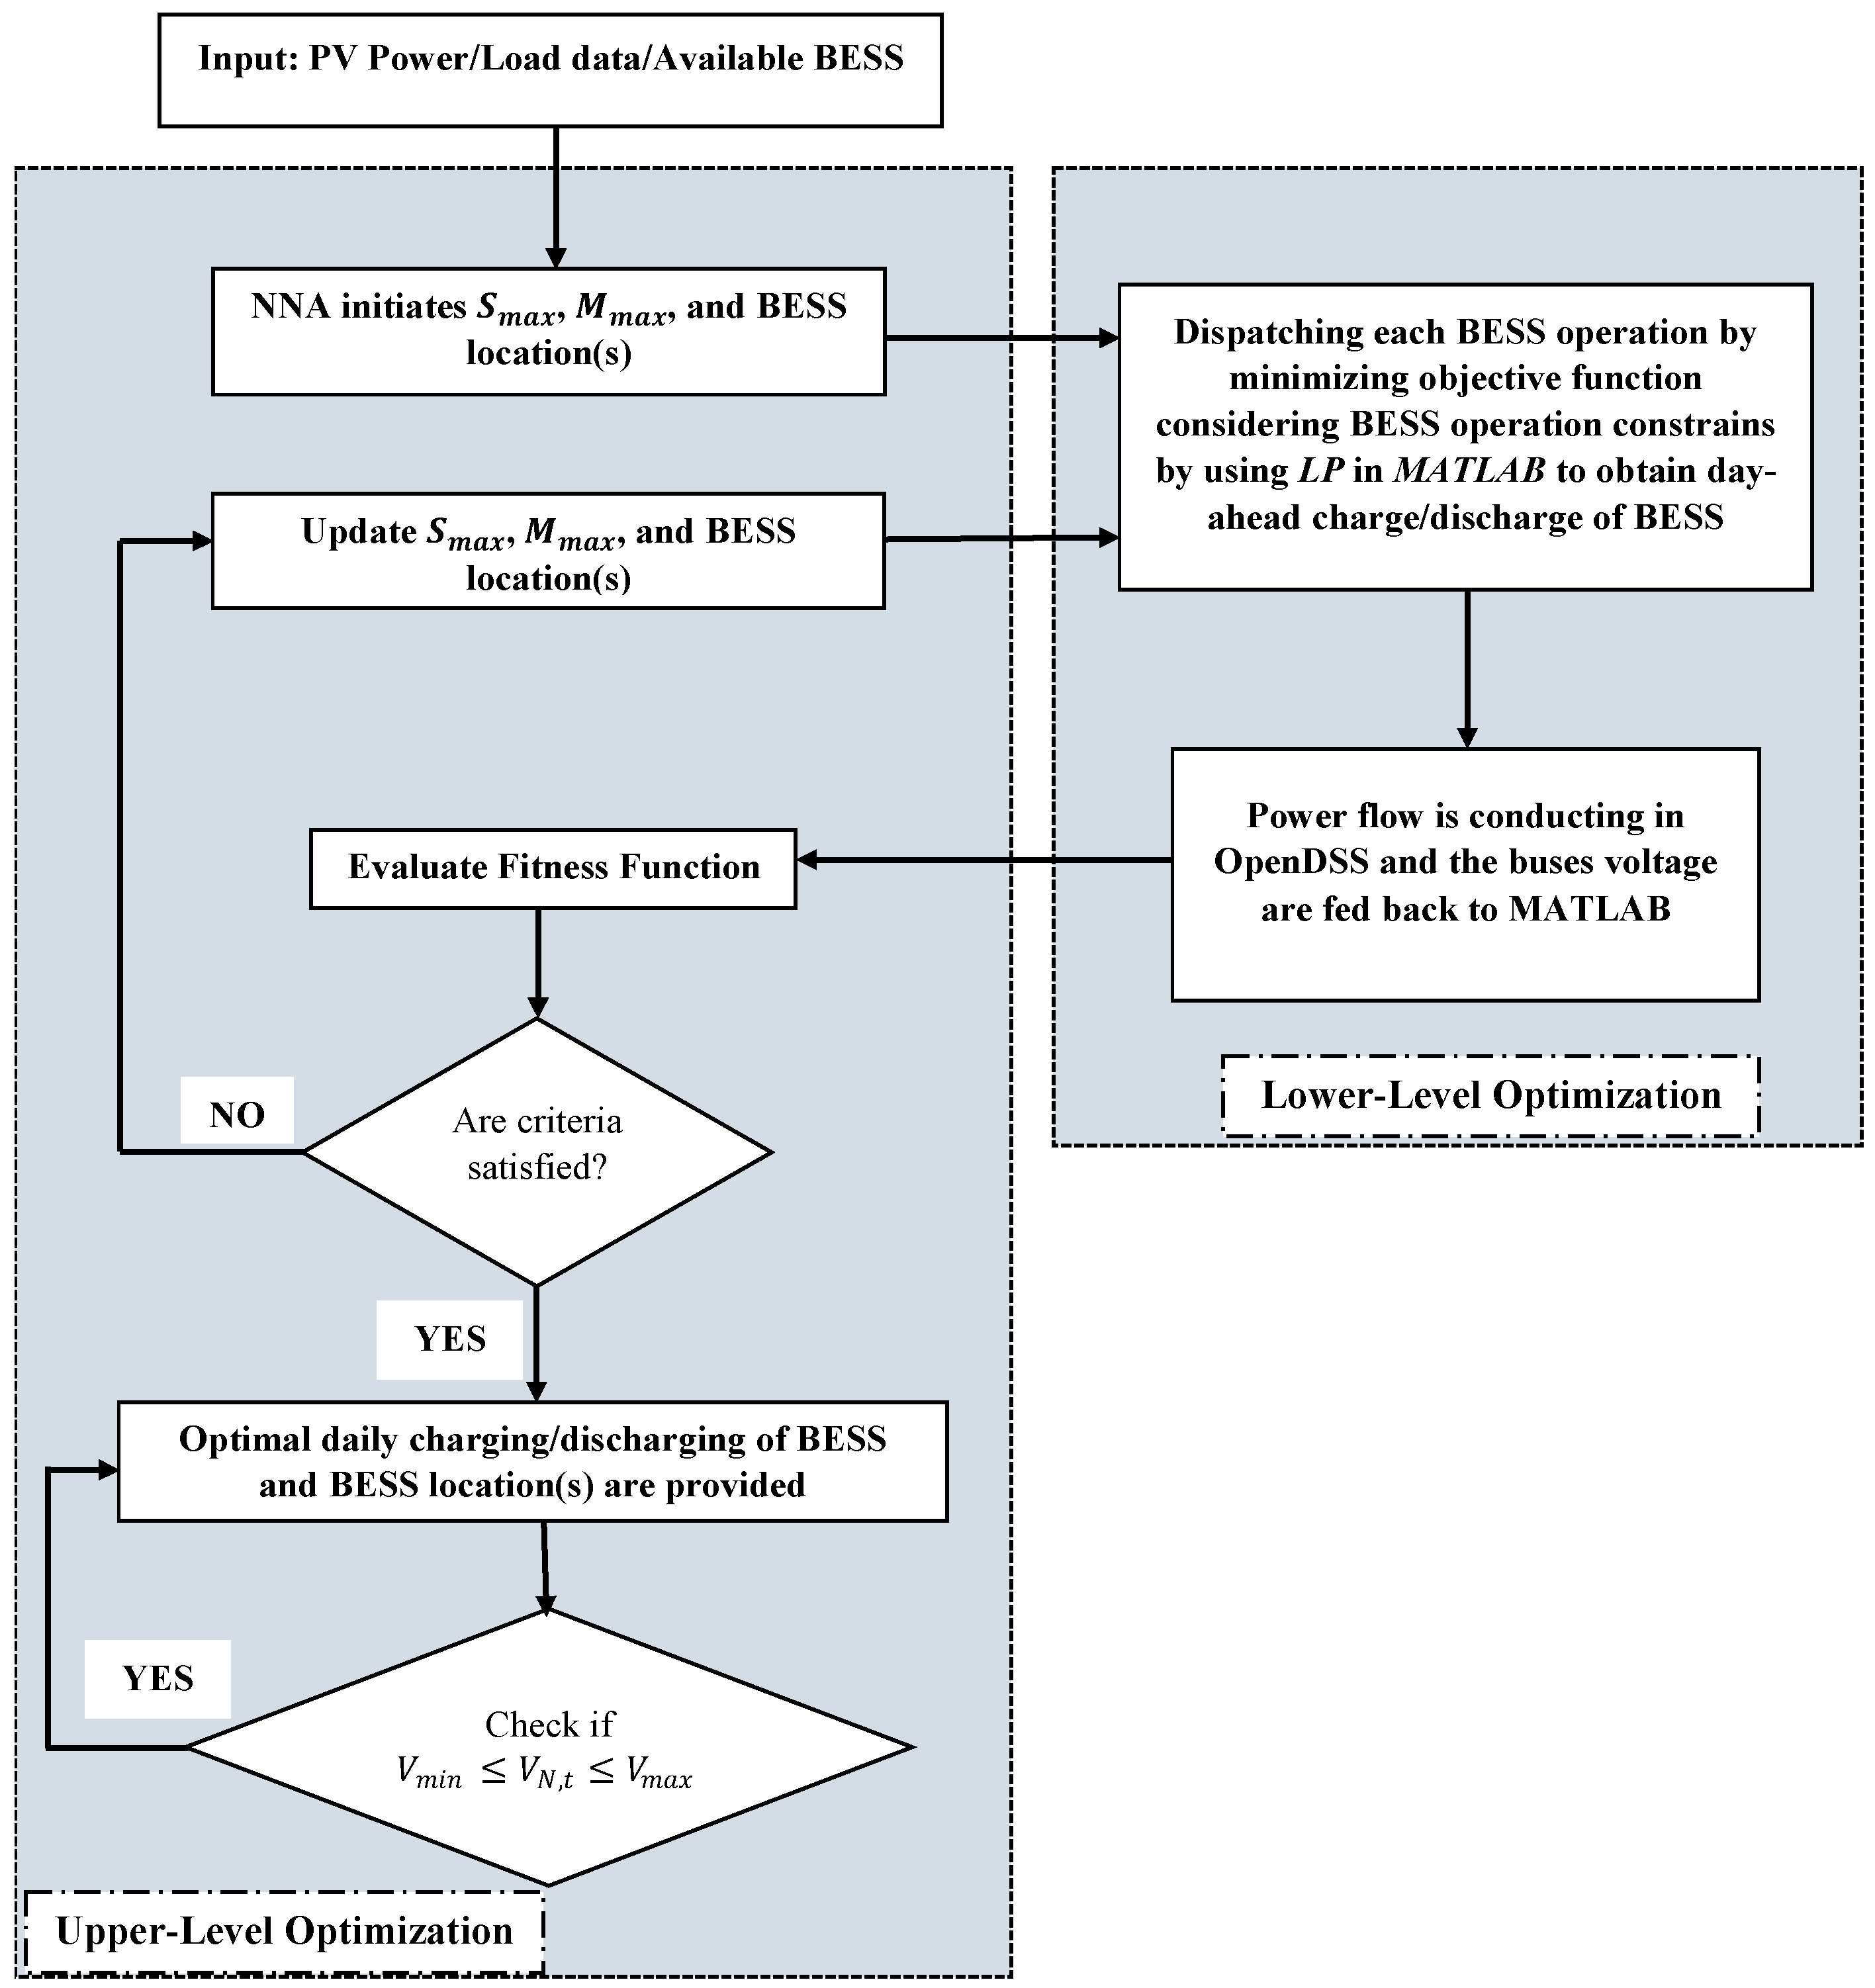
2.2. Study Framework

The framework of the voltage management strategy proposed in this study is depicted in Figure 1. The proposed method achieves optimal BESS planning via network-level optimization. Hence, a bi-level optimization algorithm is used for BESS planning to obtain the optimal daily (24-h) charging/discharging scheduling of batteries to improve distribution network voltage. The algorithm is divided into two optimization levels: upper-level optimization and lower-level optimization. NNA represents the upper-level optimization, while LP is used in the lower-level optimization. The following are the main steps in the voltage control strategy:
 Step 1: 
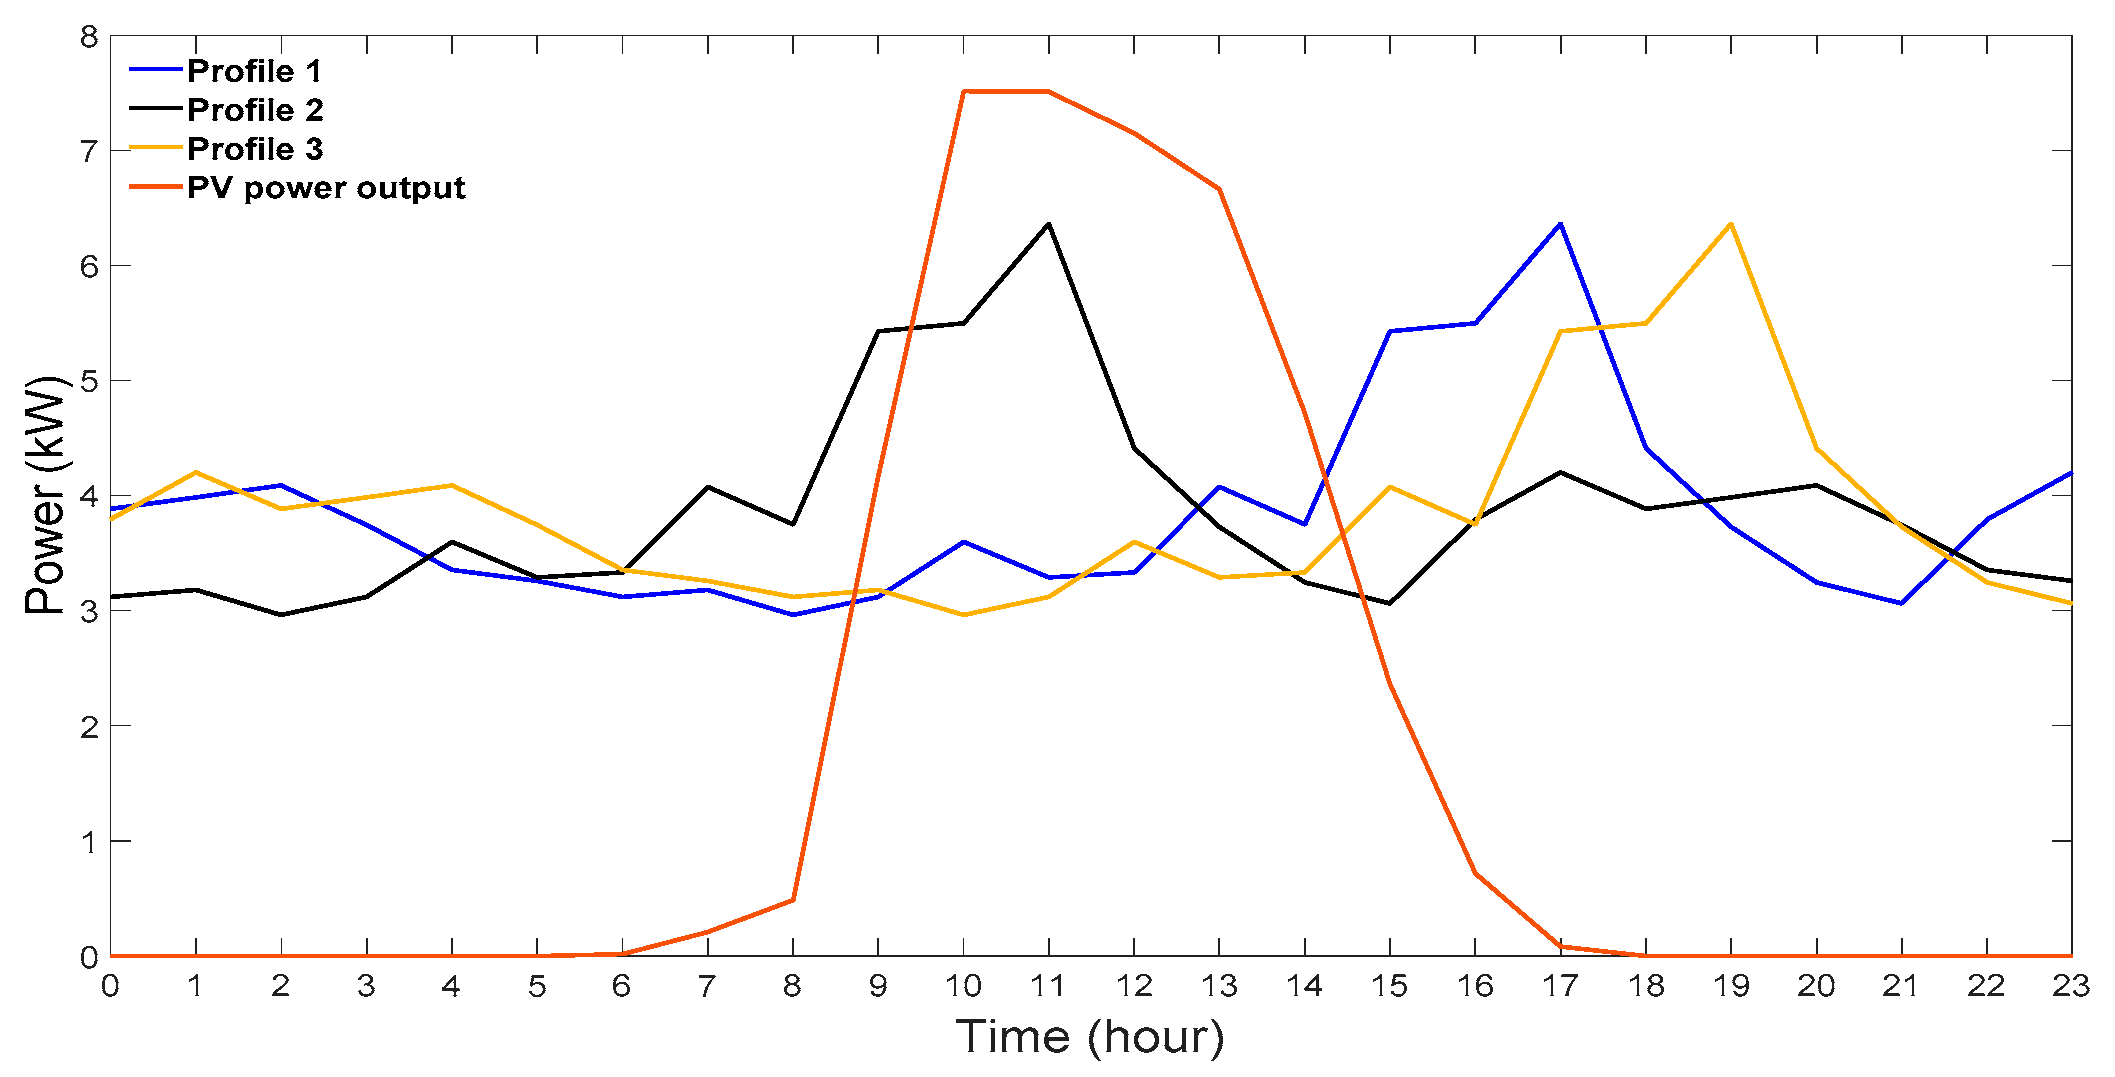
The algorithm receives as input data the PV power output, load data of each house, and prespecified available BESS.
 Step 2: 
The NNA produces the initial population for the optimization problem. The explanation of NNA is presented in Section 3. NNA pattern solution populations are represented as a vector containing battery sizes in kWh ( M max ) and kW   ( S max ) and location of each BESS, which are the variables to be optimized in the upper-level optimization problem. In other words, the vectors’ dimension is three times the number of BESS that are deployed in the network and S max are real variables, while the location ( L ) is an integer variable as it represents the house number. If we have, for instance, three available batteries to be installed in the network, nine decision variables are optimized by NNA.
v = S max 1   S max 2   S max N M max 1   M max 2   M max N L 1   L 2 L N
where S max 1 , M max 1 , and L 1 are BESS capacity in kW , BESS capacity in kWh , and the location of the first BESS, respectively. The size of vector v increases as the available batteries increase.
 Step 3: 
Using the LP, the BESS schedule for the following day is determined and solved in MATLAB (see Section 2.2). After that, the Open Distribution System Simulator (OpenDSS) software receives the ideal daily charge/discharge of BESS [31] and measures its effectiveness on the distribution grid. The role of OpenDSS is to model and simulate the distribution system. The power flow constraints are satisfied since the power flow is conducted in real-time simulation through the OpenDSS.
 Step 4: 
The evaluation is accomplished using the fitness function, Equation (2), which minimizes voltage deviation. Three-phase load flow in OpenDSS is used to obtain the voltage magnitudes. This technique is continued until the desired number of iterations has been reached.
F i t n e s s   v i = 1 2 ( i = 1 N t = 1 24 1.05 V i , t 2 + 0.95 V i , t 2 )  
where N is the PV systems buses in the distribution network, and V i , t is the voltage magnitude at bus i at time   t .

2.3. Battery Modeling

BESS are increasingly being used in distribution systems. As a result, appropriate battery operation modeling is critical to delivering the desired ancillary services and supporting the ongoing expansion of renewable energy resources. BESS provides the greatest benefits when it charges during periods of high PV generation and low demand and discharges during periods of high demand. This is reflected by the voltage profile of the system on each bus. Hence, the optimal daily charge/discharge of BESS is determined by minimizing the following function, Equation (3), that uses the daily voltage signals to control each BESS operation, taking into consideration the operation assumptions and the BESS specifications, Equations (4)–(12):
M i n i m i z e    t = 1 24 P t B , d i c h P t B , c h × V o l a t g e s i g n a l  
S u b j e c t   t o   t = 1 24 η d i s c h P t B , d i c h η c h P t B , c h = 0
t = 1 24 P t B , d i c h α t S m a x
0 P t B , d i c h S m a x
0 P t B , c h S m a x
0 P t B , c h β t ( P V t )
S O C 1 = η c h P 1 B , c h M m a x P 1 B , d i c h η d i s c h   M m a x + S O C i n i t ,         F o r     t = 1
S O C t = η c h P t B , c h M m a x P t B , d i c h η d i s c h   M m a x + S O C t 1 ,         t > 1
S O C m a x S O C t S O C m i n
α t + β t = 1
The optimization cycle for LP is 24 h, and there are five decision variables to be optimized, namely P t B , d i c h , P t B , c h , S O C t , α t , and β t . That is, 120 decision variables are generated in the optimization cycle. The P t B , d i c h and P t B , c h are real number variables representing the discharge and charge rates of BESS at t th   hour. The   η d i s c h and   η c h are the BESS discharging and charging efficiency, respectively. The sum of the discharging and charging efficiency is equal to the round-trip efficiency of the BESS technology. V o l a t g e s i g n a l is the daily voltage signal of the network at each load bus. P V t is the available power from the PV system at time t . M m a x is the maximum energy capacity of BESS in kWh , while S m a x is the maximum rated power of BESS in kW . M m a x and S m a x are obtained iteratively from the upper-level optimization, NNA. S O C 1   is the state of charge of the 1st hour of the day that depends on the initial state of charge of the BESS, S O C i n i t . In this study, 10 % is assumed as the initial state of charge. S O C t   is the BESS’s state of charge for the next 23 h and is a real number variable. S O C m a x and S O C m i n are the prespecified maximum and minimum states of charge, respectively. α t is the discharging status of BESS at time t , and β t is the charging status of BESS at time t . Both α t and β t are either 1 if discharging/charging or 0 otherwise.
In the optimization problem, there are four bounding constraints, one inequality constraint, and four equality constraints. From Equation (3), the goal is to minimize the amount of charging and discharging that is triggered by the daily network voltage signal. In other words, the goal is to maximize renewable energy exploitation while controlling the voltage levels. Equation (4) indicates that the battery is a daily refill, and the daily final state of charge is similar to the initial state of charge. The charging and discharging powers are limited to the rated   kW capacity of the BESS technology and the available power from the PV systems, as shown in Equations (5)–(8). In Equations (9)–(11), the state of the charge is limited to the maximum and minimum permitted state of charge, considering the kWh capacity of BESS. Finally, Equation (12) ensures that BESS is either charging, discharging, or in idle mode. Lithium-ion batteries are considered the type of technology in this study. This is because of their maturity for grid-connected applications and high efficiency [32].
In this study, the BESS operation is modeled as an optimization problem. This research work assumes that the battery technologies are lithium-ion. Figure 2 depicts a residential home connected with a rooftop and BESS. The BESS performance specifications are listed in Table 1. For this purpose, BESS optimal planning and operation need to be obtained based on a cost function to obtain the desired objective from the BESS installation. Thus, the BESS operation is based on the following assumptions:
During the day:
  • The PV system extracts the available power from the sun and produces solar energy.
  • See if the produced energy can be utilized to supply the demand.
  • Any excess energy is considered as the available energy to charge the BESS.
  • If the BESS is completely charged, the surplus energy is exported to the main grid.
At night:
  • The PV system generates little amounts of no solar energy.
  • The BESS initially supplies the demand.
  • If the load is completely supplied by BESS, the remaining energy in BESS is exported to the main grid.
  • If the BESS is fully discharged, the load is supplied from the main grid.

3. Metaheuristic Optimization Algorithms

The metaheuristic optimization algorithms are population-based algorithms that use numerous agents following various pathways [33,34]. In this study, the proposed voltage management strategy is evaluated in the low voltage distribution system. The primary objective here is to plan multiple community BESS, optimally through a network-level optimization. As it was mentioned above is that NNA is used as the upper-level optimization. The NNA is introduced in the next subsection.

Neural Network Optimization Algorithm

NNA is a modern metaheuristic optimization algorithm, which is motivated by the concept of Artificial Neural Networks (ANN). NNA utilizes the same structure and principle of ANNs to generate the algorithm candidate solutions and solve complex optimization problems. In this study, the objective function to be minimized is presented in Equation (2). Details of the NNA are as follows [30]:
 Step 1: 
Select the pattern solutions population N P o p and set the lower l o w and upper u p bounds and the maximum number of iterations of the algorithm i t e r m a x . In this study, the N P o p is set to 50. Since we have three variables to optimize, the l o w and u p bounds are set to adhere to BESS rated capacity, rated power, and the number of buses in the examined test feeder. For i t e r m a x , 250 is used in this study.
 Step 2: 
Initiate the population of pattern solutions with the predetermined bounds using the following formula:
X m n = l o w n + r a n d ( ) × U p p n l o w n
 Step 3: 
Evaluate the fitness values of the initial population using Equation (2).
 Step 4: 
Randomly generate the weigh matrix, values of which are selected based on a uniform distribution between zero and one and the summation of these values should be below or equal to one. See Equations (14) and (15).
j = 1 N p o p w i j t = 1 ,             i = 1 , 2 , 3 , . ,   N p o p
w i j   U 0 , 1 ,             i , j = 1 , 2 , 3 , . ,   N p o p
where t is the iteration number.
 Step 5: 
Determine the target solution X T a r g e t and the associated target weight W T a r g e t . Since NNA has only one target response, the target solution and weight are selected from the population weight (weight matrix).
 Step 6: 
Create a new pattern solution X n e w and update the pattern solutions using Equations (16) and (17).
X j N e w t + 1 = i = 1 N p o p w i j t × X i t ,             j = 1 , 2 , 3 , . ,   N p o p
X i t + 1 = X i t + X i N e w t + 1 ,             i = 1 , 2 , 3 , . ,   N p o p
 Step 7: 
Update the weight matrix W using Equation (18), taking into consideration the constraints in Equations (14) and (15).
W i U p d a t e d t + 1 = W i t + 2 × r a n d × W i T a r g e t t W i t , i = 1 , 2 , 3 , . ,   N p o p
 Step 8: 
Evaluate the bias condition. If r a n d β conducts that bias operator, see Equation (19) for both the new position of pattern solutions and the updated weight matrix.
β t + 1 = β t × 0.99 ,       t = 1 , 2 , 3 , . ,   i t e r m a x
 Step 9: 
Employ the transfer function operator T F to update the new position of pattern solutions X i * if r a n d > β , using the following equation:
X i * t + 1 = T F   X i t + 1 = X i t + 1 + 2 × r a n d × X i T a r g e t t X i t + 1 ,   i = 1 , 2 , 3 , . ,   N p o p
 Step 10: 
Find the fitness values of the updated pattern solutions using the objective function, Equation (2).
 Step 11: 
Update the target solution and its associated target weight.
 Step 12: 
Update the value of β using the reduction formulation, Equation (19).
 Step 13: 
Check that the stop criteria are met; otherwise, the algorithm should go back to Step 6.

4. Results and Discussion
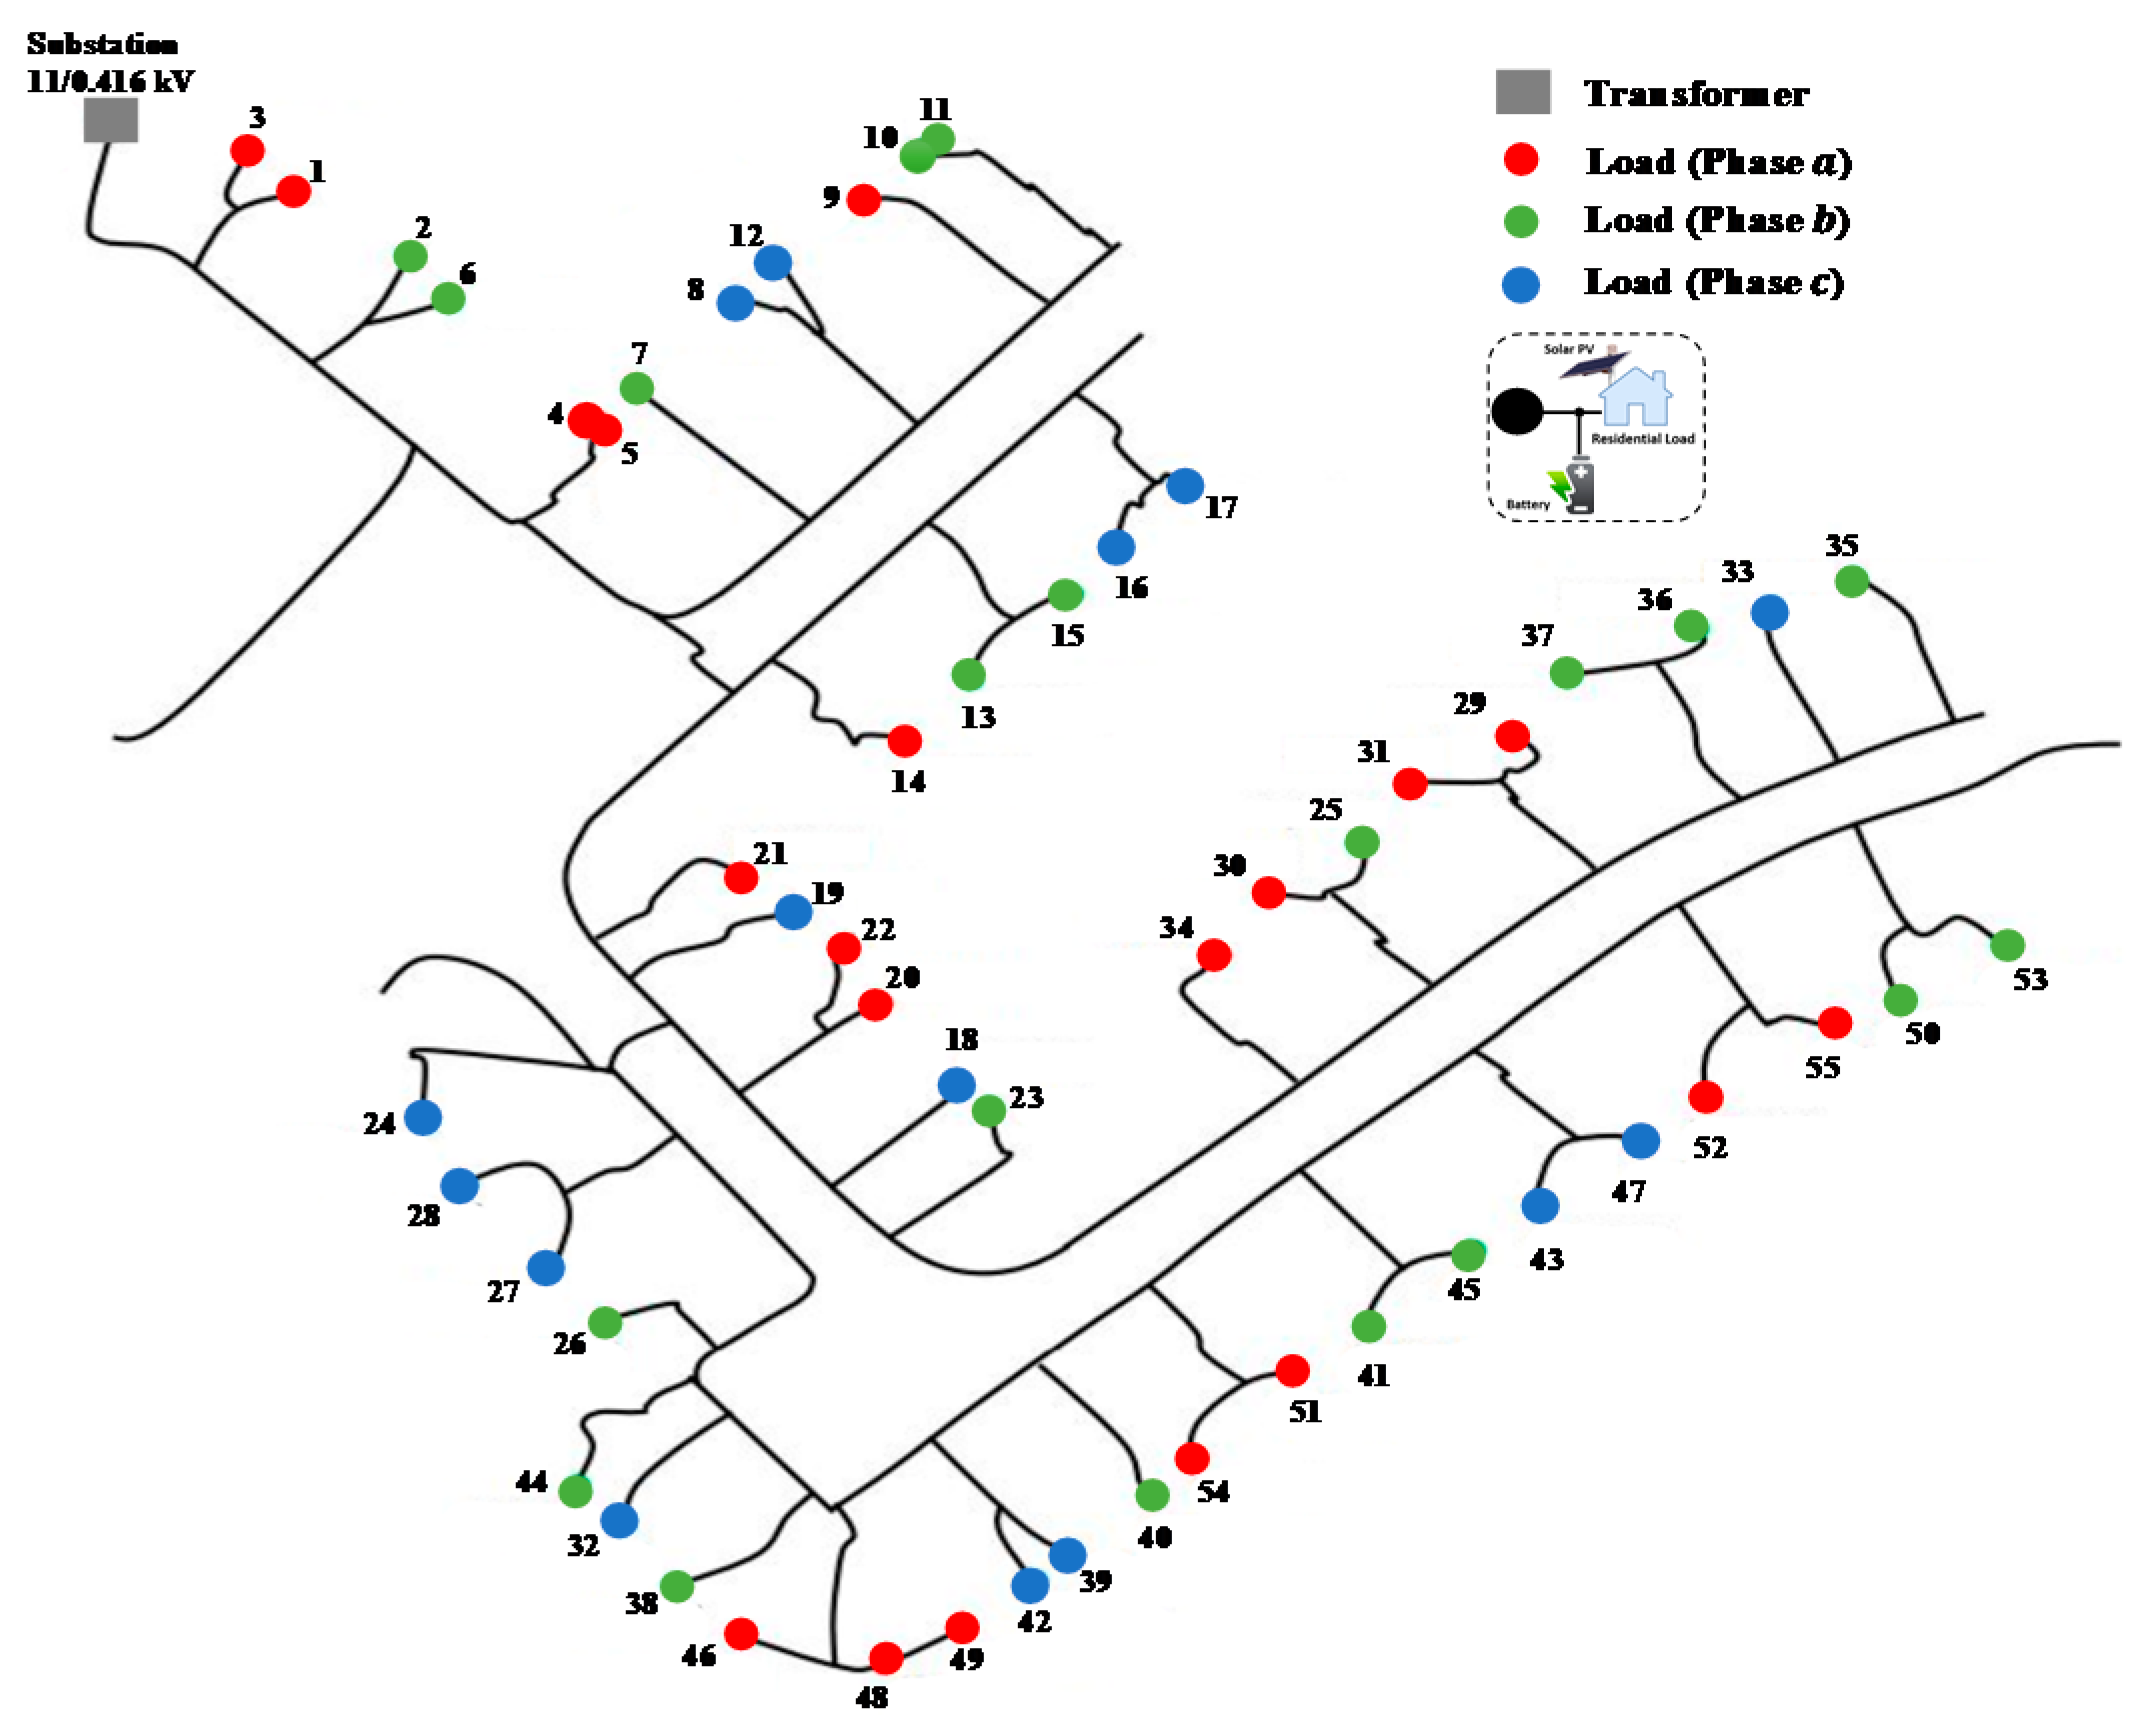
The results of this research work are explained and determined in this section, where the optimal operating of BESS is dispatched utilizing the proposed voltage management strategy.

4.1. Test System

The proposed methodology has been applied to the IEEE low voltage test feeder shown in Figure 3. The feeder is a radial distribution feeder, and the substation transformer steps down the voltage from 11 kV to 416 V. The transformer at the substation of this test feeder has a rated kVA of 800, and the tap setting of the secondary part of the transformer is set to 1.02 p.u. to make the overvoltage and undervoltage problem more vivid. It is assumed in this study that each bus in the distribution network is a load bus and is equipped with a rooftop solar PV with a rate of 10 kWp. The power flow simulations are conducted utilizing OpenDSS, while the numerical calculations and the daily BESS dispatch are obtained by LP using MATLAB.

4.2. Study Dataset

The load profile is based on real data obtained from a home located in Riyadh, Saudi Arabia, and was recorded by the Saudi Electricity Company. In this study, three load profiles were considered to make the overvoltage and undervoltage phenomena in the LV distribution system more pronounced and account for load profile diversity. Therefore, load profile 1, shown in Figure 4, is time-shifted back by seven hours to form load profile 2 and two hours later to form load profile 3. These load profiles are then randomly distributed to represent the load at each bus. The PV output power is scaled down from real-time data collected from the 120 kWp PV system placed on a rooftop of a mosque in Riyadh city. This location is operated by both King Abdelaziz City for Science and Technology and the Saudi Electricity Company. The PV output data gathered from the unit are in 1-h intervals for the period between 3 June 2017–31 August 2018. The time resolution of the load and the PV power is 1 h, and their profiles on 31 January 2018 are shown in Figure 4. The PV inverters are assumed to operate at a unity power factor. This study assumes that the utility has ownership of the PV systems and BESS. Therefore, these devices are fully controlled by the utility to prevent the voltage in the distribution systems.

4.3. Case Studies and Simulation Results

The excess power from the solar PV reverses the power flow causing overvoltage in the distribution network. In contrast, the high load level results in the undervoltage problem along the feeder. Typically, the acceptable voltage limits in the distribution systems should be within ± 5 % of the nominal voltage. In this study, the maximum and minimum allowed voltages are V m a x = 1.05 and V m i n = 0.95 , respectively. In addition, this network is unbalanced; therefore, the voltage is calculated based on the mean of the three-phase voltages. Figure 5 shows the voltage values at each of the network busses before and after the PV systems installation at the peak PV production. Prior to installing the PV units in the network, buses at the end of the feeder encounter the worst voltage drop. However, this situation is altered with the newly installed rooftop PV units. The voltages start to rise as we go away from the feeder, causing a violation of the upper limit of the grid voltage. Therefore, the proposed voltage management strategy is applied to determine optimal BESS characteristics, including capacity, location, number, and the optimal BESS charging/discharging operation to regulate the voltage. The analysis of BESS and their impact on the distribution system voltage profile is also shown in this case study.
To overcome this problem, the effect of adding numbers of BESS on the distribution system voltage is investigated. Different numbers of BESS are selected, and their sizes and locations are determined through the developed management approach. For example, if we have two (three, four, …, etc.) available BESS, the bi-level management algorithm identifies two critical buses to place BESS that contributes more to improving the distribution system voltage profile.

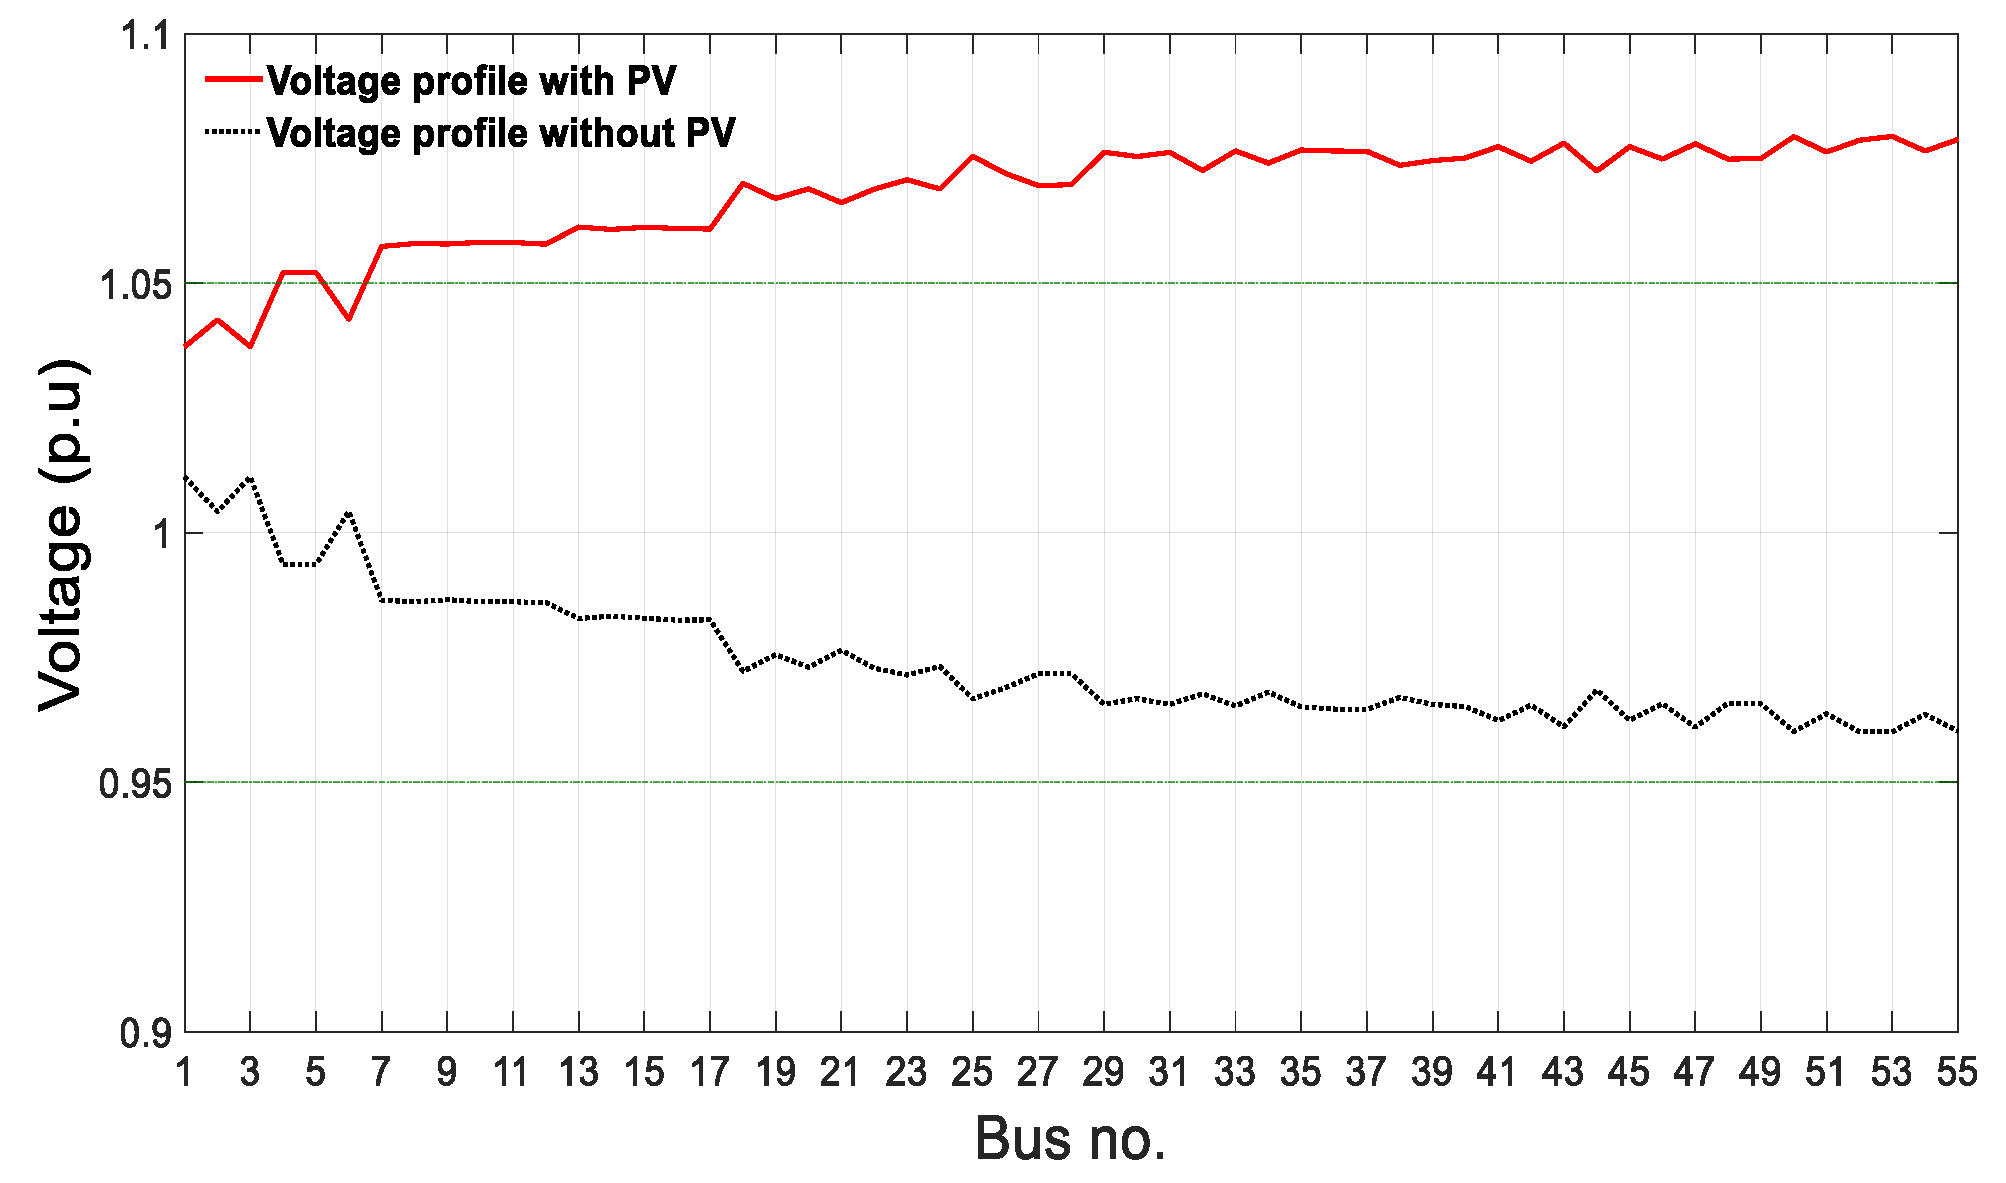
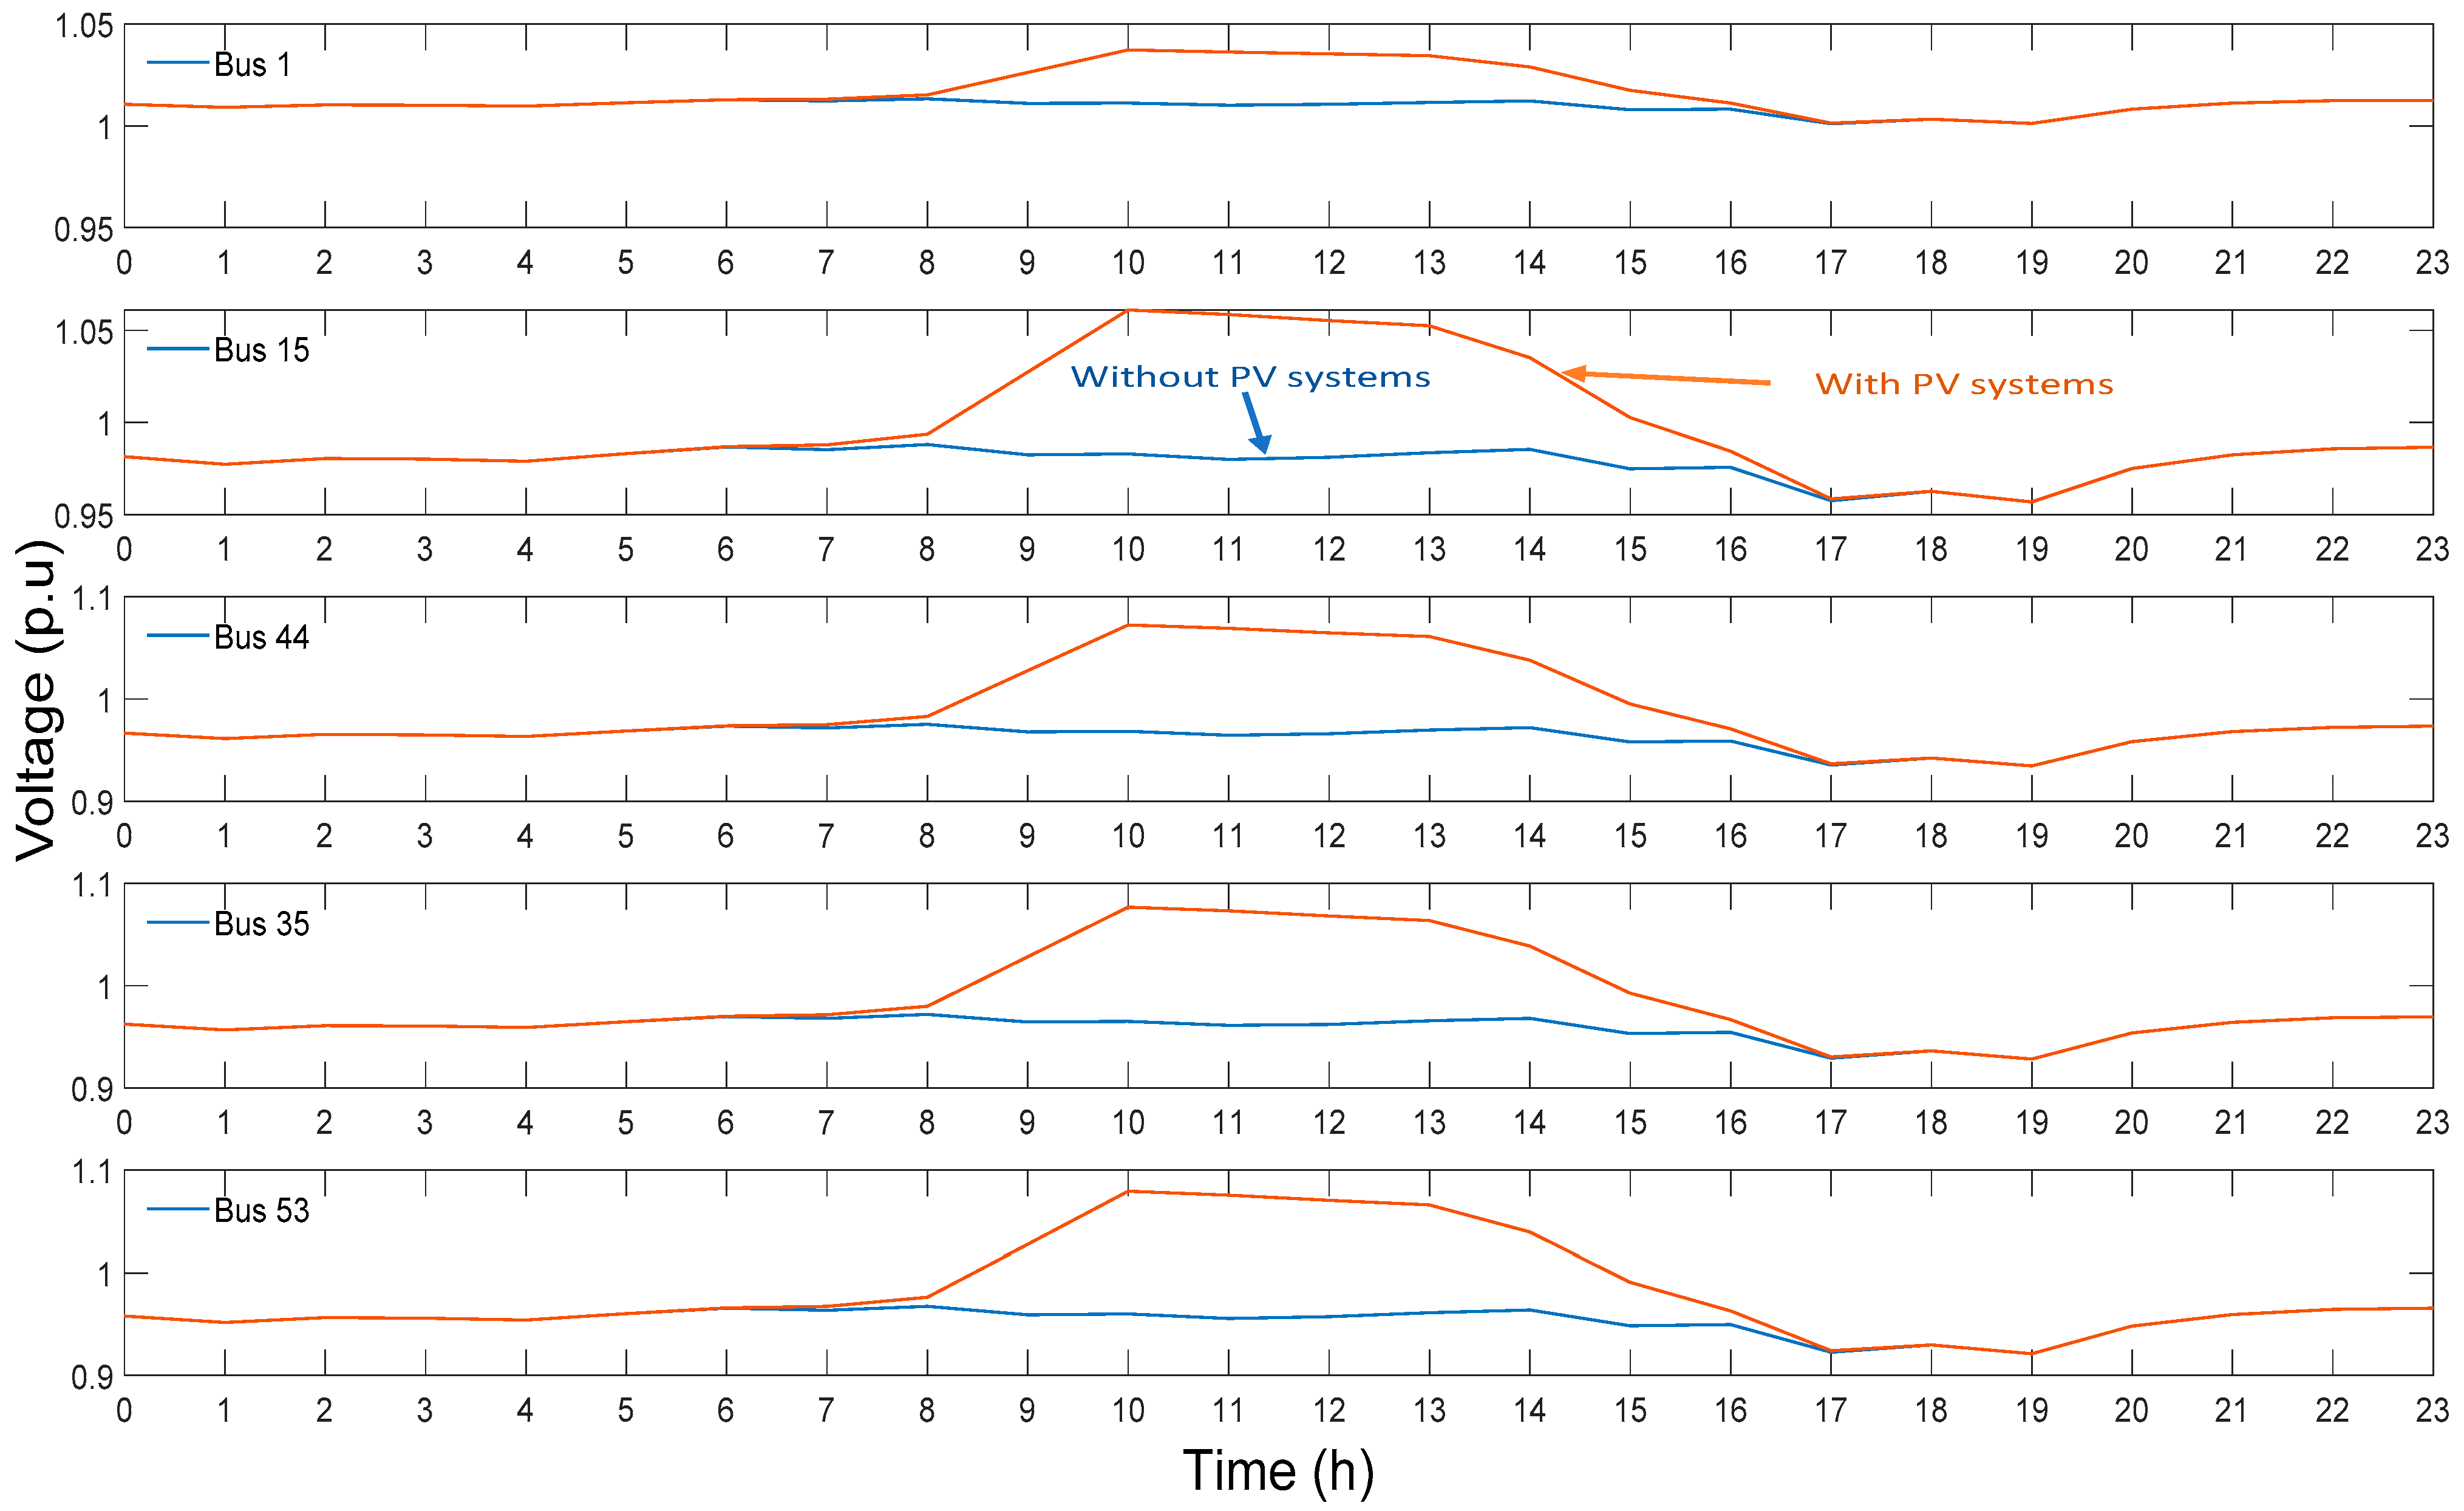
4.4. Voltage before and after PV Systems

The voltage profiles with and without the PV systems at buses 1, 15, 44, 35, and 53 are shown in Figure 6. In the case without PV systems, Figure 6 exhibits that the voltage levels at each load bus are within the voltage operation thresholds during daytime hours. However, the lower threshold is violated during the peak load time. Between 17 p.m. and 20 p.m., the voltage starts dropping as we go further away from the main transformer due to the heavy load. This situation is expected in conventional distribution systems where the demand levels are the utilities’ primary concerns. However, with the PV systems operation, the voltage rise is observed at midday due to the excess power from the PV systems. When the rooftop PV units placed at each home generate more power than the home electricity demand, it sends this excess power back to the main grid. The voltage from the solar inverter must create a voltage that is a few volts higher than the grid voltage for electricity to flow from the home to the grid. The voltage levels become higher at the homes located away from the main feeder to enable the power to flow back to the grid. At the same time, the undervoltage problem occuring at night coincided with the peak load and low renewable energy from the PV systems. Figure 6 indicates that the buses at the end of the feeder encounter the worst voltage rise.

4.5. Analysis of Optimal Sizing and Allocation
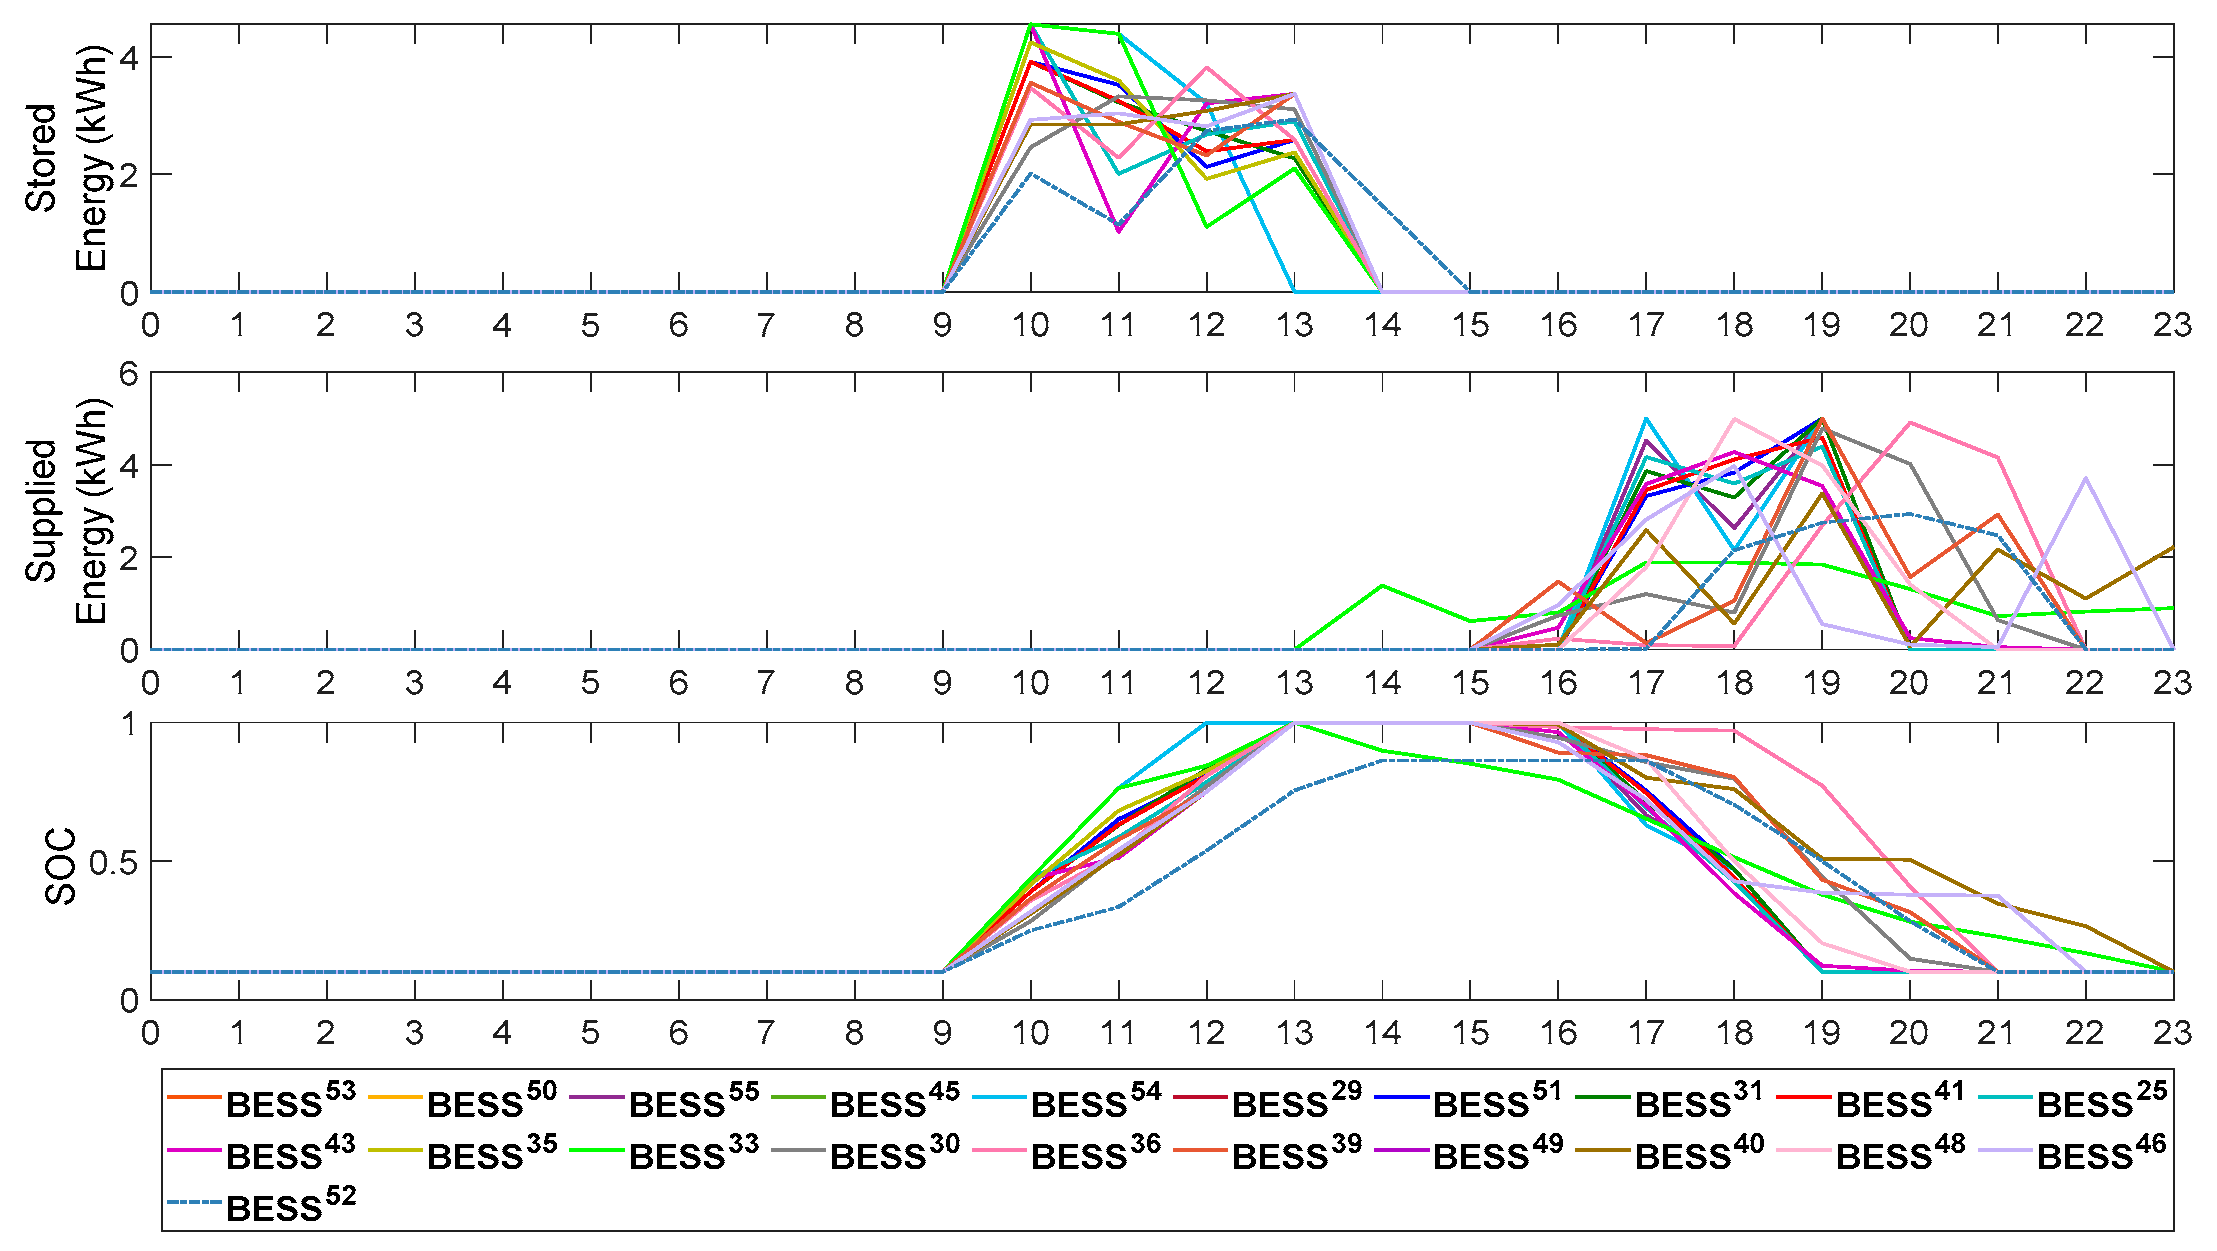
Table 2 summarizes the simulation results of the optimal location, size, and numbers of BESS. After applying the proposed voltage management strategy, the network’s voltage is enhanced by increasing the installed BESS. Bus 53 is the optimal location to install the BESS if we have only one available battery. Adding more BESS, it can be seen that the BESS tends to be placed at the end of the feeder. This is because the voltage becomes more violated as we move away from the main feeder, as is seen in Figure 6. Furthermore, the maximum and minimum voltage magnitudes are improved to their corresponding voltage limits as the availability of BESS increases. The voltage profile comes within the predefined operation limits at each bus when 21 BESS are installed at 21 different buses with a total energy of 281.6 kWh. Moreover, the optimal operation and placing of 17 BESS is enough to overcome the undervoltage problem in the network.
In the study network, there are 55 load/PV buses across the three phases. As shown in Figure 3, there are 20 loads/PVs connected to phase a , 20 loads/PVs connected to phase b , and 15 loads/PVs connected to phase   c . The simulation results in Table 2 indicate that the size and the location of batteries are highly influenced by the voltage magnitudes. Thus, the locations of BESS are mostly at the end of the feeder. In addition, among the optimal 21 BESS locations, 10, 8, and 3 batteries are connected to phase a ,   b , and c , respectively. Phases a and b encounter the worst voltage profile; thus, the optimal locations of the batteries are mostly co-located with the PV systems connected with these phases. Despite bus 47 being at the end of the feeder, no battery is installed there. This is because the load profile at bus 47 is load profile 2, which minimizes the contribution from this bus in supporting the network voltage. At this bus, the peak PV generation coincides with the local peak load. A similar situation is found with bus 37, which is connected to phase b . Therefore, the optimal siting and sizing of the available BESS are highly impacted by network topology, load profile, and the amount of PV power that flows into the grid.

4.6. BESS Operation

The optimal battery charging and discharging of each battery storage is exhibited in Figure 7. At the peak PV incidents, the batteries start charging the excess power from PV systems (from 10 a.m. to 14 p.m.) instead of being injected into the grid and causing reverse power and overvoltage. At peak demand (from 17 p.m. to 21 p.m.), the batteries supply stored energy back to the local load to increase the system voltage. The charging and discharging rates of batteries located at the end of the feeder happen frequently at the peak PV and peak load periods. The main reason is that these buses have the worst voltage profile and contribute greatly to minimizing the over- and undervoltage in the network. Considering five BESS cases, for instance, the capacity of each of them is 13.5 kWh at a rated power of 5 kW. Their charging and discharging rates are higher at the hours when the voltage is deviated (rise/drop). After that, the charging and discharging rates differ among the remaining batteries. This is because the overvoltage is reduced locally at different hours, and there is no need to charge the batteries at the peak PV moments. Additionally, it can be seen from Figure 7 that the energy of the batteries at the beginning of the day is the same as their energy at the end of the day, adhering to the batteries’ operational constraints.

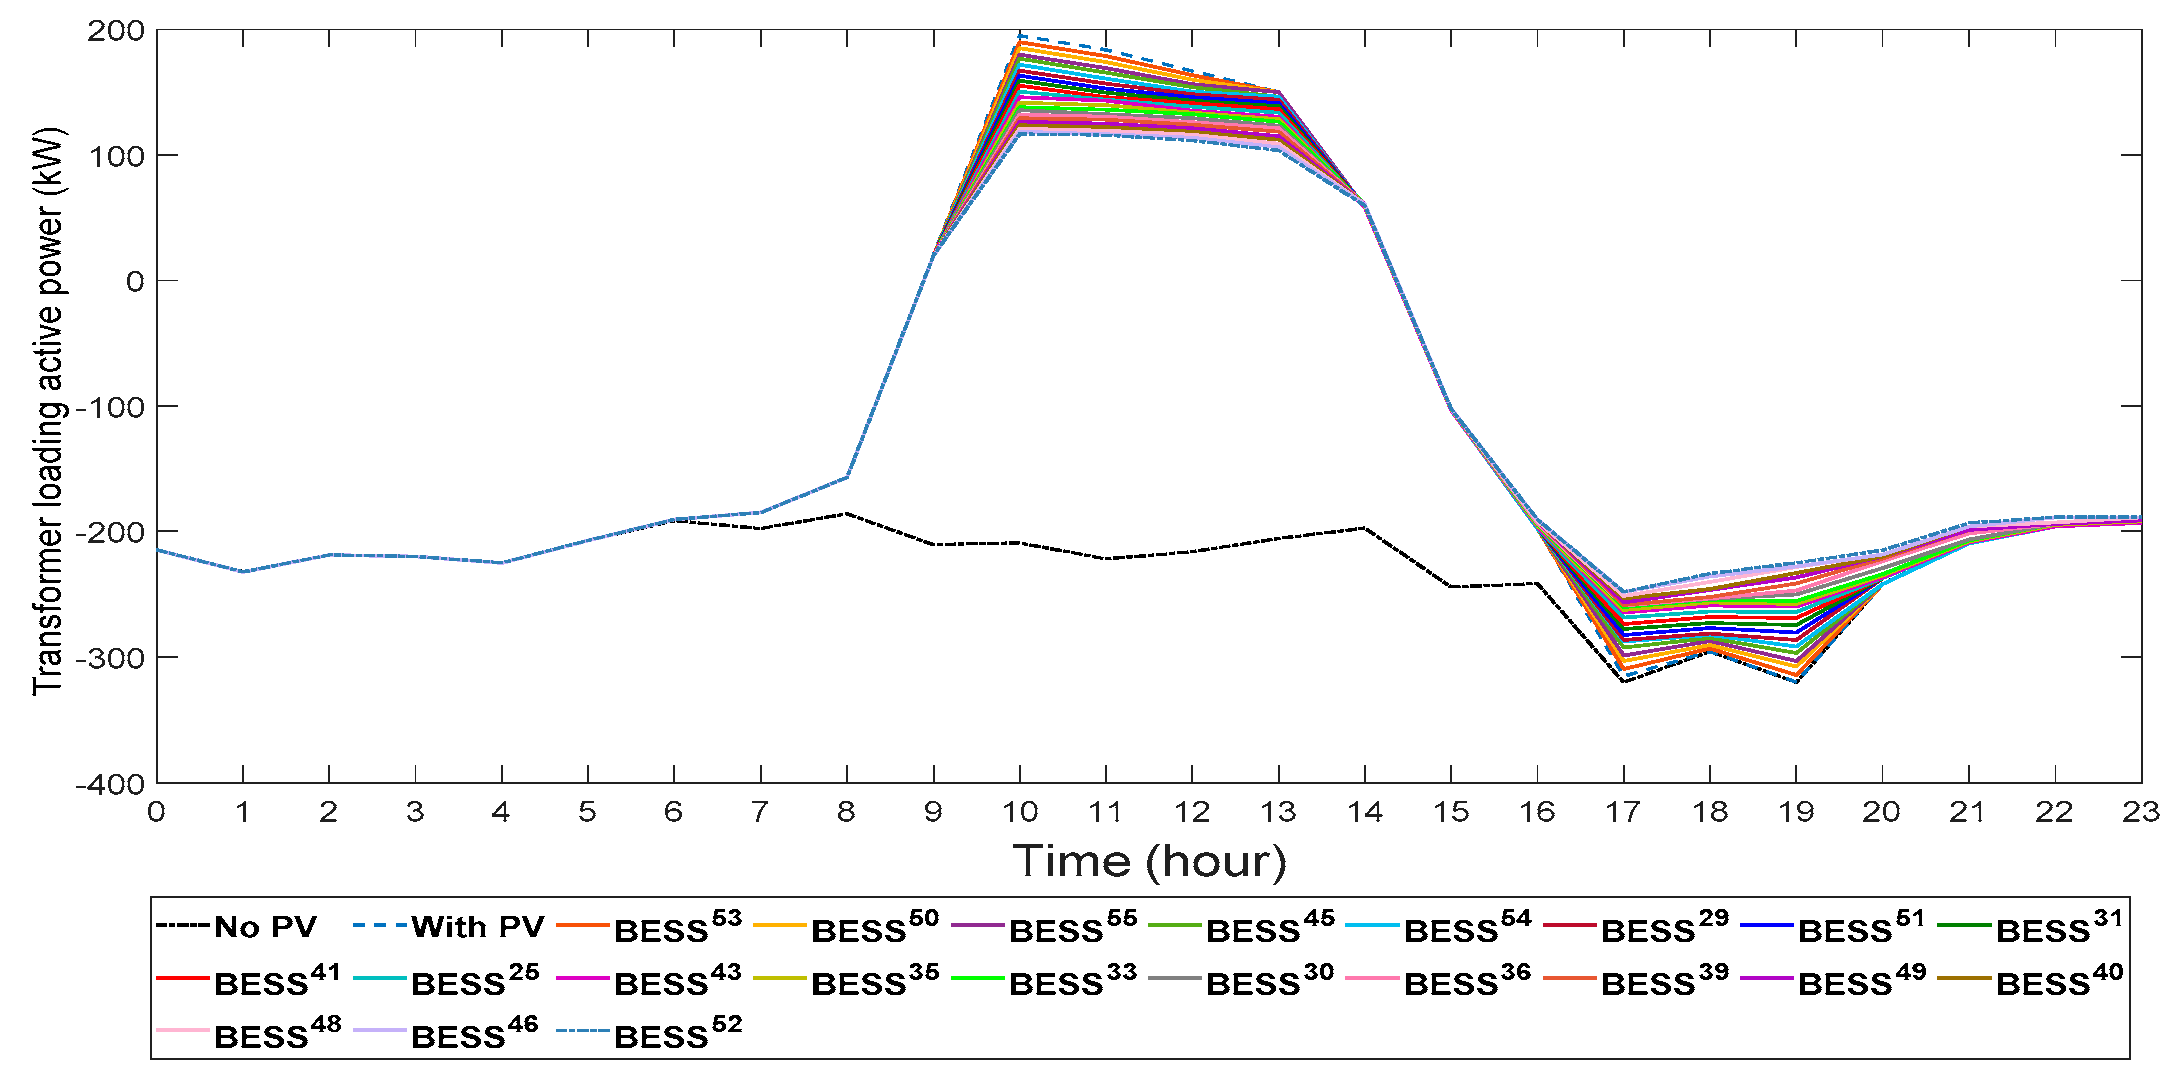
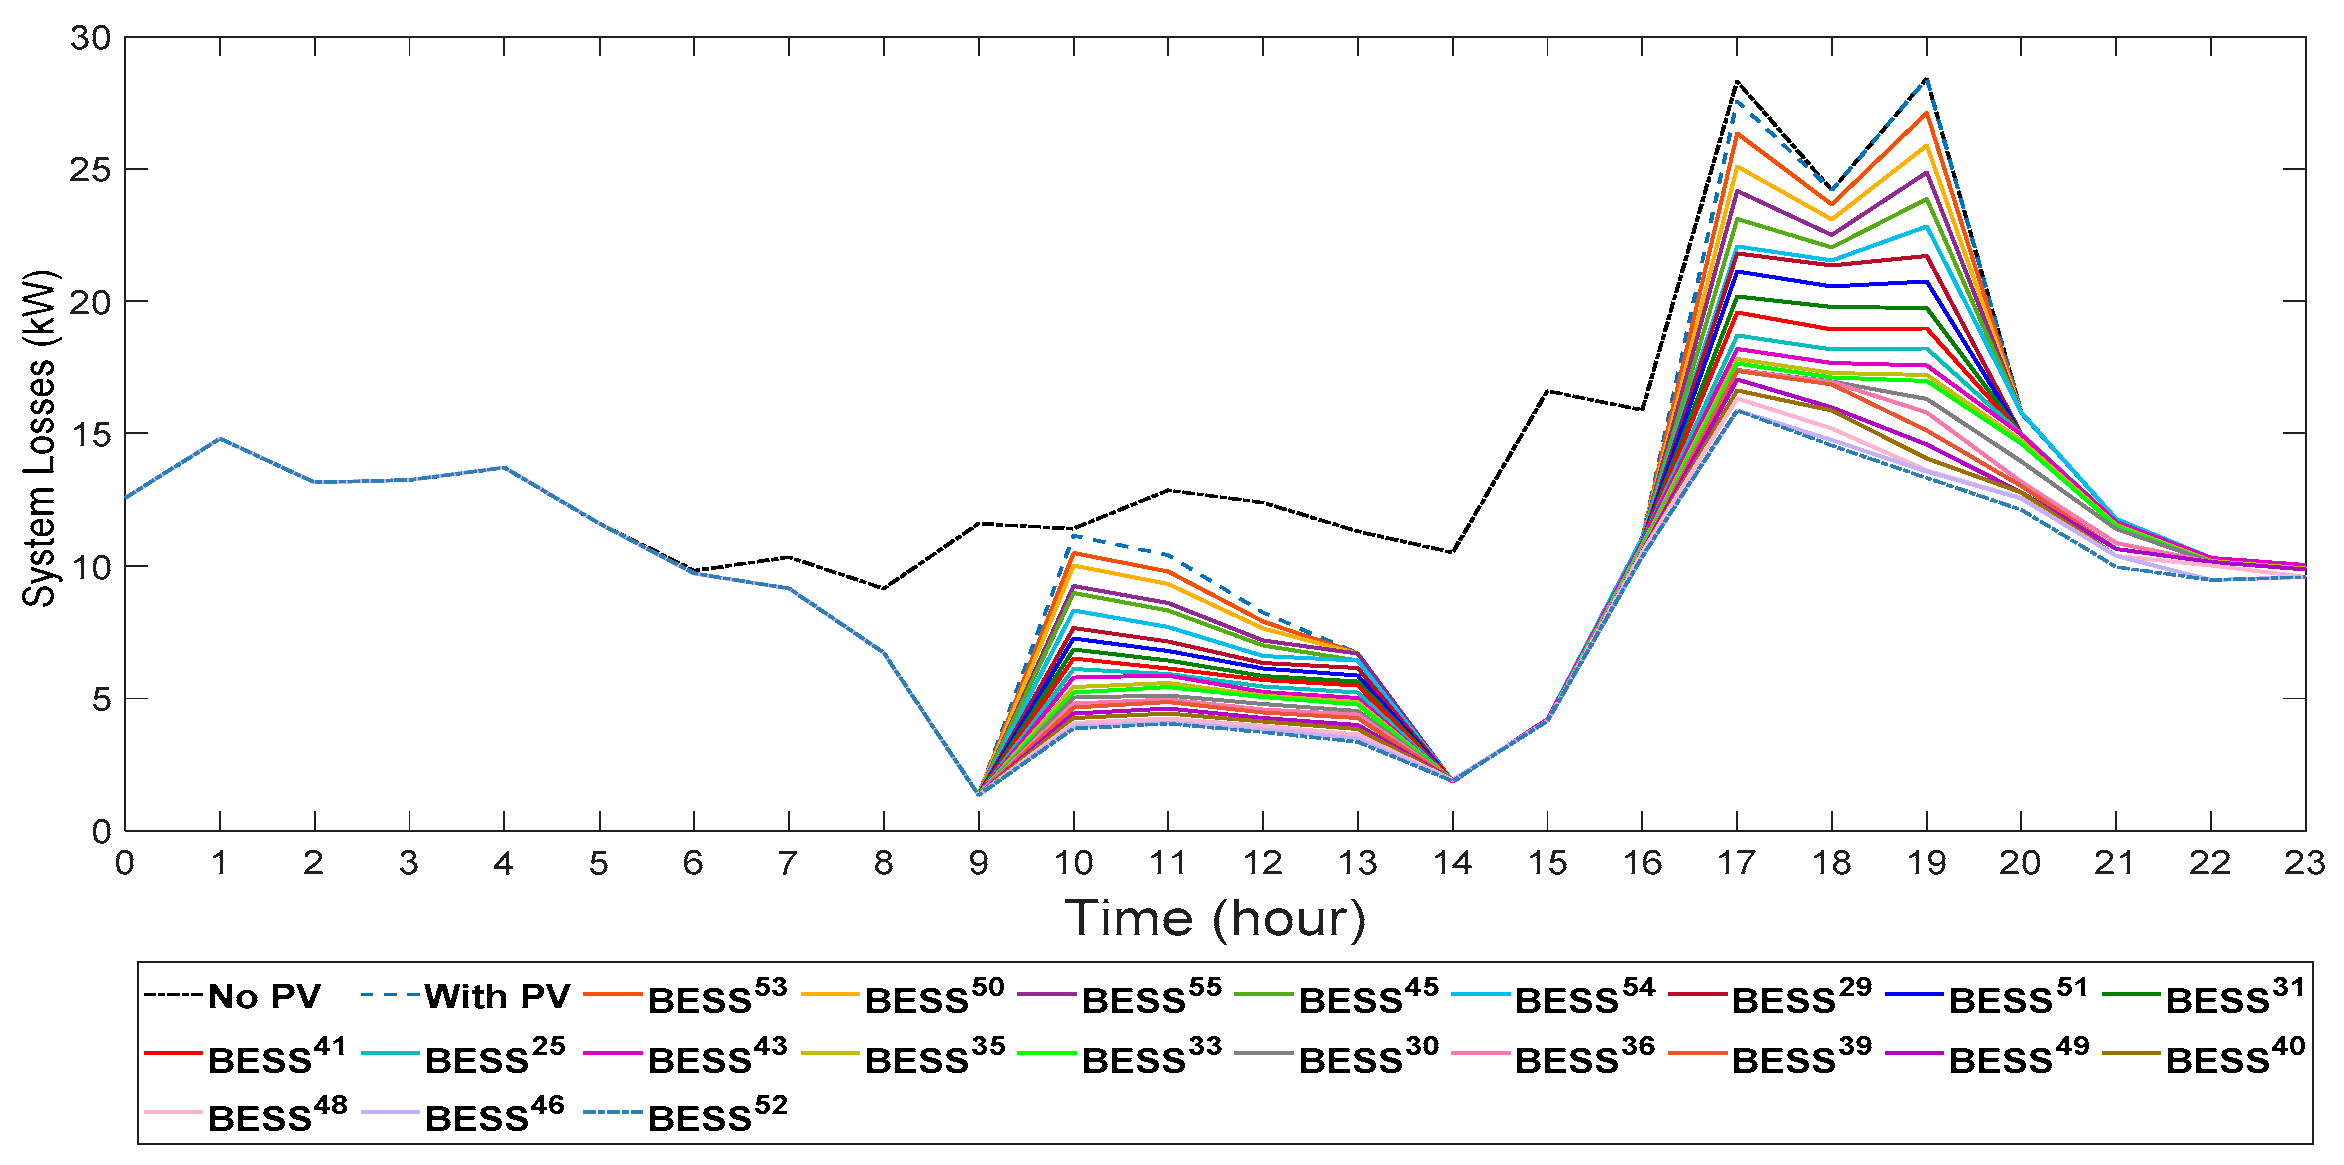
4.7. Transformer Loading and System Losses

Figure 8 shows the net transformer loading with the optimal addition of the BESS in the network. The curve with BESS 45 reflects the level of reduction in the transformer loading active power when four batteries are placed optimally in the network at four different homes, namely the homes at bus 53 ( BESS 53 ) , bus 50 ( BESS 50 ), bus 55 ( BESS 55 ), and bus 45 ( BESS 45 ). A similar analogy is reflected in the remaining curves. Therefore, the curve with BESS 52   displayed in Figure 8 depicts the transformer loading active power when 21 BESS are installed optimally in the network. From this figure, both export and import peak power are minimized considerably by increasing the number of batteries installed in the network. With the optimal planning of 21 BESS, export and import peaks are reduced by 40.14% (from 195.211 kW to 116.845 kW) and 29.76% (from 320.088 kW to 224.838 kW), respectively.
Moreover, BESS’s optimal operations improved the system losses, as illustrated in Figure 9. As the BESS number increases, the line losses decrease caused by minimizing the reverse power during high PV output and supporting the load during high load. By adding 21 BESS, the peaks of the line losses, due to the reverse power and due to the peak load, are reduced by 65.43% and 53.11%, respectively. Finally, peak shaving is also accomplished by the accumulated optimal discharge of BESS along the feeder. All installed batteries worked collectively to prevent reverse power and improve network voltage profile and peak shaving. Finally, the operation behaviors of BESS are highly impacted by the distribution system voltage magnitudes.

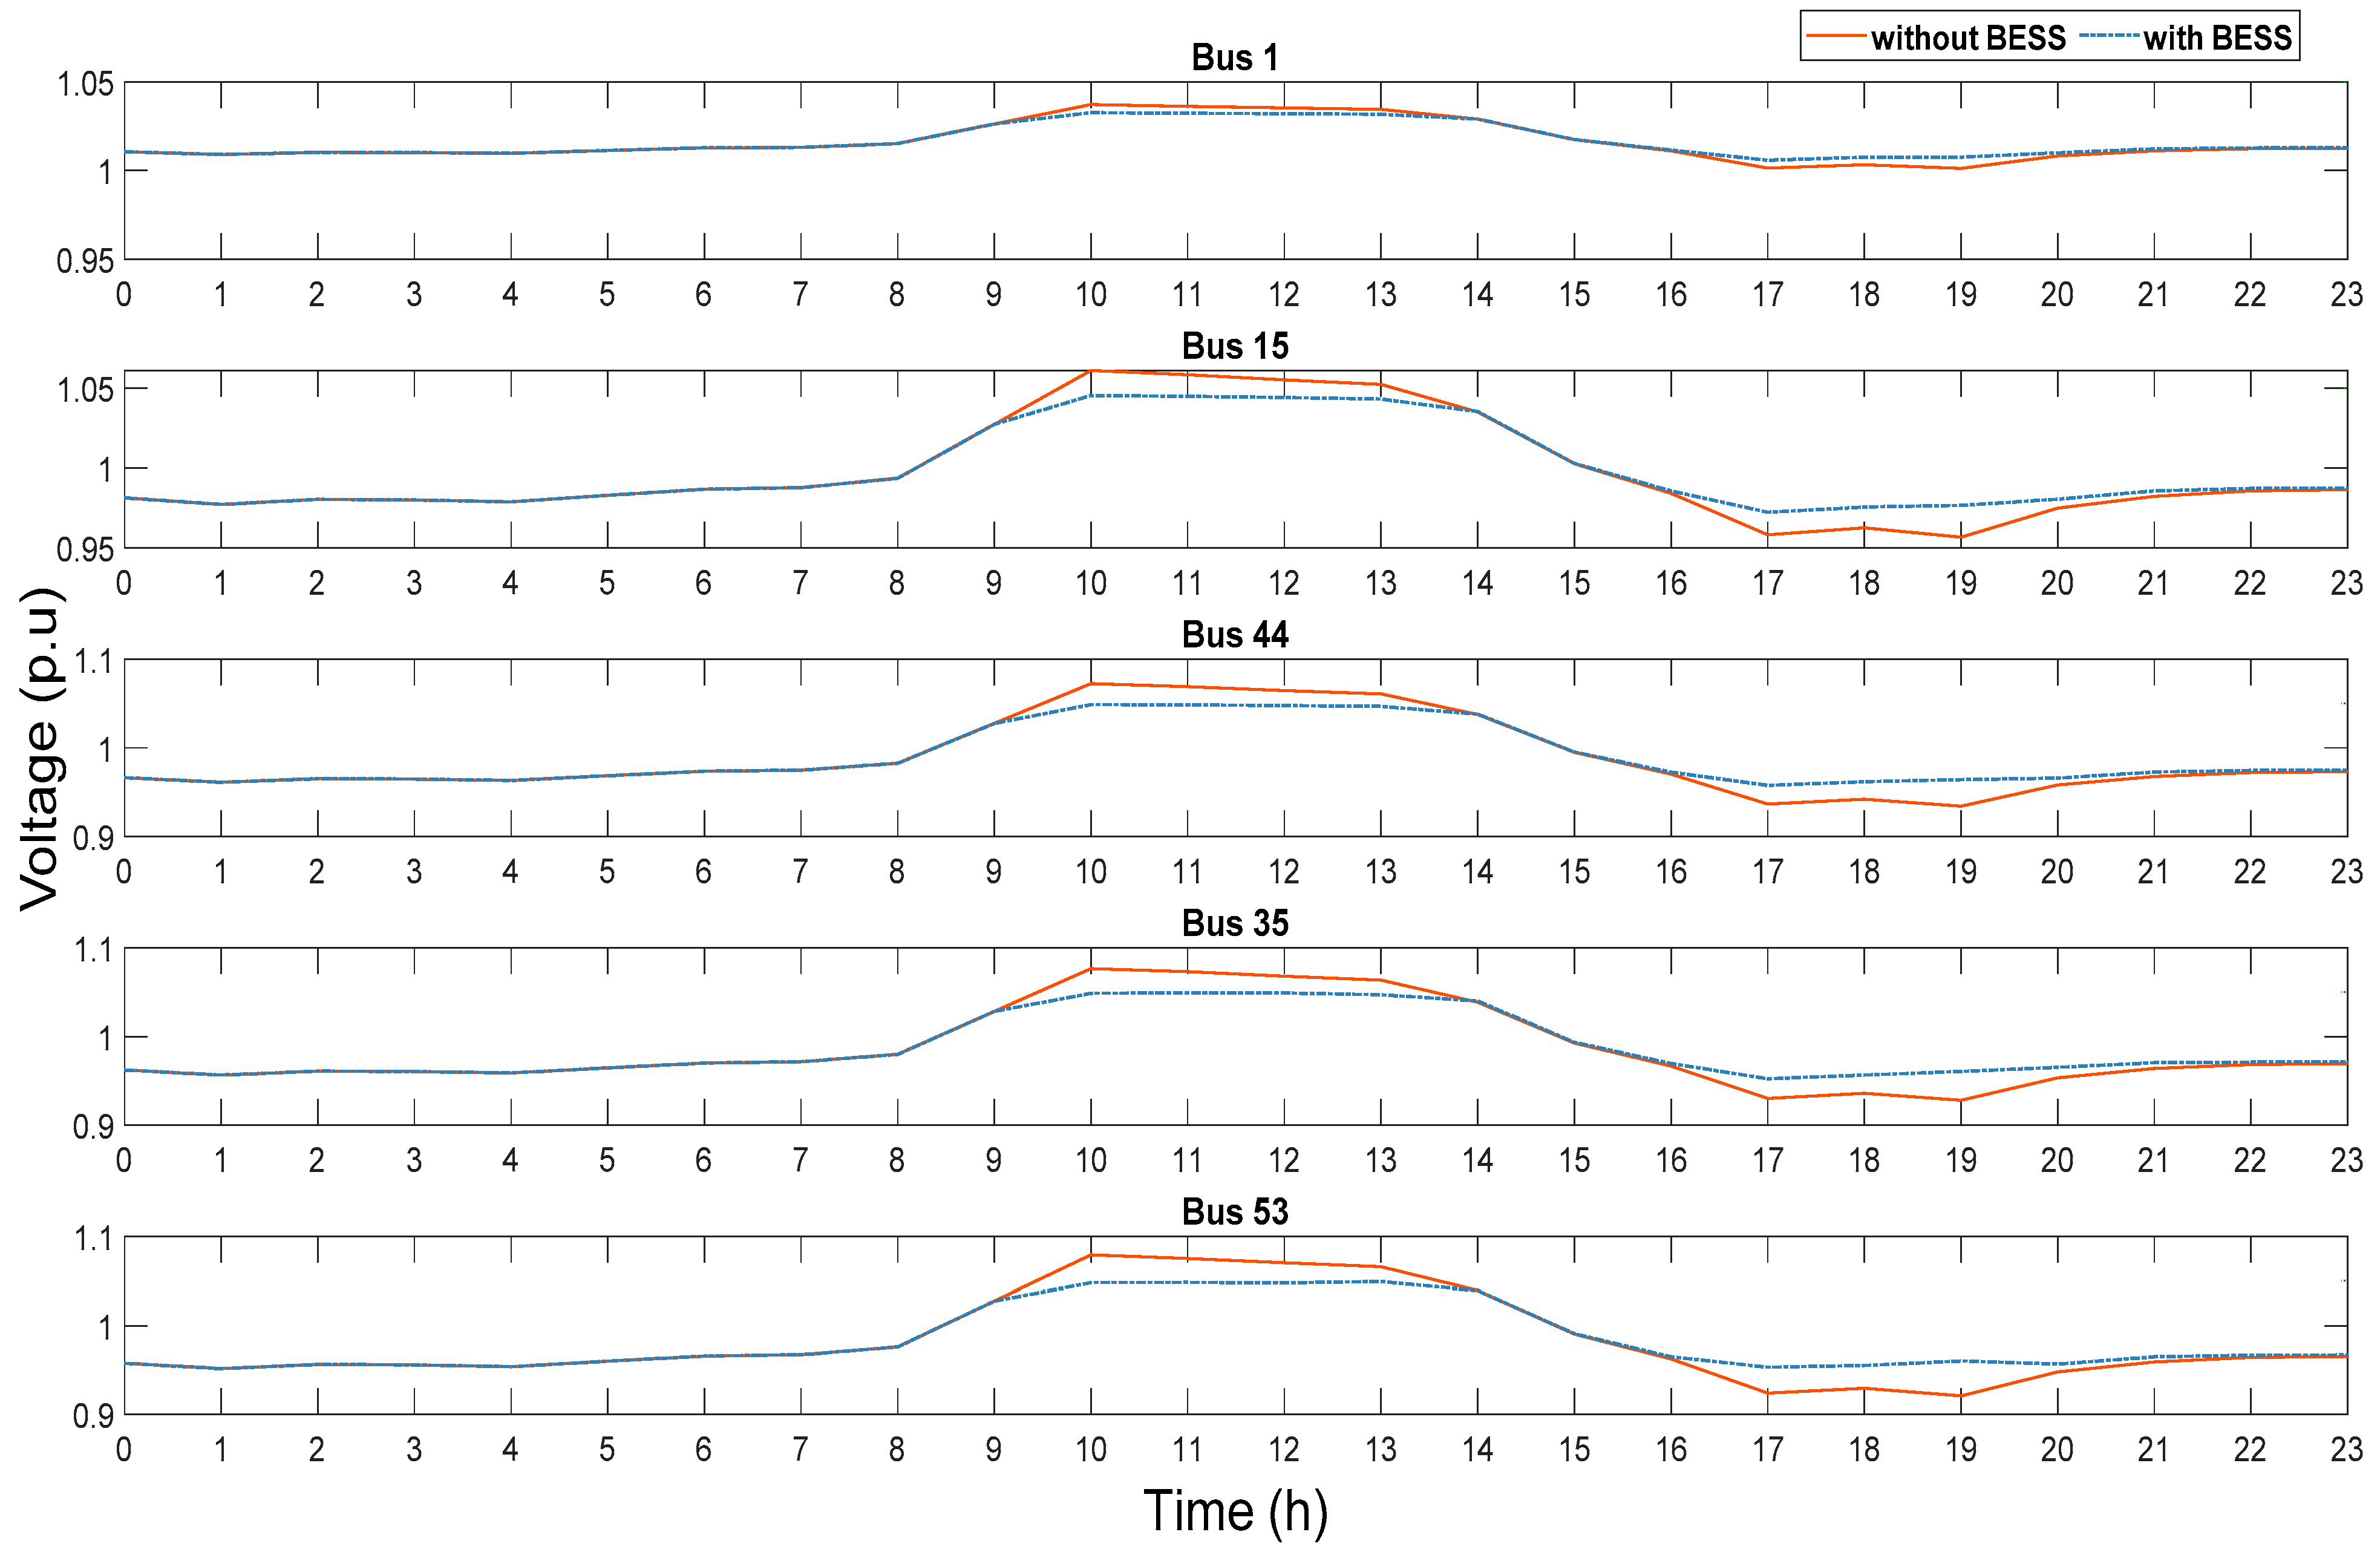
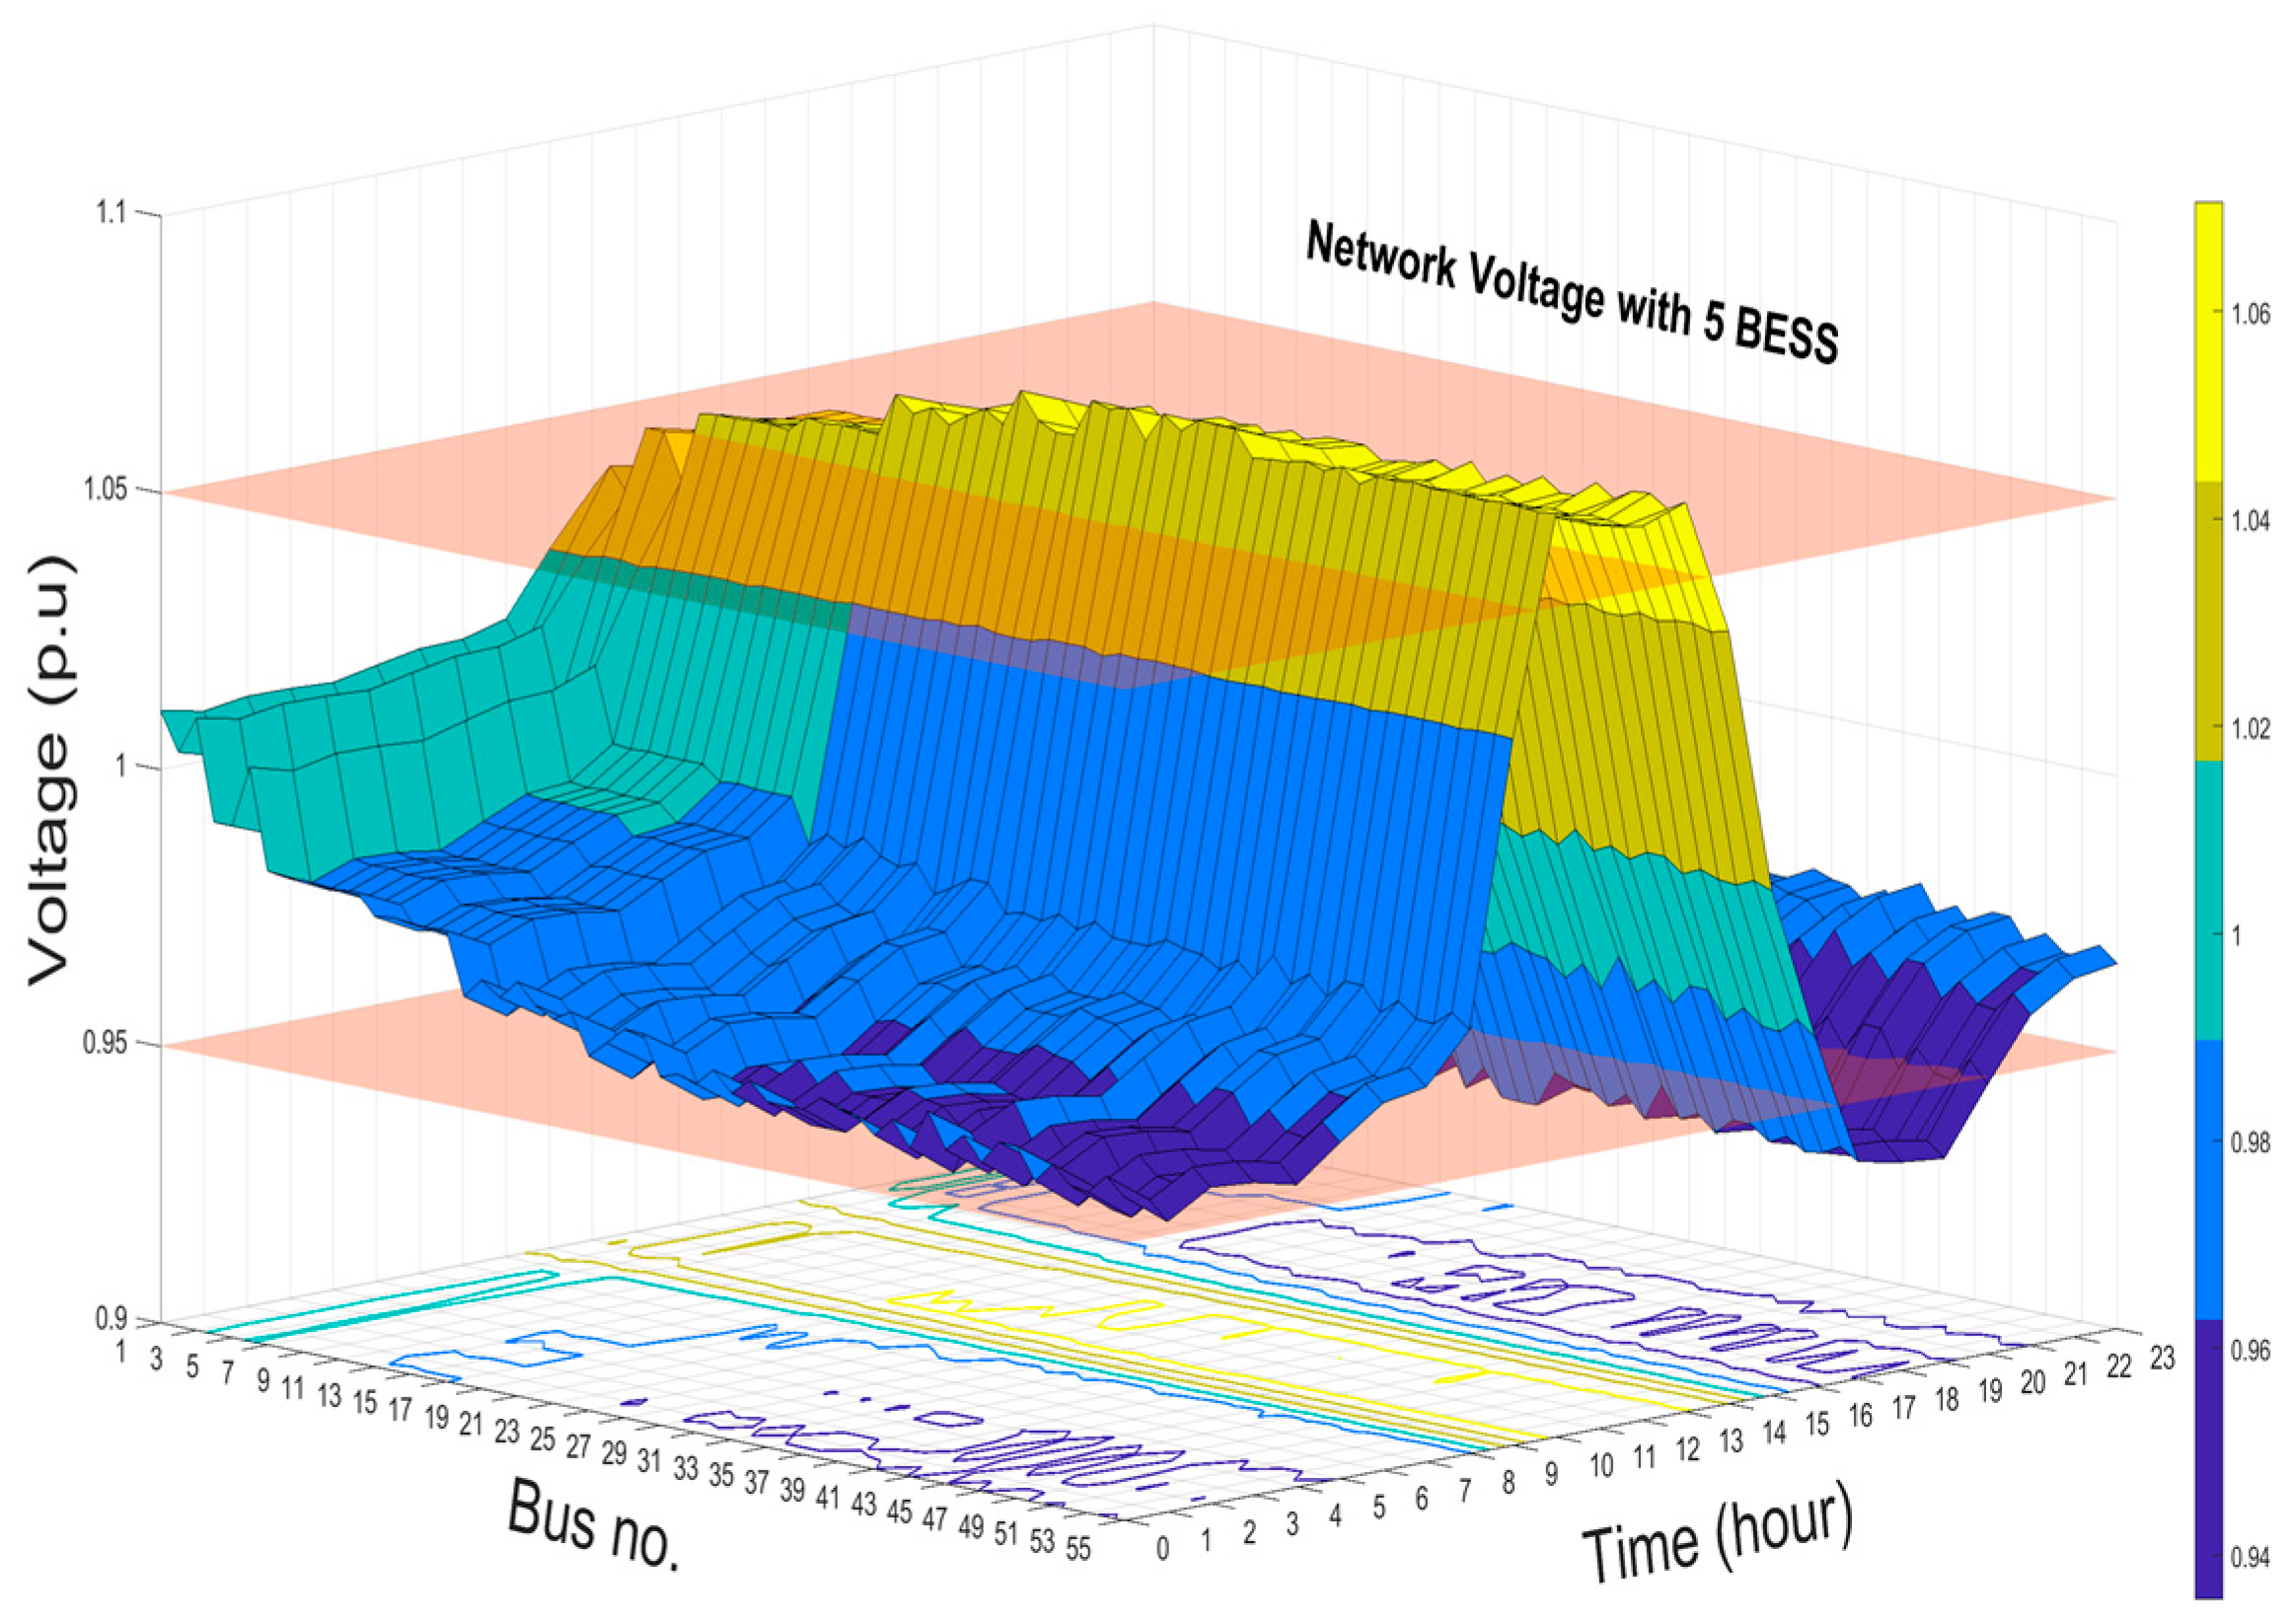
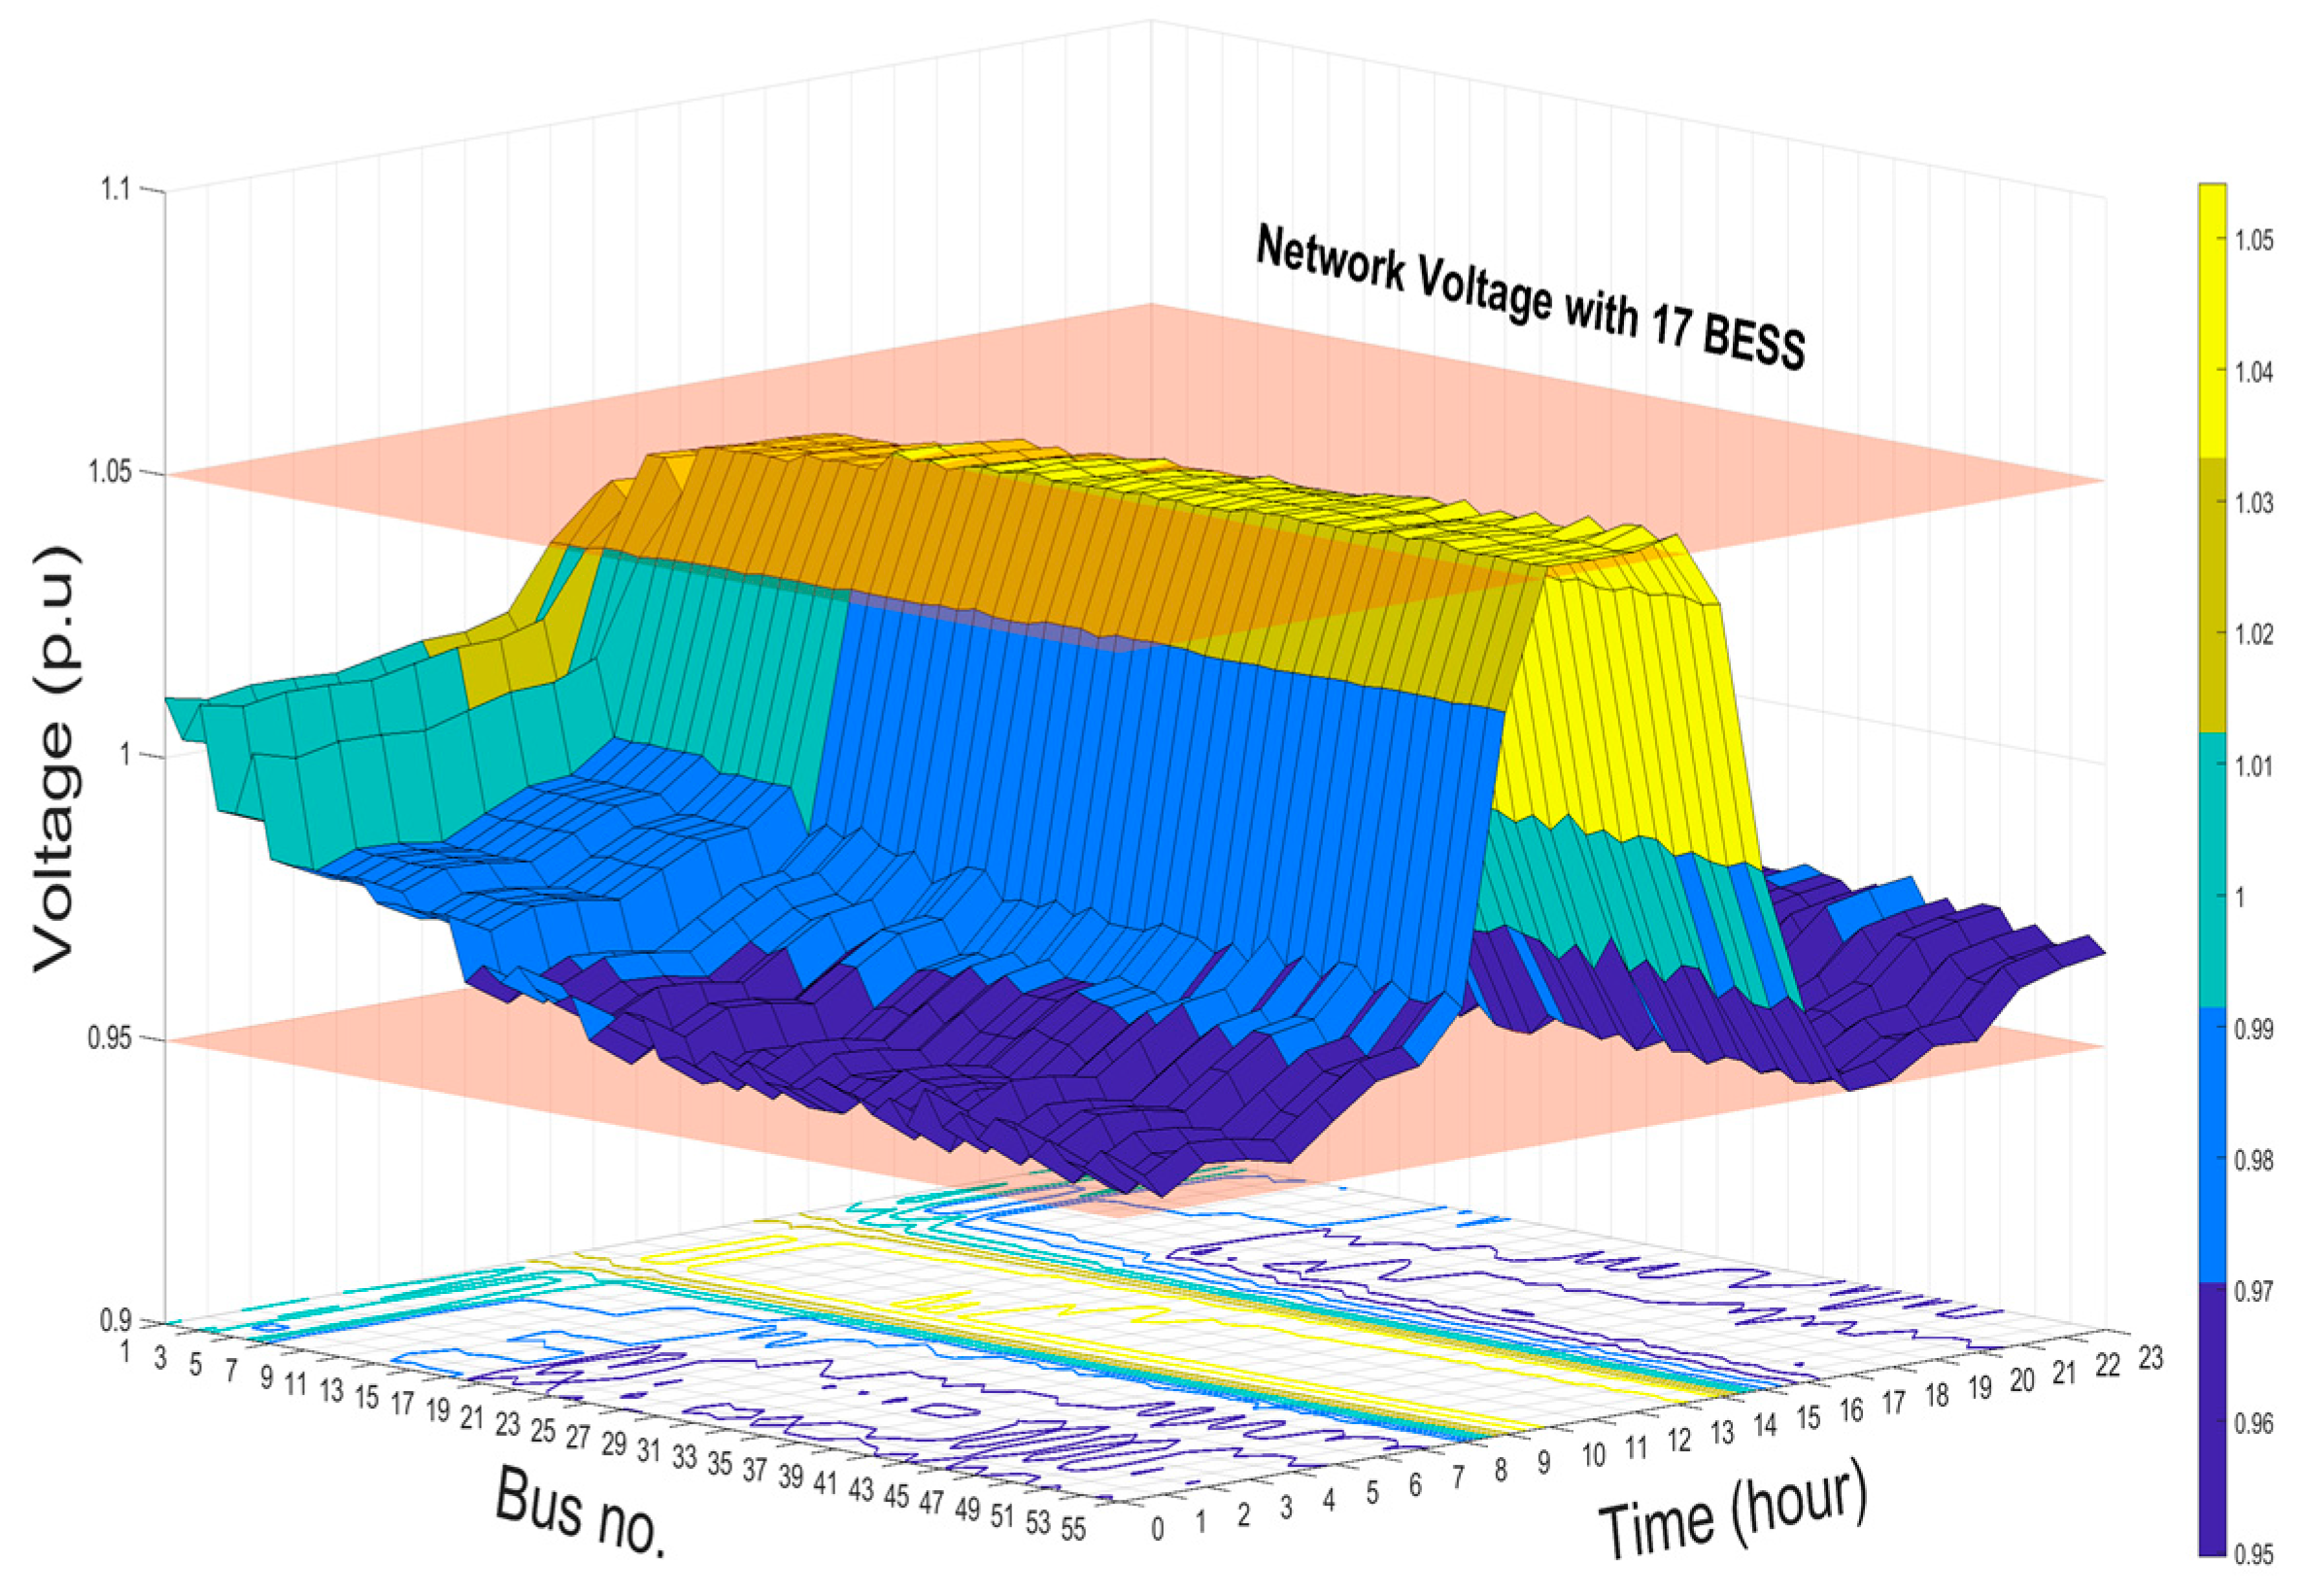
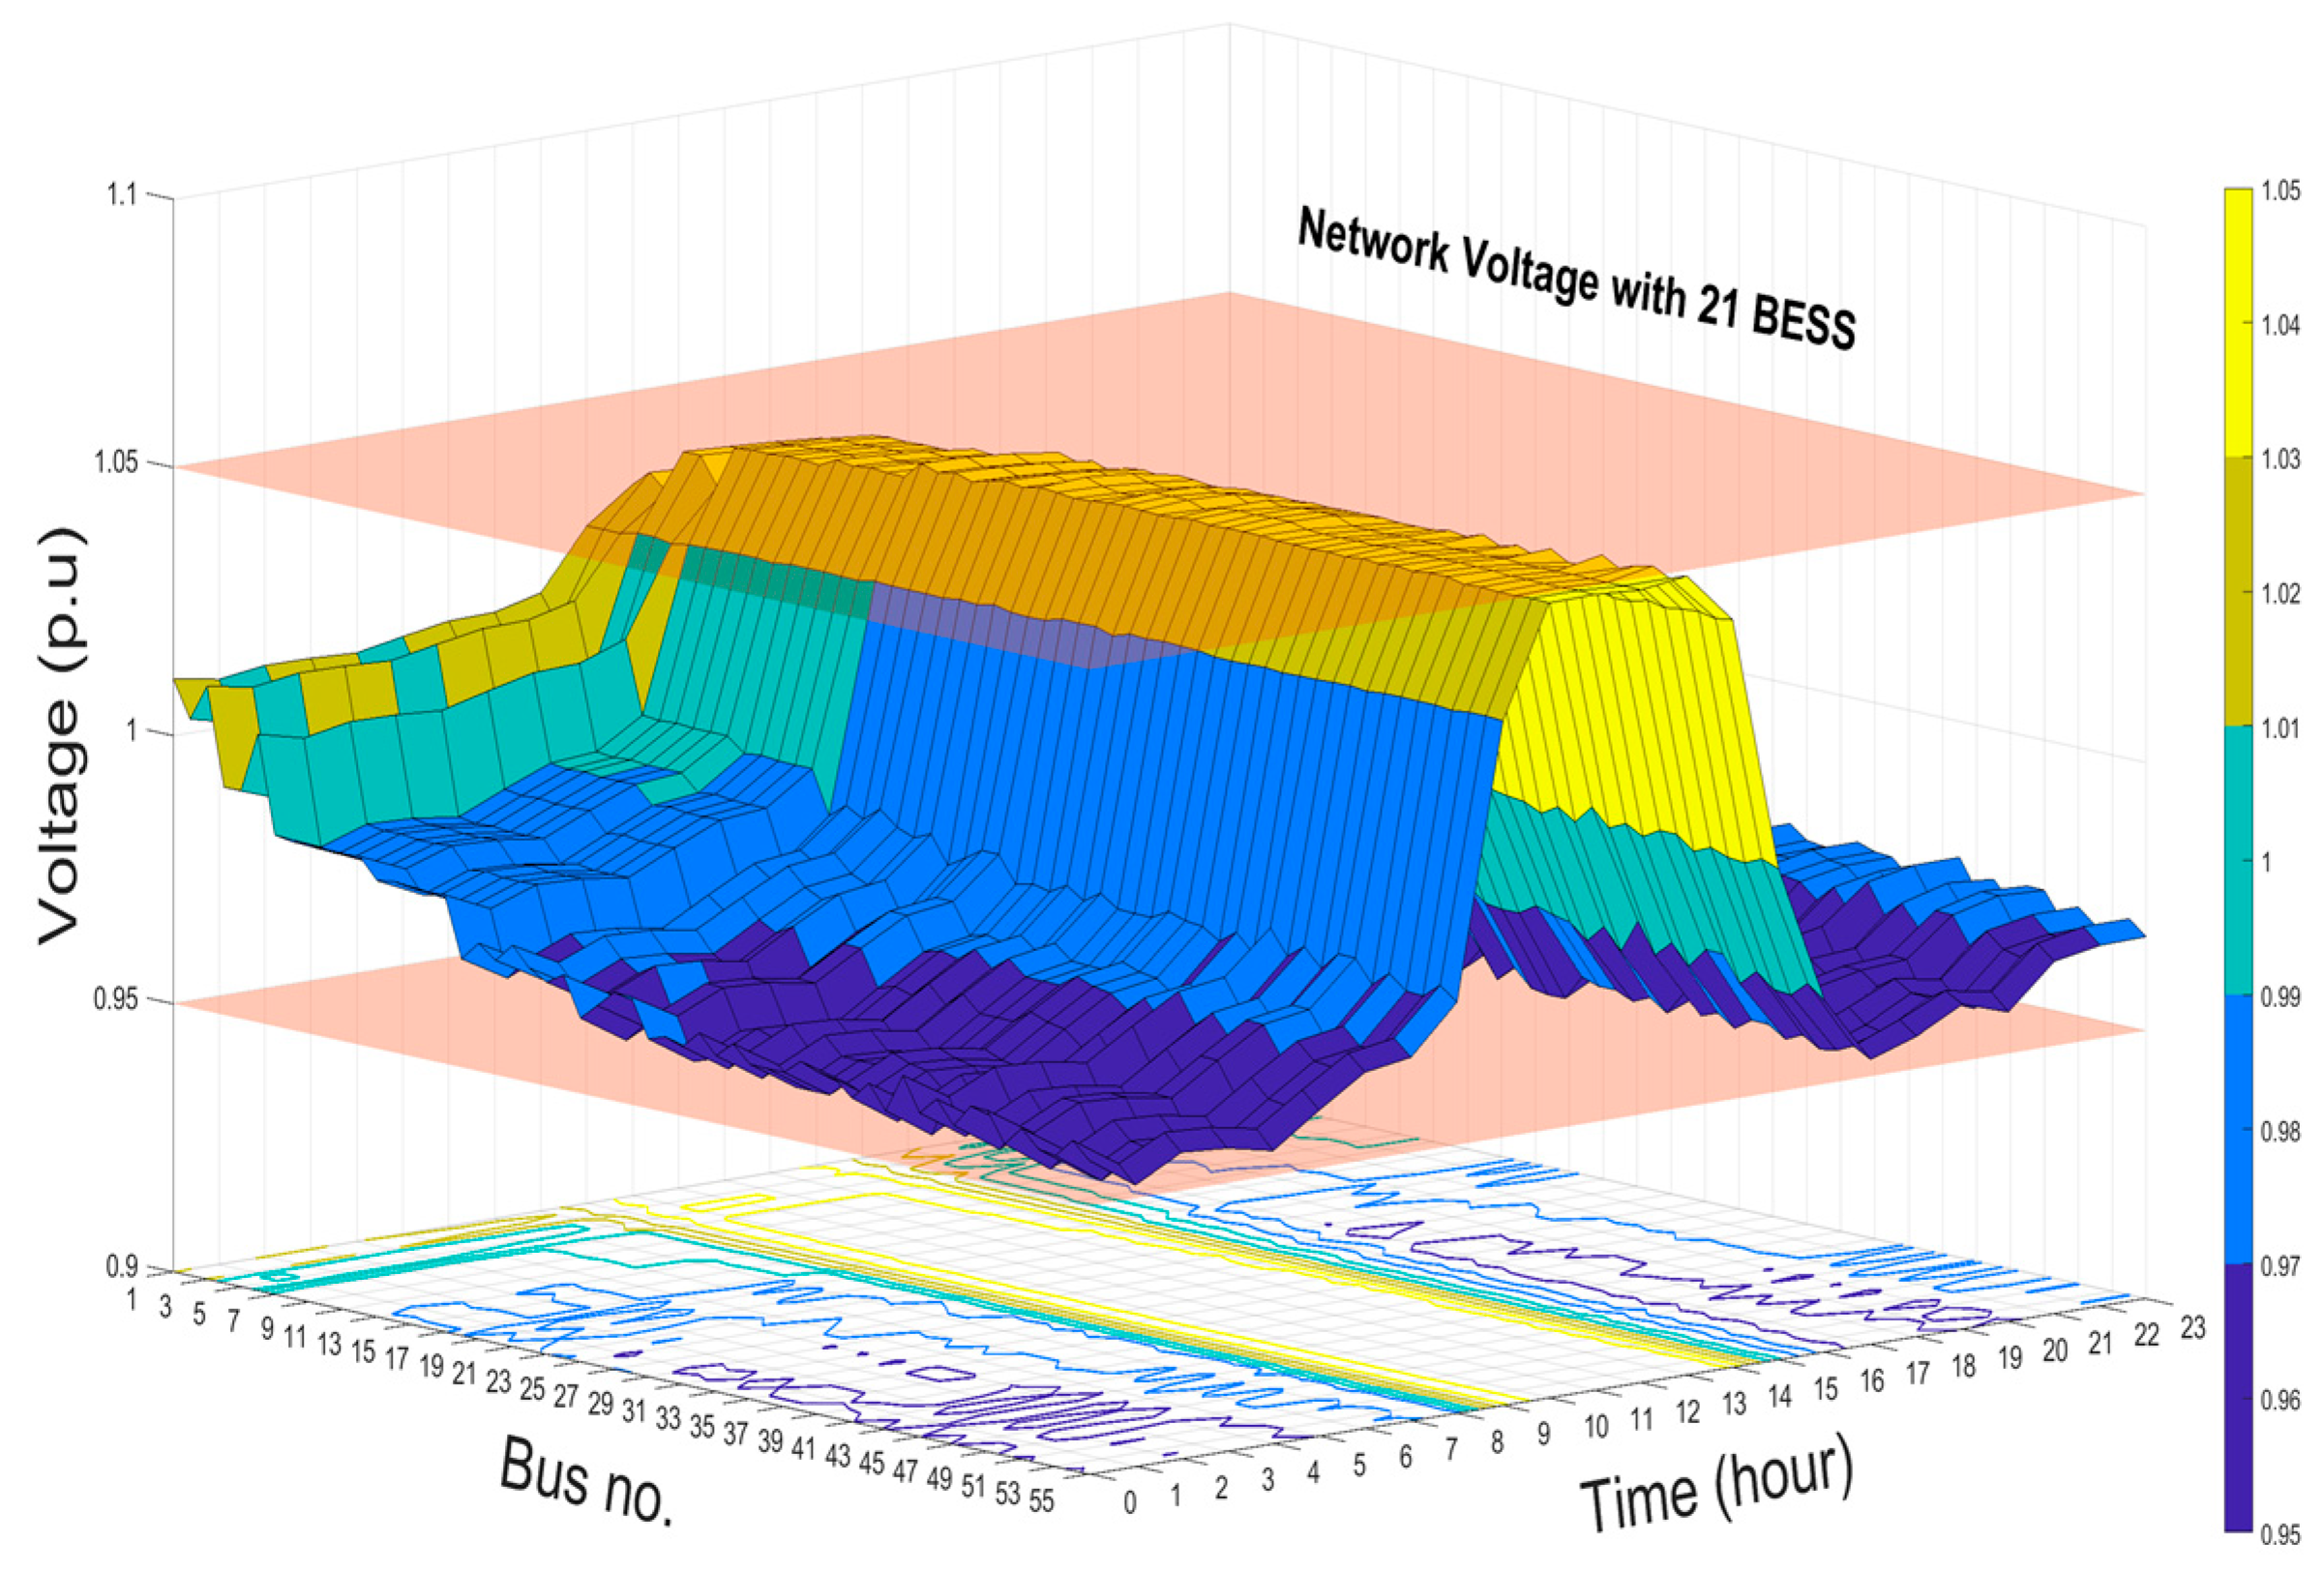
4.8. Network Voltage with BESS

Results of the voltage profiles with and without BESS at buses 1, 15, 44, 35, and 53 are shown in Figure 10. The voltage profile accepts the upper and lower network voltage when the BESS are optimally installed and operated in the network. In addition, the levels of improvements in the network voltage when 5, 17, and 21 BESS installed are shown in Figure 11, Figure 12 and Figure 13, respectively. These 3D figures depict the improvement in the voltage at all the system buses. Finally, the optimal management of the capacity and allocation of BESS in the distribution system results in the enhancement of the overall grid voltage, reduction in system losses, and peak shaving.

5. Conclusions and Future Work

This paper presents a controlling model that effectively addresses the challenge of optimal planning and dispatching protocol of the BESS while considering the voltage rise and drop in distribution networks embedded with high residential rooftop PV systems. The developed model dispatches each BESS for voltage control using a bi-level optimization strategy based on the Neural Network Optimization Algorithm. The findings of a thorough simulation demonstrate the ability of community-level BESS, managed by DSOs, to handle major distribution system issues, such as voltage management and loss reduction, for enhancing system reliability. Simulations were applied on a modified IEEE low voltage test feeder. According to the quantitative analysis, the primary findings are as follows:
  • The simulation results show that the overvoltage problems appear in the distribution network with high PV integration represented by rooftop PV units.
  • Optimal sizing, placement, and operating through utilizing the proposed voltage mitigation method helped overcome the voltage problems.
  • In terms of the locations of the BESS units, the end of the feeder homes are the ideal sites to install batteries as they encounter the worst voltage scenarios.
  • In addition, results showed that the optimal siting and sizing of the available BESS are highly impacted by network topology, load profiles, and the amount of PV power that flows into the grid.
  • The developed BESS management strategy successfully minimizes the transformer burden; thus, it never exceeds the distribution system’s capacity limit. Therefore, the optimal installation of batteries in distribution grids can assist in delaying any scheduled transformer upgrades.
  • Embracing and optimal operation of BESS in the smart grids will permit ideal resource usage and increase the PV hosting capacity in the LV grids.
Overall, the framework provided in this research work can assist in identifying the optimal number, location, and capacity that characterize BESS in different countries and justify the economic and technical viability of battery installation. The model is built and examined based on data obtained in Riyadh, Saudi Arabia. This region is selected as a case study to evaluate the efficacy of the voltage control algorithm. However, the voltage control algorithm presented in this paper can be generalized and is able to control the voltage in any desired range. In addition, the primary objective of battery deployment is to service the voltage in the distribution grid. Further analysis can be explored to enhance system performance while assuring an affordable installation with the use of BESS in distribution networks. An optimization problem with several objectives can be used to model BESS. These goals can be technical, financial, and environmental. In addition, the frequency deviation can be further investigated with the appearance of rooftop PV systems in low voltage distribution grids.

Funding

The researcher would like to thank the Deanship of Scientific Research, Qassim University, for funding the publication of this project.

Institutional Review Board Statement

Not applicable.

Informed Consent Statement

Not applicable.

Data Availability Statement

Not applicable.

Acknowledgments

The researcher would like to thank the Deanship of Scientific Research, Qassim University, for funding the publication of this project.

Conflicts of Interest

The authors declare no conflict of interest.

References

  1. REN21. Renewables 2020 Global Status Report; REN21 Secretariat: Paris, French, 2020. [Google Scholar]
  2. IEA. Global Energy Review 2020. 2020. Available online: https://www.iea.org/reports/global-energy-review-2020 (accessed on 15 January 2022).
  3. Novoa, L.; Flores, R.; Brouwer, J. Optimal Renewable Generation and Battery Storage Sizing and Siting Considering Local Transformer Limits. Appl. Energy 2019, 256, 113926. [Google Scholar] [CrossRef]
  4. Unigwe, O.; Okekunle, D.; Kiprakis, A. Smart Coordination Schemes for Multiple Battery Energy Storage Systems for Support in Distribution Networks with High Penetration of Photovoltaics. IET Smart Grid. 2019, 2, 347–354. [Google Scholar] [CrossRef]
  5. Torquato, R.; Salles, D.; Pereira, C.O.; Meira, P.C.M.; Freitas, W. A Comprehensive Assessment of PV Hosting Capacity on Low-Voltage Distribution Systems. IEEE Trans. Power Deliv. 2018, 33, 1002–1012. [Google Scholar] [CrossRef]
  6. Long, Y.; Kirschen, D.S. Bi-Level Volt/VAR Optimization in Distribution Networks with Smart PV Inverters. IEEE Trans. Power Syst. 2022, 37, 3604–3613. [Google Scholar] [CrossRef]
  7. Babacan, O.; Torre, W.; Kleissl, J. Siting and Sizing of Distributed Energy Storage to Mitigate Voltage Impact by Solar PV in Distribution Systems. Sol. Energy 2017, 146, 199–208. [Google Scholar] [CrossRef]
  8. Baran, M.E.; Hooshyar, H.; Shen, Z.; Huang, A. Accommodating High PV Penetration on Distribution Feeders. IEEE Trans. Smart Grid 2012, 3, 1039–1046. [Google Scholar] [CrossRef]
  9. Das, C.K.; Bass, O.; Kothapalli, G.; Mahmoud, T.S.; Habibi, D. Overview of Energy Storage Systems in Distribution Networks: Placement, Sizing, Operation, and Power Quality. Renew. Sustain. Energy Rev. 2018, 91, 1205–1230. [Google Scholar] [CrossRef]
  10. Conde, A.; Perez, G.; Gutierrez-Alcaraz, G.; Leonowicz, Z. Frequency Improvement in Microgrids through Battery Management System Control Supported by a Remedial Action Scheme. IEEE Access 2022, 10, 8081–8091. [Google Scholar] [CrossRef]
  11. Li, X.; Ma, R.; Gan, W.; Yan, S. Optimal Dispatch for Battery Energy Storage Station in Distribution Network Considering Voltage Distribution Improvement and Peak Load Shifting. J. Mod. Power Syst. Clean Energy 2022, 10, 131–139. [Google Scholar] [CrossRef]
  12. Sant’Ana, W.C.; Mollica, D.; Lambert-Torres, G.; Guimaraes, B.P.B.; Pinheiro, G.G.; Bonaldi, E.L.; Pereira, R.R.; Borges-Da-Silva, L.E.; Gonzatti, R.B.; Santana-Filho, J. 13.8 KV Operation of a Peak-Shaving Energy Storage Equipment with Voltage Harmonics Compensation Feature. IEEE Access 2020, 8, 182117–182132. [Google Scholar] [CrossRef]
  13. Spiliotis, K.; Claeys, S.; Gutierrez, A.R.; Driesen, J. Utilizing Local Energy Storage for Congestion Management and Investment Deferral in Distribution Networks. In Proceedings of the 2016 13th International Conference on the European Energy Market (EEM), Porto, Portugal, 6–9 June 2016; pp. 1–5. [Google Scholar] [CrossRef]
  14. Yan, X.; Zhang, X.; Chen, H.; Xu, Y.; Tan, C. Techno-Economic and Social Analysis of Energy Storage for Commercial Buildings. Energy Convers. Manag. 2014, 78, 125–136. [Google Scholar] [CrossRef]
  15. IRENA. Future of Solar Photovoltaic: Deployment, Investment, Technology, Grid Integration and Socio-Economic Aspects (A Global Energy Transformation: Paper). Int. Renew. Energy Agency Abu. Dhabi. 2019, 1–88. [Google Scholar]
  16. Jayasekara, N.; Masoum, M.A.S.; Wolfs, P.J. Optimal Operation of Distributed Energy Storage Systems to Improve Distribution Network Load and Generation Hosting Capability. IEEE Trans. Sustain. Energy 2016, 7, 250–261. [Google Scholar] [CrossRef]
  17. Mehrjerdi, H. Simultaneous Load Leveling and Voltage Profile Improvement in Distribution Networks by Optimal Battery Storage Planning. Energy 2019, 181, 916–926. [Google Scholar] [CrossRef]
  18. Lakshmi, S.; Ganguly, S. Multi-Objective Planning for the Allocation of PV-BESS Integrated Open UPQC for Peak Load Shaving of Radial Distribution Networks. J. Energy Storage 2019, 22, 208–218. [Google Scholar] [CrossRef]
  19. Barzkar, A.; Hosseini, S.M.H. A Novel Peak Load Shaving Algorithm via Real-time Battery Scheduling for Residential Distributed Energy Storage Systems. Int. J. Energy Res. 2018, 42, 2400–2416. [Google Scholar] [CrossRef]
  20. Alam, M.J.E.; Muttaqi, K.M.; Sutanto, D. Distributed Energy Storage for Mitigation of Voltage-Rise Impact Caused by Rooftop Solar PV. In Proceedings of the 2012 IEEE Power and Energy Society General Meeting, San Diego, CA, USA, 22–26 July 2012; pp. 1–8. [Google Scholar] [CrossRef]
  21. Jayasekara, N.; Wolfs, P.; Masoum, M.A.S. An Optimal Management Strategy for Distributed Storages in Distribution Networks with High Penetrations of PV. Electr. Power Syst. Res. 2014, 116, 147–157. [Google Scholar] [CrossRef]
  22. Babacan, O.; Torre, W.; Kleissl, J. Optimal Allocation of Battery Energy Storage Systems in Distribution Networks Considering High PV Penetration. In Proceedings of the 2016 IEEE Power and Energy Society General Meeting, Boston, MA, USA, 17–21 July 2016; pp. 1–5. [Google Scholar] [CrossRef]
  23. Sardi, J.; Mithulananthan, N.; Gallagher, M.; Hung, D.Q. Multiple Community Energy Storage Planning in Distribution Networks Using a Cost-Benefit Analysis. Appl. Energy 2017, 190, 453–463. [Google Scholar] [CrossRef]
  24. Kabir, M.N.; Mishra, Y.; Ledwich, G.; Member, S.; Dong, Z.Y.; Wong, K.P. Coordinated Control of Grid-Connected Photovoltaic Reactive Power and Battery Energy Storage Systems to Improve the Voltage Profile of a Residential Distribution Feeder. IEEE Trans. Ind. Inform. 2014, 10, 967–977. [Google Scholar] [CrossRef]
  25. Chedid, R.; Sawwas, A. Optimal Placement and Sizing of Photovoltaics and Battery Storage in Distribution Networks. Energy Storage 2019, 1, e46. [Google Scholar] [CrossRef]
  26. Naupari, D.Z.; Molina, Y.P.; Coronel, A. Optimal Sizing of Photovoltaic Systems in Distribution Networks Using Particle Swarm Optimization. In Proceedings of the 2018 IEEE PES Transmission and Distribution Conference and Exhibition—Latin America, T and D-LA 2018, Lima, Peru, 18–21 September 2018; pp. 1–5. [Google Scholar] [CrossRef]
  27. Lin, W.C.; Huang, W.T.; Chih, H.C.; Yao, K.C.; Li, Z.T.; Ma, C.C. Comparisons of Energy Loss Reduction by Phase Balancing in Unbalance Distribution Networks via Metaheuristic Algorithms. In Proceedings of the 2020 International Conference on Pervasive Artificial Intelligence (ICPAI), Taipei, Taiwan, 3–5 December 2020; pp. 229–233. [Google Scholar] [CrossRef]
  28. Azam Muhammad, M.; Mokhlis, H.; Naidu, K.; Amin, A.; Fredy Franco, J.; Othman, M. Distribution Network Planning Enhancement via Network Reconfiguration and DG Integration Using Dataset Approach and Water Cycle Algorithm. J. Mod. Power Syst. Clean Energy 2020, 8, 86–93. [Google Scholar] [CrossRef]
  29. Helmi, A.M.; Carli, R.; Dotoli, M.; Ramadan, H.S. Efficient and Sustainable Reconfiguration of Distribution Networks via Metaheuristic Optimization. IEEE Trans. Autom. Sci. Eng. 2022, 19, 82–98. [Google Scholar] [CrossRef]
  30. Sadollah, A.; Sayyaadi, H.; Yadav, A. A Dynamic Metaheuristic Optimization Model Inspired by Biological Nervous Systems: Neural Network Algorithm. Appl. Soft Comput. 2018, 71, 747–782. [Google Scholar] [CrossRef]
  31. Electric Power Research Institute. OpenDSS, Distribution System Simulator. Available online: https://sourceforge.net/projects/electricdss/ (accessed on 21 October 2020).
  32. Guinness Global Investors. The Guinness Sustainable Energy Report; Guinness Global Investors: London, UK, 2022. [Google Scholar]
  33. Chicco, G.; Mazza, A. Metaheuristic Optimization of Power and Energy Systems: Underlying Principles and Main Issues of the “Rush to Heuristics”. Energies 2020, 13, 5097. [Google Scholar] [CrossRef]
  34. Cuevas, E.; Espejo, E.B.; Enríquez, A.C. Metaheuristics Algorithms in Power Systems; Springer International Publishing/Springer Nature: Cham, Switzerland, 2019. [Google Scholar] [CrossRef]
Figure 1. The framework of the voltage management strategy.
Applsci 12 09083 g001
Figure 2. System configuration of home-connected PV and BESS.
Applsci 12 09083 g002
Figure 3. The modified IEEE low voltage test feeder.
Applsci 12 09083 g003
Figure 4. Daily load and PV power output profiles (31 January 2018).
Applsci 12 09083 g004
Figure 5. Overvoltage problem with PV systems at the peak PV production at 11 a.m.
Applsci 12 09083 g005
Figure 6. Network daily voltage profile with and without PV system at different load buses.
Applsci 12 09083 g006
Figure 7. Stored energy, supplied energy, and SOC for each BESS when coordinated for over/undervoltage enhancement.
Applsci 12 09083 g007
Figure 8. Transformer loading with different numbers of BESS.
Applsci 12 09083 g008
Figure 9. System losses with different numbers of BESS.
Applsci 12 09083 g009
Figure 10. Network daily voltage profile with and without BESS at different load buses.
Applsci 12 09083 g010
Figure 11. Network voltage profile with 5 BESS installed.
Applsci 12 09083 g011
Figure 12. Network voltage profile with 17 BESS installed.
Applsci 12 09083 g012
Figure 13. Network voltage profile with 21 BESS installed.
Applsci 12 09083 g013
Table 1. The specification of the battery energy storage system.
SpecificationParameterValue
AC voltage A C 120/240 V
Usable energy M m a x 13.5 kWh
Maximum charging/discharging power S m a x 5 kW
Minimum charging/discharging power S m i n 0 kW
Maximum state of charge S O C m a x 100%
Minimum state of charge S O C m i n 10%
Round trip efficiency η 90%
Table 2. The ranks, capacities, and locations of the BESS in the network.
Rank S m a x   k w M m a x   k W h Location (Bus)
1513.553
2513.550
3513.555
4513.545
5513.554
6513.529
7513.551
8513.531
9513.541
10513.525
11513.543
12513.535
13513.533
14513.530
15513.536
16513.539
17513.549
18513.540
19513.548
20513.546
21511.652
Publisher’s Note: MDPI stays neutral with regard to jurisdictional claims in published maps and institutional affiliations.

