Article

Unsaturated Hydraulic Conductivity in Composite Porous Media

by
Jhan Piero Rojas
1,
Juan Carlos Ruge
2,* and
Gustavo Adolfo Carrillo
1
1
Facultad de Ingeniería, Universidad Francisco de Paula Santander, Cúcuta 540003, Colombia
2
Programa de Ingeniería Civil, Facultad de Ingeniería, Universidad Militar Nueva Granada, Bogotá 111071, Colombia
*
Author to whom correspondence should be addressed.
Appl. Sci. 2022, 12(18), 9058; https://doi.org/10.3390/app12189058
Submission received: 15 June 2022 / Revised: 19 August 2022 / Accepted: 2 September 2022 / Published: 9 September 2022
(This article belongs to the Special Issue Road Materials and Sustainable Pavement Design)

Abstract

:
Determining the constitutive properties that describe the incipient hydraulic behavior of the materials, including the matrix domains and the distribution of macro and micropores, is crucial to analyzing the preferential water flow in saturated soils, ks, and unsaturated, ku. This study focused on determining the hydraulic conductivity in porous media under total and partial saturation conditions. The infiltration characteristics of three reconstituted soils were evaluated using five suction ranges employing conventional permeameters, an automated dual system, and mini-disk infiltrometers. The experimental cycles were carried out in granular soils with mixtures of diatomaceous soils, iron oxide (Fe2O3), and calcium carbonate (CaCO3) in 5–40% proportions. The differences between the granular microstructures of each material and the different hydraulic interaction mechanisms (suctione levels) significantly affected the values of ks and ku and the coupling between the pore domains and the defined water regime. Additionally, a lower impact was observed in the data set exposed to higher percentages of Fe2O3 and CaCO3 in different suction ranges, mainly due to a tension effect (meniscus) generated by suction in the granular skeleton. Since both parameters are mutually correlated and have a similar impact between methods and soil cores, ks and ku must be optimized simultaneously in each mechanism analyzed. The main findings of this work result in the confirmation that the unsaturated permeability decreases as suction is imposed on the sample. As well as the addition of different materials with Particle Size Distribution finer than the base sample, it also reveals a reduction in hydraulic conductivity, both saturated and unsaturated.

1. Introduction

Analyzing the water retention behavior coupled to the unsaturated hydraulic conductivity mechanism is essential to establish complete flow models and the derived effects in the deformability processes for unsaturated soils. The water retention curve (WRC) and the hydraulic conductivity, saturated, ks, and unsaturated, ku, are essential parametric functions used to generate practical numerical models of water’s movement and the transport of pollutants in soils. In order to establish various theoretical frameworks and numerical adaptations of variably saturated and unsaturated water flow, it is necessary to adequately define these hydraulic functions of the soil [1]. Since the physical spectrum of the soil responds to the interaction mechanism between the volumetric water content (θ) and the main hydraulic parameters [2], most mathematical models describe θ in terms of effective saturation, ψe. This parameter is traditionally defined as a scaled value between the water content in the saturation intervals and small fractions of the residual water content at the WRC dry limit [3,4,5]. Generally, it is incorrect to assume that unsaturated hydraulic conductivity, ku, is a soil property. In partially saturated soils, ku is significantly affected by the degree of saturation and varies as a function of the matric suction value at any time t. During the transition of soils to unsaturated states, the air partially replaces the macropores and micropores, where the flow paths reach high levels of tortuosity. Conservative increases in the matric suction of the soil produce decreases in the volume of pores occupied by the water, increasing the shear resistance to the flow of the soil particles near the air–water interface and numerically reducing hydraulic conductivity [6].
Several empirical approximation methods can quantify porous media’s flow and transport properties. However, although the approaches associated with the hydraulic properties of the soil are numerous, the choice of adjusted data for specific studies requires a considerable injection of time, labor, and resources. Therefore, in the last decades, many devices have been developed to measure the coefficient of permeability, saturated ks, and unsaturated ku in the soil. The constant and variable head methods are widely used to measure ks in different types of soils (Figure 1a,b). These models are, in particular, international standards and are universally approved [7,8]. The flow rate flowing through soil beds is measured during both tests, either under constant or variable inlet heads. The variable system is often implemented on in situ tests adopted as outlet flow meters. However, the influence of the flow regime during the tests and the anisotropy of the soils produces qualitative results and little absolute ks. Additionally, numerous studies use variable hydraulic pressure mechanisms exclusively for materials with intrinsic permeabilities below 10−10 m2 [9,10,11].
Although permeameters are usually classified into two types, there is a broad typological scheme within these classifications. For the choice of the permeameter, it is vital to consider the anisotropy of the porous matrix and the division performance for the vertical (kv) and horizontal (kh) hydraulic conductivity. Currently, most of the predictive methods used to determine ks require constitutive parameters of simple measurements, such as the pore size distribution curve (PaSD) and the particle size distribution curve (PSD). Although in theory, it is necessary to obtain detailed maps of how the continuous vacuum of soils is distributed and interconnected [3,12,13,14,15,16,17,18]. On the other hand, experimental approaches to define ku must be evaluated using the complete chain of measured or estimated water retention curves (WRC) [4,19,20,21,22,23,24,25]. The dual ks and ku control device with computerized data acquisition system KSAT Meter © (Figure 1c) allows to record sets of readings of the tests of constant and variable hydraulic head in an integral way, covering ranges of conductivities measurement saturated and unsaturated hydraulic systems from 5000 to 0.01 cm/d. Although the automated permeameter is based on Darcy’s law (1856) for flow in porous media, it does not directly disrupt the data manufacturing process. Numerous investigations, including this study, used this mechanism to construct the matrix of ks results in soils on a laboratory scale [26,27,28,29,30,31].
There are several procedures to determine the hydraulic properties of unsaturated soils. Many of these approaches are based on stationary flow approximations by the Wooding equation [31], with multiple disk applications [32] or hydraulic pressure management multiple [33]. However, it is also possible to use transient flow analysis to estimate ku in absolute ranges [34,35,36]. The mini-disk infiltrometer (MDI) (Figure 2) has been widely used in the experimental field to determine the unsaturated hydraulic conductivity, ku, of sediments and soils [37,38]. Macropore flow is avoided in the case of MDI due to the negative potential (Mariotte barrier) applied during infiltration measurements, compared with other methodologies such as the Warrick method [39] and the Haverkamp method [40].
When looking back at the practical relevance of geotechnical problems, in most of them, it is clear that the flow occurs through an unsaturated porous medium. Even at present, geotechnical structures continue to be designed and modeled numerically with parameters based on saturated characteristics in terms of permeability. Therefore, realistic parameters to obtain the unsaturated hydraulic conductivity becomes essential. The analysis of unsaturated parameters is not conceived without the inclusion of suction. Therefore, there is a direct correlation between permeability and suction, whether imposed on a sample or existing in situ [2,19,21].
For this purpose, it should be noted that there is still a lack of information in understanding the flow in unsaturated soils and, therefore, quantitatively of unsaturated hydraulic conductivity values in different soil types. Many of the current technologies for soil improvement are based on the inclusion of minerals (Fe2O3, CaCO3, MgSO4). Even cutting-edge studies show that diatoms can become a promising methodology [41,42,43]. Therefore, knowing the unsaturated flow response of these materials becomes crucial within this field of study’s state-of-the-art.
The general objective of this investigation is projected to obtain the saturated and unsaturated hydraulic conductivity when different levels of suction are imposed, and various materials are added to the sand base sample. In this study, the permeability characteristics are analyzed for different combinations of soils to understand the variation in the saturated and unsaturated hydraulic properties by conducting comparative experimental studies. The MDI evaluates ku in granular soils with fine contents and synthetic fractions. Simultaneously, the soil permeability process in the saturated condition is evaluated utilizing conventional permeameters and the dual automated device as a numerical solution subject to analytical comparison discussions.

2. Materials and Methods

Combinations of granular soils with diatoms and synthetic agents were analyzed in proportions of 5%, 10%, 20%, and 40% to understand the functional mechanics of the infiltration process according to the soil texture. The granular specimen used corresponds to the Guamo sand. This type of soil presents a subangular predominance in the particle shape, according to the dimensional analysis of particles using the scales of [44]. The digital cartography of the soils, defined through the particle size distribution curve (PSD), provides sufficient information on the disposition of the porosimetric tracing of granular soils and allows for estimating their hydraulic conductivity. The PSD of the Guamo sand is found in Figure 3, and the specific gravity (Sg) and unit weight of the Guamo sand are in Table 1.
Figure 4 shows the particle size distribution of the materials included in the base sample of Guamo sand. The PSD (Figure 3 and Figure 4) is a crucial factor in understanding the hydraulic response in terms of permeability when each material is added in different proportions. Although the distribution and gradation become similar, the calcium carbonate presents finer sizes in the three curves than the other two materials. This aspect should be noted in the hydraulic conductivity values, which are discussed in the results section.

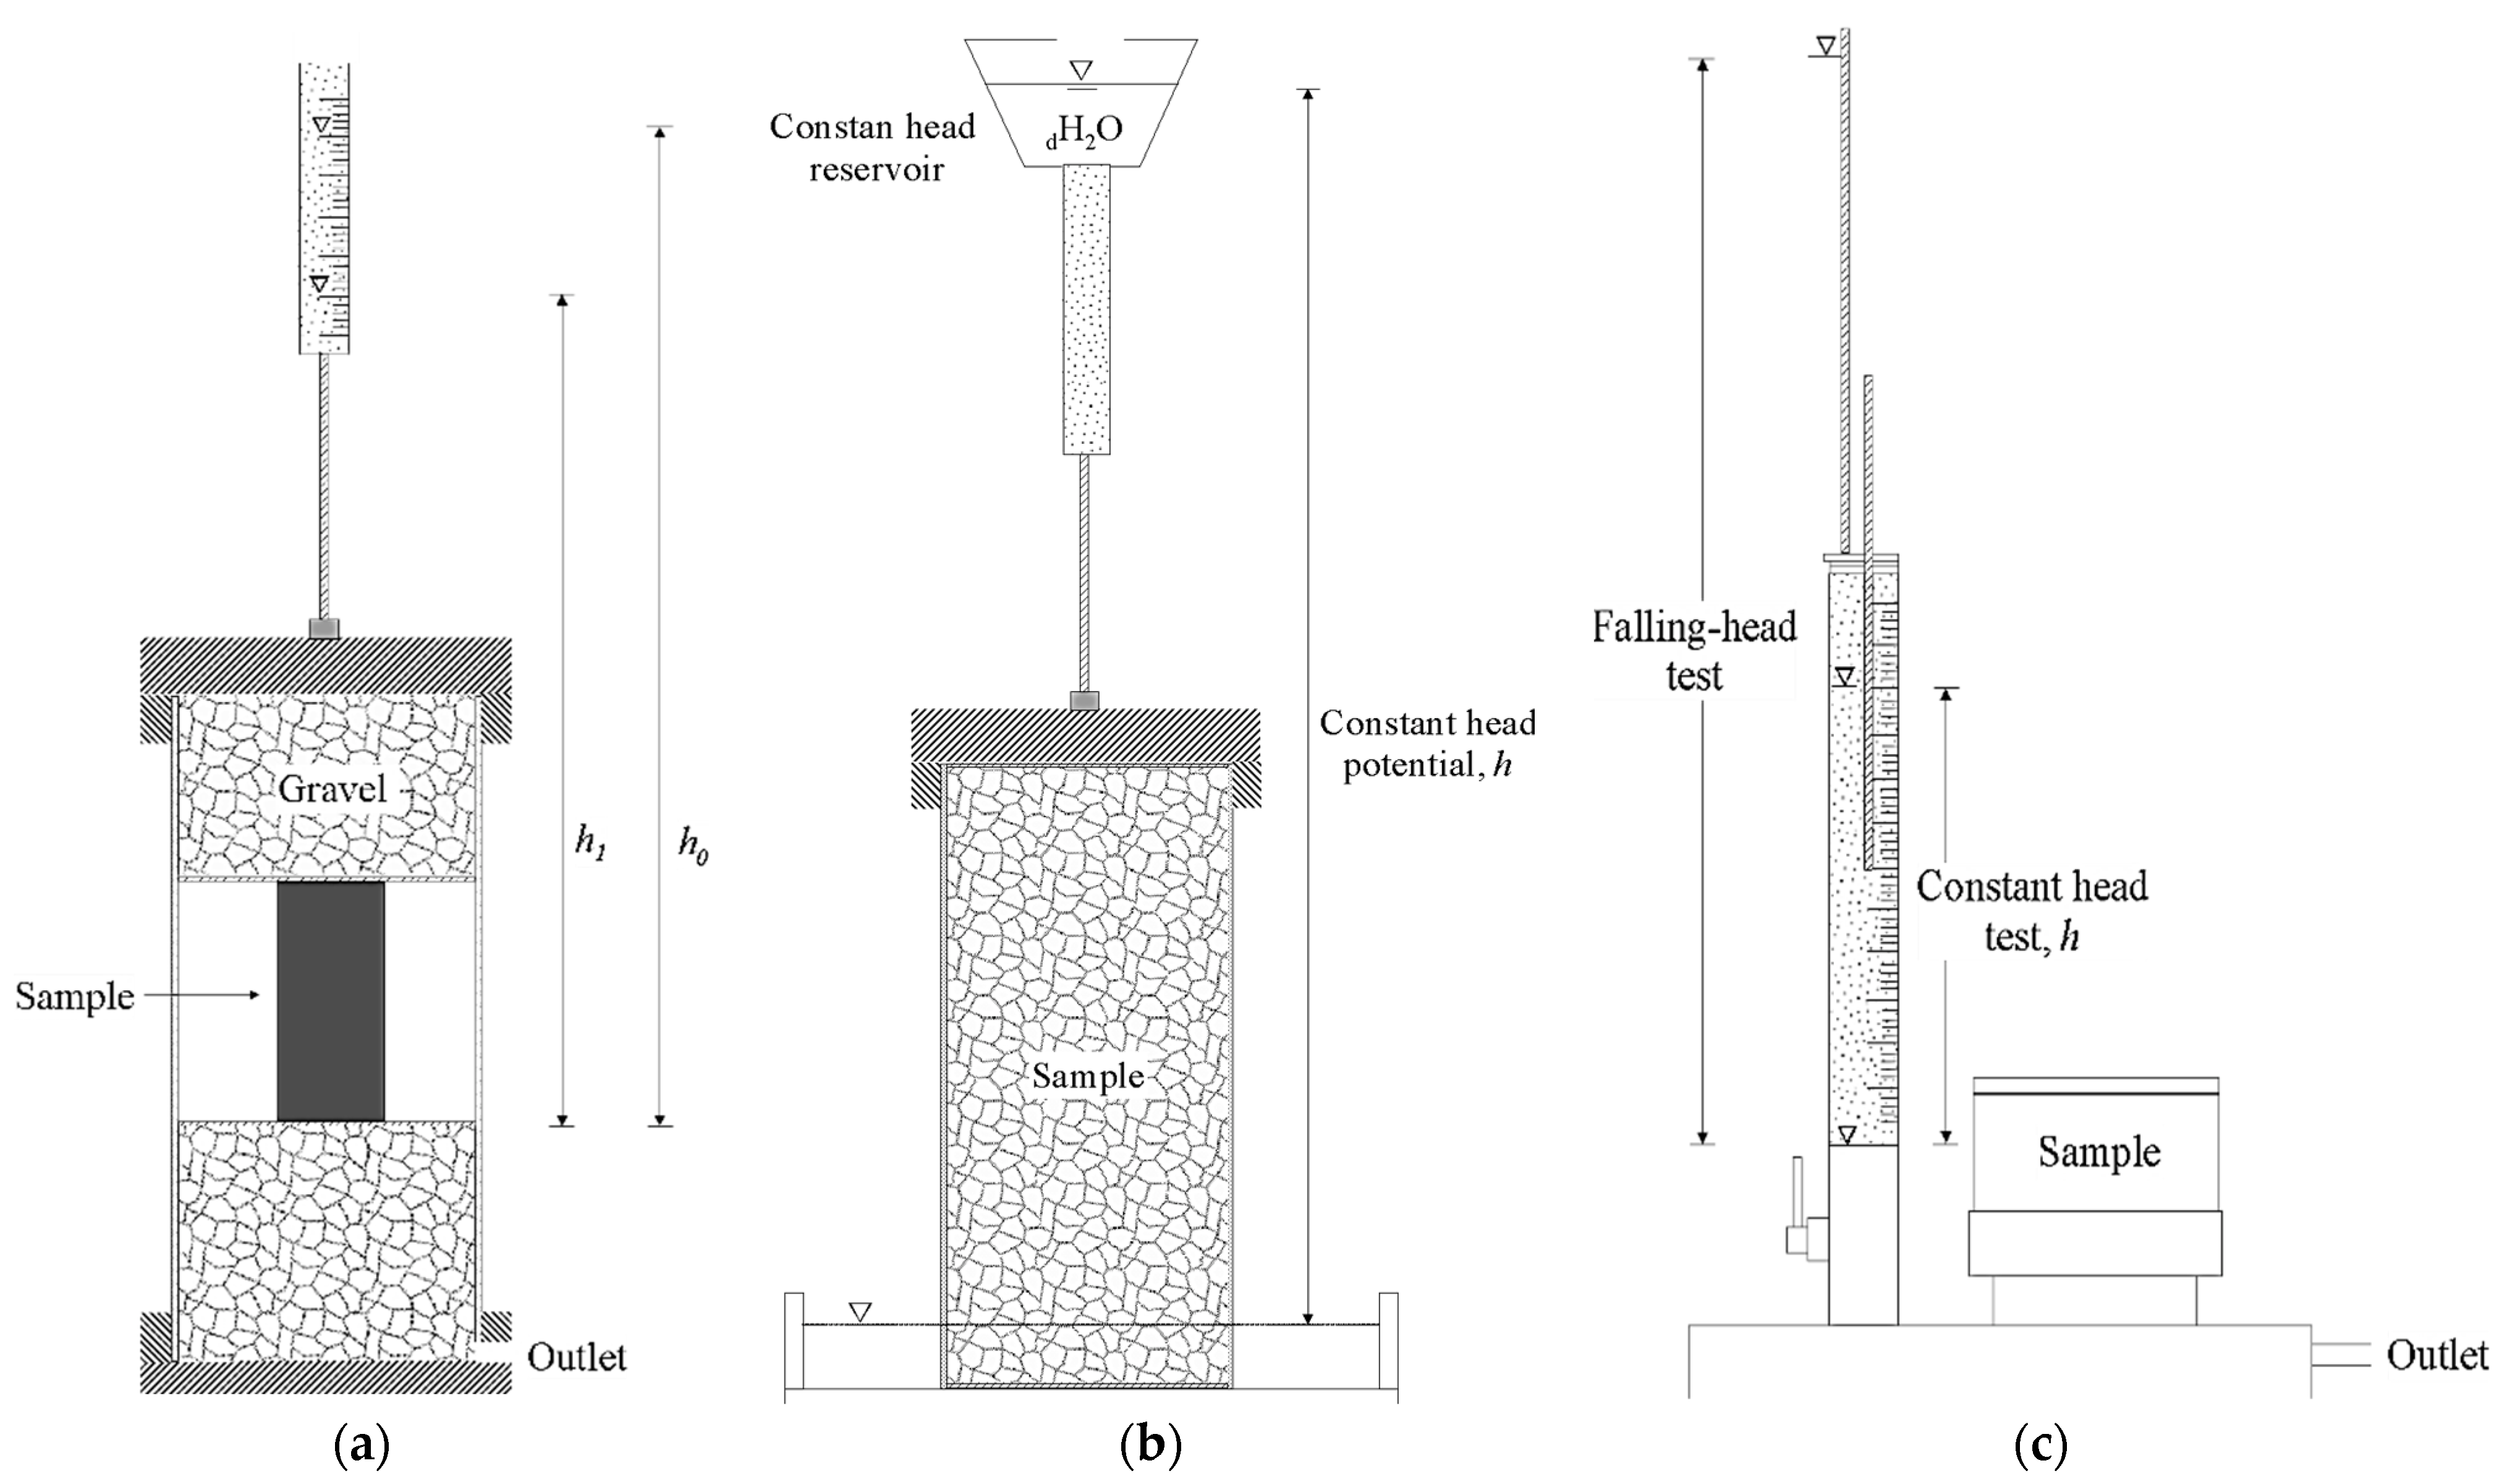
2.1. Saturated Hydraulic Conductivity Measurements

The soil cores were subjected to saturation processes for 72 h before taking ks measurements. Measurements were made in a constant head permeameter at a fixed height of hydraulic pressure of 160 cm and in a variable head. In each piezometric head, the samples were replicated 1 to 5 times. The values obtained were normalized at a temperature of 20 °C. The practices were carried out in distilled water. The ks results were determined by employing a circuit of five soil replicas, where the proportion of additives was gradually increased, from 5% to 40%, following the procedural standardization regulated in the INV-E-130-13 for saturated specimens. However, for iron oxide (Fe2O3), the powder was calculated by weight at the same percentage, and it was mixed with Guamo sand since the oxidation processes in this compound can transform it to its insoluble state [45].
Immediately after the measurements in the conventional permeameter, the saturated hydraulic conductivity, ks, was determined for each soil sample using the KSAT device in constant and variable cycles. The KSAT practical guidelines are established by the Deutsches Institut fur Normung through DIN 19683-9 [46] and DIN 18130-1 [47]. A ring with a free overflow of the outflow was arranged for the variable head system at the sample top. The assembly was assembled on the KSAT device and fixed with a screw cap. The water was supplied from higher than the outlet level, using a buret connected to the soil core (Figure 1c). The KSAT View software automatically calculates the ks data using the variation in the recorded hydraulic head. The infiltration rates in the KSAT mechanism are theoretically obtained by reversing Darcy’s law [48], where the flux density in an event corresponding to laminar flow can be considered proportional to the hydraulic gradient (Equation (1)).
q = V A   t = k s H L k s = L   V H   A   t
V, volumetric flow [cm3]; A, sample area [cm2]; t, time [s]; L, sample length [cm]; H, hydraulic head [cm].
For the correct evaluation of the samples, it is vital to show manifest integrity. They cannot have openings, fissures, or cracks that allow the passage of water through these imperfections. Due to the automatic nature of the equipment, the real challenge is to obtain genuinely representative samples and not in the measurement itself [49]. Different issues of the literature established valid values for ks. In the current case study, the materials’ hydraulic conductivity characteristics, according to [47], can be found in Table 2.

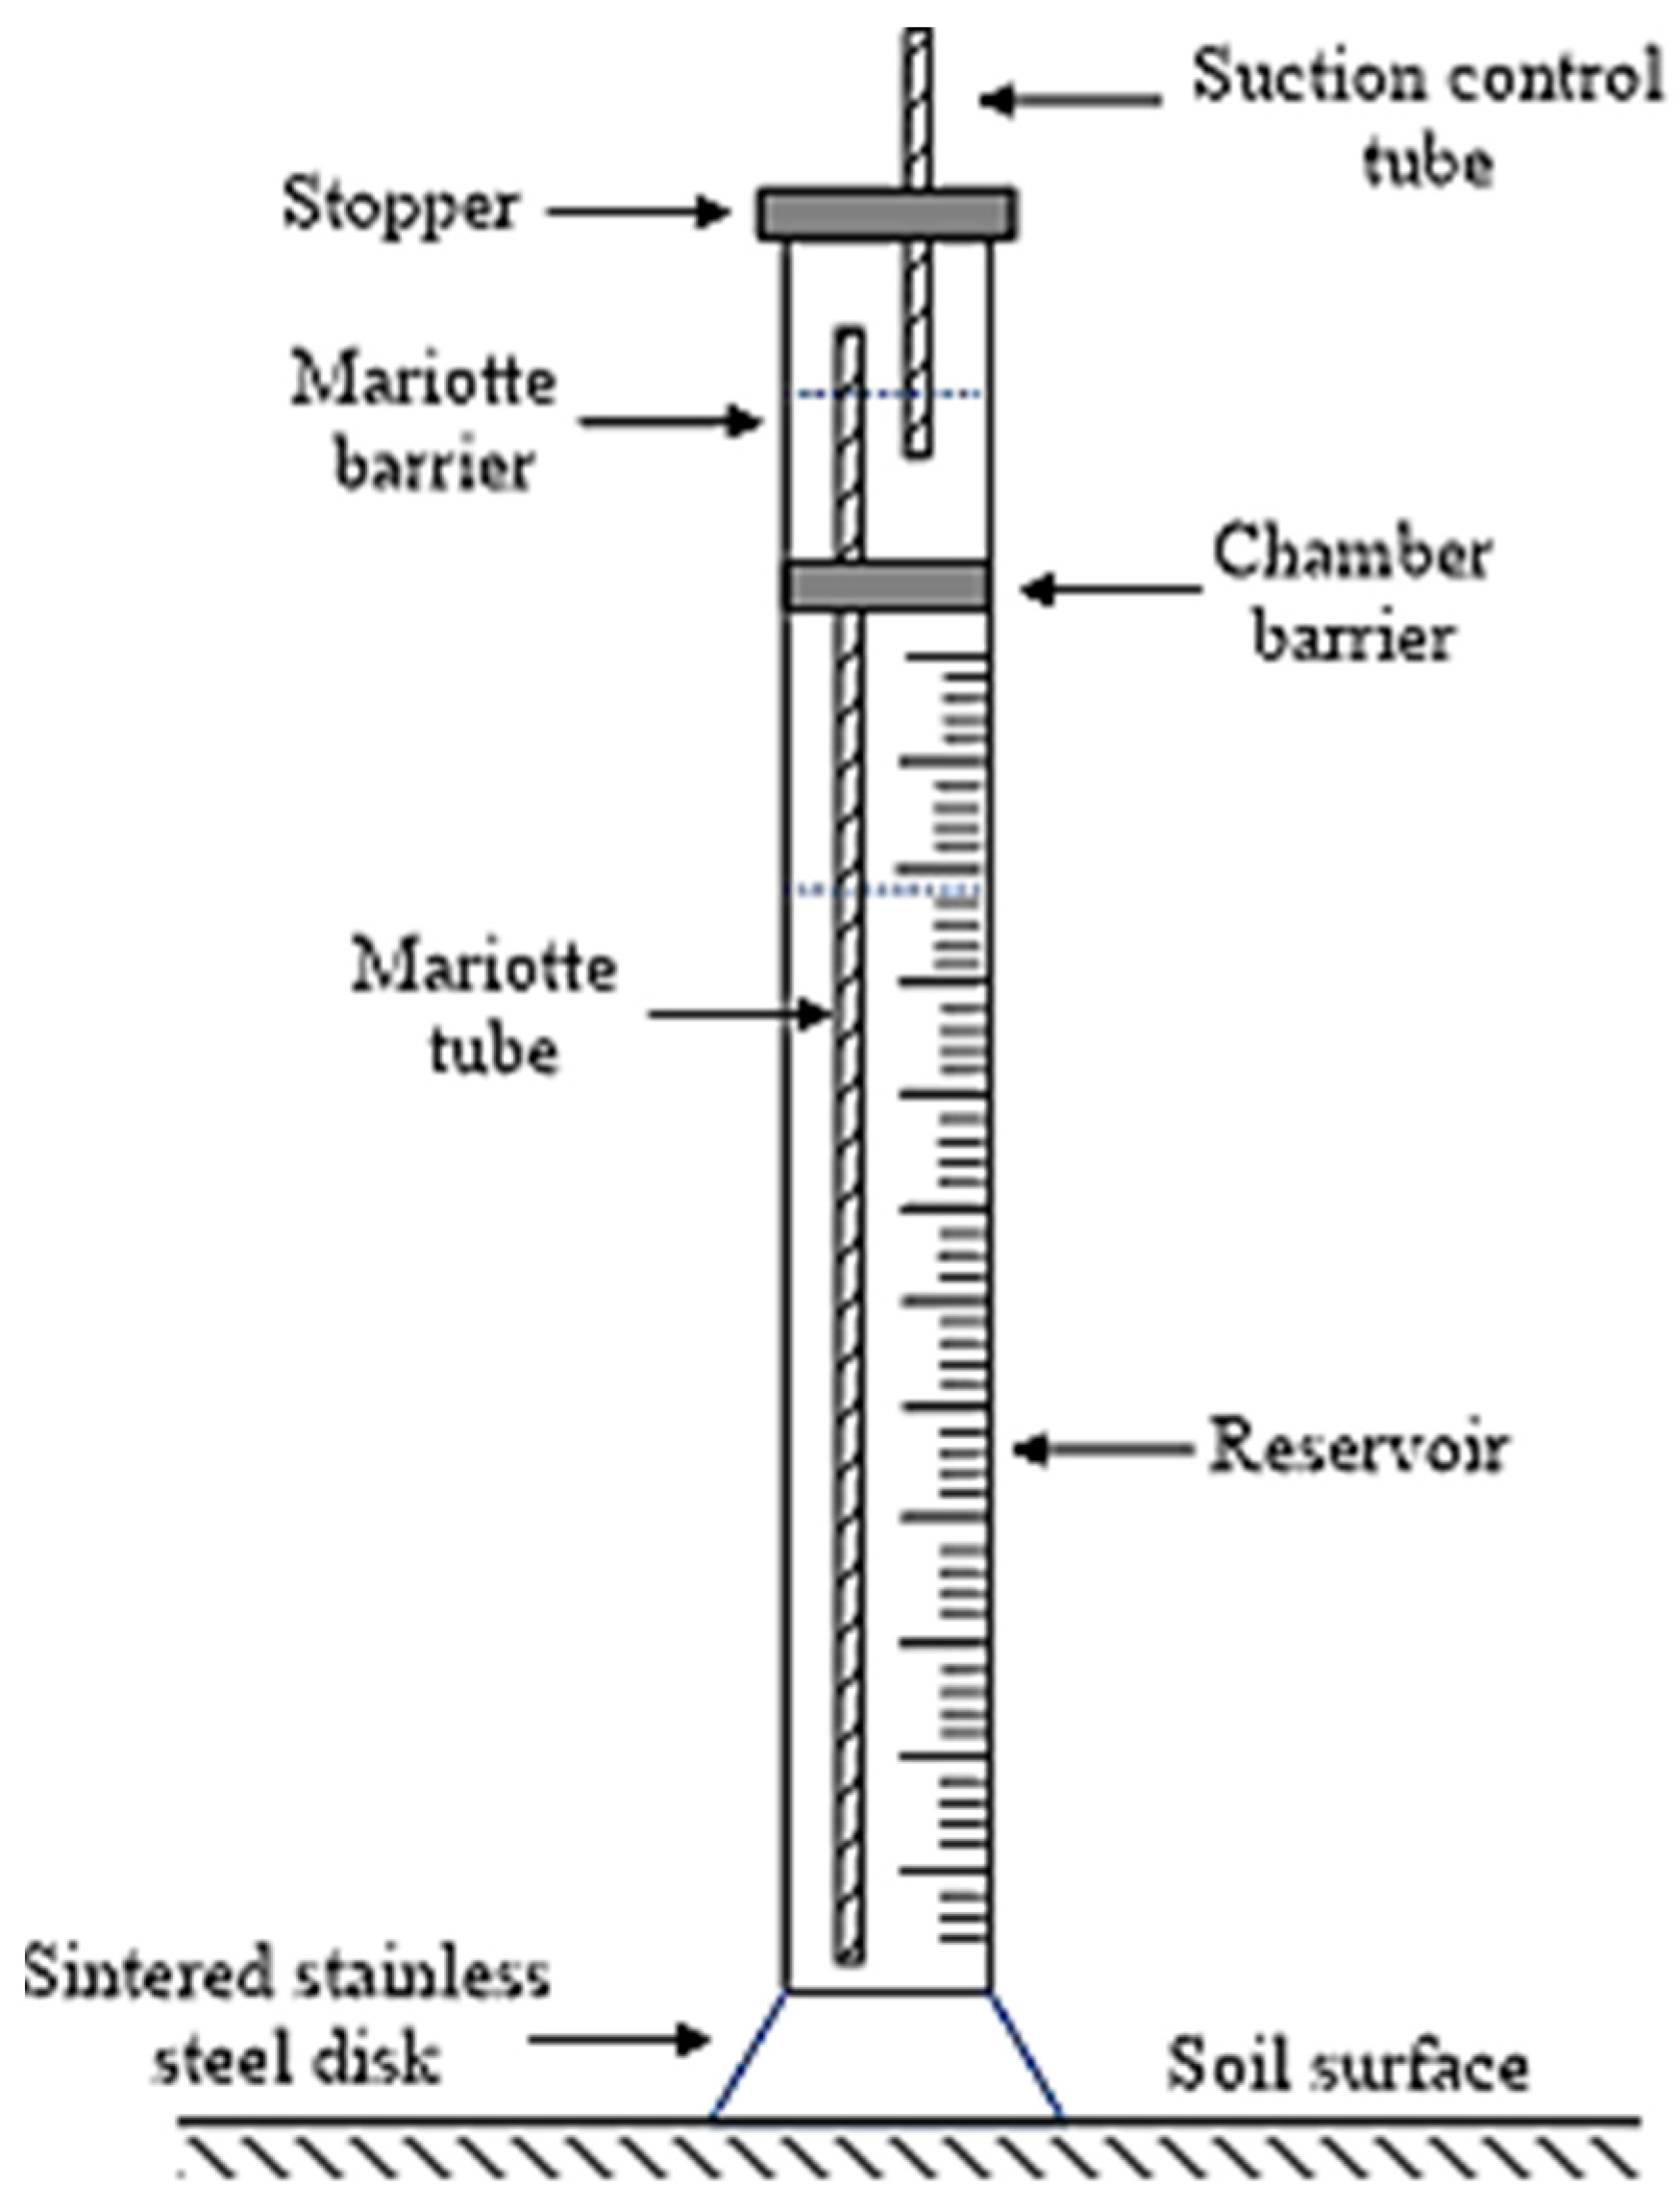
2.2. Unsaturated Hydraulic Conductivity Measurements

The mini-disk infiltrometer (MDI) was used to record the ku values (Figure 2), with a disk radius of 4.5 cm. The Mariotte compartment controls the suction head, and the lower chamber stores the volume of water allowed for infiltration, with a maximum value of 95 mL. The MDI allows regulating the suction from 0.5 to 6 cm to obtain additional information on the distribution of pores after the imposition of air values lower than the suction of the infiltrometer. Suction rates were adjusted for five sets of tests from 1 to 5 cm, and ku values were measured for each circuit of 5 replicates per type of material. For each suction range, the water content was measured during the execution of the tests every 20 s (because it starts from a known humidity and the water that enters is known). The infiltration rates at the end of each experimental cycle were considered steady-state and were used to find the values of unsaturated hydraulic conductivity, ku.
The unsaturated hydraulic conductivity (ku) depends on factors such as matric suction and soil moisture. This phenomenon occurs because when the soil enters a pendular state, the continuity of the front hydraulic path is hindered, and the water cannot travel as well as when it has a continuous saturated medium.
The technique chosen for the study based on [50], designed to estimate infiltration measurements in soil, can adequately correlate with the hydraulic conductivity of the material. The infiltration can be calculated utilizing a fitting equation shown below.
I = C 1 t + C 2 t
C1 (cm/s) and C2 (cm/s) are adjustment parameters of the equation, but they have physical meaning. C1 is related to the soil absorption/desorption process, and C2 is the hydraulic conductivity. However, the desired hydraulic conductivity is in a partially saturated condition, so this new value must be calculated as ku = (C1/A), where C1 is the slope of the infiltration curve vs. t1/2 (Figure 5). A is the variable that contains the suction values and the radius of the infiltrometer that controls ku. These parameters can be found in [51].
The parameter A can be calculated from the following equations, depending on the induced suction and the radius of the infiltrometer (ro = 2.25 cm).
A = 11.65 n 0.1 1 e 2.92 n 1.9 α h o α r o 0.91   n 1.9  
A = 11.65 n 0.1 1 e 7.5 n 1.9 α h o α r o 0.91   n 1.9  
where n and α are called Van Genuchten parameters. According to [51], for granular soil, these variables take the values of 2.68 and 0.145 for the Guamo sand. In this study, the variable C1 shows a value of 0.0241 cm/s (Figure 5). Although the additions have a different PSD than the base material (Guamo sand, Figure 3), the texture of the composite material does not vary too much). The additions are considered to modify the texture slightly towards a silty sand denomination due to the PSD of the additions (Figure 4). The parameters of van Genuchten op. cit. [51] are not precise enough to define a change in parameters for each addition. They are only based on general soil textures. Values of A can be obtained for each suction ho, as shown in Table 3. Indeed there are consequent changes in the soil when adding the additions. However, according to the van Genuchten tables, these are not reflected in the parameters α and n. More details about the parameters used and obtaining the unsaturated permeability coefficient can be found in [52].

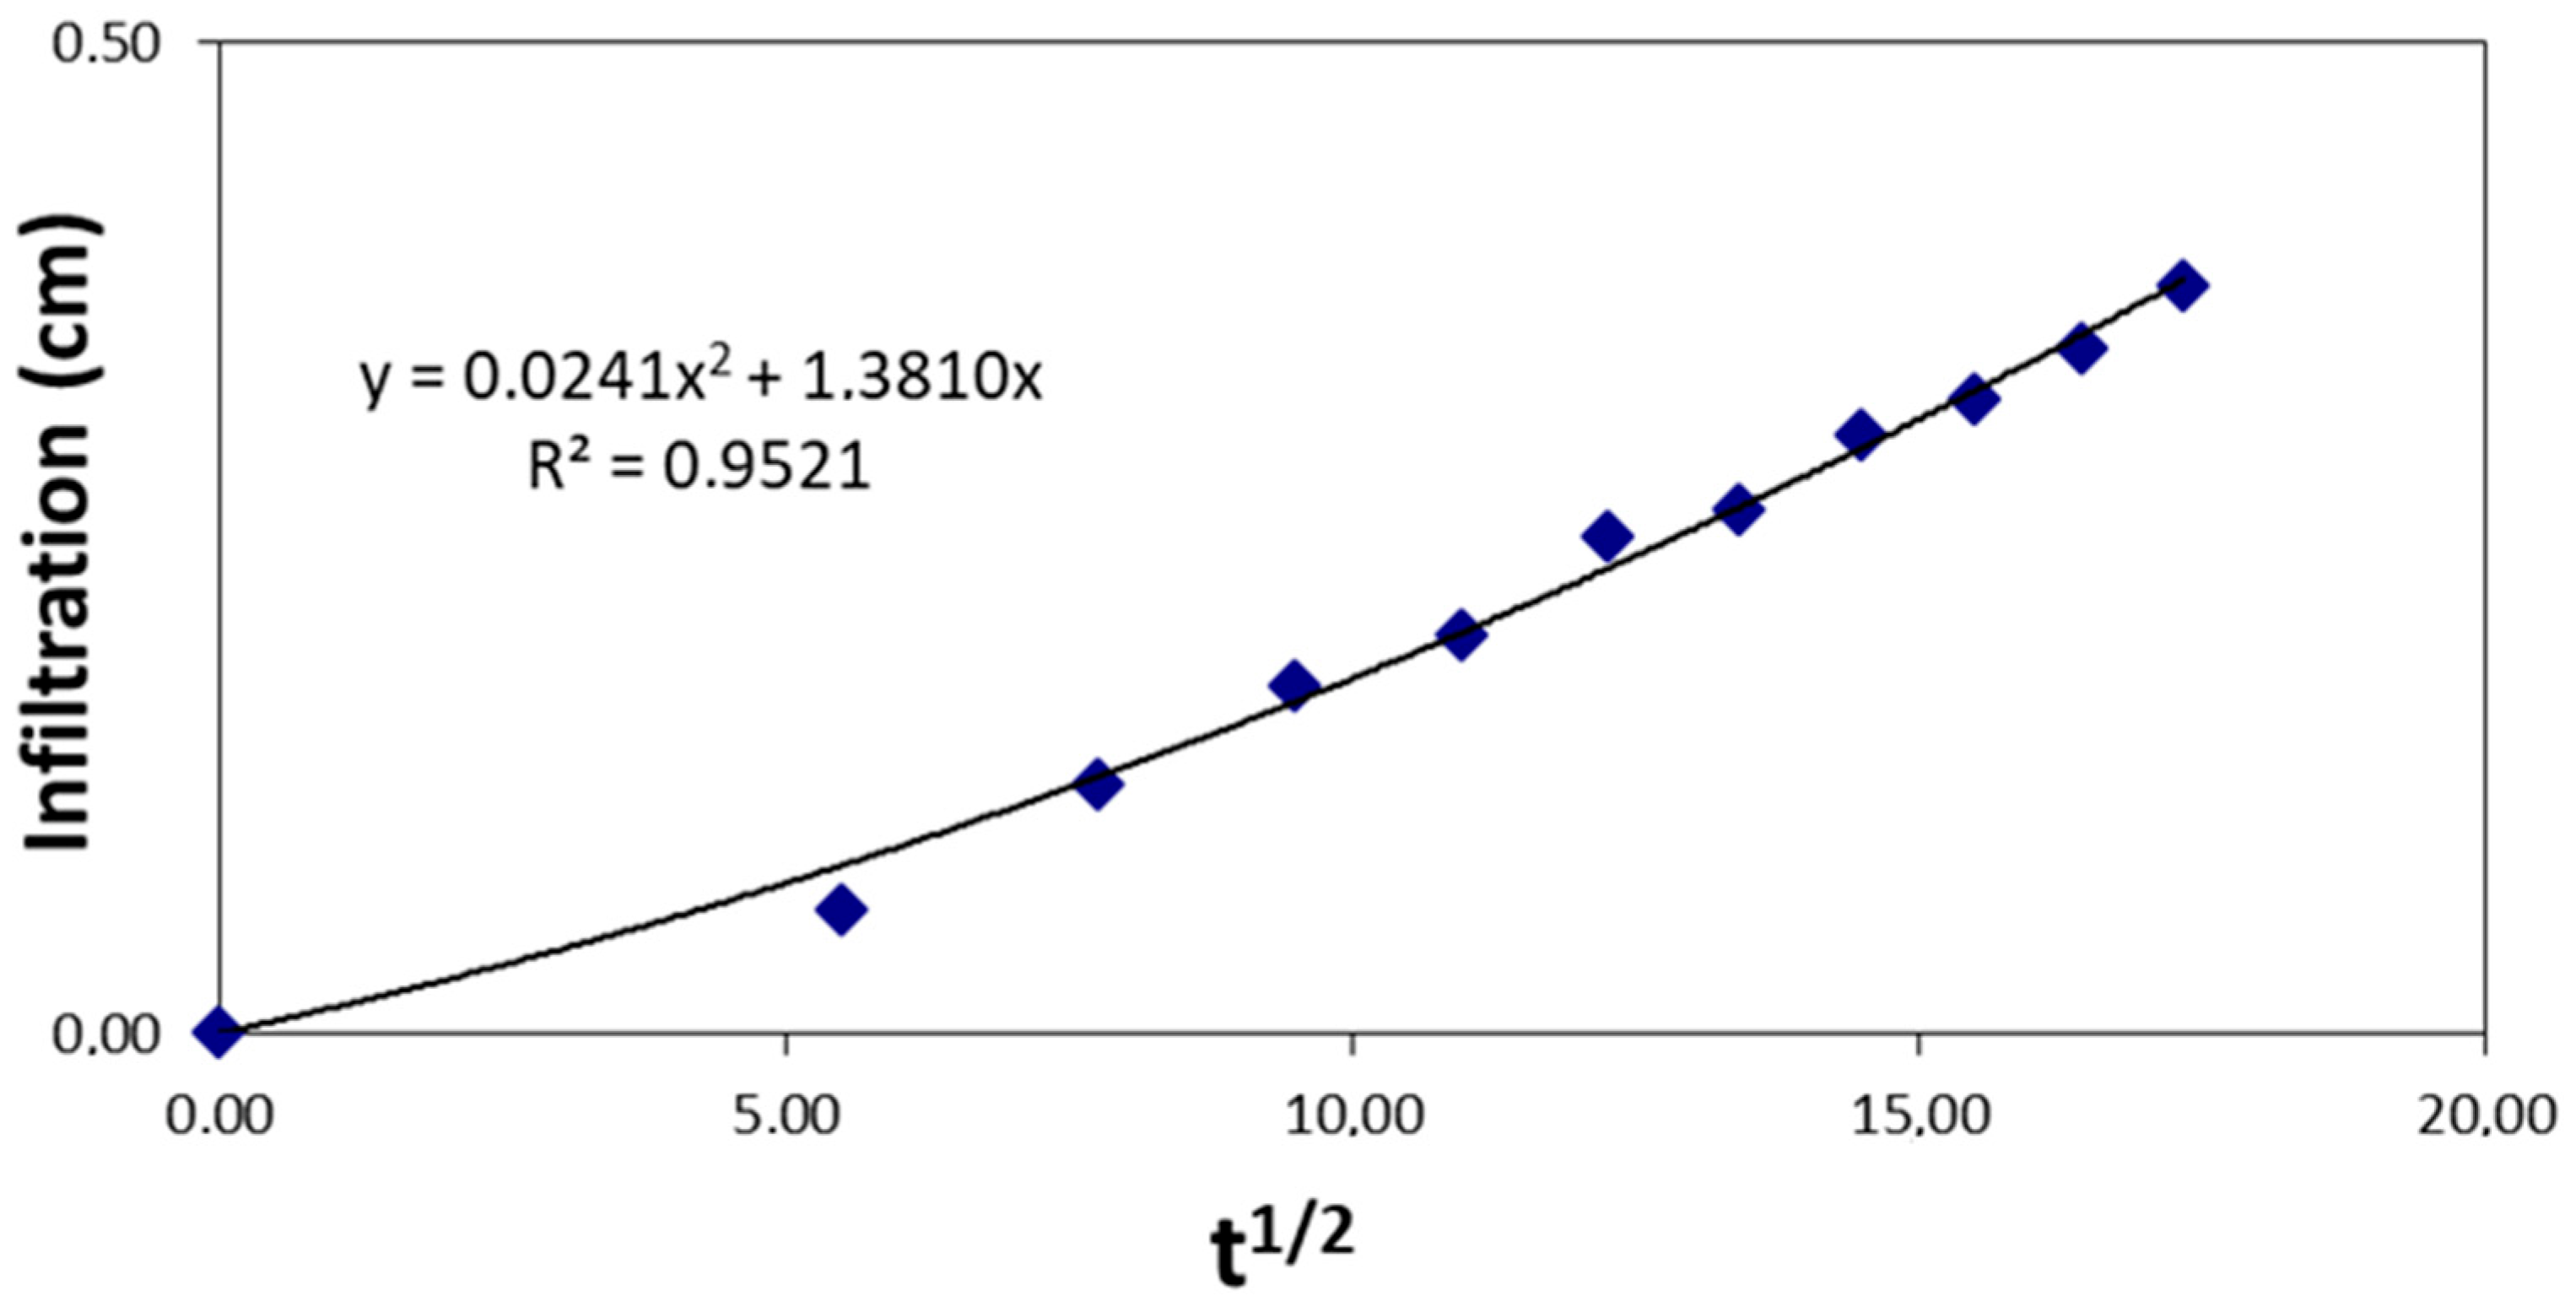
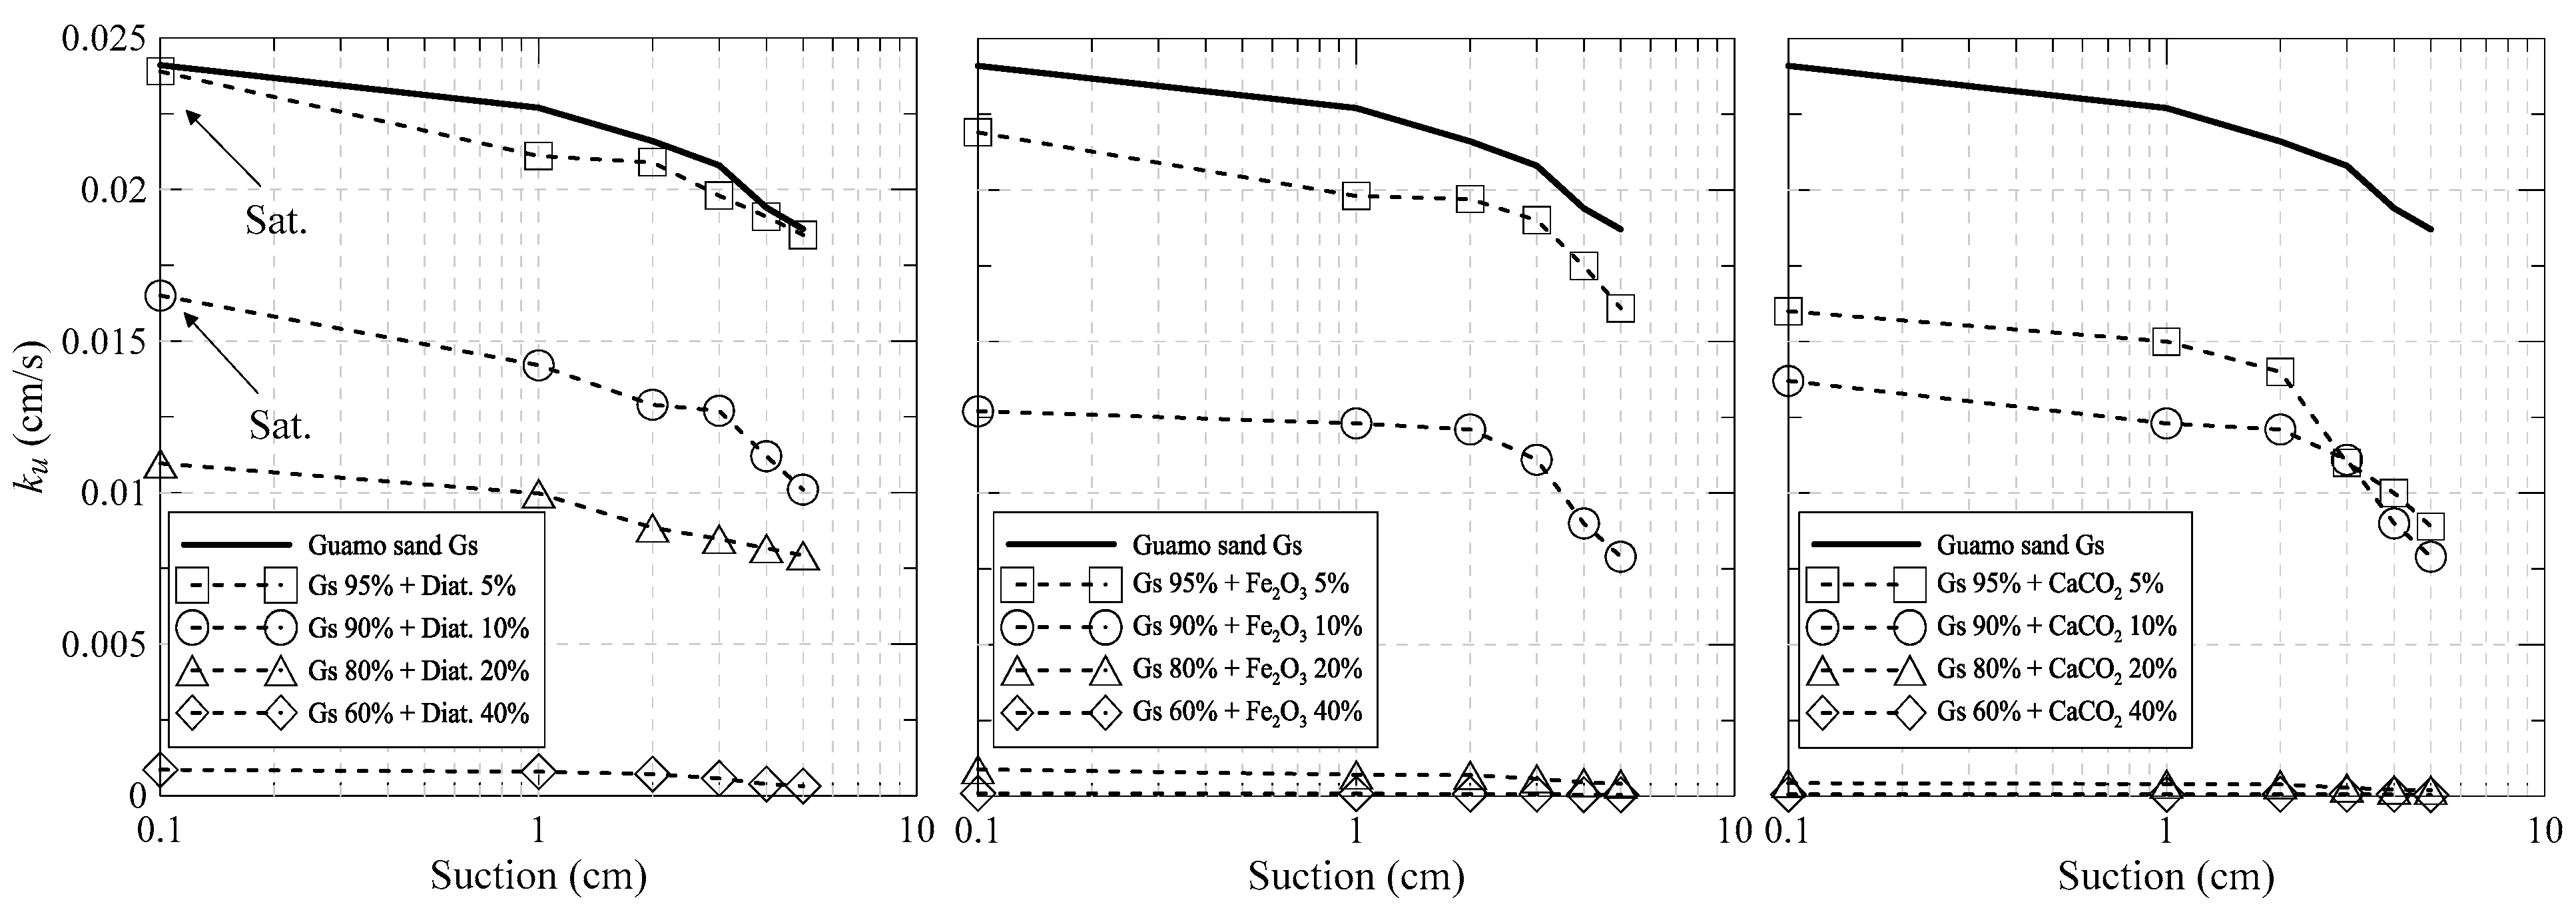
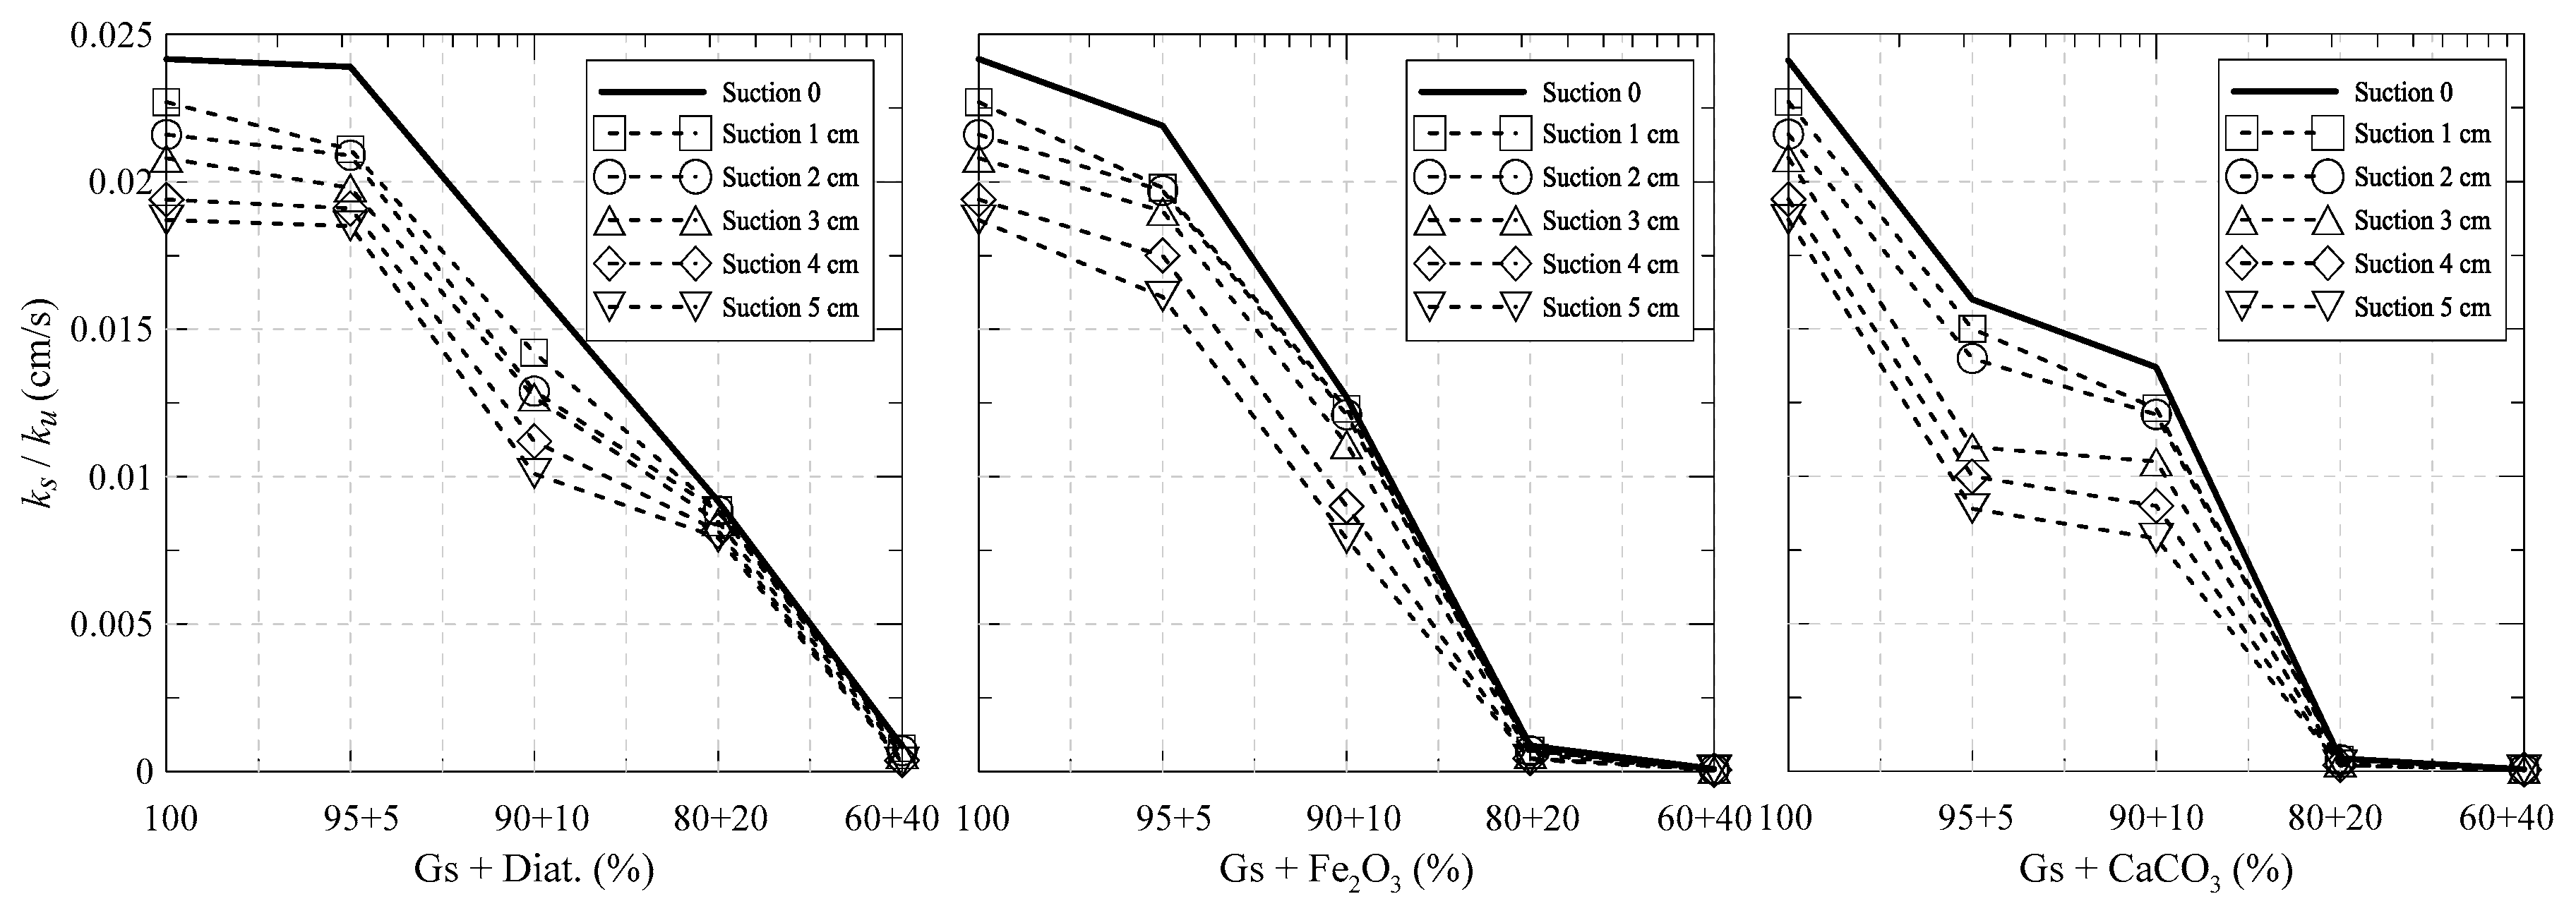
3. Results and Discussion

The ks values obtained using the conventional constant inversion experimental model and the automated permeameter for the three types of materials are shown in Table 4. During the constant head test in the conventional permeameter, the ks values register hydraulic height changes at speed slow enough for granular dominance to be absolute in all reconstituted prototypes.
For the first approach of the granular beds with percentages of diatoms, the permeability characteristics of the Guamo sand were considerably limited, although the data acquisition for this particular set considers the highest ks results. From 0.02416 cm/s as the ks characteristic of the granular system to 0.00081 cm/s with a dependence of 40% of fossilized microalgae, the reduction covers about 99.7% using a data convergence scale forced to 0 (Table 4). The addition of diatoms to the base material clearly reduces the saturated permeability coefficient because it has a finer PSD, which allows diatom particles to locate between the pores of the Guamo sand.
Likewise, the standard deviation was calculated in the ks values obtained by the conventional permeameter and KSAT methods. In most cases, the normal distribution showed that 90% of the values are within one standard deviation. Regardless of the method used to estimate the value of ks, there is parity in the values, and most fluctuate close to the mean (Table 4). The above also applied for ku results from the MDI.
The permeability values in saturated conditions coincide with previous studies that have been fully validated in the literature, where the sand under study is considered a medium-sized grain, highly permeable. Similarly, when the additions are included, the soil begins to change, in terms of its PSD, towards fine-grained sand and silty sand. This aspect influences the reduction in ks. The effects described are collinear with those recorded in several studies, where the values are in similar positions and can be consulted in [47,53,54,55,56,57,58].
This behavior responds to the pedogenetics and composition of diatom soils, corresponding to fossilized remains of freshwater unicellular photosynthetic algae with silica skeletons. Within the literature, there are extensive studies on how pedogenetics influences the material’s current mechanical and hydraulic behavior and even the anisotropy and heterogeneity of depositional soils such as diatomite [59,60,61,62,63,64,65,66]. The ks value of Guamo sand is an intrinsic property of the porous medium, so it remains constant during all tests. This mechanism is observed in the three coupling scenarios, where a stable average permeability is defined throughout the experimental phase.
In the second approach, which considers the inclusion of synthetic components derived from mixtures of two or more elements in a pure state, such as calcium carbonate (CaCO3) and iron oxide (Fe2O3), the digital mapping of soils is seen subjected to amplification in smaller diameters, reducing the micro and macroporous spectrum of the Guamo sand. Consequently, the permeability is much lower in the core than in the first approach. On the other hand, when the liquid reaches the sample top during the constant head test, the overestimation of the hydraulic gradient can be neglected by ignoring the gravity within the sample. Because the apparatus is vertically oriented, gravity produces flow drag effects through the granular cell, especially at low liquid levels. At the lowest point of the sample within the permeameter, the flow through the sample interface and outlet channel affects the piezometric measurement. However, additional pressure breaks are caused by changes in the test permeameter cross-section in the outlet pipe and the exhaust valve.
Constant and variable head patency test measurements were verified in this study using the automated KSAT control method. The dual-mode tester is ideal for evaluating ks results simultaneously in porous media, as it allows constant testing immediately after the variable head tests have been performed without the need to remove or reposition the sample. The constant and variable load results for each of the materials tested strongly coincide with the evaluation obtained in the conventional permeameter. In separate constant and variable load tests for hydraulic gradients from 160 to 50 mm, the reproducibility of the data in both methods was evaluated using analytical techniques by the arithmetic mean. This is because a variable probability distribution representing some characteristic of a population is completely defined when its parameters are known. When the opposite occurs, estimating them based on the sample data is necessary to make inferences in the population. As it is a single variable (ks), there is a wide confidence interval, and an excellent way to measure this type of data that resembles a normal distribution is the mean since it adequately represents the result of the repetitions of the tests [67].
The results obtained from the MDI for the direct case in the five materials were compiled and analyzed graphically to understand the accumulated infiltration in unsaturated media better. For each test, the soil’s initial and final water content immediately below the disk was recorded, and infiltration ranges corresponding to five suction levels from 1 to 5 cm were applied to all remodeled specimens of compacted soil. The details of the ku values are descriptively expressed in Figure 6. The experimental data analysis indicates a corresponding relationship between the ku parameter and suction at high ranges. The null suction phases for each material in each percentage combination correspond to the average value of ku in the saturated state, that is, ks reached by the MDI system. The trend of the ku results indicates significant losses in the infiltration capacity of each material as the suction reaches values close to 5 cm. ku was estimated using Equation (2), and the values were obtained from Figure 5. The values of A for each soil were obtained from Equations (3) and (4).
It would be prudent to carry out an analysis of the correlation that exists between the permeability values obtained and the physical variables of the composite materials. Figure 6 above shows different contents of diatom (Aulacoseira Granulata species); the highest values of ku are recorded because the particle size distribution in the diatom (Figure 4) reveals sizes relatively larger than iron oxide and calcium carbonate. Including diatomaceous soil in a more significant proportion, although it decreases the value of hydraulic conductivity, creates a double effect that acts combined when suction is imposed on the sample. Lower values are observed in iron oxide and carbonate, strongly related to smaller PSD sizes. These materials have particles smaller than 0.002 mm, a greater quantity than mixtures with diatomaceous soils.
It is not only essential to observe the response of the unsaturated hydraulic conductivity as a function of suction. For a complete analysis of the research, it is vital to focus on aspects such as the dependence of permeability concerning the combinations of proposed composite materials. In Figure 7, it is possible to analyze the behavior of the hydraulic conductivities for different suction levels related to the dosage of the inclusions. The curve for zero suction (ks) behaves as an envelope, limiting the unsaturated permeability states (ku). Below the zero suction curve, the curves for different suction levels are located in relation to the proportion of diatom inclusions, Fe2O3 and CaCO3. This graph also shows the ku reduction as a function of suction and the addition of different materials. It is important to analyze that for high rates of additions, the permeability values tend to be very low and to be very similar for all the curves.
Although there are few studies to date where the results obtained in this study can be objectively contrasted to validate the permeability coefficients in an unsaturated situation (ku), [68,69] show results for similar materials that can corroborate the values recorded in this study. In the investigations consulted, methodologies similar to those used in the current study were used.

4. Conclusions

From the experiments carried out with three types of reconstituted materials and fifteen mixtures in total, it was evidenced that the ks values determined by the automated dual method, KSAT, coincided to a high degree with the saturated conductivity obtained through conventional methodologies of direct disturbance. For this reason, the values of ks obtained by various methods showed that the results were consistent. Regarding its performance for materials mixed with additional compounds, the method’s response was adequate to determine the conductivity function in the saturated range by direct measurement.
As presumed, according to the analysis of previous studies, the saturated hydraulic conductivity was reduced by adding agents of a finer granulometry than the base material. Moreover, in a matter of ku, there was a reduction manifested by the suction levels generated by binding bridges (menisci) that make up a kind of granular tissue in tension. This phenomenon hinders the passage of water through the porous medium, decreasing the coefficient of permeability as the suction in crescendo.
Although it is an intrinsic property of soils, permeability can be significantly affected when the particle size distribution and the pore size distribution change their diametral spectrum. Synthetic compounds that can have oxidation channels after contact with aqueous agents generate changes in saturated and unsaturated hydraulic conductivity development ranges. Likewise, communication between soils of different PSD distributions greater than 50–50 decreases the filtering characteristics of granular soils. However, with low suction levels, the values adopted by these reconstituted materials do not show significant differences.
The MDI method used to estimate the unsaturated hydraulic conductivity (ku) from the infiltration of water in the material was a valuable alternative to obtain parameters of unsaturated permeability in a simple way. The MDI mechanism, based on the infiltration of water into the ground through a porous stone that controls the entrance and guarantees suction together with the Mariotte chamber, was used to determine the numerical scheme of ku, allowing identifying the suction fields of the materials for which the value of ku attends inflection points. Since, for a null suction state, all ku must correspond to its saturated analog, ks, the device’s sensitivity at this point is significantly reduced.

Author Contributions

Conceptualization, J.P.R. and J.C.R.; writing—original draft preparation, J.P.R., J.C.R. and G.A.C.; writing—review and editing, J.C.R. and G.A.C.; supervision, J.C.R.; project administration, J.P.R. and J.C.R.; funding acquisition, J.P.R. All authors have read and agreed to the published version of the manuscript.

Funding

This research received no external funding.

Institutional Review Board Statement

Not applicable.

Informed Consent Statement

Not applicable.

Data Availability Statement

Not applicable.

Conflicts of Interest

The authors declare no conflict of interest.

References

  1. Durner, W.; Flühler, H. Soil Hydraulic Properties. In Encyclopedia of Hydrological Sciences; Wiley Online Library: Hoboken, NJ, USA, 2006; Volume HS077, pp. 1–32. [Google Scholar]
  2. Hunt, A.G.; Ghanbarian, B.; Saville, K.C. Unsaturated hydraulic conductivity modeling for porous media with two fractal regimes. Geoderma 2013, 207, 268–278. [Google Scholar] [CrossRef]
  3. Brooks, R.; Corey, A. Hydraulic properties of porous media. In Hydrology Papers 3; Colorado State University: Fort Collins, CO, USA, 1964; pp. 1–27. [Google Scholar]
  4. van Genuchten, M. A closed-form equation for predicting the hydraulic conductivity of unsaturated soils. Soil Sci. Soc. Am. J. 1980, 8, 892–898. [Google Scholar] [CrossRef]
  5. Fredlund, D.G.; Xing, A. Equations for the soil-water characteristic curve. Can. Geotech. J. 1994, 31, 512–532. [Google Scholar] [CrossRef]
  6. Gallage, C.; Kodikara, J.; Uchimura, T. Laboratory measurement of hydraulic conductivity functions of two unsaturated sandy soils during drying and wetting processes. Soils Found. 2013, 53, 417–430. [Google Scholar] [CrossRef]
  7. Hall, K.D. Comparison of falling-head and constant-head techniques: Estimating field permeability of hot-mix asphalt pavements. Transp. Res. Rec. 2004, 1891, 23–31. [Google Scholar] [CrossRef]
  8. Andres-Valeri, V.C.; Juli-Gandara, L.; Jato-Espino, D.; Rodriguez-Hernandez, J. Characterization of the infiltration capacity of porous concrete pavements with low constant head permeability tests. Water 2018, 10, 480. [Google Scholar] [CrossRef]
  9. Zarandi, M.A.F.; Pillai, K.M.; Barari, B. Flow along and across glass-fiber wicks: Testing of permeability models through experiments and simulations. AIChE J. 2018, 64, 3491–3501. [Google Scholar] [CrossRef]
  10. Assaad, J.J.; Harb, J. Use of the falling-head method to assess permeability of freshly mixed cementitious-based materials. J. Mater. Civ. Eng. 2013, 25, 580–588. [Google Scholar] [CrossRef]
  11. Sun, Y.; Causse, P.; Benmokrane, B.; Trochu, F. Permeability measurement of granular porous materials by a modified falling-head method. J. Eng. Mech. 2020, 146, 04020101. [Google Scholar] [CrossRef]
  12. Marshall, T.J. A relation between permeability and size distribution of pores. J. Soil Sci. 1958, 9, 1–8. [Google Scholar] [CrossRef]
  13. Millington, R.J.; Quirk, J.P. Permeability of porous solids. Trans. Faraday Soc. 1961, 57, 1200–1207. [Google Scholar] [CrossRef]
  14. Green, R.E.; Corey, J.C. Calculation of hydraulic conductivity: A further evaluation of some predictive methods. Soil Sci. Soc. Am. J. 1971, 35, 3–8. [Google Scholar] [CrossRef]
  15. Durner, W. Hydraulic conductivity estimation for soils with heterogeneous pore structure. Water Resour. Res. 1994, 30, 211–223. [Google Scholar] [CrossRef]
  16. Arya, L.M.; Leij, F.J.; Shouse, P.J.; Van Genuchten, M.T. Relationship between the hydraulic conductivity function and the particle-size distribution. Soil Sci. Soc. Am. J. 1999, 3, 1063–1070. [Google Scholar] [CrossRef]
  17. Fredlund, M.D.; Wilson, G.W.; Fredlund, D.G. Use of the grain-size distribution for estimation of the soil-water characteristic curve. Can. Geotech. J. 2002, 39, 1103–1117. [Google Scholar] [CrossRef]
  18. Chapuis, R.P. Estimating the in-situ porosity of sandy soils sampled in boreholes. Eng. Geol. 2012, 141, 57–64. [Google Scholar] [CrossRef]
  19. Klute, A. The determination of the hydraulic conductivity and diffusivity of unsaturated soils. Soil Sci. 1972, 113, 264–276. [Google Scholar] [CrossRef]
  20. Baker, F.G.; Veneman, P.L.; Bouma, J. Limitations of the instantaneous profile method for field measurement of unsaturated hydraulic conductivity. Soil Sci. Soc. Am. J. 1974, 38, 885–888. [Google Scholar] [CrossRef]
  21. Fredlund, D.G.; Xing, A.; Huang, S. Predicting the permeability function for unsaturated soils using the soil-water characteristic curve. Can. Geotech. J. 1994, 31, 533–546. [Google Scholar] [CrossRef]
  22. Daniel, D.E. State-of-the-art: Laboratory hydraulic conductivity tests for saturated soils. In Hydraulic Conductivity and Waste Contaminant Transport in Soil; Daniel, D.E., Trautwein, S.J., Eds.; ASTM International: West Conshohocken, PA, USA, 1994; pp. 111–168. [Google Scholar]
  23. Cui, Y.J.; Tang, A.M.; Loiseau, C.; Delage, P. Determining the unsaturated hydraulic conductivity of a compacted sand–bentonite mixture under constant-volume and free-swell conditions. Phys. Chem. Earth Parts A B C 2008, 33, S462–S471. [Google Scholar] [CrossRef] [Green Version]
  24. Schindler, U.; Durner, W.; von Unold, G.; Müller, L. Evaporation method for measuring unsaturated hydraulic properties of soils: Extending the measurement range. Soil Sci. Soc. Am. J. 2010, 74, 1071–1083. [Google Scholar] [CrossRef]
  25. Tao, G.; Zhu, X.; Cai, J.; Xiao, H.; Chen, Q.; Chen, Y. A fractal approach for predicting unsaturated hydraulic conductivity of deformable clay. Geofluids 2019, 2019, 8013851. [Google Scholar] [CrossRef]
  26. Pilon, J. Characterization of the Physical and Hydraulic Properties of Peat Impacted by a Temporary Access Road. Master’s Thesis, University of Waterloo, Waterloo, ON, Canada, 2015. [Google Scholar]
  27. Wanger, M.M.; Fox, G.A.; Wilson, G.V. Pipeflow experiments to quantify pore-water pressure buildup due to pipe clogging. In Proceedings of the 2015 ASABE Annual International Meeting, New Orleans, LA, USA, 26–29 July 2015; p. 1. [Google Scholar]
  28. Robinson, D.A.; Jones, S.B.; Lebron, I.; Reinsch, S.; Domínguez, M.T.; Smith, A.R.; Jones, D.L.; Marshall, M.R.; Emmett, B.A. Experimental evidence for drought induced alternative stable states of soil moisture. Sci. Rep. 2016, 6, 20018. [Google Scholar] [CrossRef] [PubMed]
  29. Fontanet, M.; Scudiero, E.; Skaggs, T.H.; Fernandez-Garcia, D.; Ferrer, F.; Rodrigo, G.; Bellvert, J. Dynamic management zones for irrigation scheduling. Agric. Water Manag. 2020, 238, 106207. [Google Scholar] [CrossRef]
  30. Jackisch, C.; Germer, K.; Graeff, T.; Andrä, I.; Schulz, K.; Schiedung, M.; Haller-Jans, J.; Schneider, J.; Jaquemotte, J.; Helmer, P.; et al. Soil moisture and matric potential–an open field comparison of sensor systems. Earth Syst. Sci. Data 2020, 12, 683–697. [Google Scholar] [CrossRef]
  31. Wooding, R.A. Steady infiltration from a shallow circular pond. Water Resour. Res. 1968, 4, 1259–1273. [Google Scholar] [CrossRef]
  32. Smettem, K.R.J.; Clothier, B.E. Measuring unsaturated sorptivity and hydraulic conductivity using multiple disc permeameters. J. Soil Sci. 1989, 40, 563–568. [Google Scholar] [CrossRef]
  33. Reynolds, W.D.; Elrick, D.E. Determination of hydraulic conductivity using a tension infiltrometer. Soil Sci. Soc. Am. J. 1991, 55, 633–639. [Google Scholar] [CrossRef]
  34. Šimůnek, J.; van Genuchten, M.T.; Gribb, M.M.; Hopmans, J.W. Parameter estimation of unsaturated soil hydraulic properties from transient flow processes. Soil Tillage Res. 1998, 47, 27–36. [Google Scholar] [CrossRef]
  35. Vandervaere, J.P.; Vauclin, M.; Elrick, D.E. Transient flow from tension infiltrometers II. Four methods to determine sorptivity and conductivity. Soil Sci. Soc. Am. J. 2000, 64, 1272–1284. [Google Scholar] [CrossRef]
  36. Zhang, R. Infiltration models for the disk infiltrometer. Soil Sci. Soc. Am. J. 1997, 61, 1597–1603. [Google Scholar] [CrossRef]
  37. Schacht, K.; Marschner, B. Treated wastewater irrigation effects on soil hydraulic conductivity and aggregate stability of loamy soils in Israel. J. Hydrol. Hydromech. 2015, 63, 47–54. [Google Scholar] [CrossRef]
  38. Gadi, V.K.; Tang, Y.R.; Das, A.; Monga, C.; Garg, A.; Berretta, C.; Sahoo, L. Spatial and temporal variation of hydraulic conductivity and vegetation growth in green infrastructures using infiltrometer and visual technique. Catena 2017, 155, 20–29. [Google Scholar] [CrossRef]
  39. Warrick, A.W. Models for disc infiltrometers. Water Resour. Res. 1992, 28, 1319–1327. [Google Scholar] [CrossRef]
  40. Haverkamp, R.; Ross, P.J.; Smettem, K.R.J.; Parlange, J.Y. Three-dimensional analysis of infiltration from the disc infiltrometer: 2. Physically based infiltration equation. Water Resour. Res. 1994, 30, 2931–2935. [Google Scholar] [CrossRef]
  41. Palomino, A.; Kim, S.; Summit, A.; Frata, D. Impact of diatoms on fabric and chemical stability of diatom-kaolin mixtures. Appl. Clay Sci. 2011, 51, 287. [Google Scholar] [CrossRef]
  42. Flower, R. Diatomites: Their formation, distribution, and uses. Earth Syst. Environ. Sci. 2013, 2, 501. [Google Scholar]
  43. Zuluaga, D.A.; Sabogal, D.; Buenaventura, C.A.; Slebi, C.J. Physical and mechanical behavior of fine soil according to the content of multispecies diatoms. J. Phys. Conf. Ser. 2021, 2118, 012011. [Google Scholar] [CrossRef]
  44. Krumbein, W.C. Measurement and geological significance of shape and roundness of sedimentary particles. J. Sediment. Res. 1941, 11, 64–72. [Google Scholar] [CrossRef]
  45. Olarte, M.C.; Ruge, J.C.; Rocha de Albuquerque, P.J. Influence of the inclusion of synthetic compounds on the plasticity of kaolinitic clays. Arab. J. Geosci. 2021, 14, 1581. [Google Scholar] [CrossRef]
  46. DIN 19683-9; Physical Laboratory Investigation, Determination of the Permeability (Hydraulic Conductivity) in Saturated Soil Sample Rings. Beuth Verlag GmbH: Berlin, Germany, 1998.
  47. DIN 18130; Foundation Ground: Investigation of Soil Samples; Determination of the Hydraulic Conductivity—Part 1. Beuth Verlag GmbH: Berlin, Germany, 1998.
  48. Klute, A.; Dirksen, C. Hydraulic conductivity and diffusivity: Laboratory methods. Methods Soil Anal. Part 1 Phys. Miner. Methods 1986, 5, 687–734. [Google Scholar]
  49. Dirksen, C. Soil Physics Measurements; Catena Verlag: Reiskirchen, Germany, 1999. [Google Scholar]
  50. Zhang, R. Determination of soil sorptivity and hydraulic conductivity from the disk infiltrometer. Soil Sci. Soc. Am. J. 1997, 61, 1024–1030. [Google Scholar] [CrossRef]
  51. Carsel, R.F.; Parrish, R.S. Developing joint probability distributions of soil water retention characteristics. Water Resour. Res. 1988, 24, 755–769. [Google Scholar] [CrossRef]
  52. Dane, J.H.; Topp, G.C. Methods of Soil Analysis Part 4—Physical Methods; Soil Science Society of America: Madison, WI, USA, 2002. [Google Scholar]
  53. Terzaghi, K.; Peck, R.B. Soil Mechanics in Engineering Practice, 2nd ed.; John Wiley and Sons: New York, NY, USA, 1948. [Google Scholar]
  54. Lambe, T.W.; Lambe, R.V. Soil Mechanics; John Wiley & Sons: New York, NY, USA; MIT: Cambridge, MA, USA, 1991. [Google Scholar]
  55. Kenney, T.C.; Lau, D.; Ofoegbu, G.I. Permeability of compacted granular materials. Can. Geotech. J. 1984, 21, 726–729. [Google Scholar] [CrossRef]
  56. Ahmed, A.; Hossain, S. Field Determination of Unsaturated Permeability and Flow Properties through Subgrade Instrumentation. Geosciences 2022, 12, 95. [Google Scholar] [CrossRef]
  57. Fattah, M.; Mahmood, A.; Nawar, A. Prediction of Coefficient of Permeability of Unsaturated Soil. J. Eng. 2014, 20, 33–48. [Google Scholar]
  58. Kai, L.; Xu, L.; Stroeven, P.; Shi, C. Water permeability of unsaturated cementitious materials: A review. Constr. Build. Mater. 2021, 302, 124168. [Google Scholar]
  59. Mualem, Y. Anisotropy of unsaturated soils. Soil Sci. Soc. Am. J. 1984, 48, 505–509. [Google Scholar] [CrossRef]
  60. Dabney, S.M.; Selim, H.M. Anisotropy of a fragipan soil: Vertical vs. horizontal hydraulic conductivity. Soil Sci. Soc. Am. J. 1987, 51, 3–6. [Google Scholar] [CrossRef]
  61. Bronswijk, J.J.B. Shrinkage geometry of a heavy clay soil at various stresses. Soil Sci. Soc. Am. J. 1990, 54, 1500–1502. [Google Scholar] [CrossRef]
  62. Pagliai, M.; Vignozzi, N.; Pellegrini, S. Soil Structure and the effect of management practices. Soil Tillage Res. 2004, 79, 131–143. [Google Scholar] [CrossRef]
  63. Dörner, J.; Horn, R. Anisotropy of pore functions in structured Stagnic Luvisols in the Weichselian moraine region in N. Germany. J. Plant Nutr. Soil Sci. 2006, 169, 213–220. [Google Scholar] [CrossRef]
  64. Peng, X.; Horn, R. Anisotropic shrinkage and swelling of some organic and inorganic soils. Eur. J. Soil Sci. 2007, 58, 98–107. [Google Scholar] [CrossRef]
  65. Peng, X.; Horn, R. Time-dependent, anisotropic pore structure and soil strength in a 10-year period after intensive tractor wheeling under conservation and conventional tillage. J. Plant Nutr. Soil Sci. 2008, 171, 936–944. [Google Scholar] [CrossRef]
  66. Zhou, C.; Chen, R. Modelling the water retention behaviour of anisotropic soils. J. Hydrol. 2021, 599, 126361. [Google Scholar] [CrossRef]
  67. Gutierrez, H.; de la Vara, R. Analisis y Diseño de Experimentos, 3rd ed.; McGrawHill: Mexico City, Mexico, 2012. [Google Scholar]
  68. Nazari, S.; Hassanlourad, E.; Chavoshi, E.; Mirzaii, A. Experimental Investigation of Unsaturated Silt-Sand Soil Permeability. Adv. Civ. Eng. 2018, 2018, 4946956. [Google Scholar] [CrossRef]
  69. Galvis-Velasco, L.C.; Ruge, J.C.; Galvis-Salamanca, L.C.; Pulgarín-Morales, L.; Bastidas-Martínez, J.G.; Olarte, M.C. Permeability measurement in porous media under unsaturated paths. Dyna 2021, 88, 123–130. [Google Scholar] [CrossRef]
Figure 1. Permeameters used in the study: (a) falling-head; (b) constant-head; (c) automated permeameter.
Applsci 12 09058 g001
Figure 2. Mini-disk infiltrometer.
Applsci 12 09058 g002
Figure 3. Particle size distribution of sand from Guamo.
Applsci 12 09058 g003
Figure 4. Particle size distribution of diatoms, ferric oxide, and calcium carbonate.
Applsci 12 09058 g004
Figure 5. Graph cumulative infiltration vs. square root of the time.
Applsci 12 09058 g005
Figure 6. Results of unsaturated permeability coefficient for different suction values.
Applsci 12 09058 g006
Figure 7. Saturated and unsaturated permeability coefficient results for different proportions of materials.
Applsci 12 09058 g007
Table 1. Gravity and loose unit weight of granular materials.
MaterialGsLoose Unit Weight (g/cm3)
Guamo Sand2.701.41
Table 2. Permeability characteristics and hydraulic conductivity [47].
Water Permeability Characteristics
Characteristicks (m/s)
Very highly permeable>10−2
Highly permeable10−2–10−4
Permeable10−4–10−6 *
Slightly permeable10−6–10−8
Very weakly permeable<10−8
Hydraulic conductivity
Materialks (m/s)
Gravel10−1–10−2
Coarse sand≅10−3
Medium-grained sand10−3–10−4
Fine-grained sand10−4–10−5
Silty sand10−5–10−7
Silty clay10−6–10−9 *
Clay<10−9
* There is a theoretical transition between permeable and an “impervious” soil which occurs near a ks value of 10−6 m/s.
Table 3. Values of Van Genuchten parameter A for different types of soils.
Materialho (cm)
Guamo sand−1−2−3−4−5
AAAAA
2.401.731.240.890.64
Guamo sand + Diat.3.893.913.933.953.98
Guamo sand + Fe2O33.893.913.933.953.98
Guamo sand + CaCO33.893.913.933.953.98
Table 4. Saturated permeability results by KSAT and conventional permeameter.
MaterialSampleInitial Height (cm)Final Height
(cm)
ks (cm/s)Std. Dev.
Guamo Sand + Diatomites100%160500.024160.00481
5–95%0.023900.00119
10–90%0.016480.00062
20–80%0.009160.00011
40–60%0.000860.00005
Guamo Sand + Fe2O3100%160500.024160.00481
5–95%0.021920.00105
10–90%0.012760.00099
20–80%0.000880.00006
40–60%0.000090.000002
Guamo Sand + CaCO3100%160500.024160.00481
5–95%0.015990.00095
10–90%0.013700.00092
20–80%0.000430.00043
40–60%0.000060.000003
Publisher’s Note: MDPI stays neutral with regard to jurisdictional claims in published maps and institutional affiliations.

