

Numerical Study on the Effect of Deposit Layer on the Minimum Wall Thickness of Boiler Water Tube under Different Operating Conditions


Abstract
:1. Introduction
2. Methodology
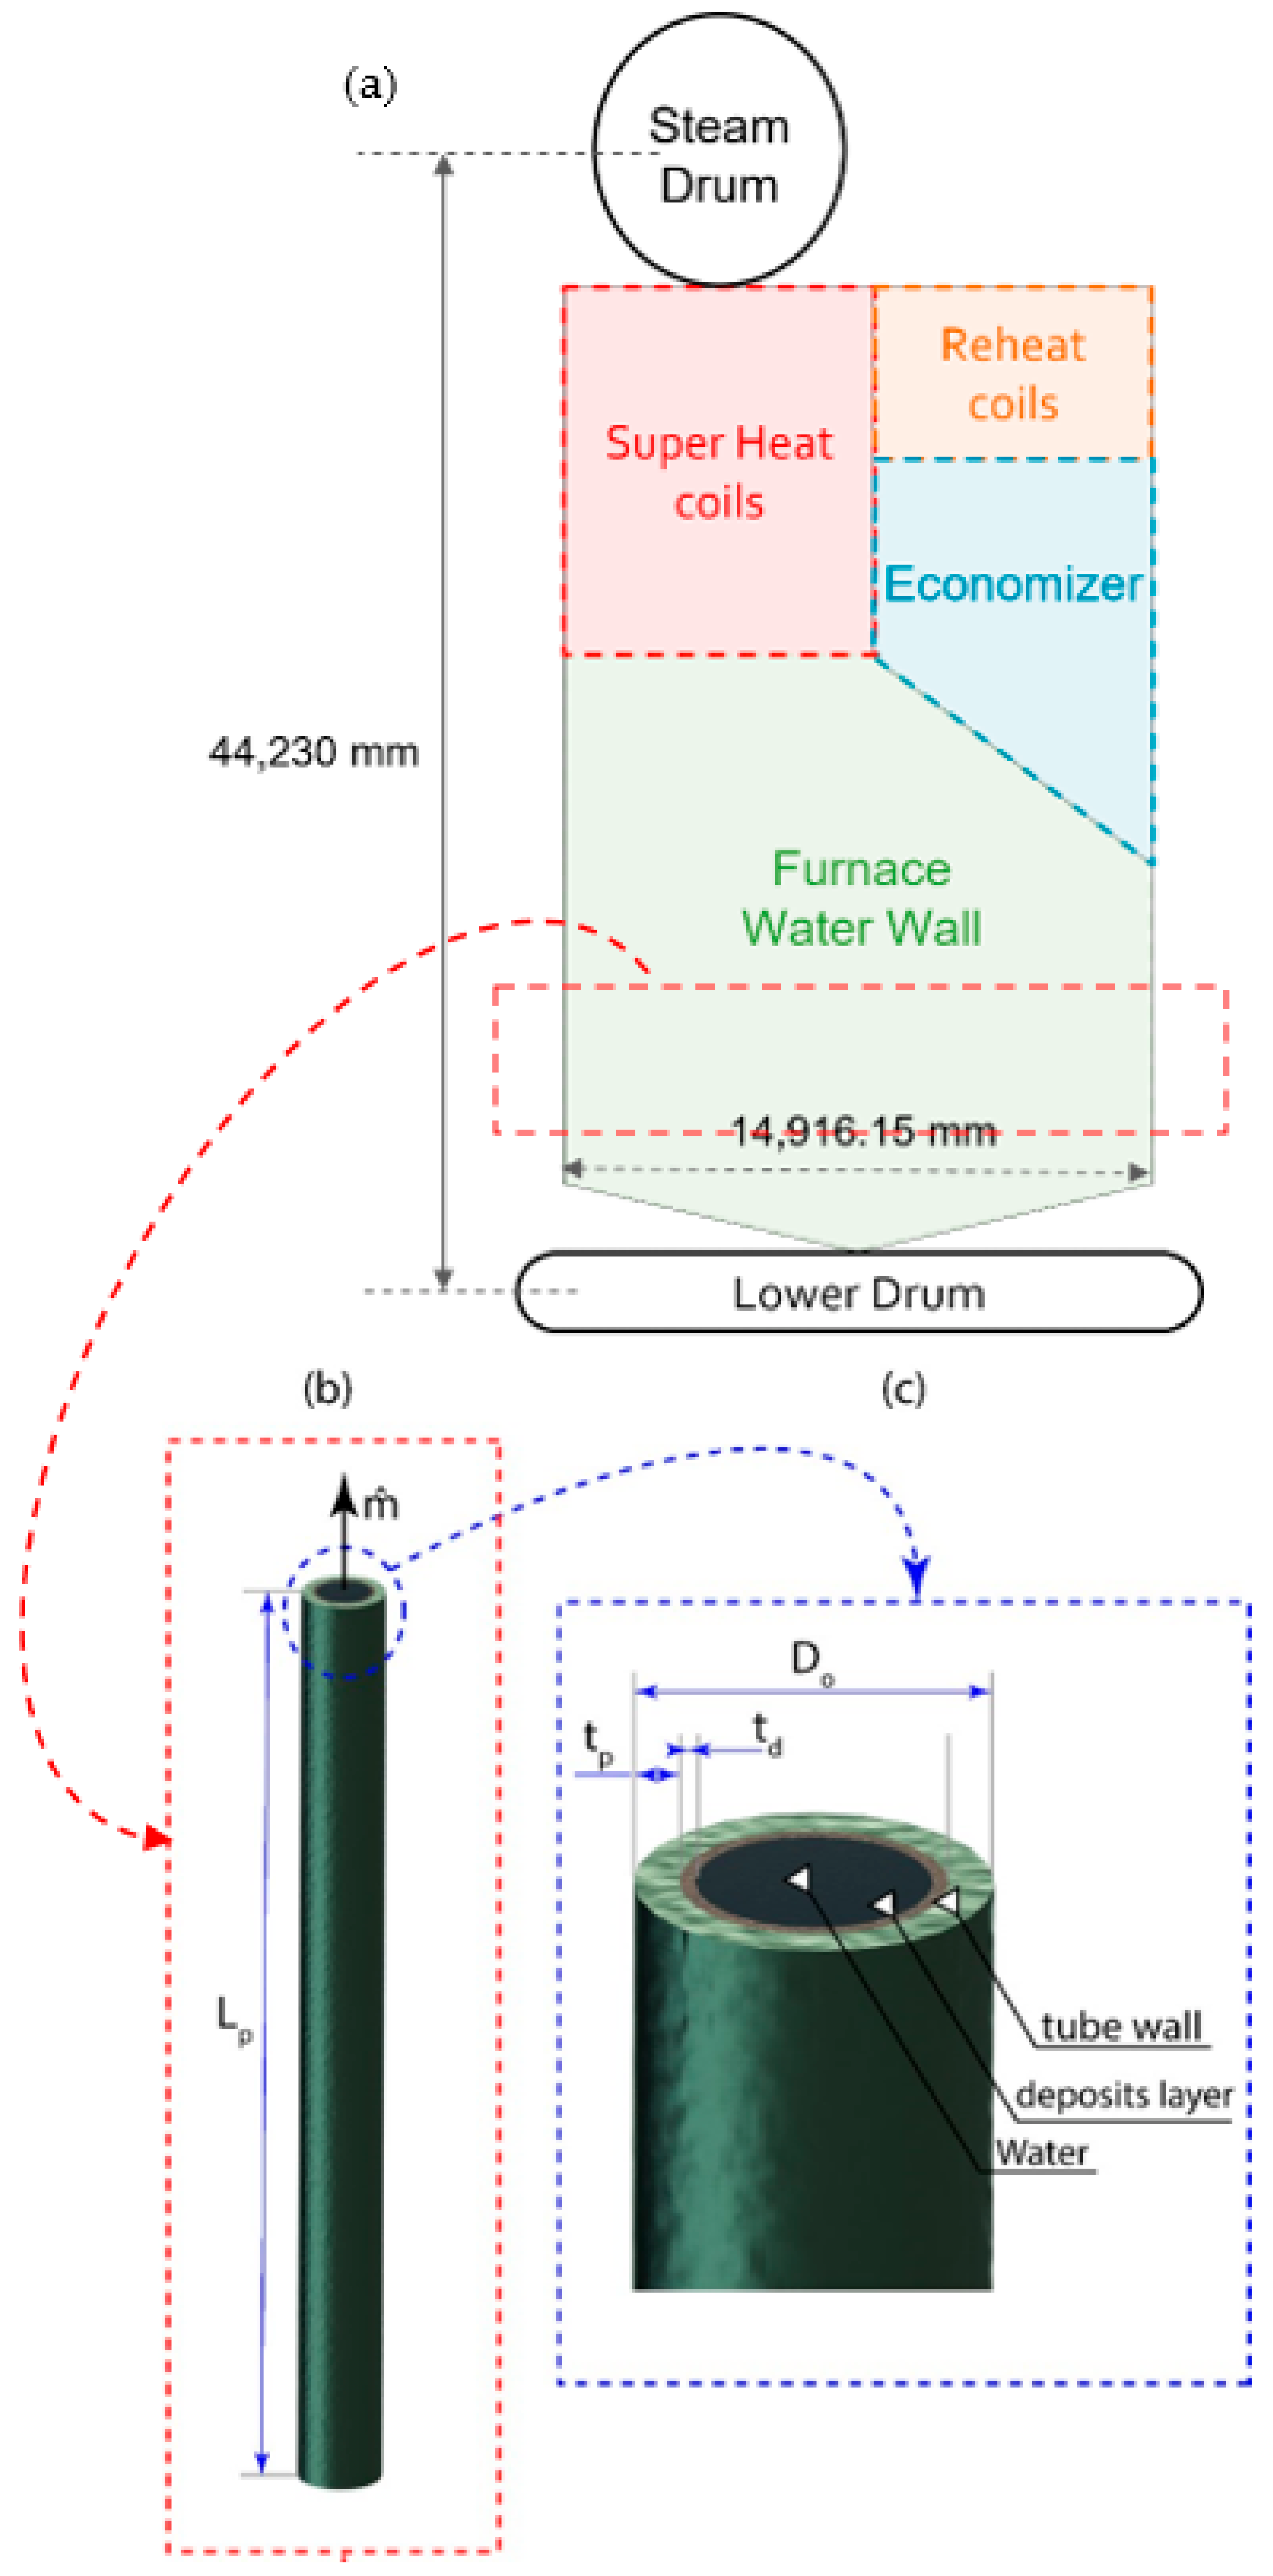
2.1. Physical Model
2.2. Numerical Model
2.2.1. Governing Equations
Solid Regions: Tube Wall and Deposit Layer
- Conservation of Energy:
Fluid Region
- Conservation of mass and momentum:
- Turbulence Model: Realizable k-ε turbulent model
- Conservation of Energy:
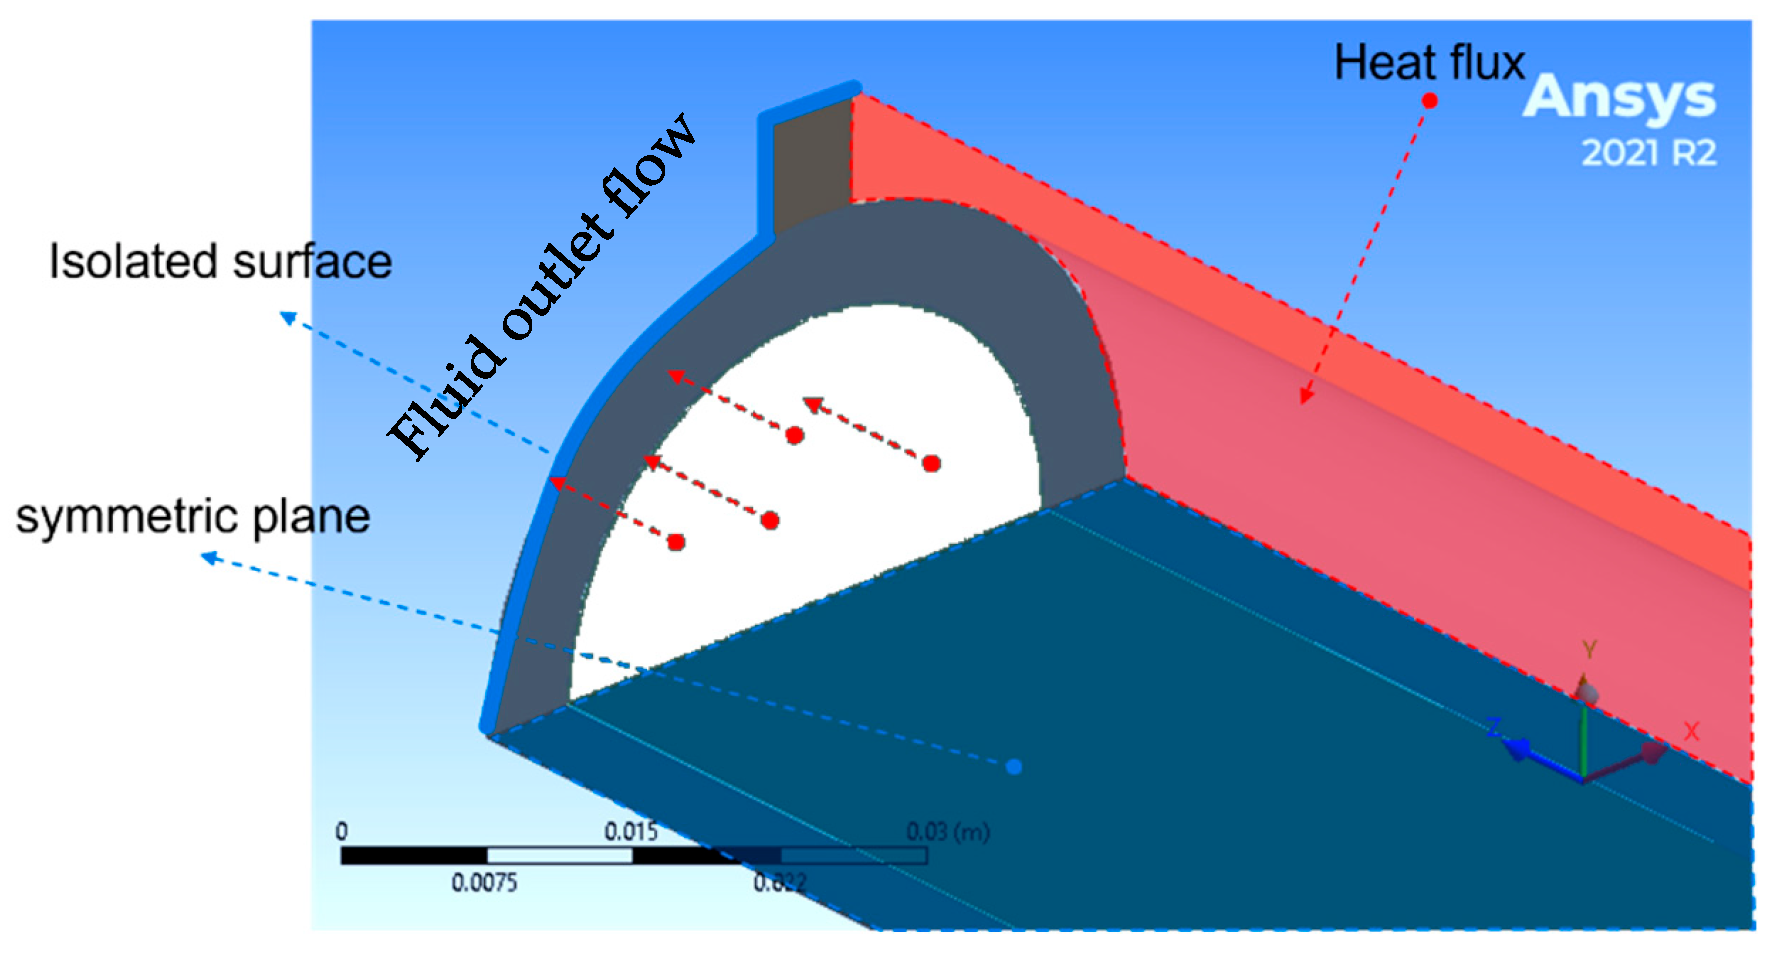
2.2.2. Boundary Conditions
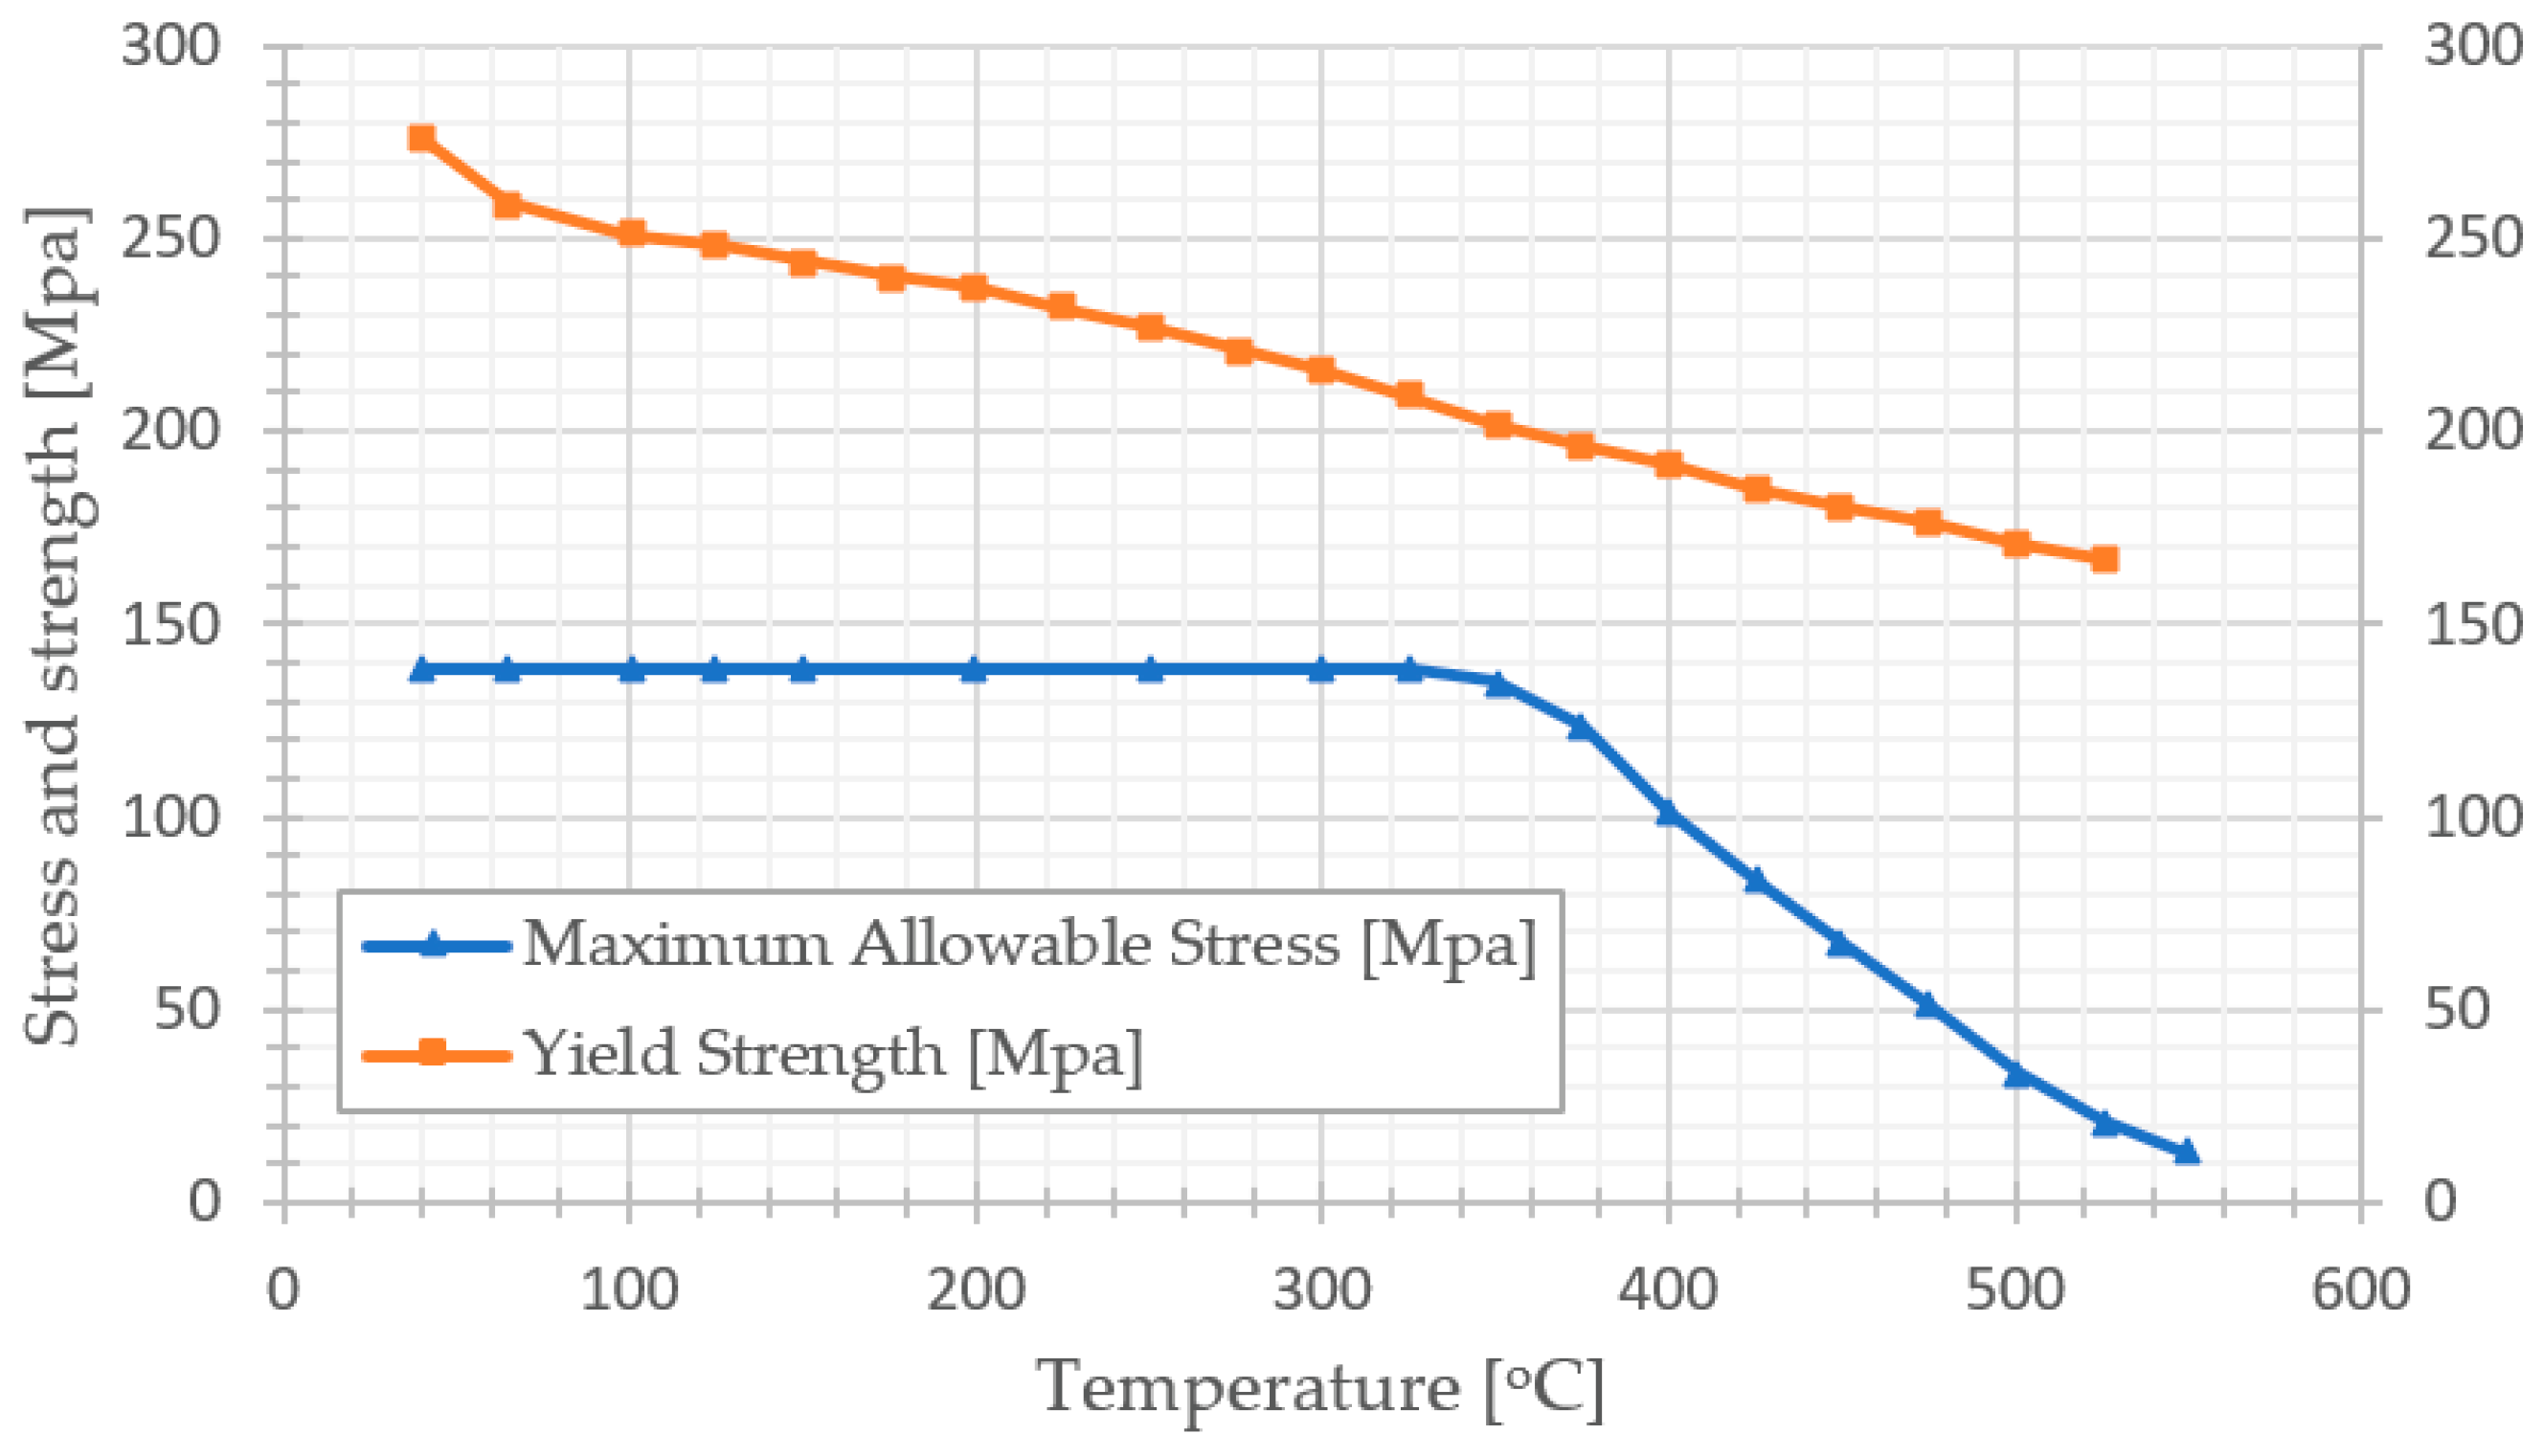
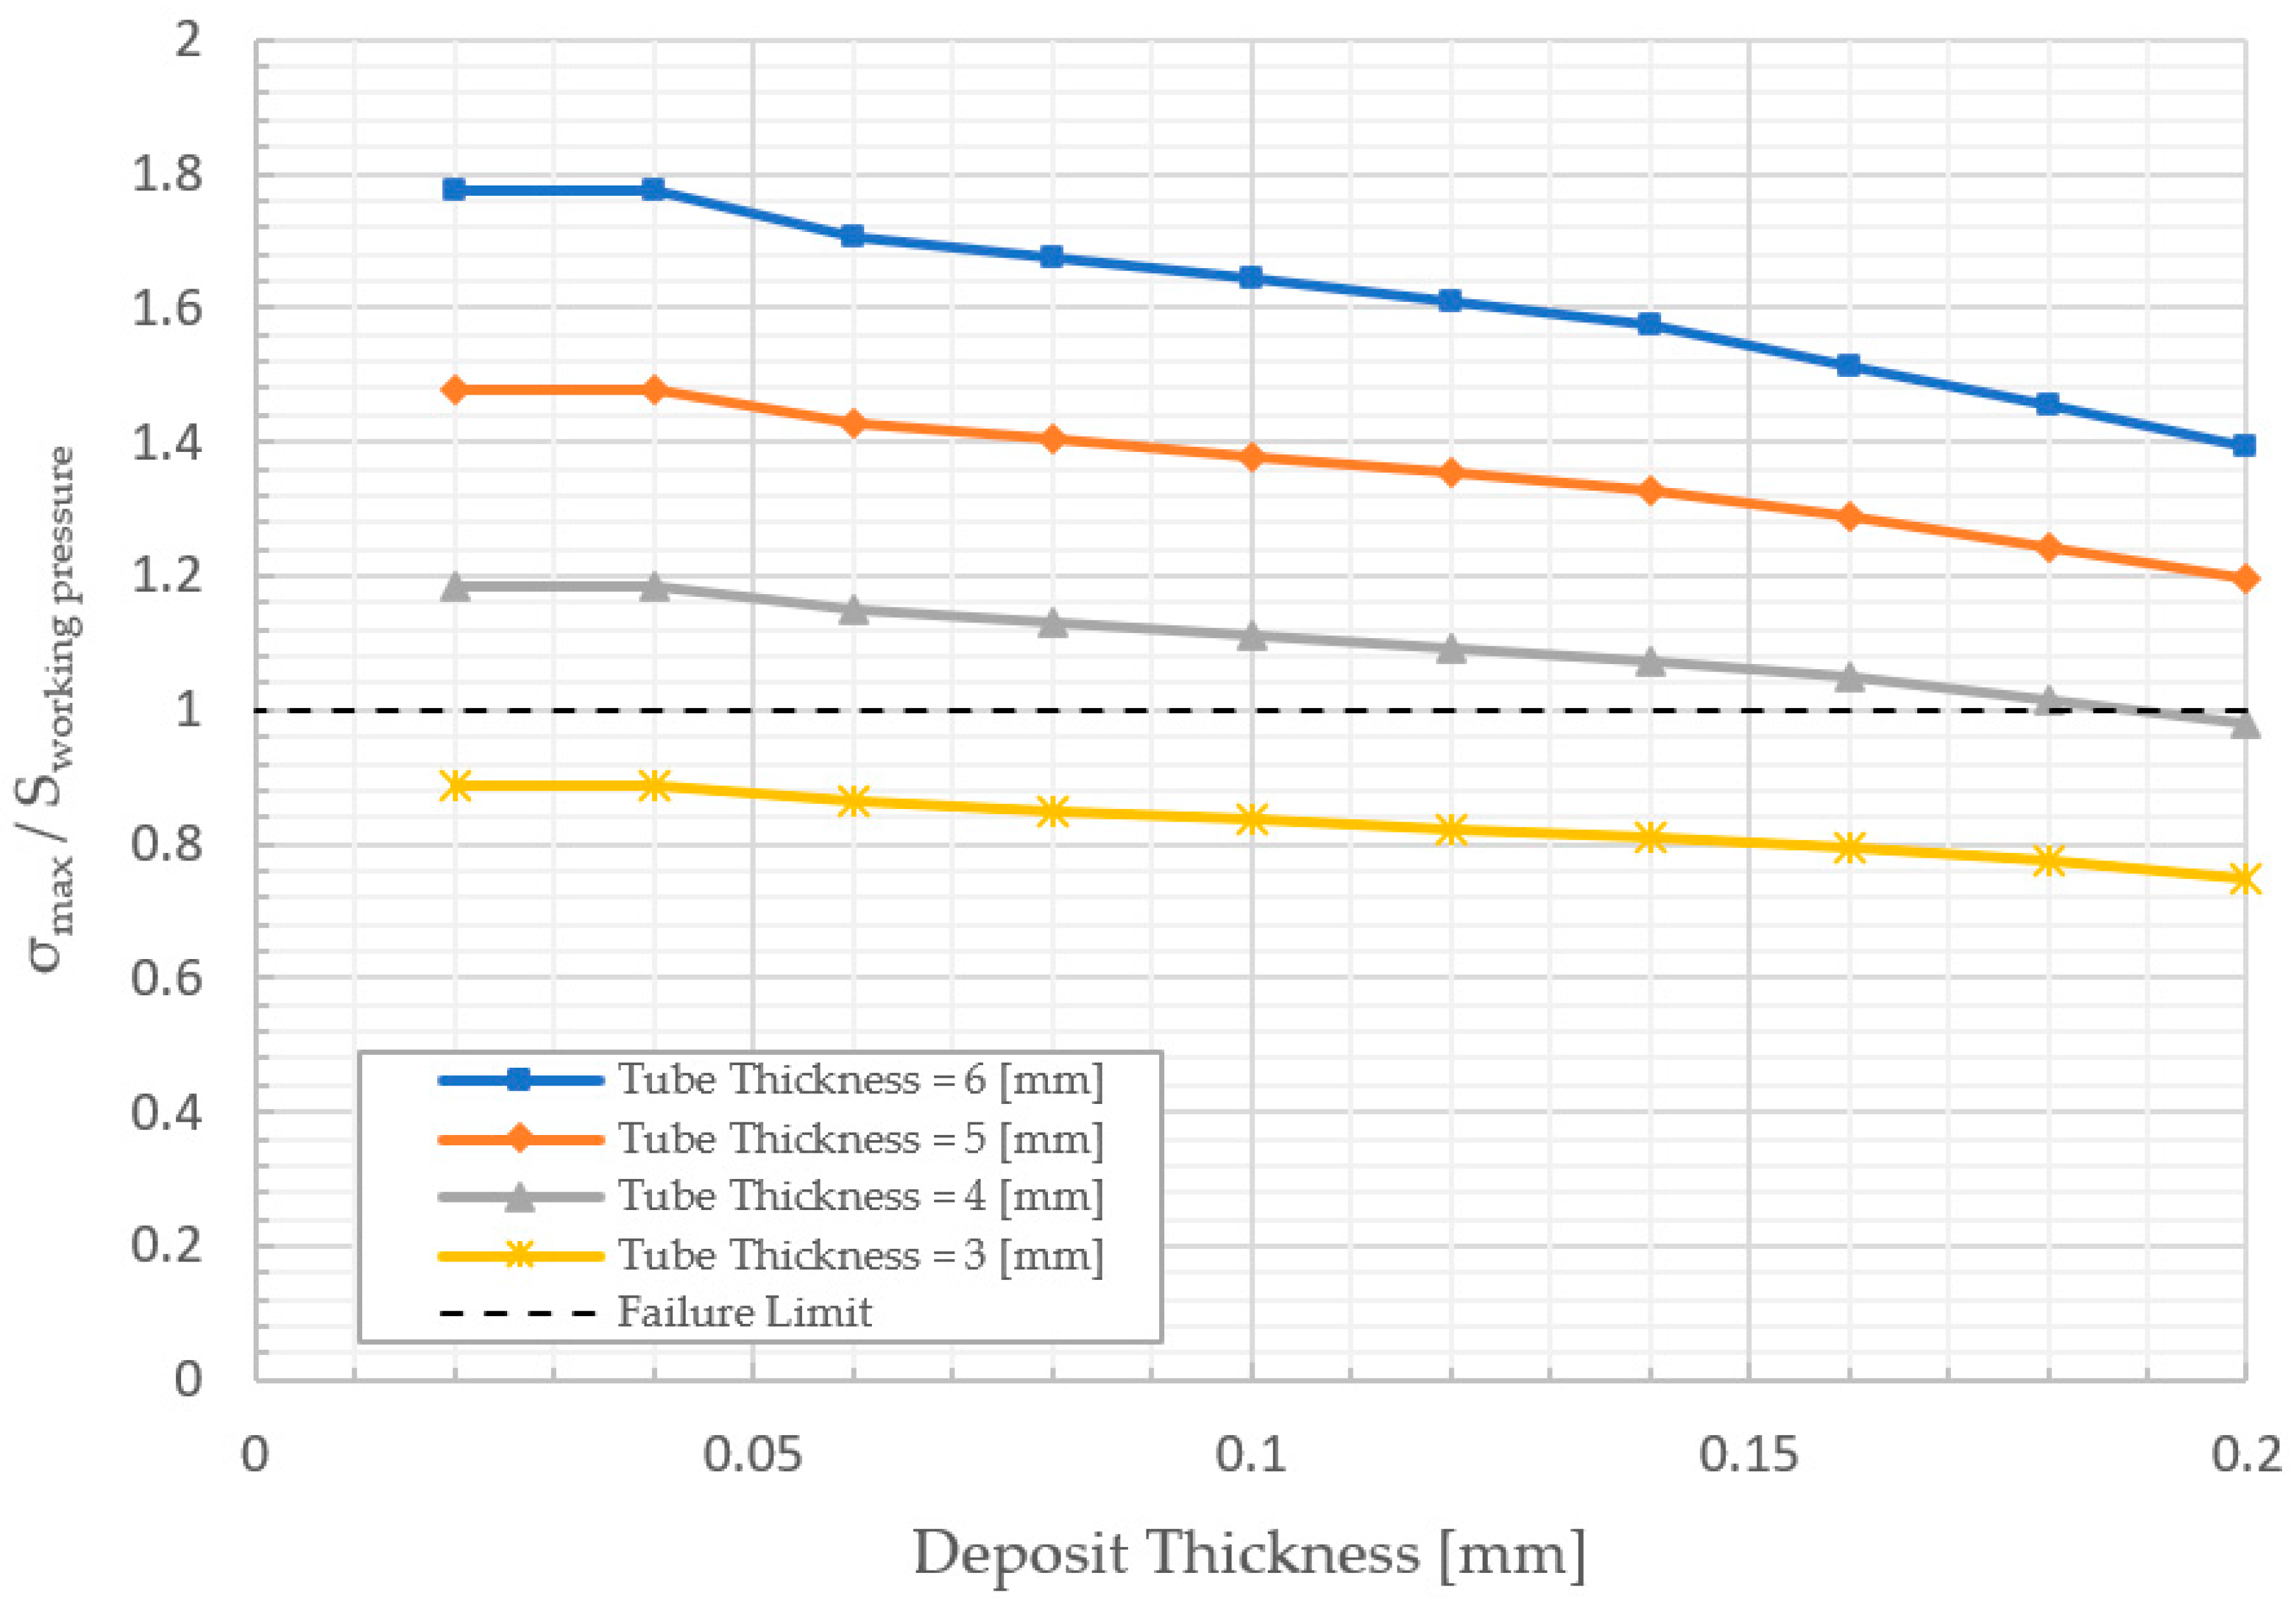
2.2.3. Minimum Tube Thickness Calculations (ASME)
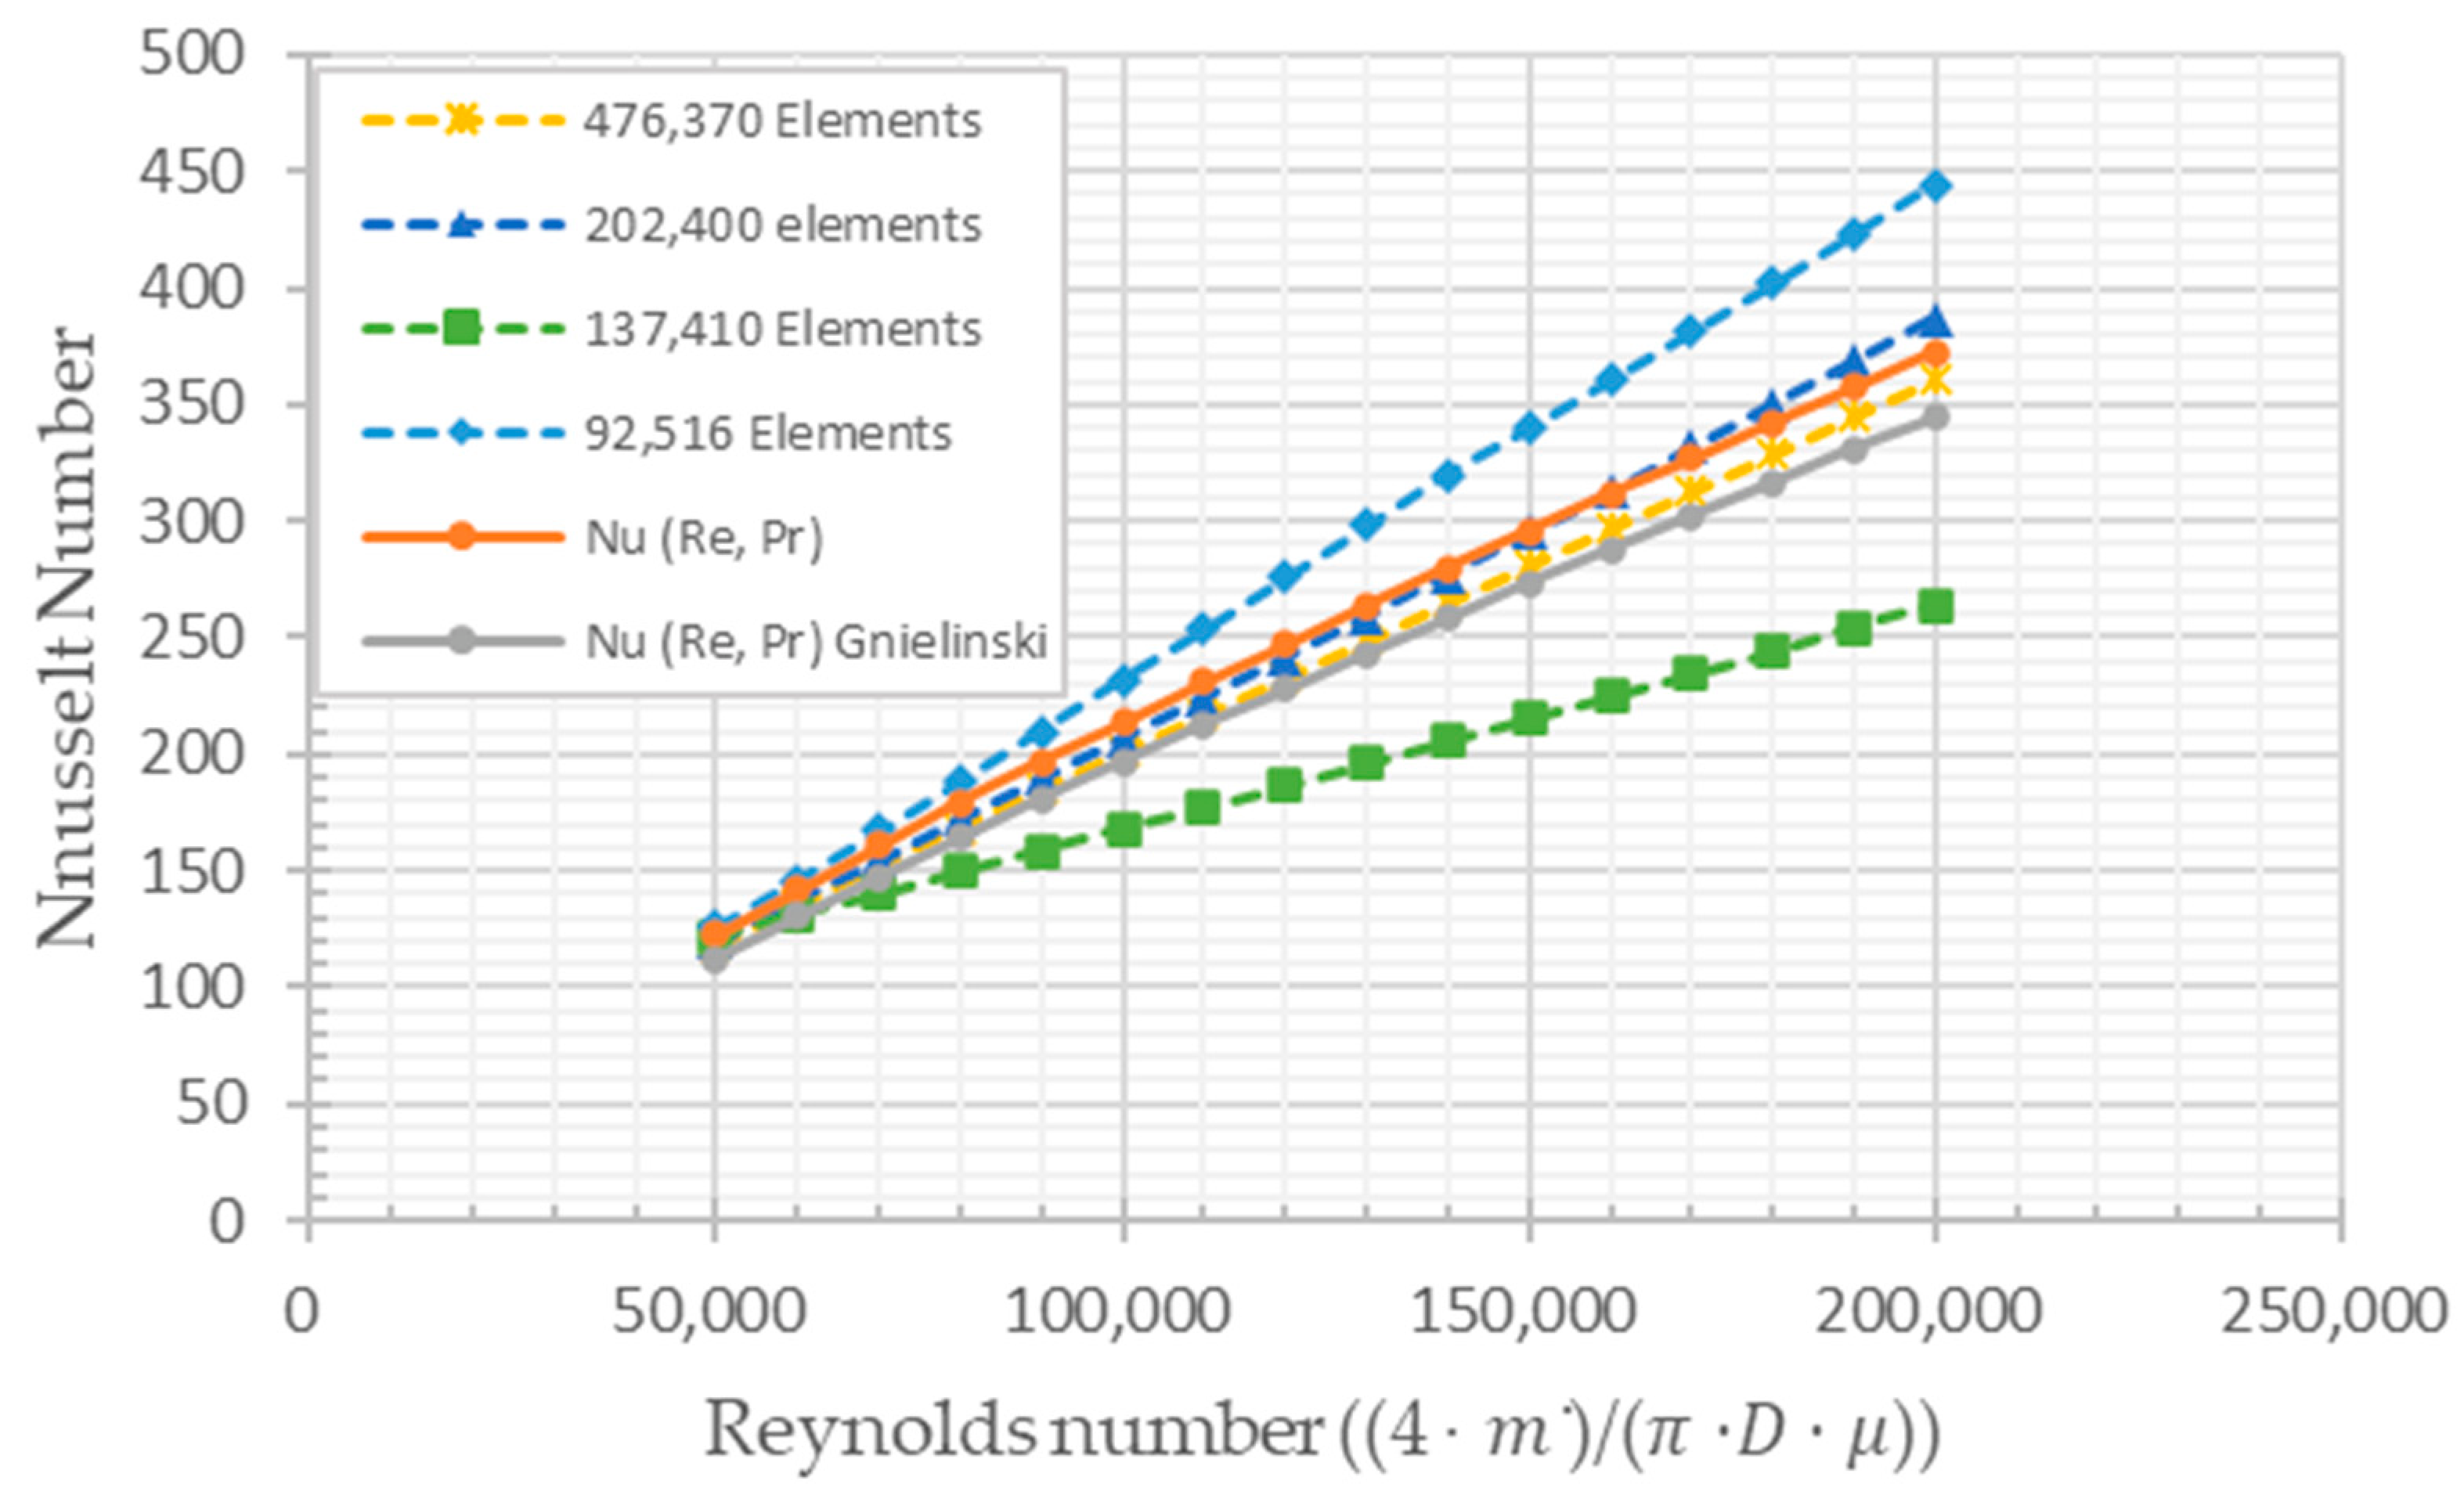
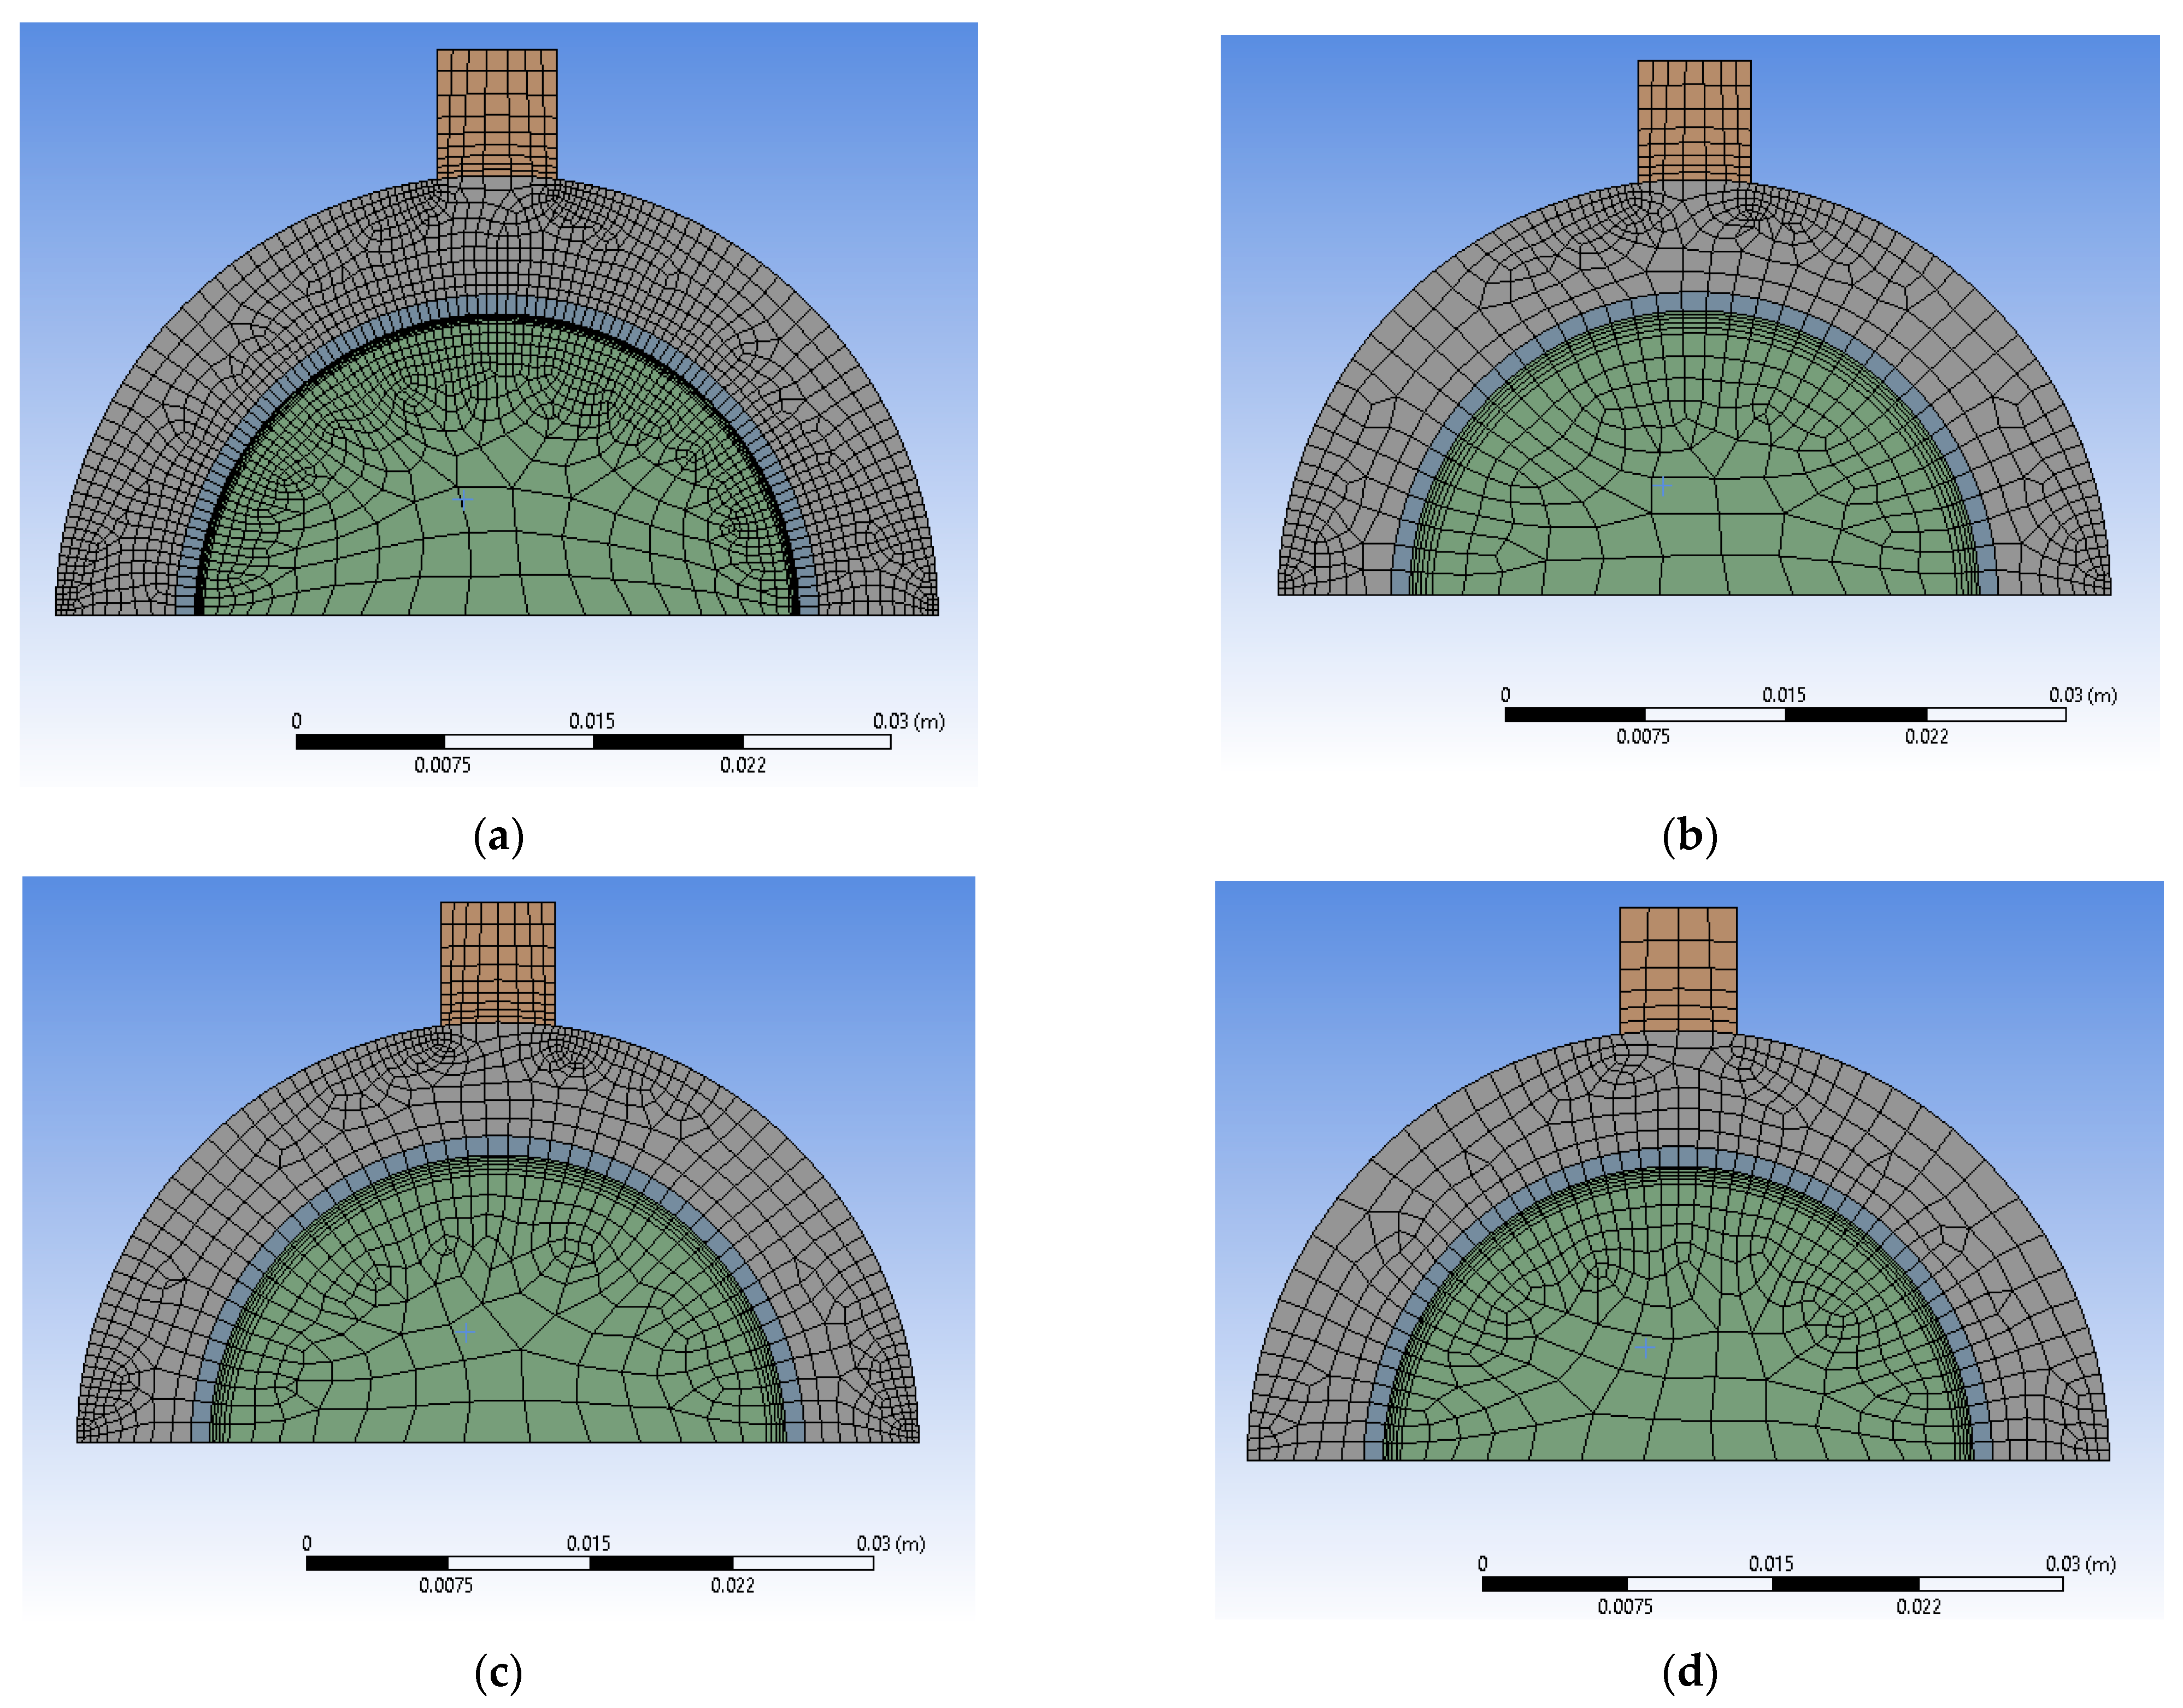
2.3. Numerical Solution and Model Verification
3. Results and Discussion
4. Conclusions
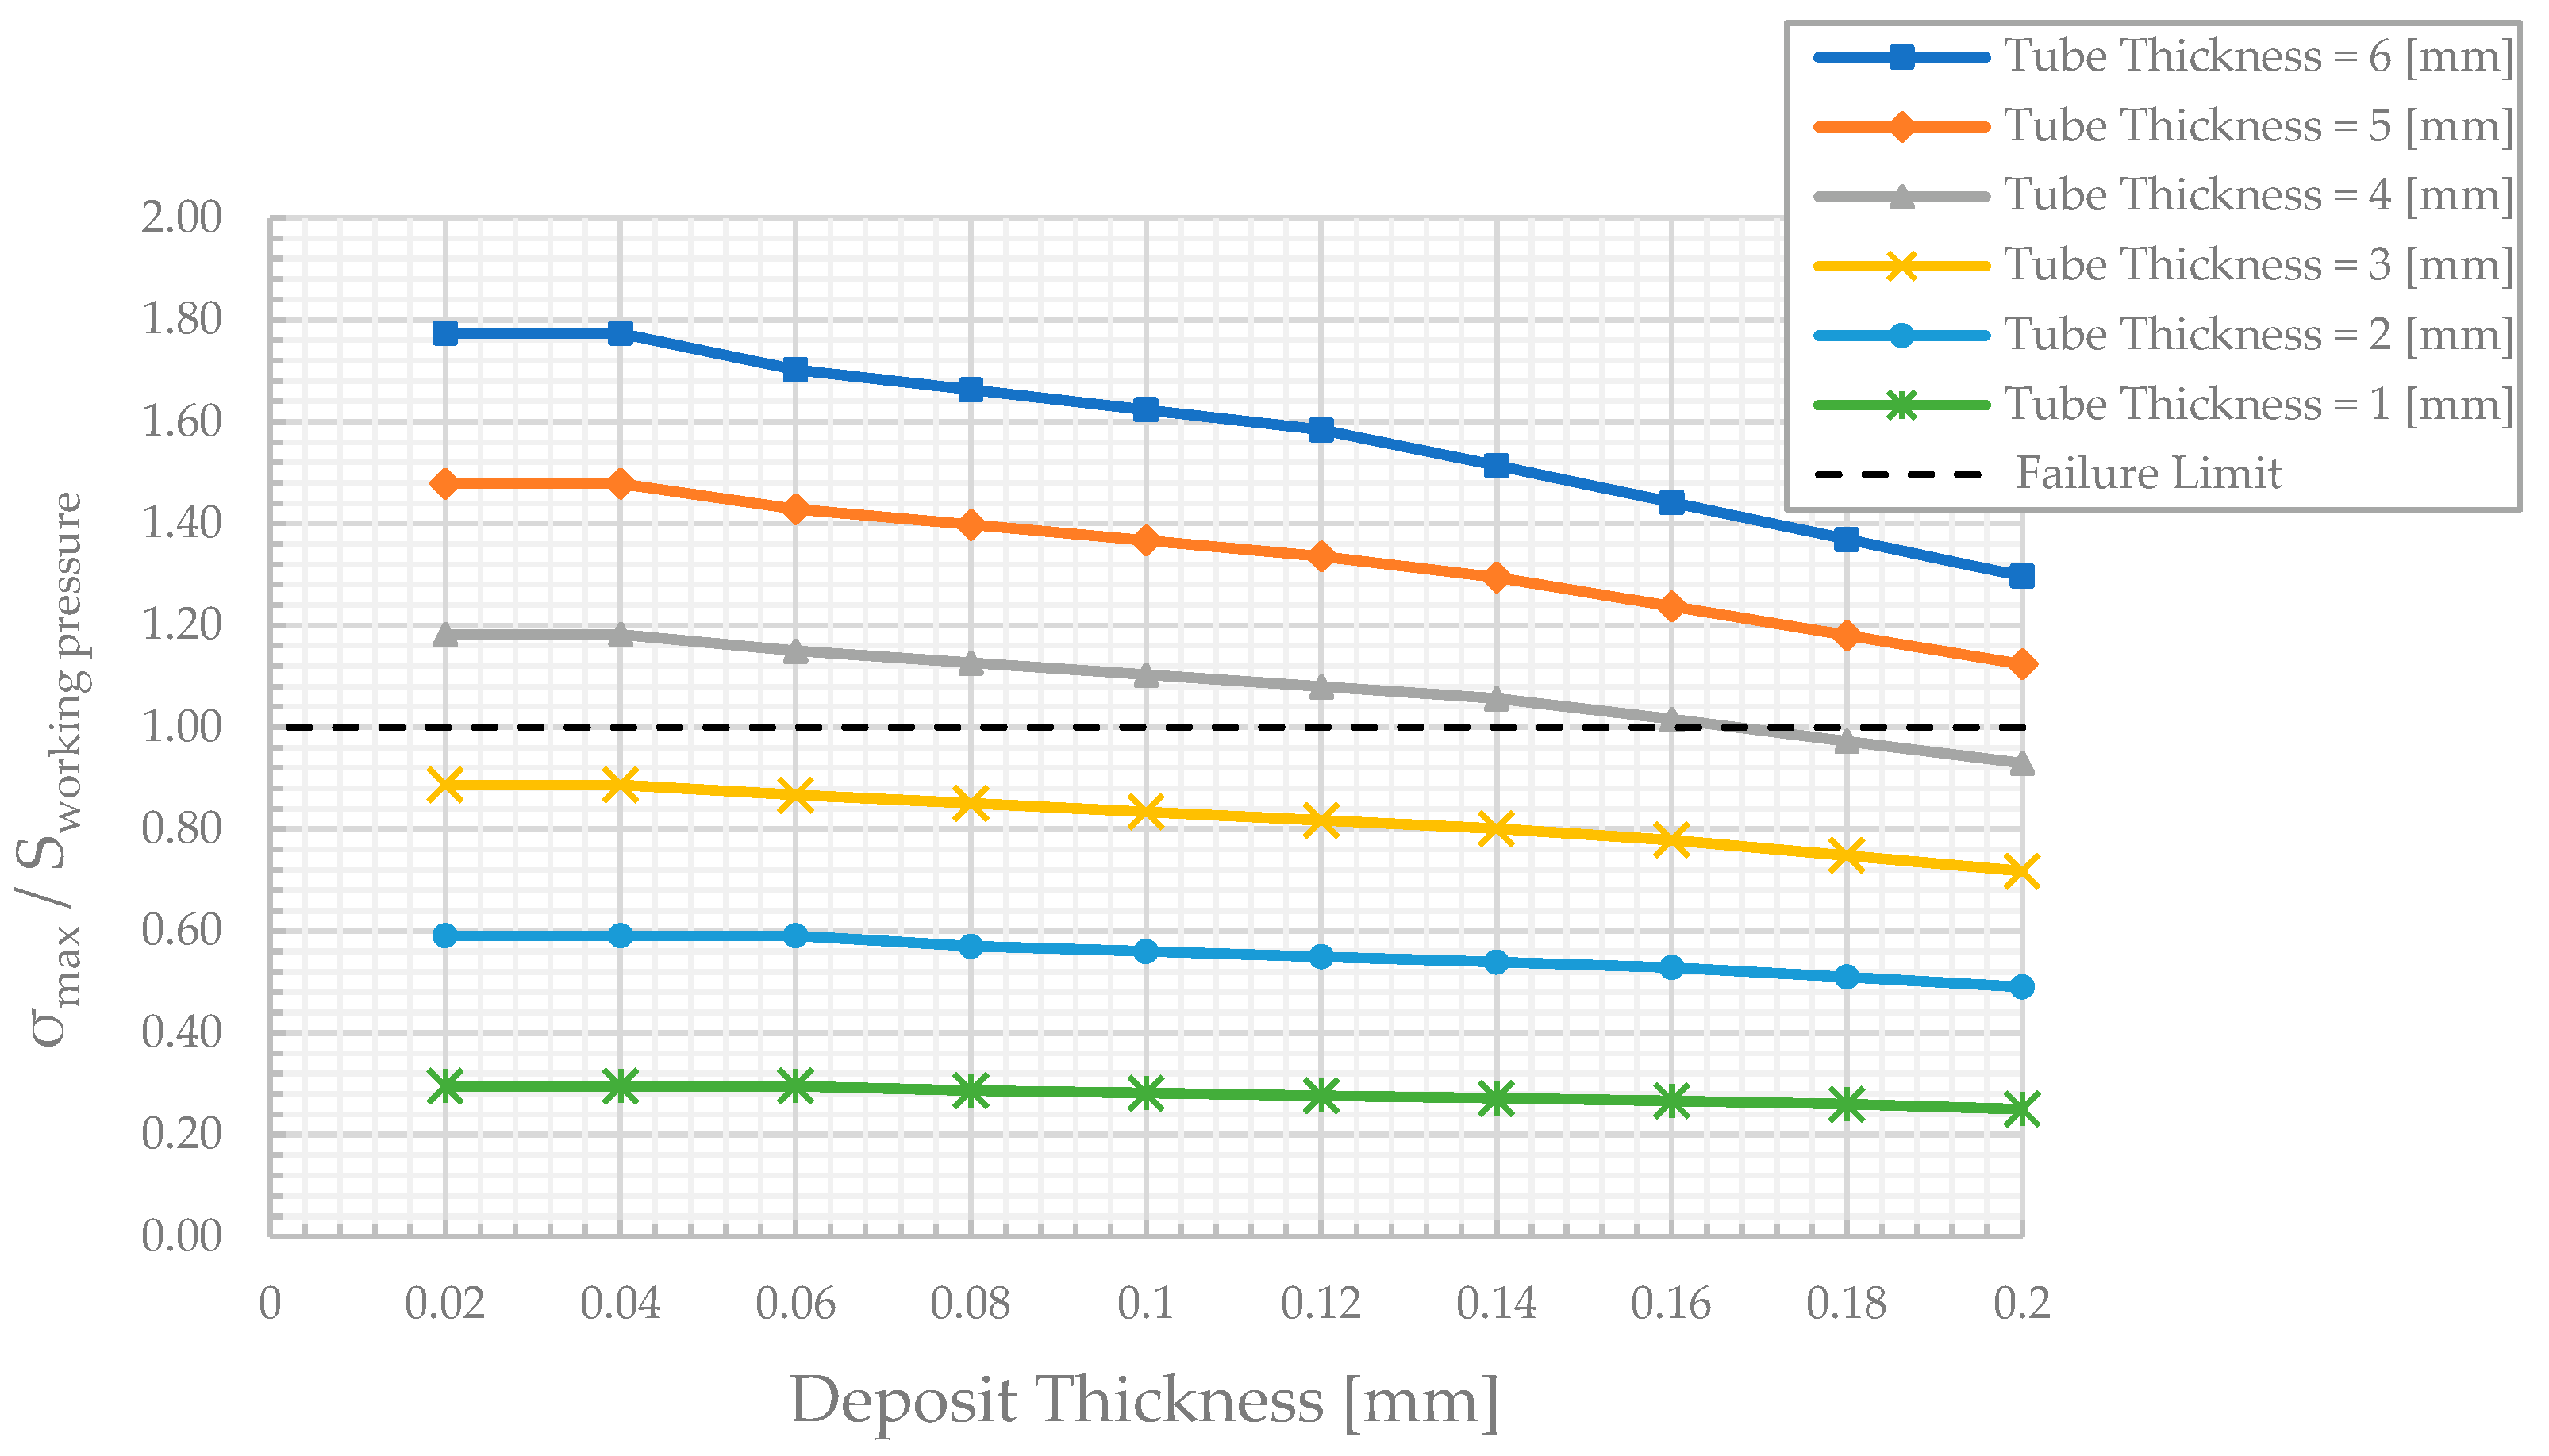
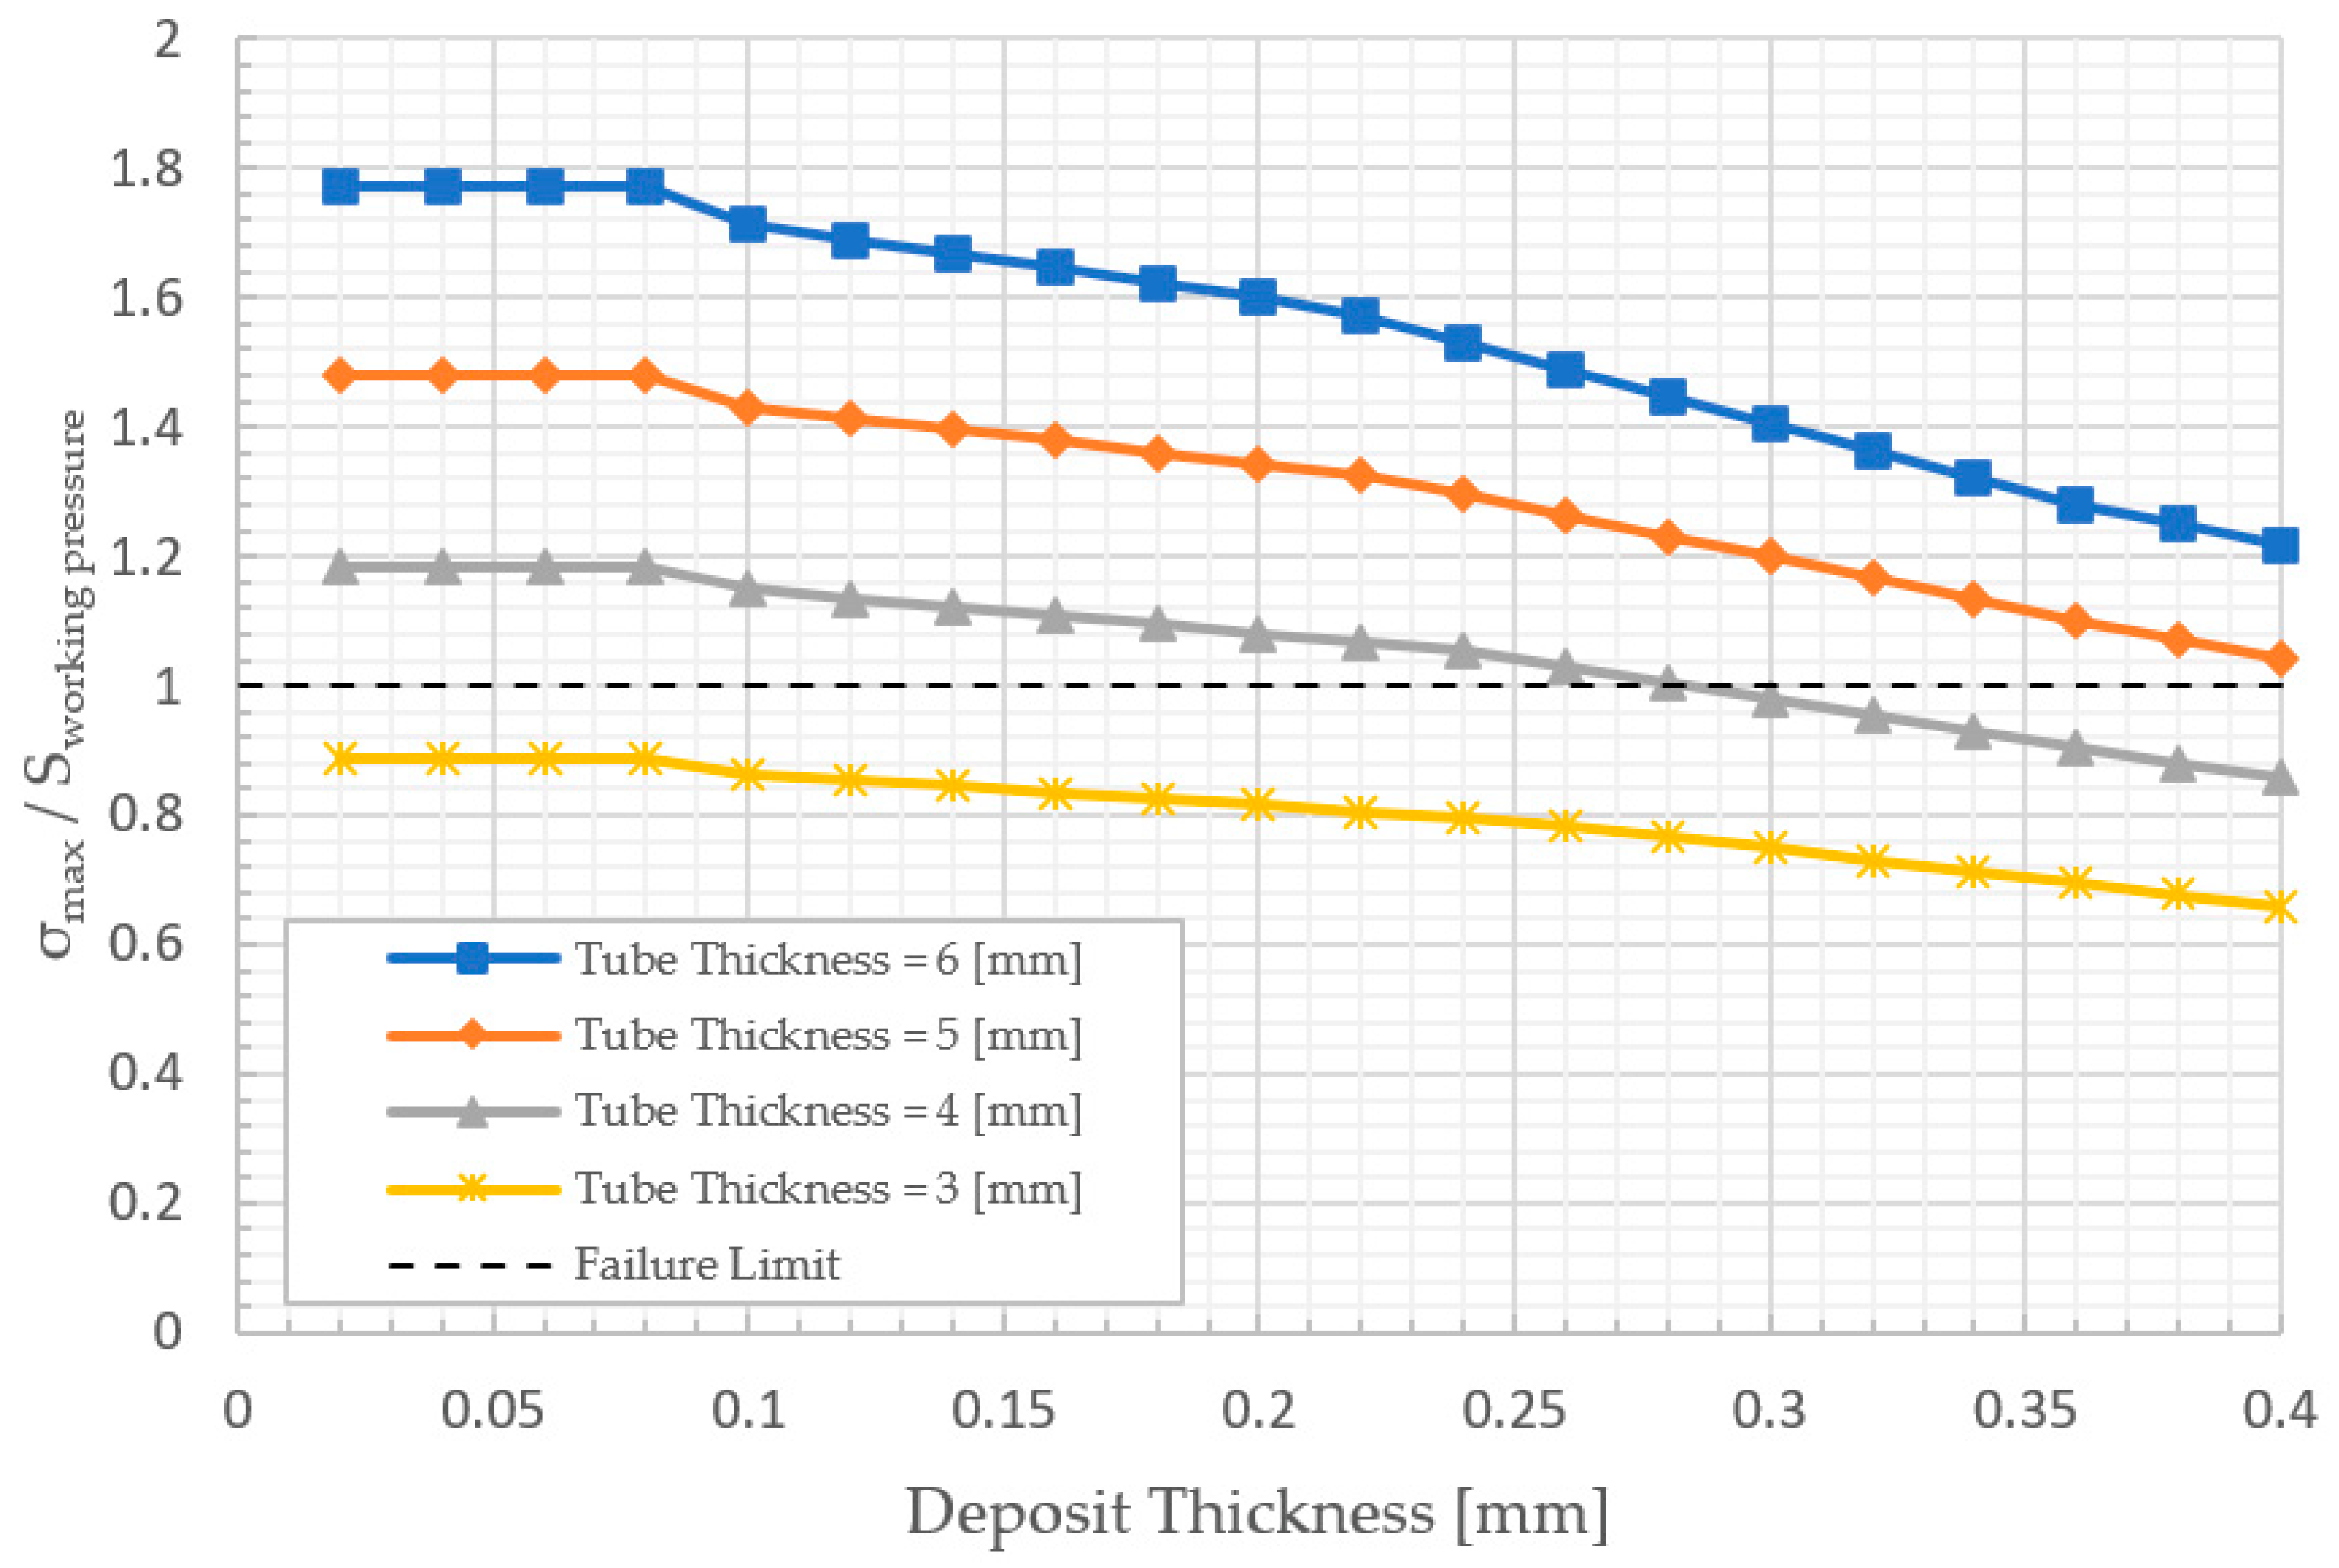
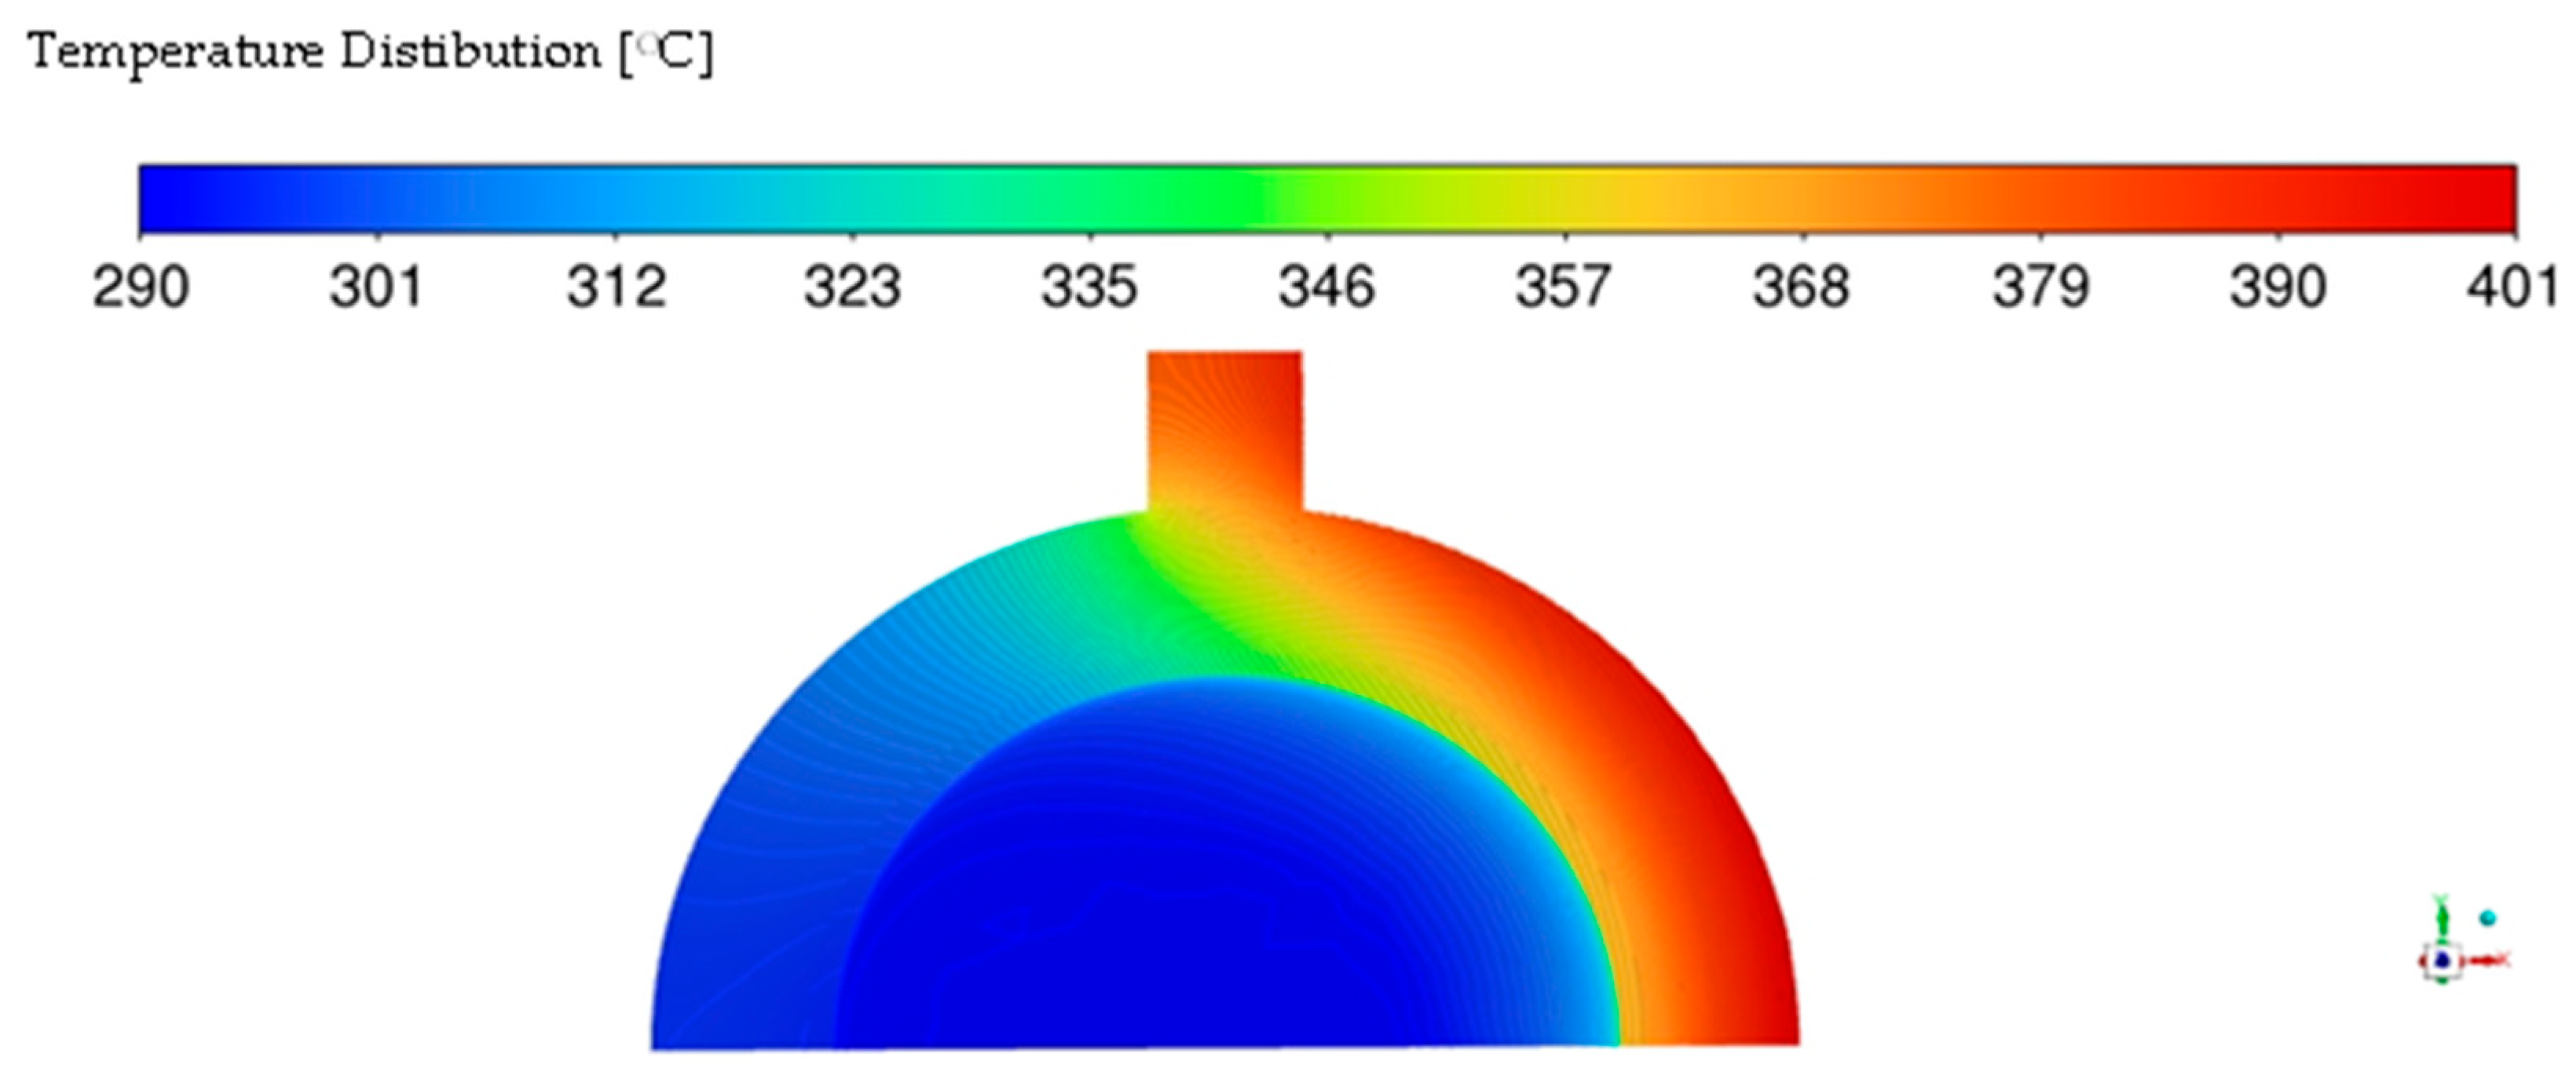
- The thermal conductivity of deposits affects the maximum temperature of the tubes. Consequently, the high potential for overheating, particularly at the deposit layer with thermal conductivity is 0.625 W/m2 K. The maximum crown temperature exceeds 495 °C at 100% load in the 6 mm tube thickness with deposit thickness of 0.2 mm, which is near the maximum temperature of 539 °C of SA-210 C.
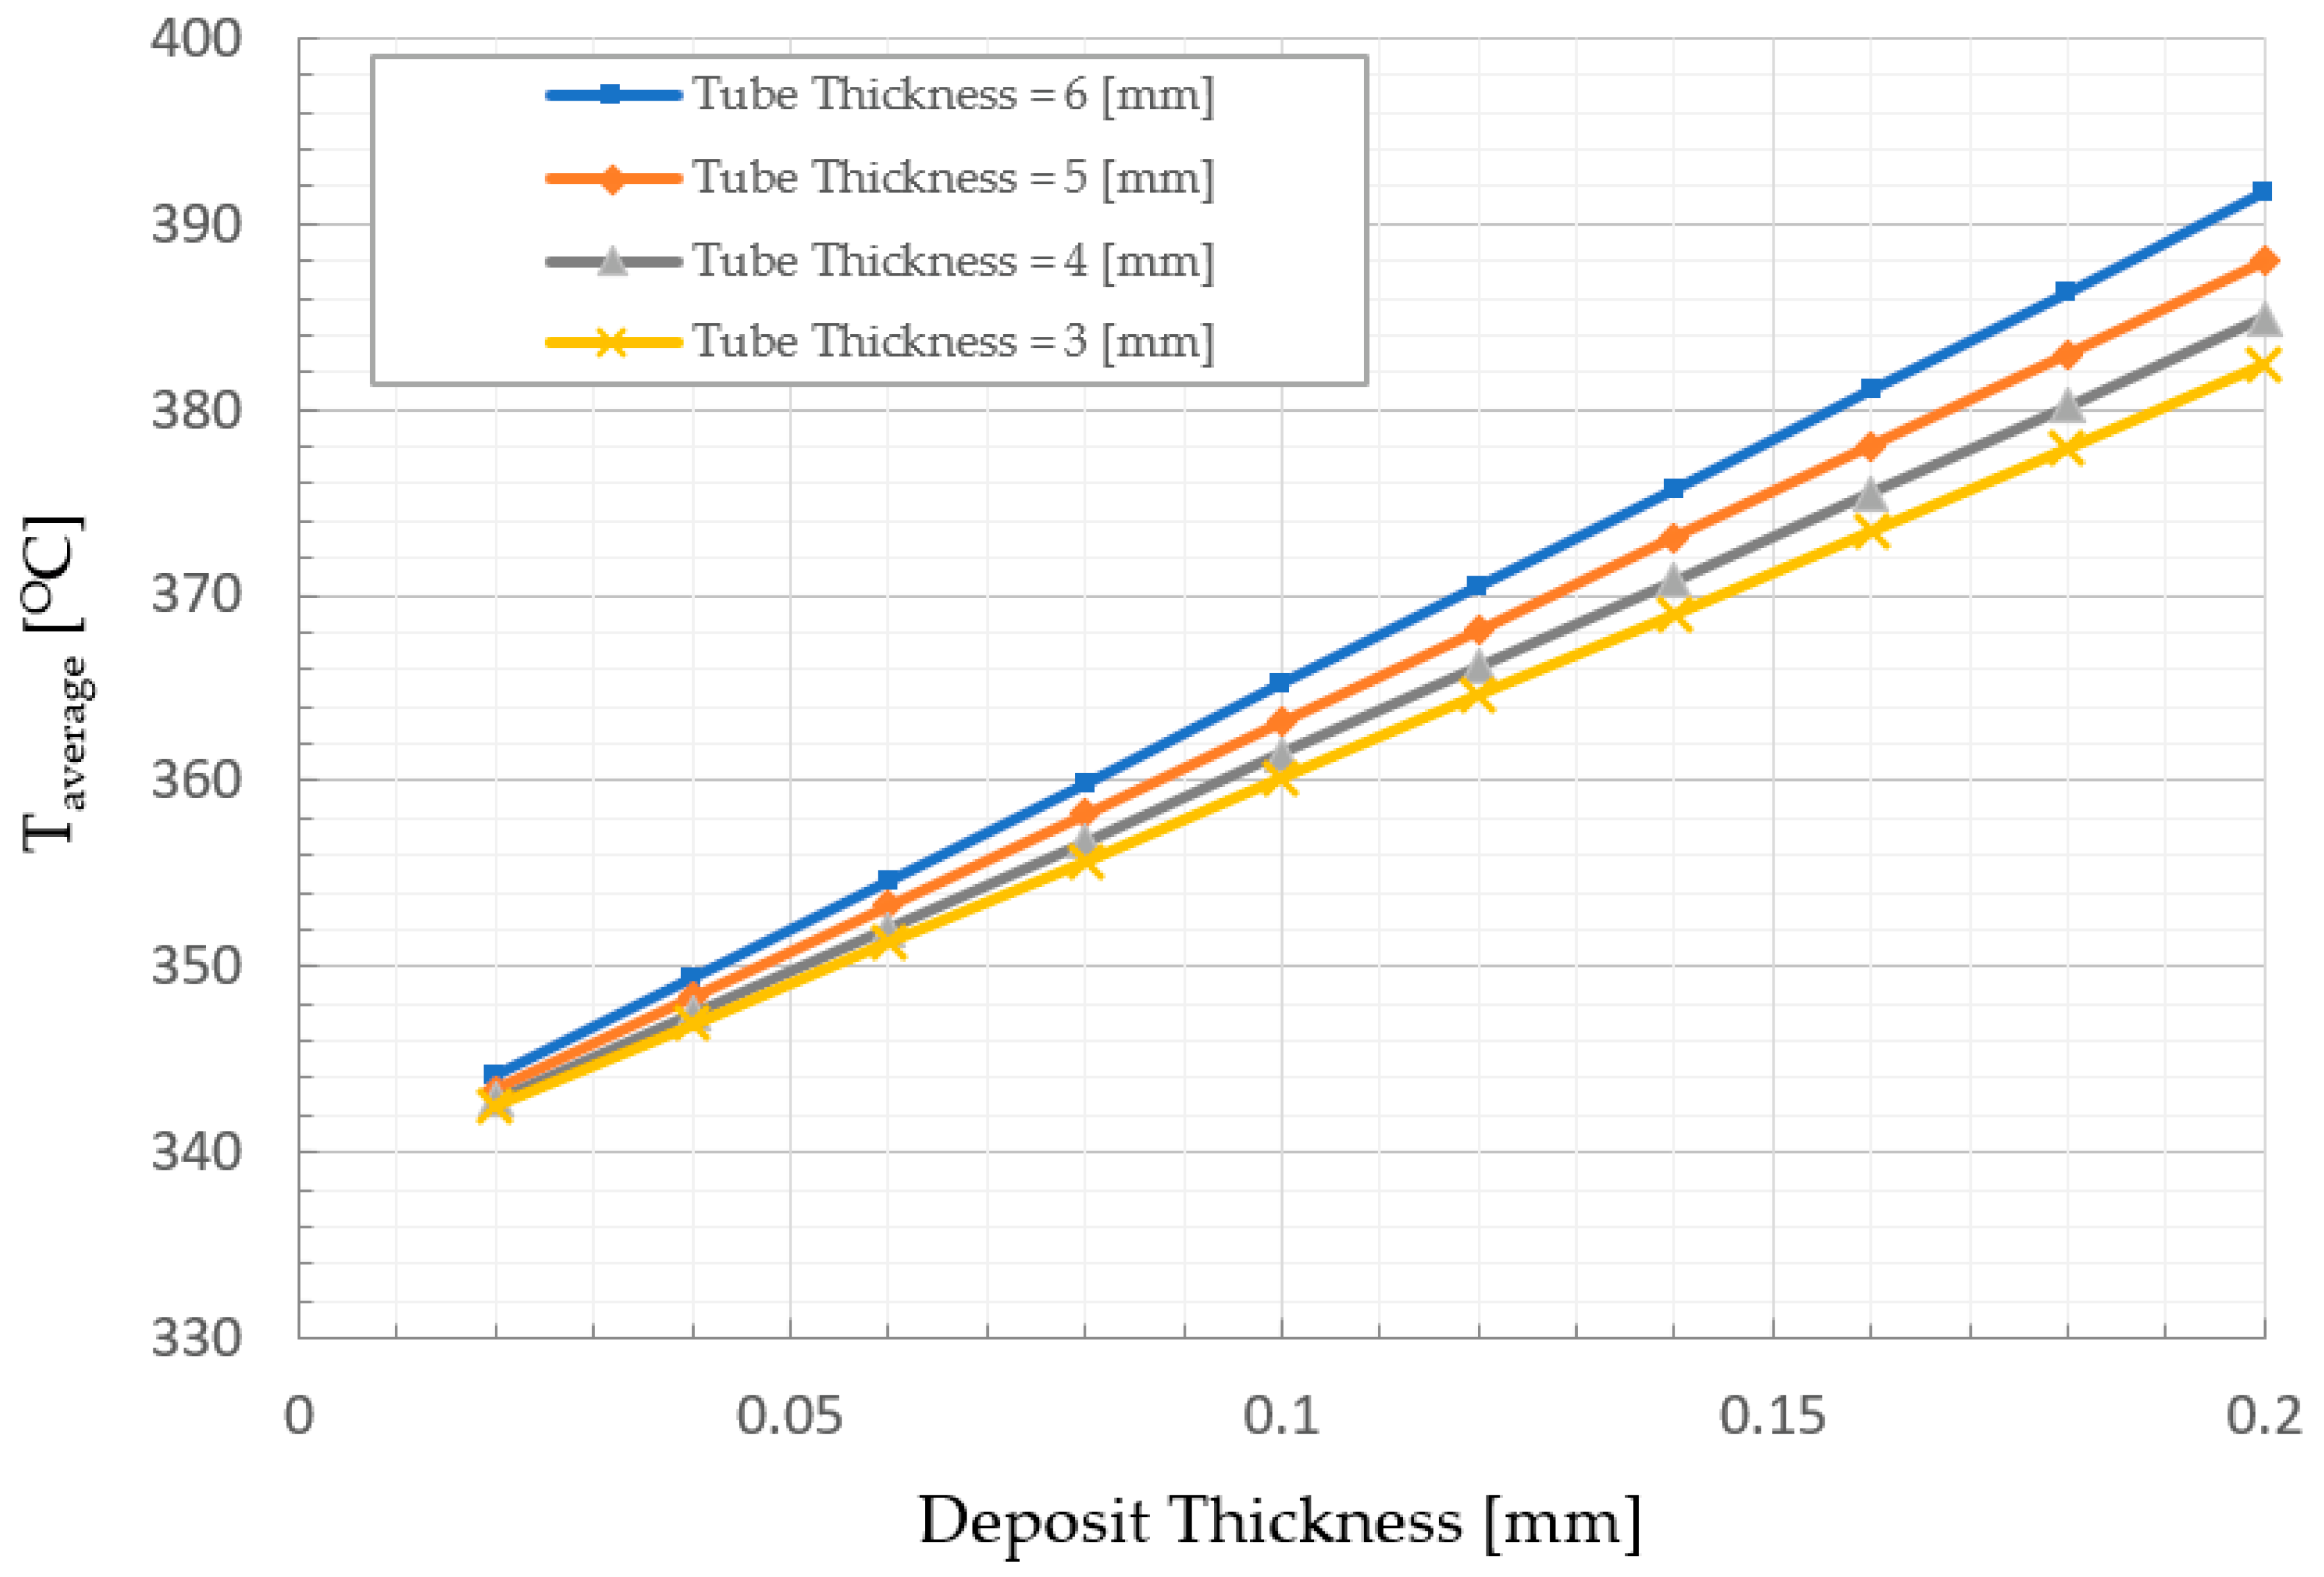
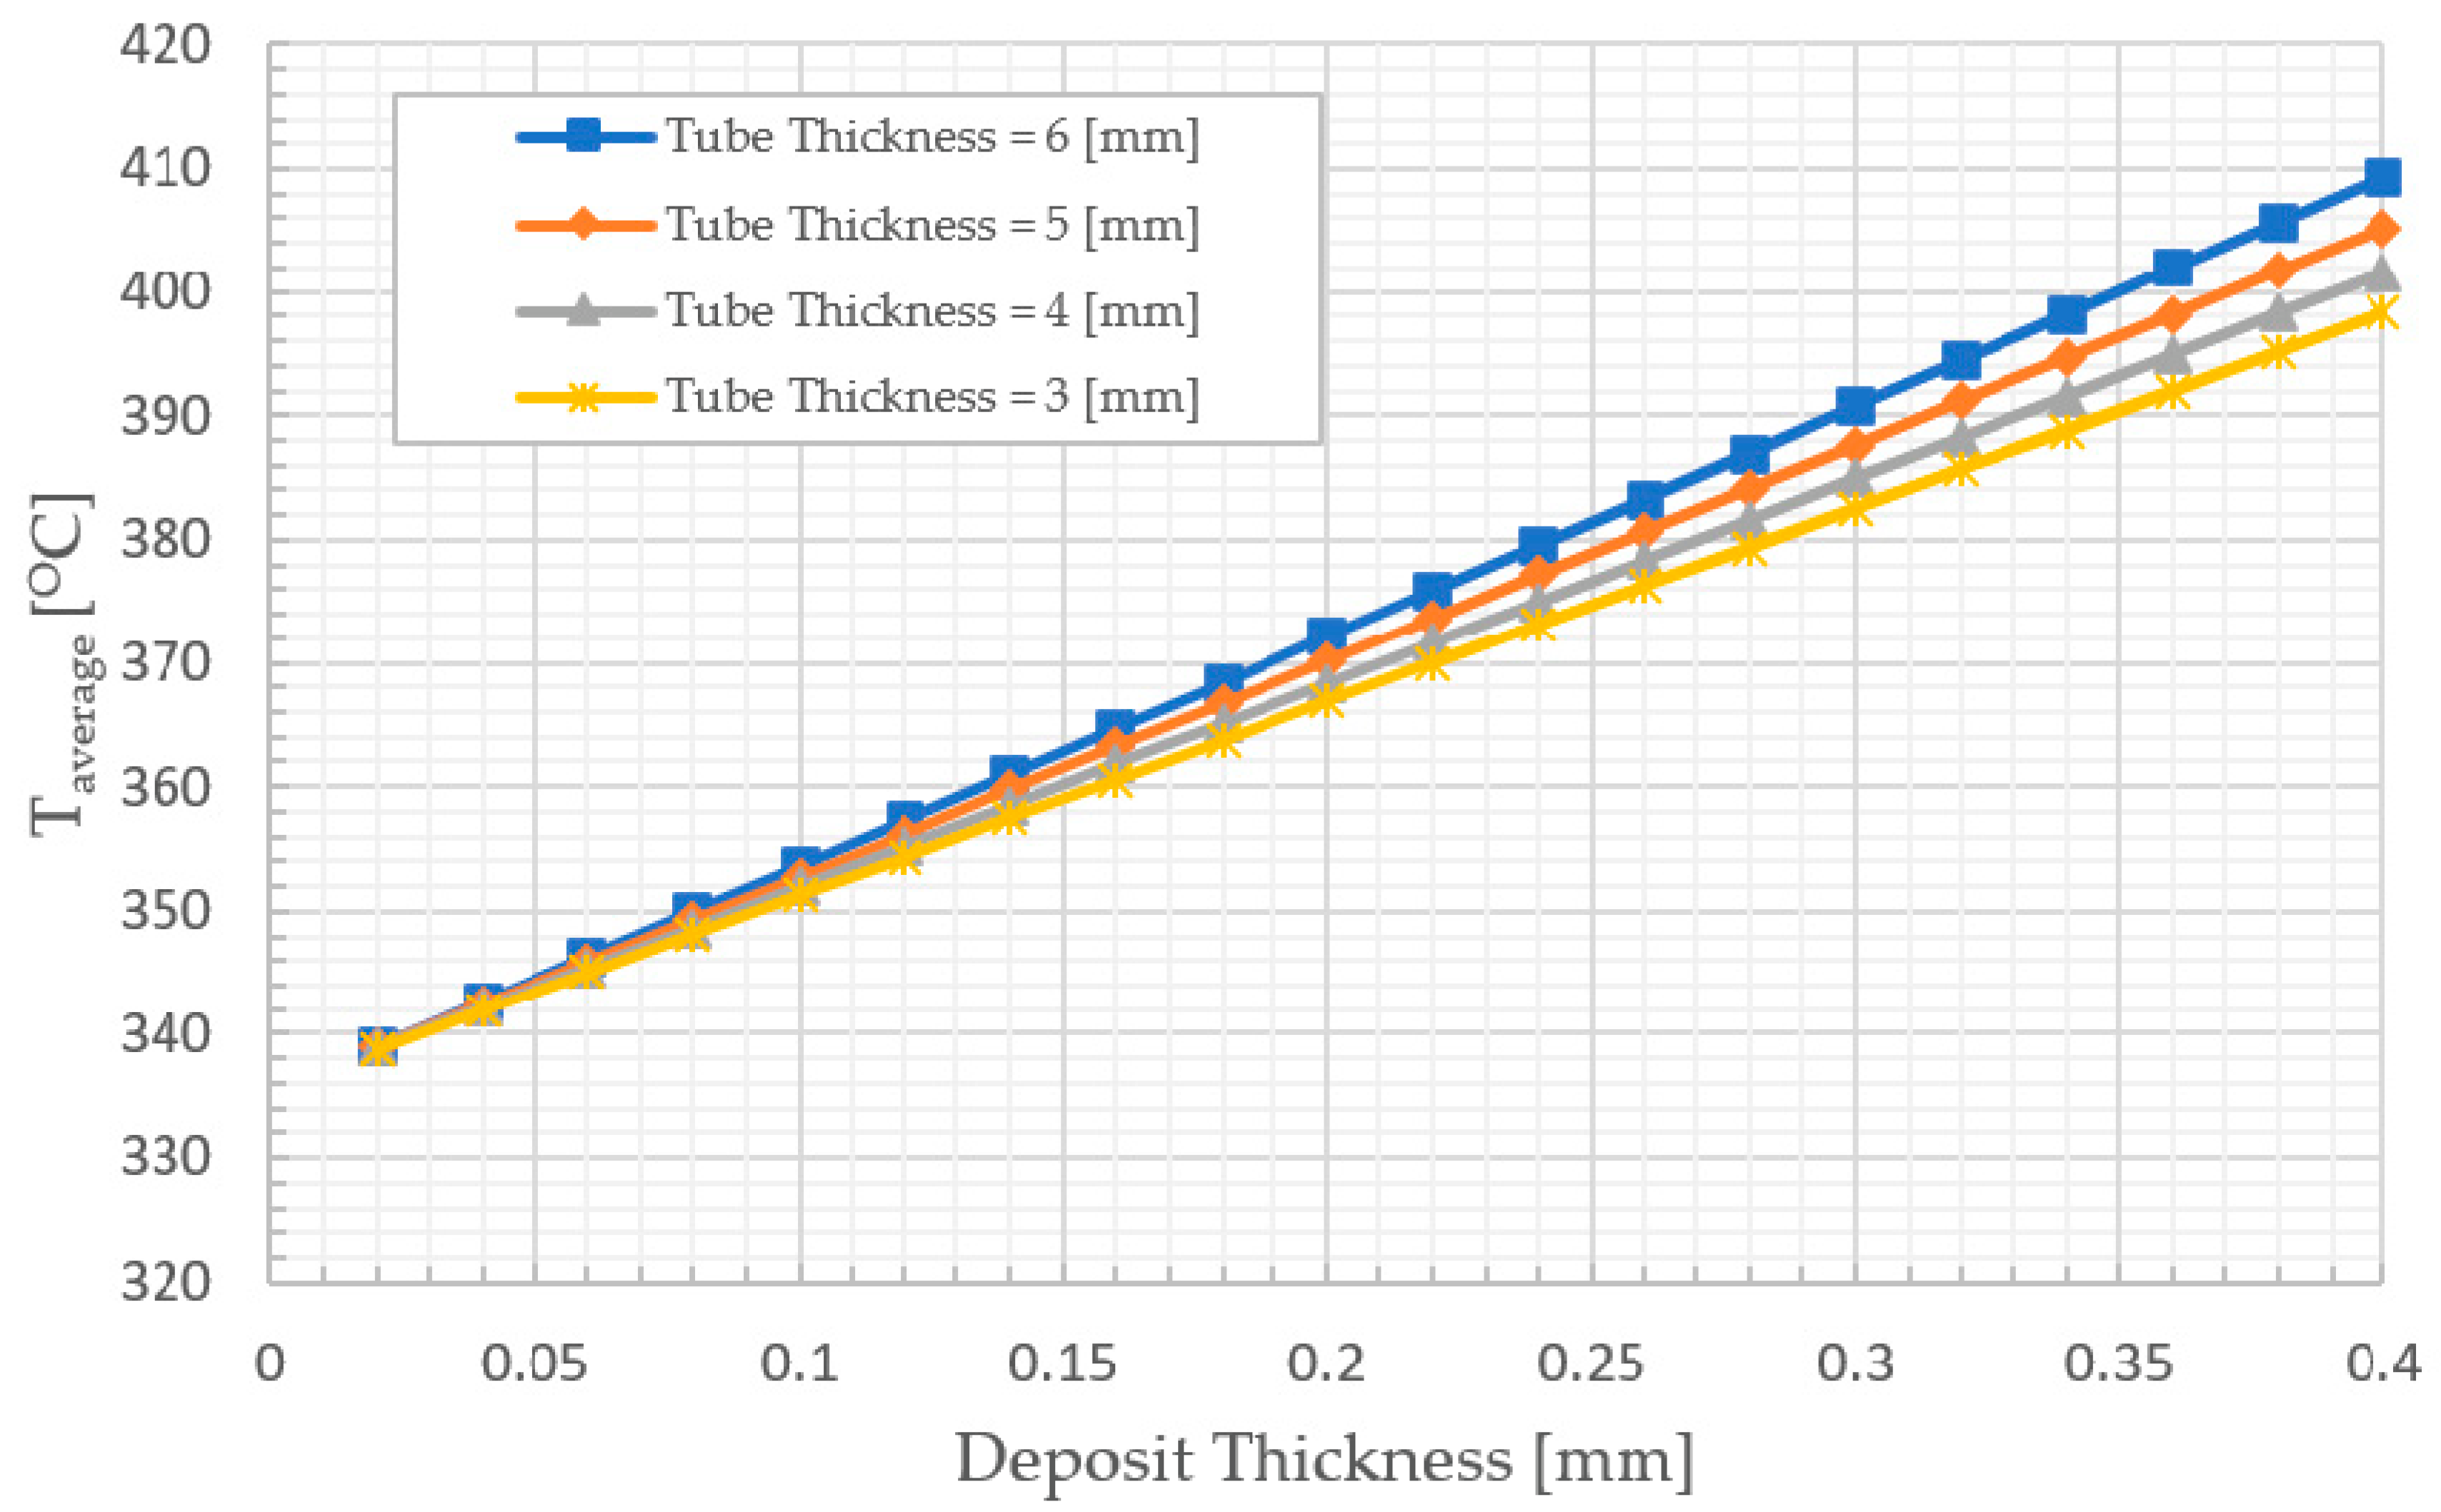
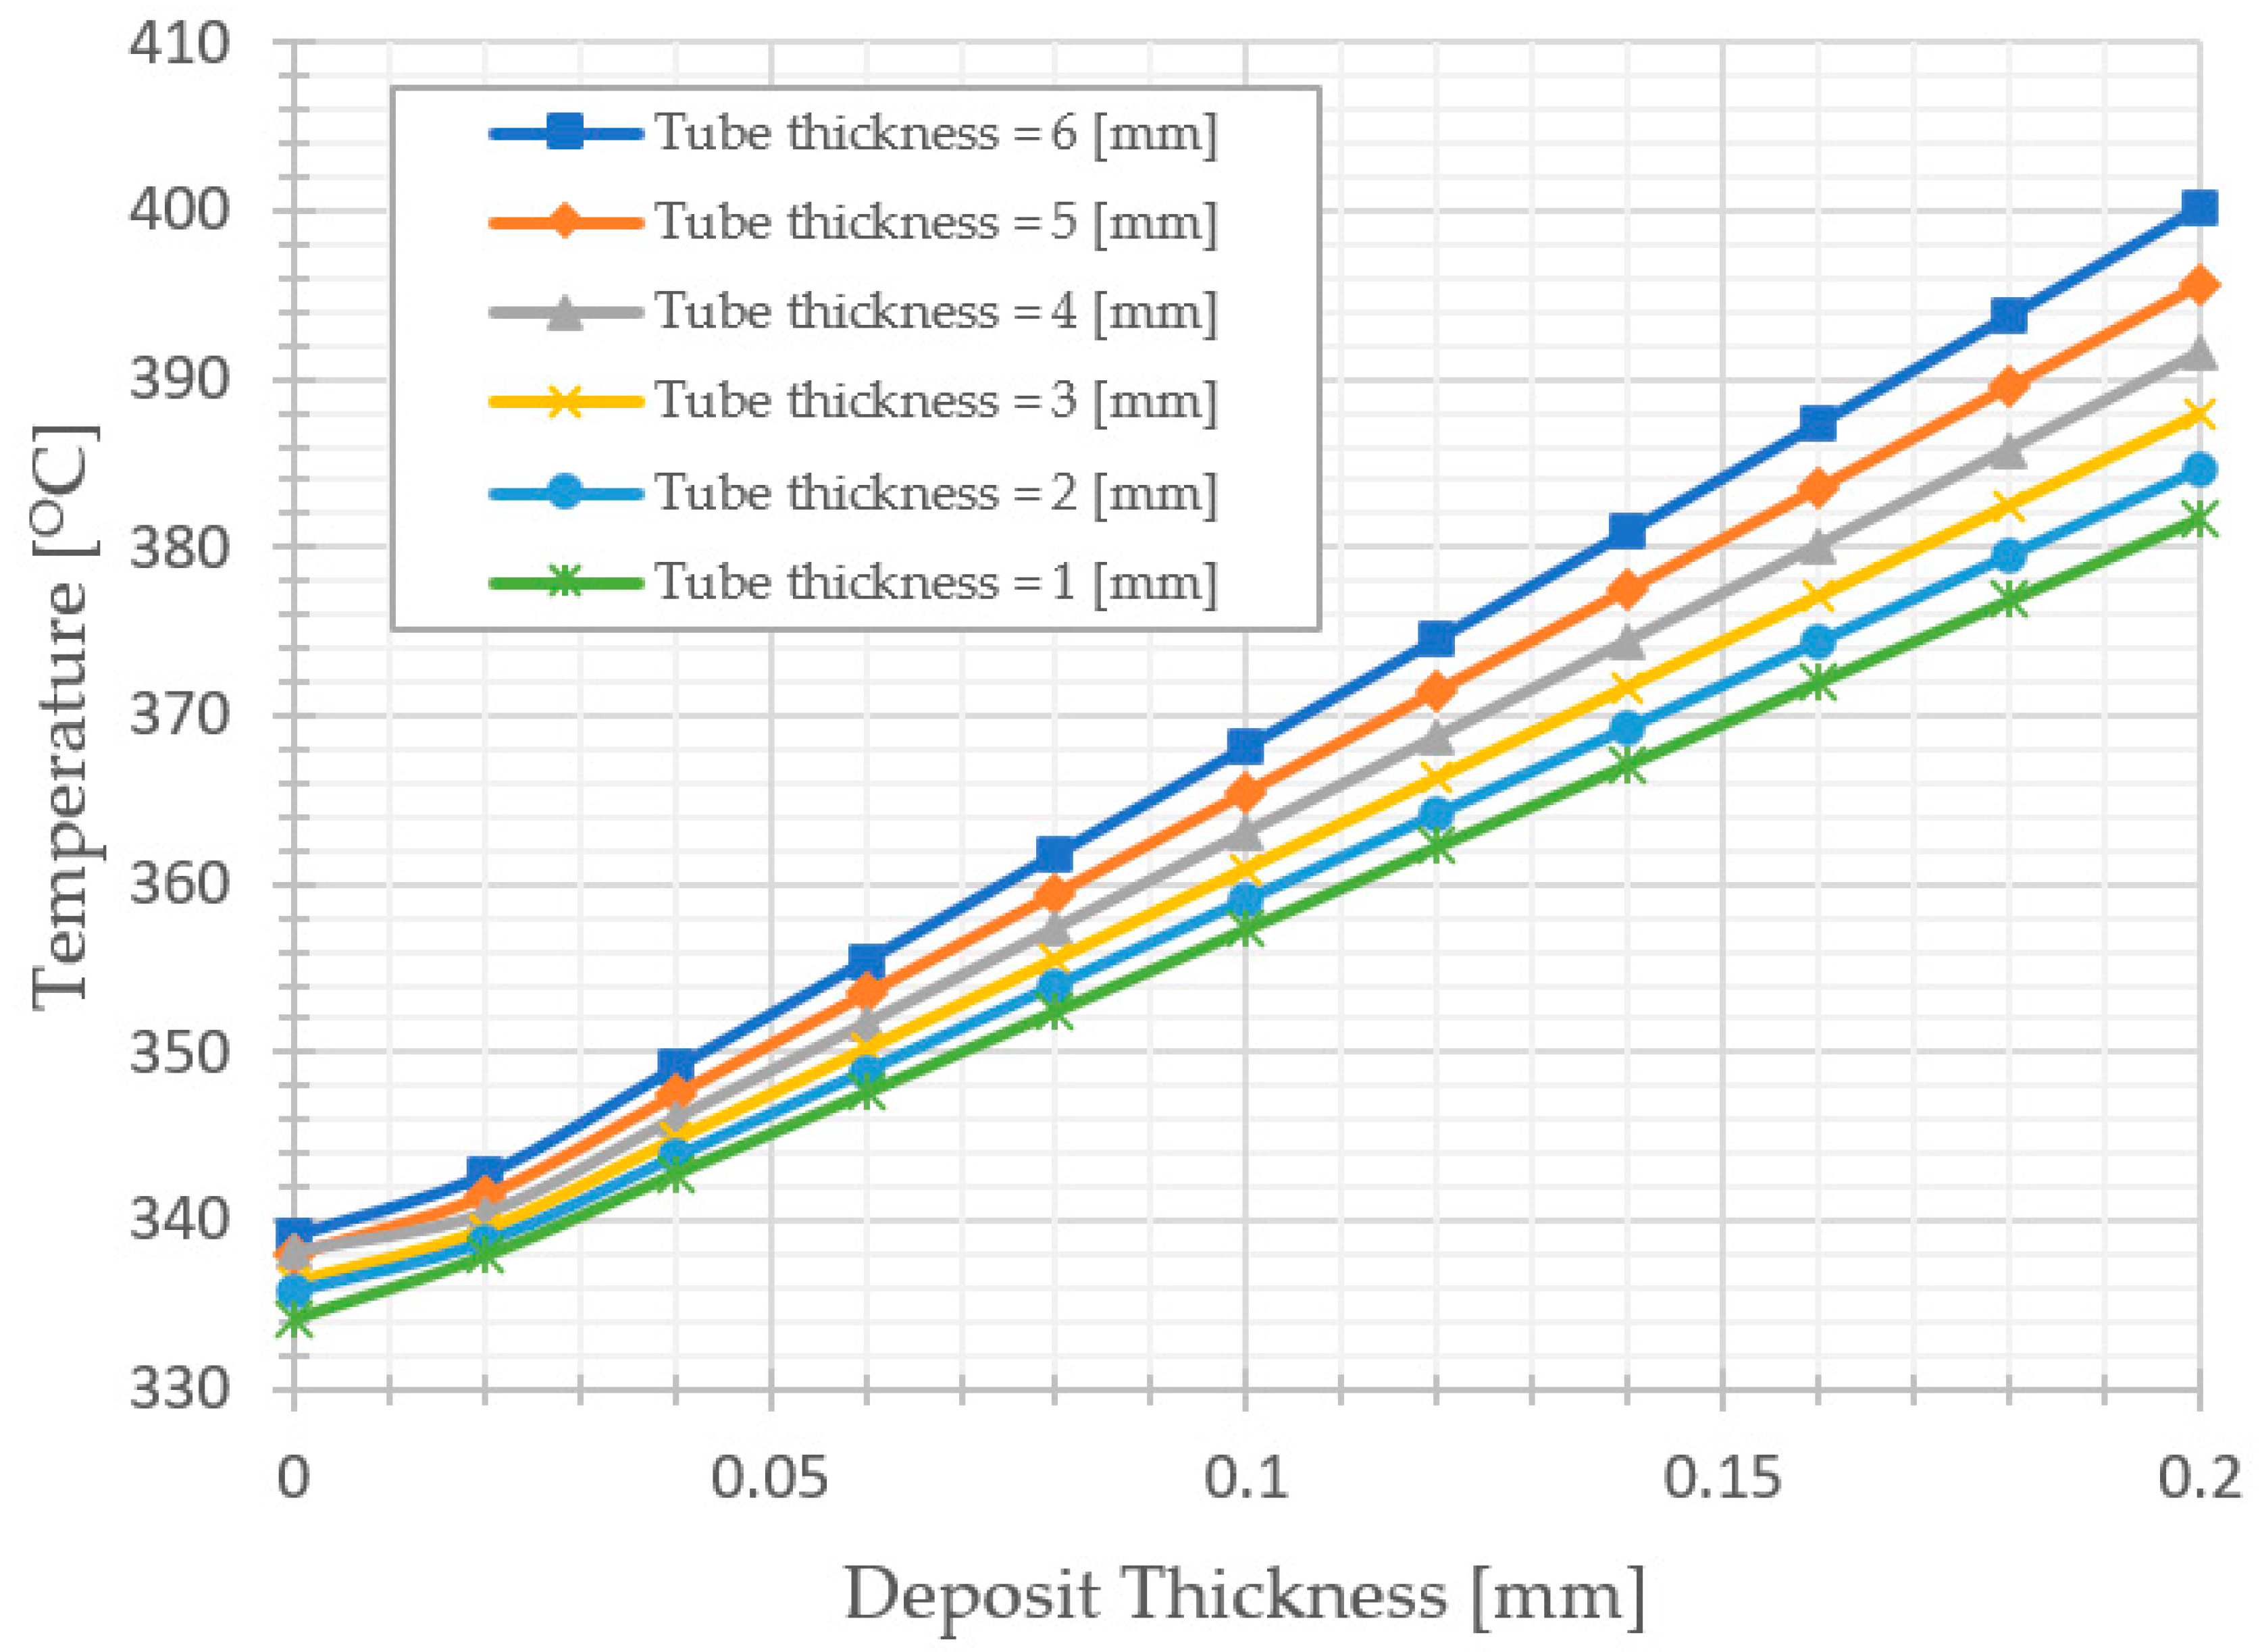
- Increasing the thickness of the deposit layer leads to a linear increase in the tube wall average temperature. Consequently, it is essential to consider the consistency between the chosen wall tube thickness and the maintenance schedule considering the deposit accumulation rates and the operating conditions.
- The deposit and tube thickness are mandatory inspection requirements. Furthermore, if the deposit thickness and tube thickness exceed the previous results, chemical cleaning and tube replacement are mandatory requirements.
Author Contributions
Funding
Conflicts of Interest
References
- Melville, J.; Foster, G.G. A pictorial review of failures in conventional boiler plant. Press. Vessel. Pip. 1975, 3, 1–25. [Google Scholar] [CrossRef]
- Duarte, C.A.; Espejo, E.; Martinez, J.C. Failure analysis of the wall tubes of a water-tube boiler. Eng. Fail. Anal. 2017, 79, 704–713. [Google Scholar] [CrossRef]
- Khajavi, M.R.; Abdolmaleki, A.R.; Adibi, N.; Mirfendereski, S. Failure analysis of bank front boiler tubes. Eng. Fail. Anal. 2007, 14, 731–738. [Google Scholar] [CrossRef]
- Ghosh, D.; Roy, H.; Saha, A.; Subramanian, C. Failure Analysis of Boiler Water Wall Tube: A Case Study from Thermal Power Plant. Fail. Anal. Prev. 2022, 22, 203–208. [Google Scholar] [CrossRef]
- Himarosa, R.A.; Hariyanto, S.D.; Hasan, W.H.; Muflikhun, M.A. Failure analysis of platen superheater tube, water wall tube, and sealpot plate: A case study from electricity power plant in indonesia. Eng. Fail. Anal. 2022, 135, 106–108. [Google Scholar] [CrossRef]
- Taler, J.; Dzierwa, P.; Jaremkiewicz, M.; Taler, D.; Kaczmarski, K.; Trojan, M.; Sobota, T. Thermal stress monitoring in thick walled pressure components of steam boilers. Energy 2019, 175, 645–666. [Google Scholar] [CrossRef]
- Sun, L.; Yan, W. Prediction of wall temperature and oxide scale thickness of ferritic–martensitic steel superheater tubes. Appl. Therm. Eng. 2018, 134, 171–181. [Google Scholar] [CrossRef]
- Modliński, N.; Szczepanek, K.; Nabagło, D.; Madejski, P.; Modliński, Z. Mathematical procedure for predicting tube metal temperature in the second stage reheater of the operating flexibly steam boiler. Appl. Therm. Eng. 2019, 146, 854–865. [Google Scholar] [CrossRef]
- Munda, P.; Husain, M.M.; Rajinikanth, V.; Metya, A.K. Evolution of Microstructure During Short-term Overheating Failure of a Boiler Water Wall Tube Made of Carbon Steel. J. Fail. Anal. Prev. 2018, 18, 199–211. [Google Scholar] [CrossRef]
- Ardy, H.; Bangun, D.A. Failure Analysis of Superheater Boiler Tube SA 213 T12. In IOP Conference Series; Materials Science and Engineering: Bandung, Indonesia, 2019. [Google Scholar]
- Dehnavi, F.; Eslami, A.; Ashrafizadeh, F. A case study on failure of superheater tubes in an industrial power plant. Eng. Fail. Anal. 2017, 80, 368–377. [Google Scholar] [CrossRef]
- Kumar, B.; Srivastava, G.P.; Kumar, M.; Patil, A.K. A review of heat transfer and fluid flow mechanism in heat exchanger tube with inserts. Chem. Eng. Processing—Process Intensif. 2018, 123, 126–137. [Google Scholar] [CrossRef]
- Barma, M.C.; Saidur, R.; Rahman, S.M.A.; Allouhi, A.; Akash, B.A.; Sait, S.M. A review on boilers energy use, energy savings, and emissions reductions. Renew. Sustain. Energy Rev. 2017, 79, 970–983. [Google Scholar] [CrossRef]
- Kakaç, S.; Liu, H.; Pramuanjaroenkij, A. Heat Exchangers: Selection, Rating, and Thermal Design, 4th ed.; CRC Press: Boca Raton, FL, USA, 2020. [Google Scholar]
- Mohite, N.T.; Benni, R.G. Optimization of Wall Thickness for Minimum Heat Losses for Induction Furnace. Int. J. Eng. Res. Technol. 2017, 10, 645–653. [Google Scholar]
- Hu, Y.; Li, H.; Yan, J. Numerical investigation of heat transfer characteristics in utility boilers of oxy-coal combustion. Appl. Energy 2014, 130, 543–551. [Google Scholar] [CrossRef]
- Haoshu, S.; Yuxin, W.; Minmin, Z.; Hai, Z.; Guangxi, Y.; Junfu, L. Large eddy simulation of a 660 MW utility boiler under variable load conditions. Front. Energy 2020, 15, 124–131. [Google Scholar]
- Xueli, G.; Zhongxiao, Z.; Haojie, F.; Jian, Z.; Degui, B. Unsteady-state heat transfer characteristics of spiral water wall tube in advanced-ultra-supercritical boilers from experiments and distributed parameter model. Energy 2019, 189, 116158. [Google Scholar]
- Paweł, M. Numerical study of a large-scale pulverized coal-fired boiler operation using CFD modeling based on the probability density function method. Applied Thermal Engineering. Appl. Therm. Eng. 2018, 145, 352–363. [Google Scholar]
- Laubscher, R.; Rousseau, P. CFD study of pulverized coal-fired boiler evaporator and radiant superheaters at varying loads. Appl. Therm. Eng. 2019, 160, 114057. [Google Scholar] [CrossRef]
- Huijun, F.; Zhuojun, X.; Chen, L.; Zhixiang, W.; Shaojun, X. Constructal design for supercharged boiler superheater. Energy 2020, 191, 116484. [Google Scholar]
- Jalendar, M.; Kumar, G. Design and thermal analysis of steam boiler used in power plants. Int. J. Recent Dev. Sci. Technol. 2019, 3, 103–109. [Google Scholar]
- Filkoski, R.; Petrovski, I. Computational Fluid Dynamics in Function of Boilers’ Revitalisation; Academia: San Francisco, CA, USA, 2022. [Google Scholar]
- Vandani, A.M.K.; Bidi, M.; Ahmadi, F. Exergy analysis and evolutionary optimization of boiler blowdown heat recovery in steam power plants. Energy Convers. Manag. 2015, 106, 1–9. [Google Scholar] [CrossRef]
- Stifanese, R.; Belsanti, L.; Toselli, M.; Letardi, P.; Traverso, P. Corrosion investigation of a steam turbine after power generator failure onboard a vessel: A case study. Eng. Fail. Anal. 2016, 64, 58–66. [Google Scholar] [CrossRef]
- Zhang, Z.; Yang, Z.; Nie, H.; Xu, L.; Yue, J.; Huang, Y. A thermal stress analysis of fluid–structure interaction applied to boiler water wall. Asia-Pac. J. Chem. Eng. 2020, 15, e2537. [Google Scholar] [CrossRef]
- Li, Z.; Wu, Y.; Lu, J.; Zhang, D.; Zhang, H. Heat transfer to supercritical water in circular tubes with circumferentially non-uniform heating. Appl. Therm. Eng. 2014, 70, 190–200. [Google Scholar] [CrossRef]
- ASME. Pressure Vessel Code; ASME: New York, NY, USA, 2004. [Google Scholar]


| Domain | Deposit Material | Density [kg/m3] | Specific Heat [j/kg·K] | Thermal Conductivity [mm] | Viscosity [kg/m·s] | Dimensions [mm] |
|---|---|---|---|---|---|---|
| Deposit | Magnetite | 5175 | 586 | 0.625–1.39 | NA * | td = from 0 to 0.2 |
| Tube | Carbon Steel Seamless Pipe (SA210 C) | 7830 | 465 | 53 | NA * | tp = from 1 to 6 Lp = 500 Do = 44.45 |
| Fluid | Water at P = 210 bar Taverage = 300 °C | 736.44 | 5288.40 | 0.57314 | 9.04 × 10⁵ | Di = from 42.45 to 32.28 |
| 5 × 10⁻¹ | 5.63 × 10² | ||
| 4.25 × 10⁻² | 3.6632 × 10⁻¹ | ||
| 2.22 × 10⁻² | 3 × 10⁵ |
| Load [%] | Minimum Tube Thickness [mm] | Maximum Deposit Thickness [mm] |
|---|---|---|
| 100% | 4 | 0.16 |
| 75% | 4 | 0.18 |
| 50% | 4 | 0.28 |
Publisher’s Note: MDPI stays neutral with regard to jurisdictional claims in published maps and institutional affiliations. |
© 2022 by the authors. Licensee MDPI, Basel, Switzerland. This article is an open access article distributed under the terms and conditions of the Creative Commons Attribution (CC BY) license (https://creativecommons.org/licenses/by/4.0/).
Share and Cite
Aljohani, A.S.; Ahmed, K.I.; Asiri, S.; Ahmed, M.H. Numerical Study on the Effect of Deposit Layer on the Minimum Wall Thickness of Boiler Water Tube under Different Operating Conditions. Appl. Sci. 2022, 12, 8838. https://doi.org/10.3390/app12178838
Aljohani AS, Ahmed KI, Asiri S, Ahmed MH. Numerical Study on the Effect of Deposit Layer on the Minimum Wall Thickness of Boiler Water Tube under Different Operating Conditions. Applied Sciences. 2022; 12(17):8838. https://doi.org/10.3390/app12178838
Chicago/Turabian StyleAljohani, Ahmed S., Khaled I. Ahmed, Saeed Asiri, and Mohamed H. Ahmed. 2022. "Numerical Study on the Effect of Deposit Layer on the Minimum Wall Thickness of Boiler Water Tube under Different Operating Conditions" Applied Sciences 12, no. 17: 8838. https://doi.org/10.3390/app12178838
APA StyleAljohani, A. S., Ahmed, K. I., Asiri, S., & Ahmed, M. H. (2022). Numerical Study on the Effect of Deposit Layer on the Minimum Wall Thickness of Boiler Water Tube under Different Operating Conditions. Applied Sciences, 12(17), 8838. https://doi.org/10.3390/app12178838