Article

An Unsupervised Depth-Estimation Model for Monocular Images Based on Perceptual Image Error Assessment

1
Department of Software Engineering, Hyupsung University, Hwaseong-si 18330, Korea
2
Department of Computer Science, Korea University of Technology and Education, Cheonan-si 31253, Korea
*
Author to whom correspondence should be addressed.
Appl. Sci. 2022, 12(17), 8829; https://doi.org/10.3390/app12178829
Submission received: 1 August 2022 / Revised: 25 August 2022 / Accepted: 30 August 2022 / Published: 2 September 2022
(This article belongs to the Special Issue AI-Based Image Processing)

Abstract

:
In this paper, we propose a novel unsupervised learning-based model for estimating the depth of monocular images by integrating a simple ResNet-based auto-encoder and some special loss functions. We use only stereo images obtained from binocular cameras as training data without using depth ground-truth data. Our model basically outputs a disparity map that is necessary to warp an input image to an image corresponding to a different viewpoint. When the input image is warped using the output-disparity map, distortions of various patterns inevitably occur in the reconstructed image. During the training process, the occurrence frequency and size of these distortions gradually decrease, while the similarity between the reconstructed and target images increases, which proves that the accuracy of the predicted disparity maps also increases. Therefore, one of the important factors in this type of training is an efficient loss function that accurately measures how much the difference in quality between the reconstructed and target images is and guides the gap to be properly and quickly closed as the training progresses. In recent related studies, the photometric difference was calculated through simple methods such as L1 and L2 loss or by combining one of these with a traditional computer vision-based hand-coded image-quality assessment algorithm such as SSIM. However, these methods have limitations in modeling various patterns at the level of the human visual system. Therefore, the proposed model uses a pre-trained perceptual image-quality assessment model that effectively mimics human-perception mechanisms to measure the quality of distorted images as image-reconstruction loss. In order to highlight the performance of the proposed loss functions, a simple ResNet50-based network is adopted in our model. We trained our model using stereo images of the KITTI 2015 driving dataset to measure the pixel-level depth for 768 × 384 images. Despite the simplicity of the network structure, thanks to the effectiveness of the proposed image-reconstruction loss, our model outperformed other state-of-the-art studies that have been trained in unsupervised methods on a variety of evaluation indicators.

1. Introduction

Deep neural networks are one of the key components of the self-driving technology stack. The neural network analyzes the on-car camera feeds for roads, signs, cars, obstacles, and people. However, deep learning also has the potential to err when detecting objects in images. Most self-driving vehicle companies use LiDAR (Light Detection and Ranging)s, devices that emit an omni-directional laser beam to create a 3D map of the car’s surroundings. LiDARs provide sensor-based depth data that supplements the lack of neural networks, which can be used to avoid or contact objects within the range of motion of a car or robot. With expensive equipment such as LiDAR, depth data can be obtained directly through the sensor. However, in a simple monocular camera, it is necessary to analyze the RGB image to measure the depth. Some researchers have preferred direct measurement methods, such as a stereo-image set generated from a binocular camera or laser sensor, rather than depth analysis by monocular images. However, these methods are computation-intensive and not cost-effective. There are a lot of limited environments such as black boxes, CCTVs, smartphones, IoT sensor cameras, and so on where it is not easy to install two or more cameras physically. In those environments, the direct prediction of 3D-depth data from a monocular 2D image may be more feasible than installing additional camera sensors and implementing a stereo-based analysis method. Therefore, there is a growing demand for monocular depth estimation.
Recently, a number of deep-learning-based studies have been published to predict the depth of monocular images using data taken from images, LiDAR sensors, RGB-D sensors, and so on. A deep-learning-based depth-estimation network can be trained in a supervised, unsupervised, or semi-supervised way [1]. In monocular depth estimation, supervised learning is a method of directly predicting a depth map from an input image, usually using LiDAR or RGB-D sensor data as a label or target. However, it is difficult to obtain large-scale image–depth-pair datasets because it requires high-cost equipment such as LiDAR. Unsupervised learning methods generate disparity maps for monocular images by training stereo images without ground-truth depth data. They are often called the stereo-supervision models, but, in this paper, for clarity, we call these USI (Unsupervised models based on Stereo Images) models. The main advantage of these models is that the training image data can be easily acquired by calibrated stereo cameras. Some studies have improved the performance by using the image-synthesis capabilities of GAN (Generative Adversarial Network)s. Other studies using RNN (Recurrent Neural Network)-based models such as LSTM; Ref. [2] trained their models to predict an accurate disparity map in order to generate an image at a specific time point (t) based on time-series image data. They are often called the monocular-supervision models, but, in this paper, for clarity, we call these UVS (Unsupervised models based on Video Sequences) models. These models also do not suffer from the data-shortage issue of the supervised model, but the overall performance is lower than the USI models. Semi-supervised learning is a hybrid of the previous two methods. Some studies have employed pixel-level semantic segmentation or instance segmentation benchmarks to provide additional information for predicting depth [3,4].
In this paper, we propose a new USI model that integrates a simple network structure and several effective loss functions. Most of the existing related studies have focused on the development of learning networks and have shown the impact that specific network architectures can have on depth-prediction performance. They initially calculated the image-reconstruction loss through simple methods such as L1 and L2 loss, which are then combined with traditional computer vision-based image quality assessment (IQA) algorithms. Computer vision-based IQA algorithms such as SSIM [5] have been used to quantify the similarity between the reconstructed and target images in unsupervised learning-based monocular depth-estimation models [1,6,7]. However, these methods have limitations in modeling various patterns at the level of the human visual system. That is, they behave differently in some environments. IQA algorithms derive feature maps representing the image structure from the original image and a distorted image. Then, they measure how similar those images are. Since these methods do not tolerate texture resampling, they have shown poor performance in images with complex textures, such as grass [8]. If the loss function for image reconstruction does not accurately evaluate the image quality, there is a possibility of inducing inefficient learning of the network [6,9]. We argue that, in order to accurately predict monocular depth in an unsupervised model, it is essential to use a robust image-reconstruction loss function that accurately quantifies the difference between the reconstructed image and target images. Recently, perceptual IQA models that effectively mimic human visual mechanisms have shown that this challenge could be mitigated [8,10,11]. Therefore, we considered that a human-like perceptual ability would improve the reconstruction quality in the warping process of the USI model for monocular depth estimation based on stereo images. Consequently, we propose an unsupervised learning-based model using PieAPP [11], one of the representative perceptual IQA algorithms, as an image-reconstruction loss. To the best of our knowledge, there is no precedent for using these methods for monocular depth prediction. The proposed model is a simple ResNet50-based auto-encoder [12], which further highlights the contribution of the proposed effective loss functions.
We trained our model to generate depth maps for 768 × 384 images using stereo image pairs of the KITTI 2015 dataset [13]. We applied a variety of metrics to validate the performance of our approach. We also quantitatively and qualitatively compared our results with other studies. Our model performed well numerically in various standard evaluation indicators. Additional experimental results were also performed to verify our model’s generalization capacity using the CityScapes dataset [14]. Although our model is based on a simple ResNet-based network, it outperforms other unsupervised learning-based state-of-the-art studies thanks to the image-reconstruction loss function based on the perceptual IQA model that effectively mimics the human visual system. The following sections first describe several studies related to our work. We then describe the proposed approach in detail in Section 3 and analyze the results of several experiments to demonstrate the effectiveness of our method in Section 4. Finally, in the conclusion section, we summarize our suggestions and present limitations, future studies, etc.

2. Related Work

2.1. Supervised Leaning Models for Monocular Depth Estimation

Eigen et al. [15] introduced a deep-learning-based approach for monocular depth prediction using two network stacks to consider both global and local information. Liu et al. [16] formulated a depth-prediction task on a single image as a discrete-continuous-optimization problem. They proved the effectiveness of their approach using the Make3D [17] and NYU v2 [18] datasets. Fu et al. [19] proposed a novel approach (DORN) that discretizes distance using a spacing-increasing discretization (SID) method instead of learning the distance measurement as a regression method and converting it into an ordinal regression problem.
The problem with depth-supervised models is that they require large amounts of labeled data for training. Therefore, they often suffer from a lack of sufficient training data. Moreover, in the context of monocular depth prediction, it is nearly impossible to obtain an accurate and dense depth in a dynamic outdoor environment.

2.2. Unsupervised Learning Models for Monocular Depth Estimation Based on Video Sequence (UVS Models)

Zhou et al. [20] jointly trained two networks using unlabeled video sequences: one for depth prediction [21] and another for estimating the pose of the camera. They used the L1 loss for the image synthesis. [22]. Mahjourian et al. [23] proposed a novel unsupervised approach for learning depth and ego-motion from consecutive video frames. Yin et al. [24] proposed the GeoNet. They jointly trained three networks: one for monocular depth, one for optical flow, and one for the ego-motion estimation from consecutive video frames. They adopted the robust-image-similarity measurement method from [6]. Wang et al. [25] suggested a theory that proposes that learning-based depth prediction is possible without a pose convolutional neural network. They proposed a novel normalization strategy that circumvented scale ambiguity. They also proposed the incorporation of a direct visual odometry (DVO) [26] pose predictor into their framework instead of using the pose-CNN employed by [20]. They used a linear combination of the L1 loss and the SSIM for the image-reconstruction loss, inspired by [6]. Luo et al. [27] proposed the every-pixel-counts++ (EPC++) network. They jointly trained three networks: one for predicting depth (DepthNet), one for camera motion (MotionNet), and one for optical flow (OptFlowNet). These methods are cost-effective, as they only require a monocular camera to acquire training data. However, they have the inconvenience of the researcher having to manually remove some data from the training data when there is little difference between successive frames, for example, when an experimental shooting car is stopped. These methods also do not sufficiently solve the issue of invisible occlusion regions in continuous images [20].

2.3. Unsupervised Learning Models for Monocular Depth Estimation Based on Stereo Images (USI Models)

Garg et al. [28] proposed an unsupervised framework for monocular depth prediction without a pre-training step or annotated depth ground truth. They used the L2 loss between the reconstructed and target images as a simple image-reconstruction loss. However, the L2 loss generated blurry images as it converged to a stable value rather than finding an exact value for each pixel. Therefore, it is not suitable for photorealistic image synthesis, which limits the accuracy improvement of the depth maps generated by their models. Godard et al. [6] presented an unsupervised learning-based model training stereo image pairs of the KITTI 2015 driving dataset. They proposed a novel objective function including an image-reconstruction loss based on the L1 and SSIM [5], a disparity-smoothness loss, and specifically a left–right consistency loss. Furthermore, they extended their scope to monocular supervision by adding a network of learning consecutive video frames [1]. They also presented a minimal reprojection loss to handle the occlusion problem, a full-resolution multi-scale sampling approach to reduce visual artifacts and a simple auto-masking method to filter out pixels that did not change appearance from one frame to the next. Inspired by recent deep-learning methods for super-resolution, Pillai et al. [29] proposed a sub-pixel convolutional layer extension for depth super-resolution that accurately synthesized high-resolution disparities from their corresponding low-resolution features. They used a linear combination of the L1 loss andsingle-scale SSIM loss as the image-reconstruction loss. They also introduced a differentiable flip-augmentation layer to accurately fuse predictions from the image and its horizontally flipped version, which reduced the effect of left and right shadow regions generated by occlusions. Park et al. [7] used the GMSD [30], one of the high-performance conventional IQA algorithms, as the image-reconstruction loss function in a symmetric GAN [31] structure. They proved that GMSD loss effectively contributes to performance improvement. They also used a relativistic discriminator [32] to solve the problem of training instability in GANs. The advantage of these models is that the training image data can be easily acquired by binocular cameras. Therefore, it is more feasible to easily learn the models in various environments than the supervised models. On the other hand, these methods have a problem, in that artifacts are generated at occlusion boundaries due to pixels in the occlusion region that are not visible in both images [6].
Table 1 summarizes the image-reconstruction loss used by the unsupervised learning-based studies mentioned in Section 2.2 and Section 2.3, respectively. The combination of L1 loss and SSIM is the most widely used.

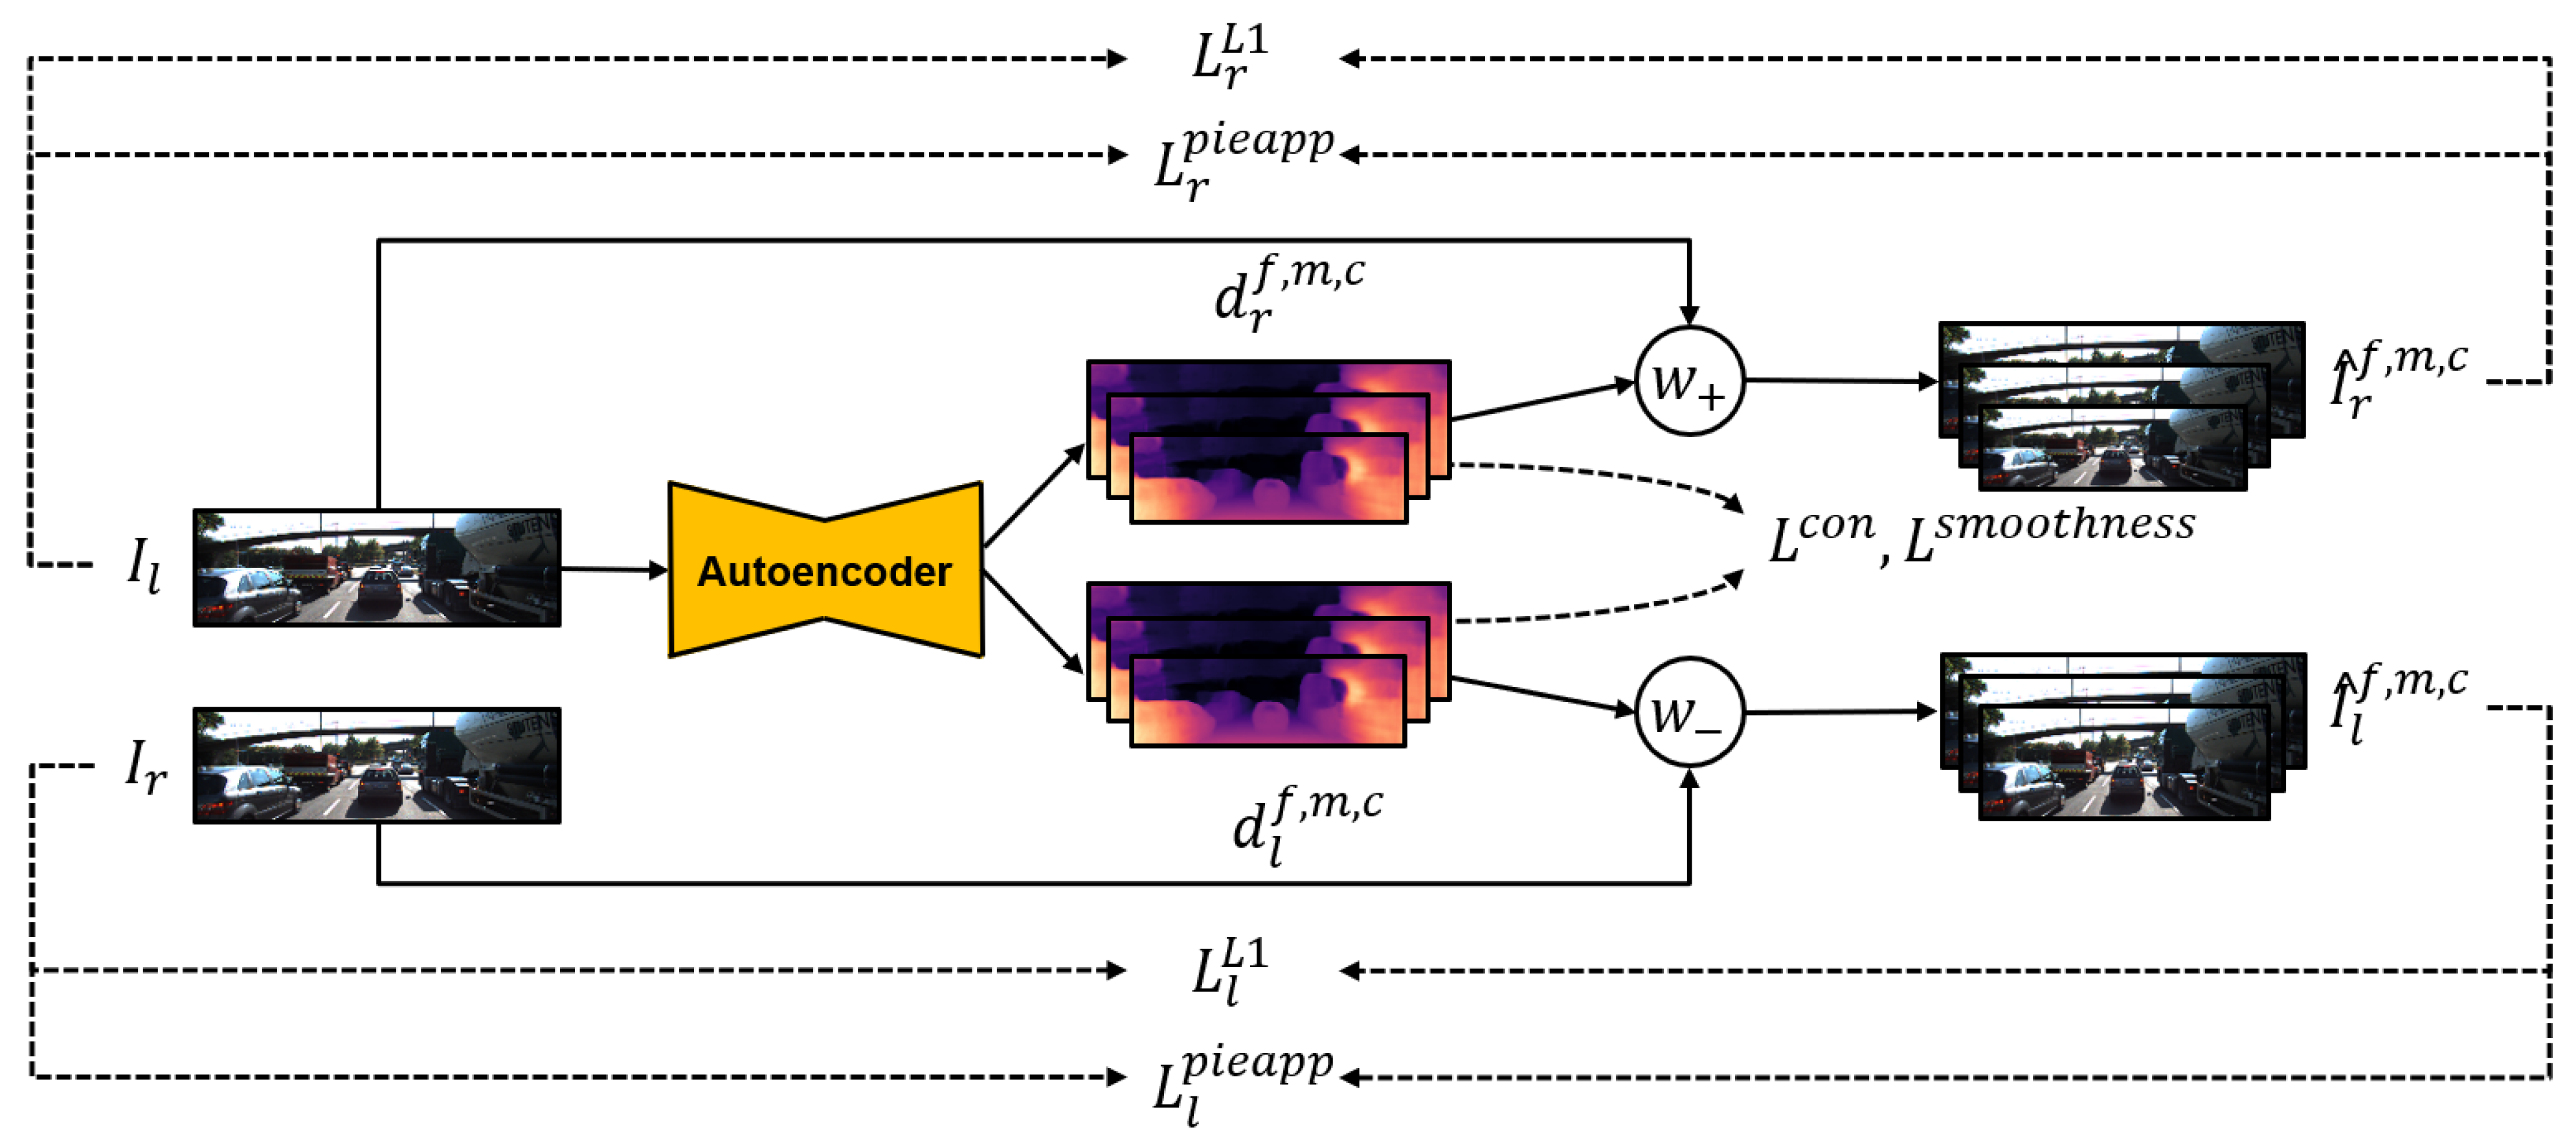
3. The Proposed Model

This section describes the structure of the proposed unsupervised learning-based monocular depth-prediction model. This section also covers the rationale of proposed loss functions and their details in the learning process.

3.1. Depth Prediction Network

Our network learns how to predict pixel-wise inverse depth and disparity in a single image I in an unsupervised approach by training stereo images (i.e., USI model). Although this method may provide only general training for depth prediction, as compared to the depth supervision methods, it has the advantage of being able to train with the easily acquired larger datasets and then improve its accuracy and performance by using good loss functions. The depth p is calculated according to the formula p = ( b × f ) / d (b: baseline distance between two cameras, f: camera focal length, d: disparity map). Figure 1 shows the structure of the proposed model. The network is a simple ResNet50-based auto-encoder, which predicts a disparity map as required to simulate an image from a different viewpoint. The network needs pairs of images (provided from the KITTI dataset) for training. In other words, it learned how to reconstruct an input left image I l into a target right image I r . Our network is inspired by [6], and we used a ResNet50 backbone network as an encoder. The decoder consists of six up-convolution layers and performs upsampling based on a bilinear interpolation with a scale-factor of two in each layer. In the decoding process, three disparity maps d f , m , c of different sizes (a scale factor of two) are predicted, where f, m and c represent the fine, medium, and coarse view, respectively. We calculate the loss (image-reconstruction loss, left–right consistency loss, and smoothness loss) for each of these three disparity maps. The proposed network generates a disparity map d r used to synthesize I l into I ^ r (i.e., warping process w + ). In addition, it also predicts another disparity map d l used to synthesize I r into I ^ l (i.e., warping process w ) simultaneously. After that, the post-processing method suggested by [6] is applied to further improve the accuracy.

3.2. Training Loss

Image-Reconstruction Loss:Figure 1 shows several loss functions required for training. The network is trained to generate a disparity map used to synthesize an input as closely as possible to the target. The image-reconstruction loss refers to the numerical difference between the reconstructed and target images, which is similar to the role of IQA algorithms. Therefore, if an IQA algorithm as a loss function could accurately quantify the differences between images, the accuracy of the disparity map could be increased by gradually decreasing this value. PieAPP [11], one of the learning-based IQA algorithms, shows great performance in the IQA field. As compared to manual methods, the PieAPP model learned to mimic the complexity of human visual systems. While there are other learning-based studies that train on human-labeled datasets, they have difficulties in obtaining large, high-quality datasets. The authors of PieAPP presented a new dataset for a pairwise learning framework that compares two given images and identifies them according to their similarity to a reference, which could be used to achieve better performance. We trained our network under the assumption that using this excellent IQA algorithm as the main loss function L p i e a p p would contribute to increasing the whole performance. L1 loss L L 1 is added to compensate for the quality of the reconstructed image and is used to minimize the absolute pixel-wise distance between the reconstructed and target images. Altogether, the image-reconstruction loss L r e c is defined as:
L r p i e a p p = | | P ( I r f , m , c ) P ( I ^ r f , m , c ) | |
L l p i e a p p = | | P ( I l f , m , c ) P ( I ^ l f , m , c ) | |
L p i e a p p = L r p i e a p p + L l p i e a p p
L r L 1 = | | I r f , m , c f w + ( d r f , m , c , I l f , m , c ) | | = | | I r f , m , c I ^ r f , m , c | |
L l L 1 = | | I l f , m , c f w ( d l f , m , c , I r f , m , c ) | | = | | I l f , m , c I ^ l f , m , c | |
L L 1 = L r L 1 + L l L 1
L r e c = α L p i e a p p + ( 1 α ) L L 1 ,
where P ( ) , f w + , and f w represent the pre-trained PieAPP model [33], right-warping function, and left-warping function, respectively. α in Equation (7) represents the weight ratio of the L L 1 loss and L p i e a p p loss among the total image-reconstruction loss, and it is optimally pre-determined through experiments.
Left–Right Consistency Loss: Additionally, we employed the left–right consistency loss from Godard et al. [6] to reinforce the consistency between the left-to-right disparity map d l e f t 2 r i g h t and the right-to-left disparity map d r i g h t 2 l e f t . This contributes to solving the problem that the inferred disparity has texture-copy artifacts and depth discontinuity errors, which is defined as follows:
d l e f t 2 r i g h t f , m , c = f w + ( d l f , m , c , d r f , m , c )
d r i g h t 2 l e f t f , m , c = f w ( d r f , m , c , d l f , m , c )
L r c o n = | | d l e f t 2 r i g h t f , m , c d r f , m , c | |
L l c o n = | | d r i g h t 2 l e f t f , m , c d l f , m , c | |
L c o n = L r c o n + L l c o n .
Smoothness Loss: As suggested in [1,6], we used an edge-aware smoothness loss L s m o o t h to discourage any shrinking of the predicted depth:
L s m o o t h n e s s = | x d t * | e | x I t | + | y d t * | e | y I t | ,
where d t * = d t / d t ¯ , d , and I represent the mean-normalized disparity [25], the disparity gradient, and the image gradient, respectively. This loss contributes to making disparities locally smooth, which ultimately improves the prediction accuracy.

4. Experiments

In this section, we analyze the performance of our model trained on the KITTI 2015 driving dataset according to standard metrics. We also perform quantitative and qualitative comparisons with existing studies trained using the same data split as our model (Eigen split). Our model outperforms other studies in various metrics. This section also provides a logical analysis of the experimental results.

4.1. Experimental Setup

4.1.1. Datasets

KITTI: We used the left/right image data provided by the KITTI 2015 driving dataset for the unsupervised learning-based depth-estimation network training. The KITTI dataset is a challenging real-world computer vision benchmark developed by utilizing an autonomous driving platform. The developers built a standard station wagon equipped with two high-resolution color/gray-scale video cameras. It is also equipped with a Velodyne laser scanner and a GPS positioning system to provide accurate ground-truth information. The raw dataset consisted of 61 scenes and included a total of 42,382 reconciled stereo image pairs. It also provides 3D point data for each image, which is used as target data in supervised learning and serves as the ground truth for performance measurements. We resized the provided image data and Velodyne depth map to a resolution of 768 × 384 before training, considering the effect on the batch-size decision according to the GPU memory size used for training. In addition, we expected that there would be less visual ambiguity in the training process due to the size of the course view and the medium view being 192 × 96 and 384 × 192 , respectively.
CityScapes: We also evaluated our model on the CityScapes dataset [14] to verify our model’s generalization performance. The CityScapes dataset is a large-scale dataset containing a diverse set of stereo video sequences recorded from street scenes from 50 different cities, with high-quality pixel-level annotations of 5000 frames (fine annotations) in addition to a larger set of 20,000 weakly annotated frames (coarse annotations). It consists of 22,900 training images, 500 validation images, and 1525 test images. Since several images contain artifacts at the top/bottom of the images, and both left and right cameras unnecessarily captured some parts of the experimental car, the top 50 and bottom 224 rows of pixels are cropped to compensate. Cropping is also performed at the sides of the images to maintain the width–height ratio.

4.1.2. Implementation Details and Parameter Settings

Our model has been implemented using PyTorch [34]. We trained our model for 100 epochs with a batch size of 14. In the training process, each epoch takes 1 hour when using a single GeForce GTX TITAN X GPU. The resolution of the input/output images and disparity maps is 768 × 384 .
The output disparities are the values passed through the sigmoid activation function. These are bound between 0 and d l i m i t using sigmoid nonlinearity, where d l i m i t = 0.15 × image width. We use a ResNet50-based auto-encoder for depth prediction. Our model outputs three disparity maps of different sizes in the decoder. The first predicted disparity map is upscaled and concatenated with a larger one in the channel direction, which is repeated once more in the following step. We compute the suggested losses for each of the three disparity maps. An Adam optimizer [35] is used to optimize our model with β 1 = 0.5 and β 2 = 0.999 . The initial learning rate is 1 × 10 4 . It decreases by one half from the 15th to the 29th epoch, by one half again from the 30th to the 39th epoch, and by one fifth from the 40th epoch to the end.
We also performed several data-augmentation techniques to prevent over-fitting and enrich the training data: we randomly performed (1) horizontal flips, (2) gamma, (3) brightness, and (4) color transformation with a 50 percent probability and ± 0.15 range value. We set α of Equation (7) to 0.5. In addition, we set the weight of the image-reconstruction loss to 1, the left–right consistency loss to 1 and the smoothness loss to 0.05 for the total loss. Based on the general principle of hyperparameter setting, we have repeatedly evaluated the network accuracy with randomly sampled validation data to set the optimal values.

4.2. Evaluation on KITTI Dataset

We trained the network using an Eigen split [15] for fair performance comparisons with other studies. The Eigen split consisted of 22 , 600 image pairs for training and 697 image pairs for testing. The depth ground-truth data were used to measure performance during testing.

4.2.1. Quantitative Results

We compared the test results of our model with other works trained with different types of unsupervised models. All models have been trained on the Eigen split of the KITTI 2015 driving dataset. Table 2 shows the quantitative results. N, d ^ i , and d i represent the total number of pixels, predicted depth value, and ground-truth depth value for pixel i, respectively. For the quantitative evaluation, we used several standard evaluation metrics, which are as follow.
(1)
Absolute relative error (Abs Rel): 1 N i = 1 N | | d ^ i d i | | d i .
(2)
Squared relative error (Sq Rel): 1 N i = 1 N | | d ^ i d i | | 2 d i .
(3)
Root-mean-squared error (RMSE): 1 N i = 1 N ( d ^ i d i ) 2 .
(4)
Mean l o g 10 error (RMSE log): 1 N i = 1 N | | l o g ( d ^ i ) l o g ( d i ) | | 2 .
(5)
Accuracy with threshold t, that is, the percentage of d ^ i such that δ = m a x ( d i d ^ i , d ^ i d i ) < t , where t [ 1.25 , 1 . 25 2 , 1 . 25 3 ] .
For (1)–(4), the lower the score, the better the results. For (5), the higher the score, the better the outcome. In category S, the category of our model, the best results are highlighted in bold red. The second-best results are underlined blue.
Our model learns how to generate disparity maps needed for the image-to-image transformation process in an unsupervised model based on stereo images (S). As compared to models that were similarly trained, our model has superior performance on all metrics, except for absolute relative error, and achieved second-best in the last metric. In particular, it shows better results than Monodepth [6], which has a similar network structure to our model. This demonstrates the importance of a effective loss function, such as a pre-trained PieAPP model. As compared to unsupervised models based on video sequences (M), our model’s performance is better. As compared to models that have sufficient advantages by using both learning methods (MS) together, our model has superior performance in all metrics, except absolute relative error and squared relative error. It is more robust even in cases that are sensitive to large depth errors, such as a root-mean-squared error. Considering that unsupervised methods are relatively advantageous for large-scale data acquisition, they have ample potential for further improvement in the future. By training more data, the performance of the current model can be further improved. In addition, the mechanism of operating effective perceptual IQAs as an image-reconstruction loss can be applied for semi-supervised learning.

4.2.2. Qualitative Results

Figure 2 shows the depth maps predicted by the various models for several images. Our model outperforms the other models. In particular, it shows better results than Monodepth [6], which has a network structure similar to ours. In depth-map images, areas are brighter when closer to the camera position and darker when further away. The depth-map images of our model do not have as sharp edges as Monodepth2 [1,7]. The boundaries between objects are relatively blurry. However, the overall predicted depth values appear more accurate. Areas inside objects are likely to have similar depth values, which means that the color values of the areas inside the object are uniform. In addition, the nearest and farthest areas should be represented with the lightest and darkest colors (excluding the sky), respectively. In the first image, our model accurately identifies the pixel area of the left truck. In addition, the depth values within the truck contour are constant. In the third image, the top right depth values of the ready-mixed concrete truck are well predicted. In the fourth image, the car on the right is the brightest. The depth values of the upper view of the sign located on the right-hand side of the sixth image are well measured. The absolute distance between the building in the seventh picture and the parked vehicle is not significant. Except for our model and Monodepth [6], the other models predict large differences in brightness, such as large differences in the distance between two objects. Our model correctly predicts the sign on the left and the building on the right in the last image. Although we do not use depth data for training, our model shows good results by using a powerful loss function.

4.2.3. Ablation Study

We performed an ablation study to analyze the effects of the proposed loss functions. In (a) and (b) of Table 3, the base model computes only the image-reconstruction loss. Our network shows the lowest performance when using only the L1 loss and shows better performance when it is replaced with PieAPP. However, as in (c)–(e), when the left–right consistency loss and smoothness loss are applied together, there is a noticeable performance improvement. This is because each loss contributes to increasing the overall accuracy by removing the texture-copy artifacts of the disparity maps and making the disparities locally smooth. The experimental model (e) calculates all the losses (L1, PieAPP, left–right consistency loss, and smoothness loss) presented in this paper. (c) shows the perceptual loss, that is, the performance when PieAPP is removed. As compared to (d) and (e), the overall performance degradation is quite large. According to the table, the perceptual loss has a very large effect on the performance improvement.

4.3. Evaluation on CityScapes Dataset

To verify the generalization performance of our model, we tested the model on the CityScapes dataset with 1525 test images. For experimentation, we cropped the bottom part of each image and resized it to 768 × 384 , which is similar to the process performed on the KITTI dataset. Figure 3 shows the qualitative results of the test images of Cityscapes. Considering that various objects, such as cars, signs, people, trees, and bicycles, in the images were well represented in the depth maps, our model demonstrated its generalization performance by successfully predicting depth maps for different types of untrained images.

5. Conclusions

In this paper, we present an unsupervised learning-based neural network model that predicts the 3D depth of a monocular image using a stereo image as training data. Our model integrates a simple ResNet-based network with several loss functions. The network reconstructs the input image into images from different viewpoints, outputting an inverse depth or disparity map. As training progresses, it synthesizes the input image as closely as possible to the target image, proving that the model’s ability to accurately predict depth will evolve progressively. Therefore, the image-reconstruction loss function should give an exact figure for the difference between the reconstructed image and the target image. We hypothesize that using a perceptual IQA model that effectively mimics the human visual system as an image-reconstruction loss function can significantly improve image-synthesis performance. As a result, we select PieAPP, which achieved a high ranking in the IQA algorithm-performance competition, as the image-reconstruction loss. Our model uses stereo images from the KITTI 2015 driving data set for training. For a fair comparison with existing studies, training is performed according to the Eigen split. Although our model adopts a simple ResNet50-based network structure, it shows surprising results that outperform other models in various evaluation indicators thanks to its effective loss function. In addition, the generalization performance of the model was verified through testing on the CityScapes dataset. In particular, our model shows better results than Monodepth [6], while having a similar network structure. Through ablation studies, we specifically found that using a perceptual image-error-evaluation algorithm as an image-reconstruction loss function effectively improves the performance of unsupervised learning-based monocular depth prediction. Although the proposed perceptual IQA model mimics the human visual system, there is still room for improvement, and computer vision-based IQA methods are superior in some areas. In future research, it is necessary to analyze the effect of various IQA methods on depth-prediction performance in the same network or to consider network structures and technologies that can complement them.

Author Contributions

Conceptualization, H.P. and S.P.; methodology, H.P.; software, H.P.; validation, H.P. and S.P.; formal analysis, H.P.; investigation, H.P.; resources, H.P.; data curation, H.P.; writing—original draft preparation, H.P.; writing—review and editing, S.P.; visualization, H.P.; supervision, S.P.; project administration, S.P.; funding acquisition, S.P. All authors have read and agreed to the published version of the manuscript.

Funding

This paper is supported by the Education and Research Promotion Program of KOREATECH in 2021.

Institutional Review Board Statement

Not applicable.

Informed Consent Statement

Not applicable.

Data Availability Statement

Not applicable.

Conflicts of Interest

The authors declare no conflict of interest.

Abbreviations

The following abbreviations are used in this manuscript:
IQAImage Quality Assessment
PieAPPPerceptual Image-Error Assessment Through Pairwise Preference

References

  1. Godard, C.; Aodha, O.M.; Firman, M.; Brostow, G.J. Digging Into Self-Supervised Monocular Depth Estimation. In Proceedings of the IEEE/CVF International Conference on Computer Vision (ICCV), Seoul, Korea, 27 October–2 November 2019; pp. 3828–3838. [Google Scholar]
  2. Sak, H.; Senior, A.; Rao, K.; Beaufays, F. Fast and accurate recurrent neural network acoustic models for speech recognition. arXiv 2015, arXiv:1507.06947. [Google Scholar]
  3. Couprie, C.; Farabet, C.; Najman, L.; LeCun, Y. Indoor semantic segmentation using depth information. arXiv 2013, arXiv:1301.3572. [Google Scholar]
  4. Hazirbas, C.; Ma, L.; Domokos, C.; Cremers, D. FuseNet: Incorporating depth into semantic segmentation via fusion-based CNN architecture. In Computer Vision–ACCV 2016; Lecture Notes in Computer Science; Springer: Taiwan, China, 2016; pp. 213–228. [Google Scholar]
  5. Wang, Z.; Bovik, A.C.; Sheikh, H.R.; Simoncelli, E.P. Image quality assessment: From error visibility to structural similarity. IEEE Trans. Image Proc. 2004, 13, 600–612. [Google Scholar] [CrossRef] [PubMed]
  6. Godard, C.; Aodha, O.M.; Brostow, G.J. Unsupervised Monocular Depth Estimation With left–right Consistency. In Proceedings of the IEEE Conference on Computer Vision and Pattern Recognition (CVPR), Honolulu, HI, USA, 21–26 July 2017; pp. 270–279. [Google Scholar]
  7. Park, H.; Park, S.; Joo, Y. Relativistic Approach for Training Self-Supervised Adversarial Depth Prediction Model Using Symmetric Consistency. IEEE Access 2020, 8, 206835–206847. [Google Scholar] [CrossRef]
  8. Ding, K.; Ma, K.; Wang, S.; Simoncelli, E.P. Image Quality Assessment: Unifying Structure and Texture Similarity. IEEE Trans. Pattern Anal. Mach. Intell. 2022, 44, 2567–2581. [Google Scholar] [CrossRef] [PubMed]
  9. Zbontar, J.; LeCun, Y. Stereo matching by training a convolutional neural network to compare image patches. J. Mach. Learn. Res. 2016, 17, 2287–2318. [Google Scholar]
  10. Zhang, R.; Isola, P.; Efros, A.A.; Shechtman, E.; Wang, O. The Unreasonable Effectiveness of Deep Features as a Perceptual Metric. In Proceedings of the IEEE Conference on Computer Vision and Pattern Recognition (CVPR), Salt Lake City, UT, USA, 18–23 June 2018; pp. 586–595. [Google Scholar]
  11. Prashnani, E.; Cai, H.; Mostofi, Y.; Sen, P. PieAPP: Perceptual Image-Error Assessment Through Pairwise Preference. In Proceedings of the IEEE Conference on Computer Vision and Pattern Recognition (CVPR), Salt Lake City, UT, USA, 18–23 June 2018; pp. 1808–1817. [Google Scholar]
  12. He, K.; Zhang, X.; Ren, S.; Sun, J. Deep residual learning for image recognition. In Proceedings of the IEEE Conference on Computer Vision and Pattern Recognition (CVPR), Las Vegas, NV, USA, 27–30 June 2016. [Google Scholar]
  13. Geiger, A.; Lenz, P.; Urtasun, R. Are we ready for autonomous driving? The KITTI vision benchmark suite. In Proceedings of the 2012 IEEE Conference on Computer Vision and Pattern Recognition, Providence, RI, USA, 16–21 June 2012; pp. 3354–3361. [Google Scholar]
  14. Cordts, M.; Omran, M.; Ramos, S.; Rehfeld, T.; Enzweiler, M.; Benenson, R.; Franke, U.; Roth, S.; Schiele, B. The Cityscapes Dataset for Semantic Urban Scene Understanding. In Proceedings of the Proceedings of the IEEE Conference on Computer Vision and Pattern Recognition (CVPR), Las Vegas, NV, USA, 27–30 June 2016; pp. 3213–3223. [Google Scholar]
  15. Eigen, D.; Puhrsch, C.; Fergus, R. Depth map prediction from a single image using a multi-scale deep network. In Proceedings of the 27th International Conference on Neural Information Processing Systems, Montreal, QC, Canada, 8–13 December 2014; pp. 2366–2374. [Google Scholar]
  16. Liu, M.; Salzmann, M.; He, X. Discrete-Continuous Depth Estimation from a Single Image. In Proceedings of the IEEE Conference on Computer Vision and Pattern Recognition (CVPR), Columbus, OH, USA, 23–28 June 2014; pp. 716–723. [Google Scholar]
  17. Saxena, A.; Sun, M.; Ng, A.Y. Make3D: Learning 3D Scene Structure from a Single Still Image. IEEE Trans. Pattern Anal. Mach. Intell. 2009, 31, 824–840. [Google Scholar] [CrossRef] [PubMed]
  18. Silberman, N.; Hoiem, D.; Kohli, P.; Fergus, R. Indoor segmentation and support inference from rgbd images. In European Conference on Computer Vision; Springer: Berlin/Heidelberg, Germany, 2012. [Google Scholar]
  19. Fu, H.; Gong, M.; Wang, C.; Batmanghelich, K.; Tao, D. Deep Ordinal Regression Network for Monocular Depth Estimation. In Proceedings of the IEEE Conference on Computer Vision and Pattern Recognition (CVPR), Salt Lake City, UT, USA, 18–23 June 2018; pp. 2002–2011. [Google Scholar]
  20. Zhou, T.; Brown, M.; Snavely, N.; Lowe, D.G. Unsupervised Learning of Depth and Ego-Motion From Video. In Proceedings of the IEEE Conference on Computer Vision and Pattern Recognition (CVPR), Honolulu, HI, USA, 21–26 July 2017; pp. 1851–1858. [Google Scholar]
  21. Mayer, N.; Ilg, E.; Häusser, P.; Fischer, P.; Cremers, D.; Dosovitskiy, A.; Brox, T. A Large Dataset to Train Convolutional Networks for Disparity, Optical Flow, and Scene Flow Estimation. In Proceedings of the 2016 IEEE Conference on Computer Vision and Pattern Recognition (CVPR), Las Vegas, NV, USA, 27–30 June 2016; pp. 4040–4048. [Google Scholar]
  22. Yang, Z.; Wang, P.; Xu, W.; Zhao, L.; Nevatia, R. Unsupervised learning of geometry with edge-aware depth-normal consistency. arXiv 2018, arXiv:1711.03665. [Google Scholar] [CrossRef]
  23. Mahjourian, R.; Wicke, M.; Angelova, A. Unsupervised Learning of Depth and Ego-Motion From Monocular Video Using 3D Geometric Constraints. In Proceedings of the IEEE Conference on Computer Vision and Pattern Recognition (CVPR), Salt Lake City, UT, USA, 18–23 June 2018; pp. 5667–5675. [Google Scholar]
  24. Yin, Z.; Shi, J. GeoNet: Unsupervised Learning of Dense Depth, Optical Flow and Camera Pose. In Proceedings of the IEEE Conference on Computer Vision and Pattern Recognition (CVPR), Salt Lake City, UT, USA, 18–23 June 2018; pp. 1983–1992. [Google Scholar]
  25. Wang, C.; Buenaposada, J.M.; Zhu, R.; Lucey, S. Learning Depth From Monocular Videos Using Direct Methods. In Proceedings of the IEEE Conference on Computer Vision and Pattern Recognition (CVPR), Salt Lake City, UT, USA, 18–23 June 2018; pp. 2022–2030. [Google Scholar]
  26. Engel, J.; Schöps, T.; Cremers, D. LSD-SLAM: Large-scale direct monocular SLAM. In European Conference on Computer Vision; Springer: Cham, Switherland, 2014. [Google Scholar]
  27. Luo, C.; Yang, Z.; Wang, P.; Wang, Y.; Xu, W.; Nevatia, R.; Yuille, A. Every Pixel Counts ++: Joint Learning of Geometry and Motion with 3D Holistic Understanding. IEEE Trans. Pattern Anal. Mach. Intell. 2019, 42, 2624–2641. [Google Scholar] [CrossRef] [PubMed]
  28. Garg, R.; Kumar, V.; Gustavo, B.G.; Reid, C. Unsupervised CNN for Single View Depth Estimation: Geometry to the Rescue. In European Conference on Computer Vision (ECCV); Springer: Berlin/Heidelberg, Germany, 2016; Volume 9912, pp. 740–756. [Google Scholar]
  29. Pillai, S.; Ambruş, R.; Gaidon, A. SuperDepth: Self-Supervised, Super-Resolved Monocular Depth Estimation. In Proceedings of the 2019 International Conference on Robotics and Automation (ICRA), Montreal, QC, Canada, 20–24 May 2019; pp. 9250–9256. [Google Scholar]
  30. Xue, W.; Zhang, L.; Mou, X.; Bovik, A.C. Gradient Magnitude Similarity Deviation: A Highly Efficient Perceptual Image Quality Index. IEEE Trans. Image Proc. 2014, 23, 684–695. [Google Scholar] [CrossRef] [PubMed] [Green Version]
  31. Goodfellow, I.; Pouget-Abadie, J.; Mirza, M.; Xu, B.; Warde-Farley, D.; Ozair, S.; Courville, A.; Bengio, Y. Generative Adversarial Nets. In Proceedings of the Advances in Neural Information Processing Systems 27 (NIPS 2014), Montreal, QC, Canada, 8–13 December 2014. [Google Scholar]
  32. Jolicoeur-Martineau, A. The relativistic discriminator: A key element missing from standard GAN. In Proceedings of the International Conference on Learning Representations (ICLR) 2019, New Orleans, LA, USA, 6–9 May 2019. [Google Scholar]
  33. Kastryulin, S.; Zakirov, D.; Prokopenko, D. PyTorch Image Quality: Metrics and Measure for Image Quality Assessment. Available online: https://github.com/photosynthesis-team/piq/ (accessed on 3 March 2022).
  34. Paszke, A.; Gross, S.; Chintala, S.; Chanan, G.; Yang, E.; DeVito, Z.; Lin, Z.; Desmaison, A.; Antiga, L.; Lerer, A. Automatic differentiation in PyTorch. In Proceedings of the 31st Conference on Neural Information Processing Systems (NIPS 2017), Long Beach, CA, USA, 4–9 December 2017. [Google Scholar]
  35. Kingma, D.P.; Ba, J. Adam: A Method for Stochastic Optimization. arXiv 2014, arXiv:1412.6980. [Google Scholar]
Figure 1. Illustration of the detailed framework and loss functions for the proposed unsupervised depth-estimation model. ( I l : left image, I r : right image, d l : disparity map to warp left, d r : disparity map to warp right, w + : warping right, w : warping left, I ^ l : reconstructed left image, I ^ r : reconstructed right image, L L 1 : L1 loss between the reconstructed and target images, L p i e a p p : PieAPP loss between the reconstructed and target images, L c o n : left–right consistency loss, L s m o o o t h n e s s : smoothness loss).
Applsci 12 08829 g001
Figure 2. Qualitative results: comparison with several representative unsupervised learning-based models (Wang et al. (2018) [25], Yin et al. (2018) [24], Godard et al. (2017) [6], Godard et al. (2019) [1], Park et al. (2020) [7]).
Applsci 12 08829 g002
Figure 3. Qualitative results on CityScapes dataset for verifying our model’s generalization performance.
Applsci 12 08829 g003
Table 1. Image-reconstruction loss of each unsupervised learning-based depth prediction study.
TypeMethodImage-Reconstruction Loss
UVS (M)Zhou [20]L1 pixel-wise photometric loss
Yang [22]L1 pixel-wise photometric loss
Mahjourian [23]L1 pixel-wise photometric loss
GeoNet [24]A linear combination of L1 photometric loss and sigle scale SSIM loss
DDVO [25]A linear combination of L1 photometric loss and sigle scale SSIM loss
EPC++ [27]L1 pixel-wise photometric loss
USI (S)Garg [28]L2 pixel-wise photometric loss
Godard [6]A linear combination of L1 photometric loss and sigle scale SSIM loss
SuperDepth [29]A linear combination of L1 photometric loss and sigle scale SSIM loss
Monodepth2 [1]A linear combination of L1 photometric loss and sigle scale SSIM loss
Park+pp [7]A linear combination of L1 photometric loss and sigle scale GMSD loss
Table 2. Quantitative Results: Comparison with unsupervised learning-based monocular depth-estimation models. Unsupervised monocular depth-estimation models are divided into the following categories: (M) Unsupervised model based on video sequence (Monocular supervision; USI model), (S) Unsupervised model based on stereo images (Stereo supervision; USV model), and (MS): Monocular + stereo supervision.
TypeMethodAbs RelSq RelRMSERMSE log δ < 1.25 δ < 1 . 25 2 δ < 1 . 25 3
MZhou [20]0.1831.5956.7090.2700.7340.9020.959
Yang [22]0.1821.4816.5010.2670.7250.9060.963
Mahjourian [23]0.1631.2406.2200.2500.7620.9160.968
GeoNet [24]0.1491.0605.5670.2260.7960.9350.975
DDVO [25]0.1511.2575.5830.2280.8100.9330.974
EPC++ [27]0.1411.0295.3500.2160.8160.9410.979
SGarg [28]0.1521.2265.8490.2460.7840.9210.967
Godard [6]0.1481.3445.9270.2470.8030.9220.964
SuperDepth+pp [29] ( 1024 × 382 )0.1120.8754.9580.2070.8520.9470.977
Monodepth2 [1] ( 640 × 192 )0.1090.8734.9600.2090.8640.9480.975
Park+pp [7]0.1210.8364.8080.1940.8590.9570.982
Ours0.1160.8734.8050.1980.8690.9530.977
Ours+pp0.1120.8324.7410.1920.8760.9570.980
MSEPC++ [27]0.1280.9355.0110.2090.8310.9450.979
Monodepth2 [1]0.1060.8184.7500.1960.8740.9570.979
Table 3. Ablation study for analyzing the effectiveness of our perceptual loss. (In the table, "Smooth" represents the smoothness loss.
MethodL1PieAPPLeft–RightSmoothAbsSqRMSERMSE δ < δ < δ <
Consistency RelRel log1.251.2521.253
(a) Base (L1) 0.1971.8496.1040.2780.7220.8870.944
(b) Base (PieAPP) 0.1901.6786.2240.3000.7290.8920.947
(c) Ours without PieAPP 0.1491.1345.5590.2270.7990.9370.973
(d) Ours without L1 0.1371.0145.2120.2110.8350.9500.975
(e) Ours (full)0.1160.8734.8050.1980.8690.9530.977
Publisher’s Note: MDPI stays neutral with regard to jurisdictional claims in published maps and institutional affiliations.

