
Forest Fire Risk Forecasting with the Aid of Case-Based Reasoning


Abstract
:1. Introduction
- A domain model and a case model that provide a compact representation of information about weather conditions, vegetation type, and infrastructure of the region in relation to the possible risk of a wildfire. Information from various sources was used to build these models: GIS data, satellite images, weather stations data, literature, statistics, forest regulations, and expert assessments;
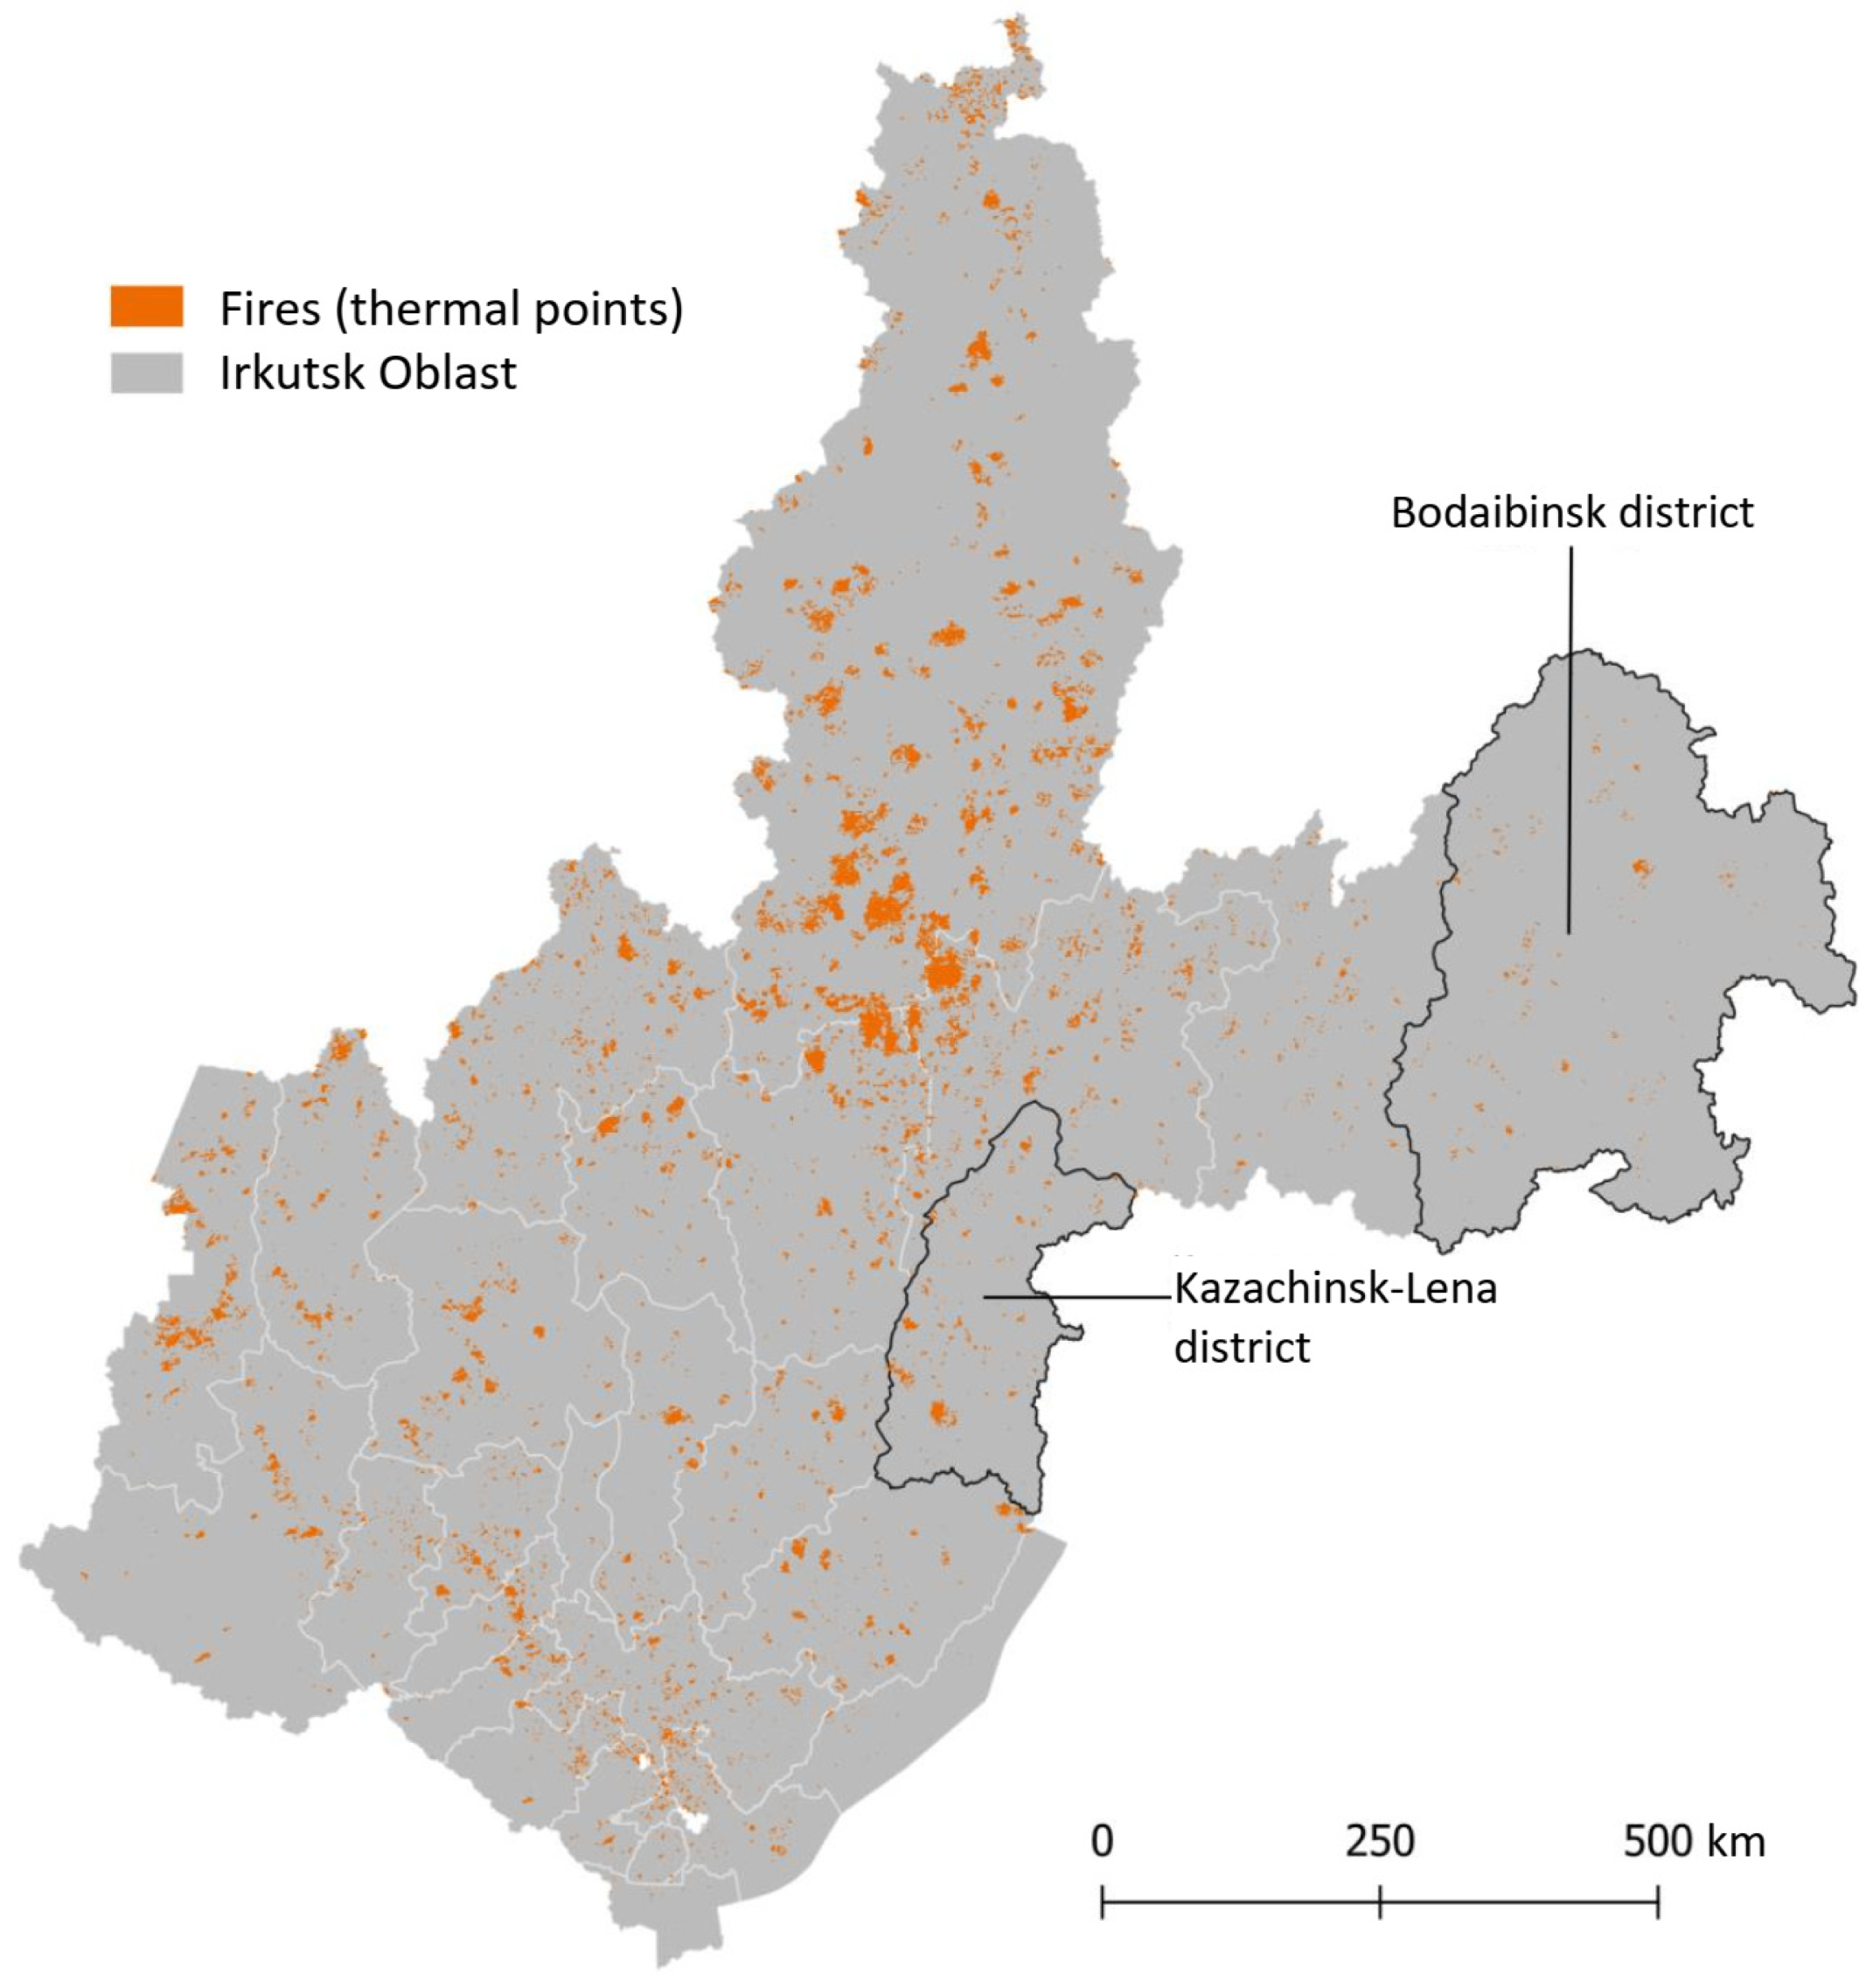
- A case base containing information about 2240 fires in Irkutsk Oblast for the period from 2017 to 2020. This case base was formed on the basis of the database that includes more than 45,000 records describing information about thermal points identified as a result of analysis of satellite images;
- A methodology for creating prototypes of case bases, providing the transformation of decision tables of a special type. The methodology includes the use of an original tool, namely personal knowledge base designer (PKBD) [23], and contains the following steps: preparing CSV files with decision tables for PKBD import, importing CSV files containing information for cases with the creation of a knowledge base, and testing imported data by queries with subsequent correction of the data. This methodology is a specialization of the approach from [24] for case bases;
- The results of evaluating the effectiveness of solving the task of forecasting the risk of wildfires based on CBR. The accuracy score was 0.51, which is lower than that of similar studies, but it can be further improved, including by clarifying the weights of the properties used in the case-retrieval procedure.
2. Background
2.1. Forecasting the Risk of Forest Fires
2.2. Realated Works: Using CBR for Forest Fires Forecasting
2.3. Case-Based Approach: Basic Principles
- They represent domain specific knowledge related to the context that allows one to use this knowledge at the application level;
- They can be presented in various forms, cover different time periods, and be associated with solutions with descriptions of problems, results, situations, etc.
- Identifying (characterizing), which describes the experience in a way that allows one to assess the possibility of its reuse in a specific situation;
- Training (solution), which is a solution to a problem, proof of a solution (conclusion), alternative, or unsuccessful solutions.
hj(p*j,pij) = 0, |v*j − vij|≥ ξ,
3. Forecasting the Risk of Forest Wildfires Using a Case-Based Approach
3.1. The Study Area
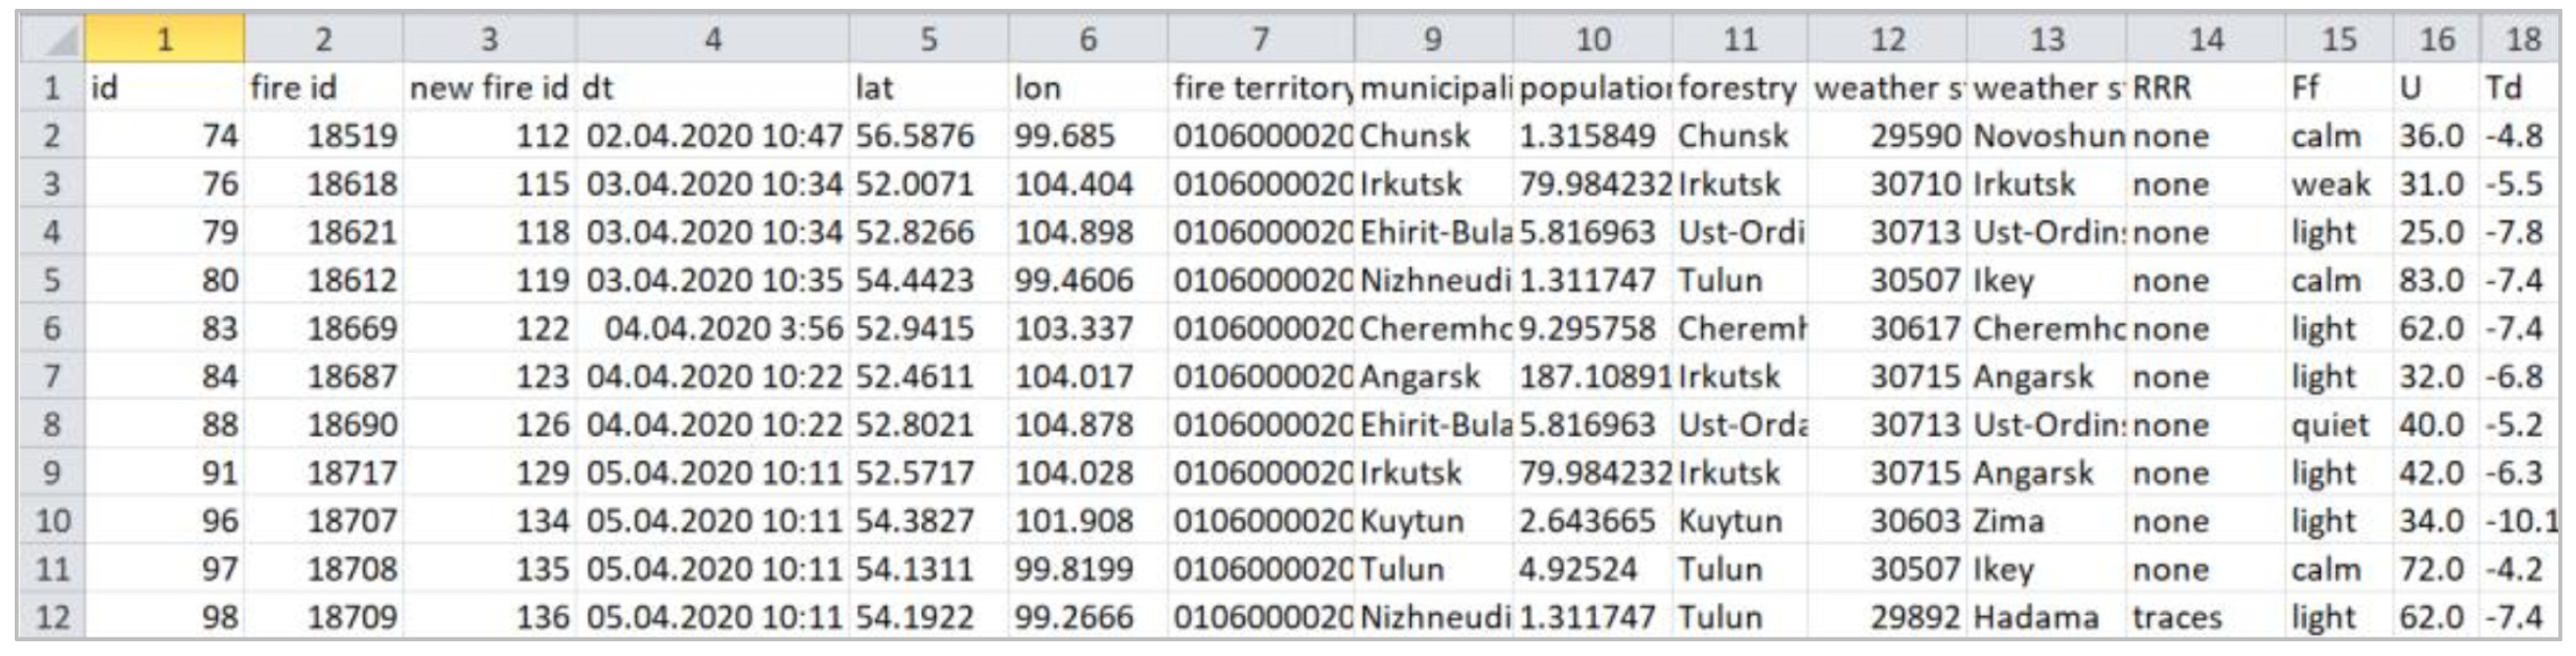
3.2. Data
3.3. Results (Employed Works)
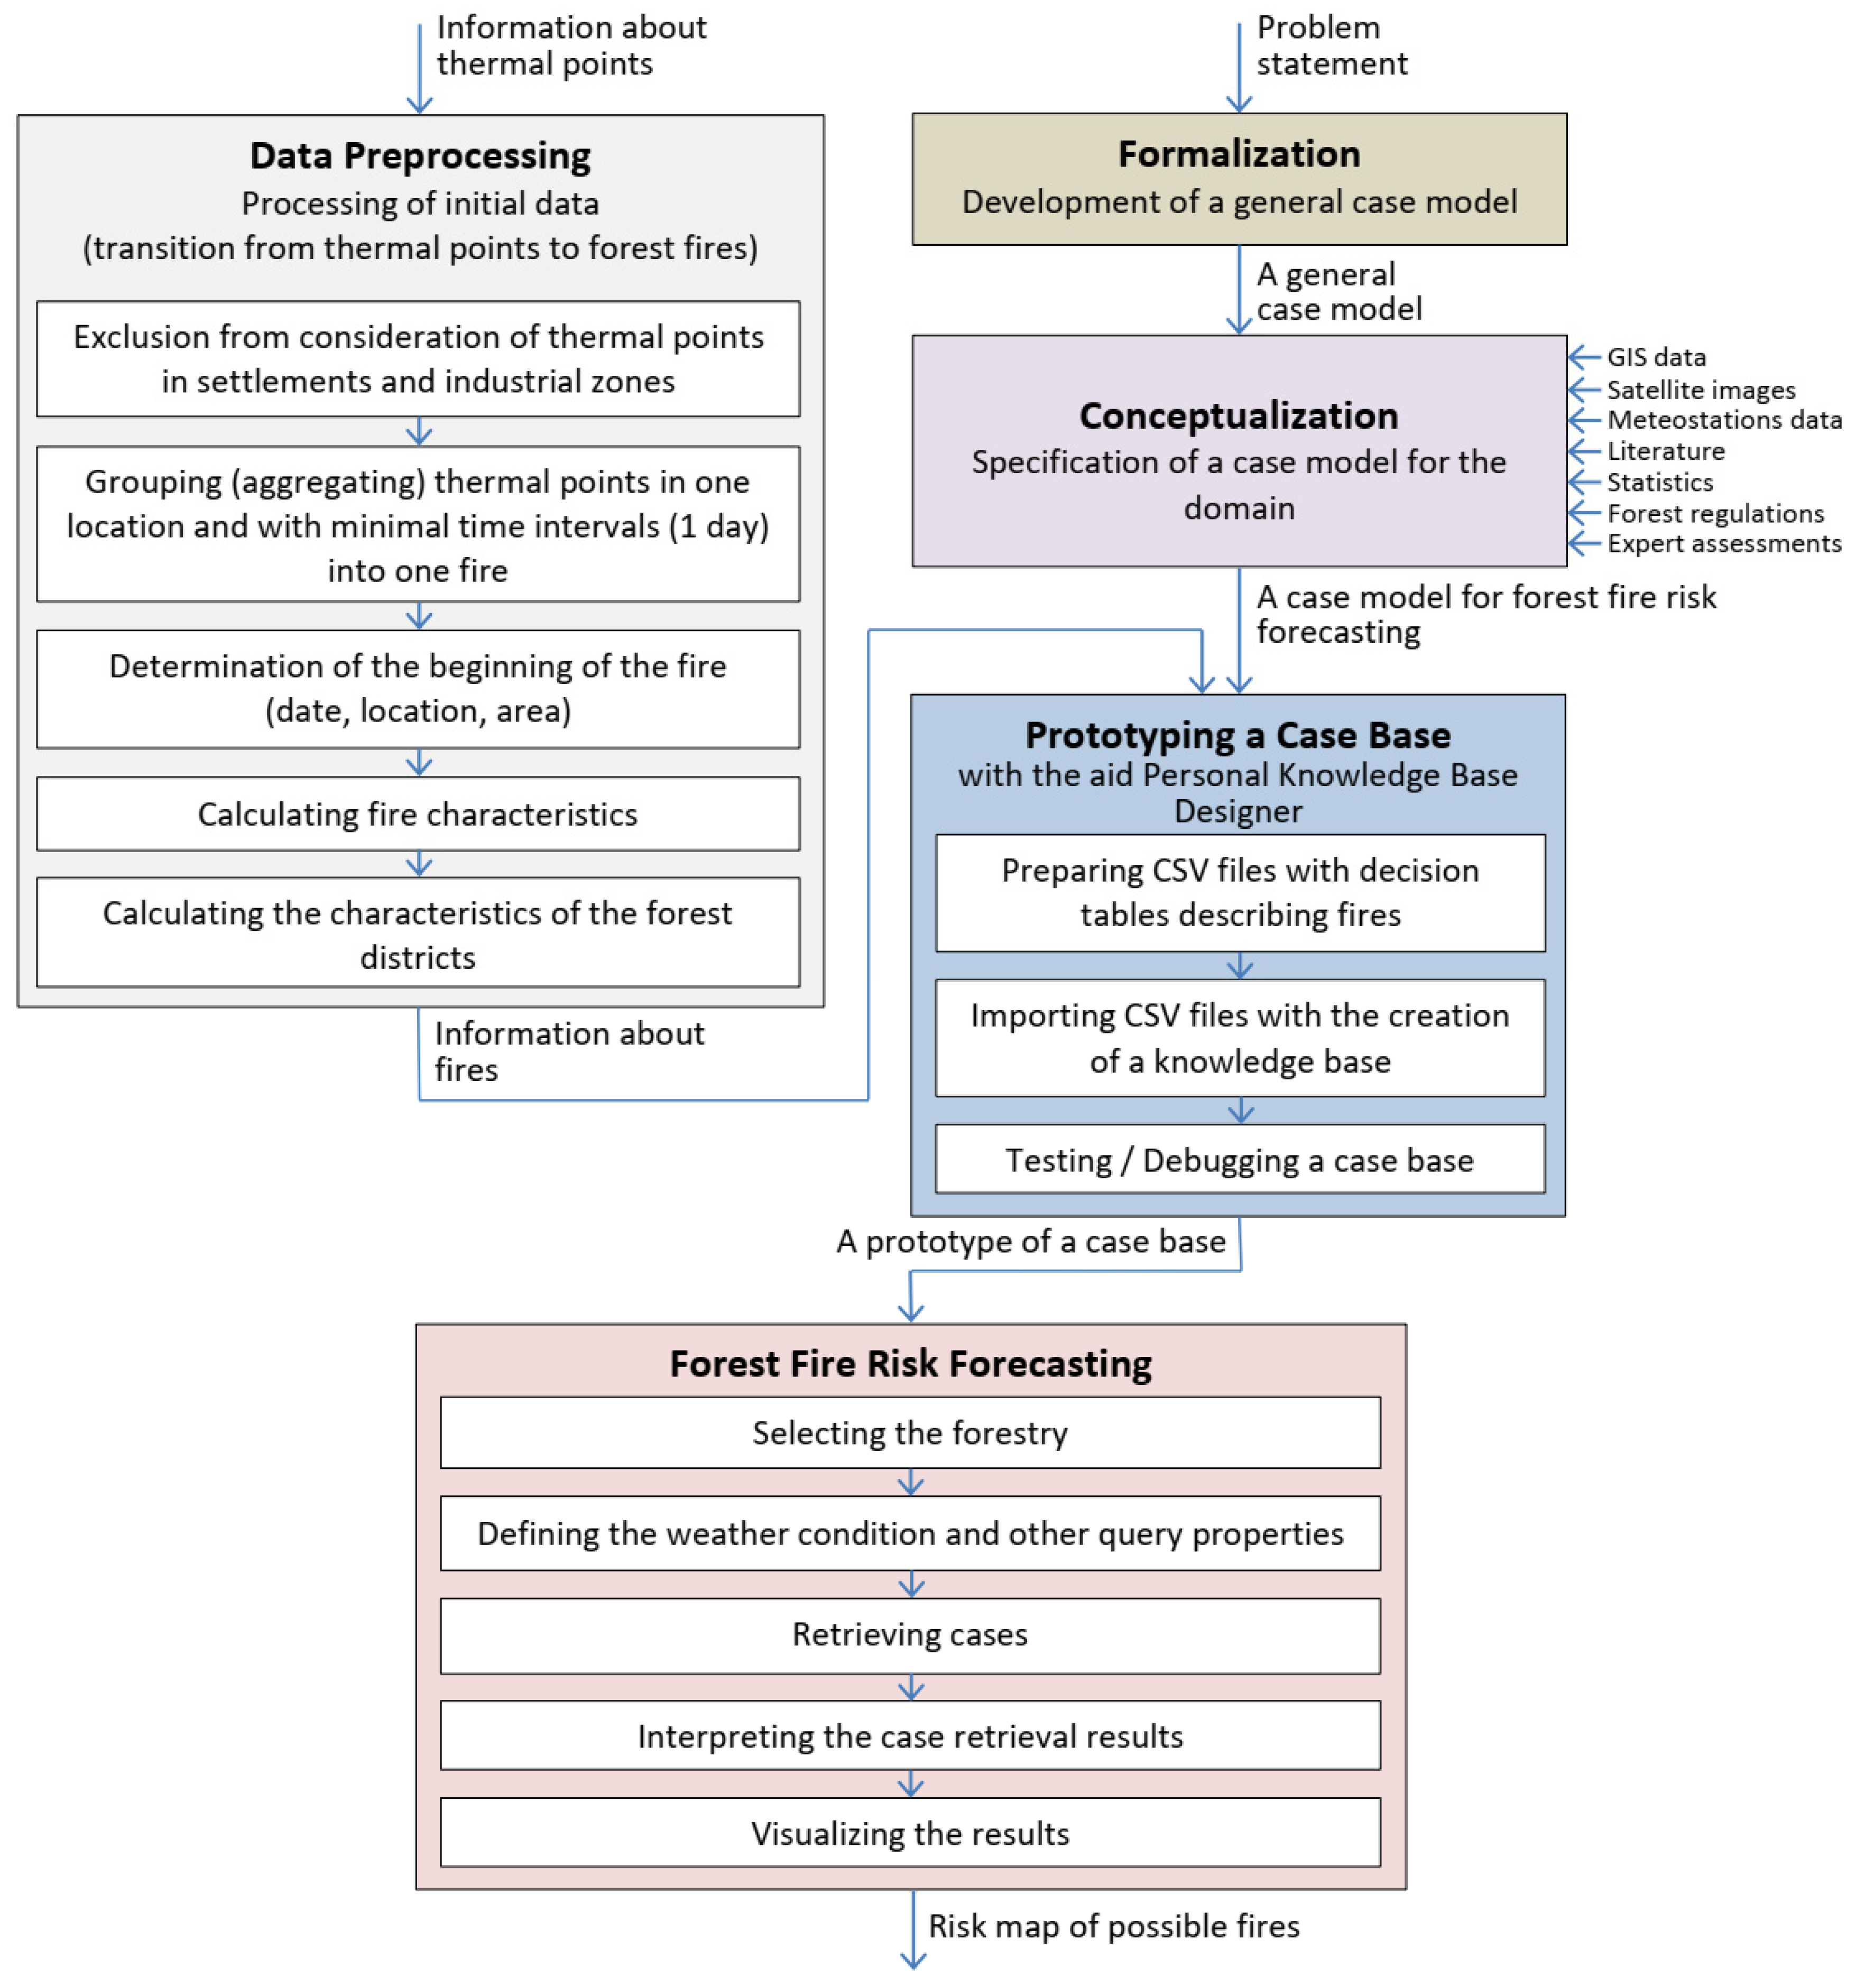
- Data preprocessing. This stage’s primary goal is the transition from thermal points to forest fires;
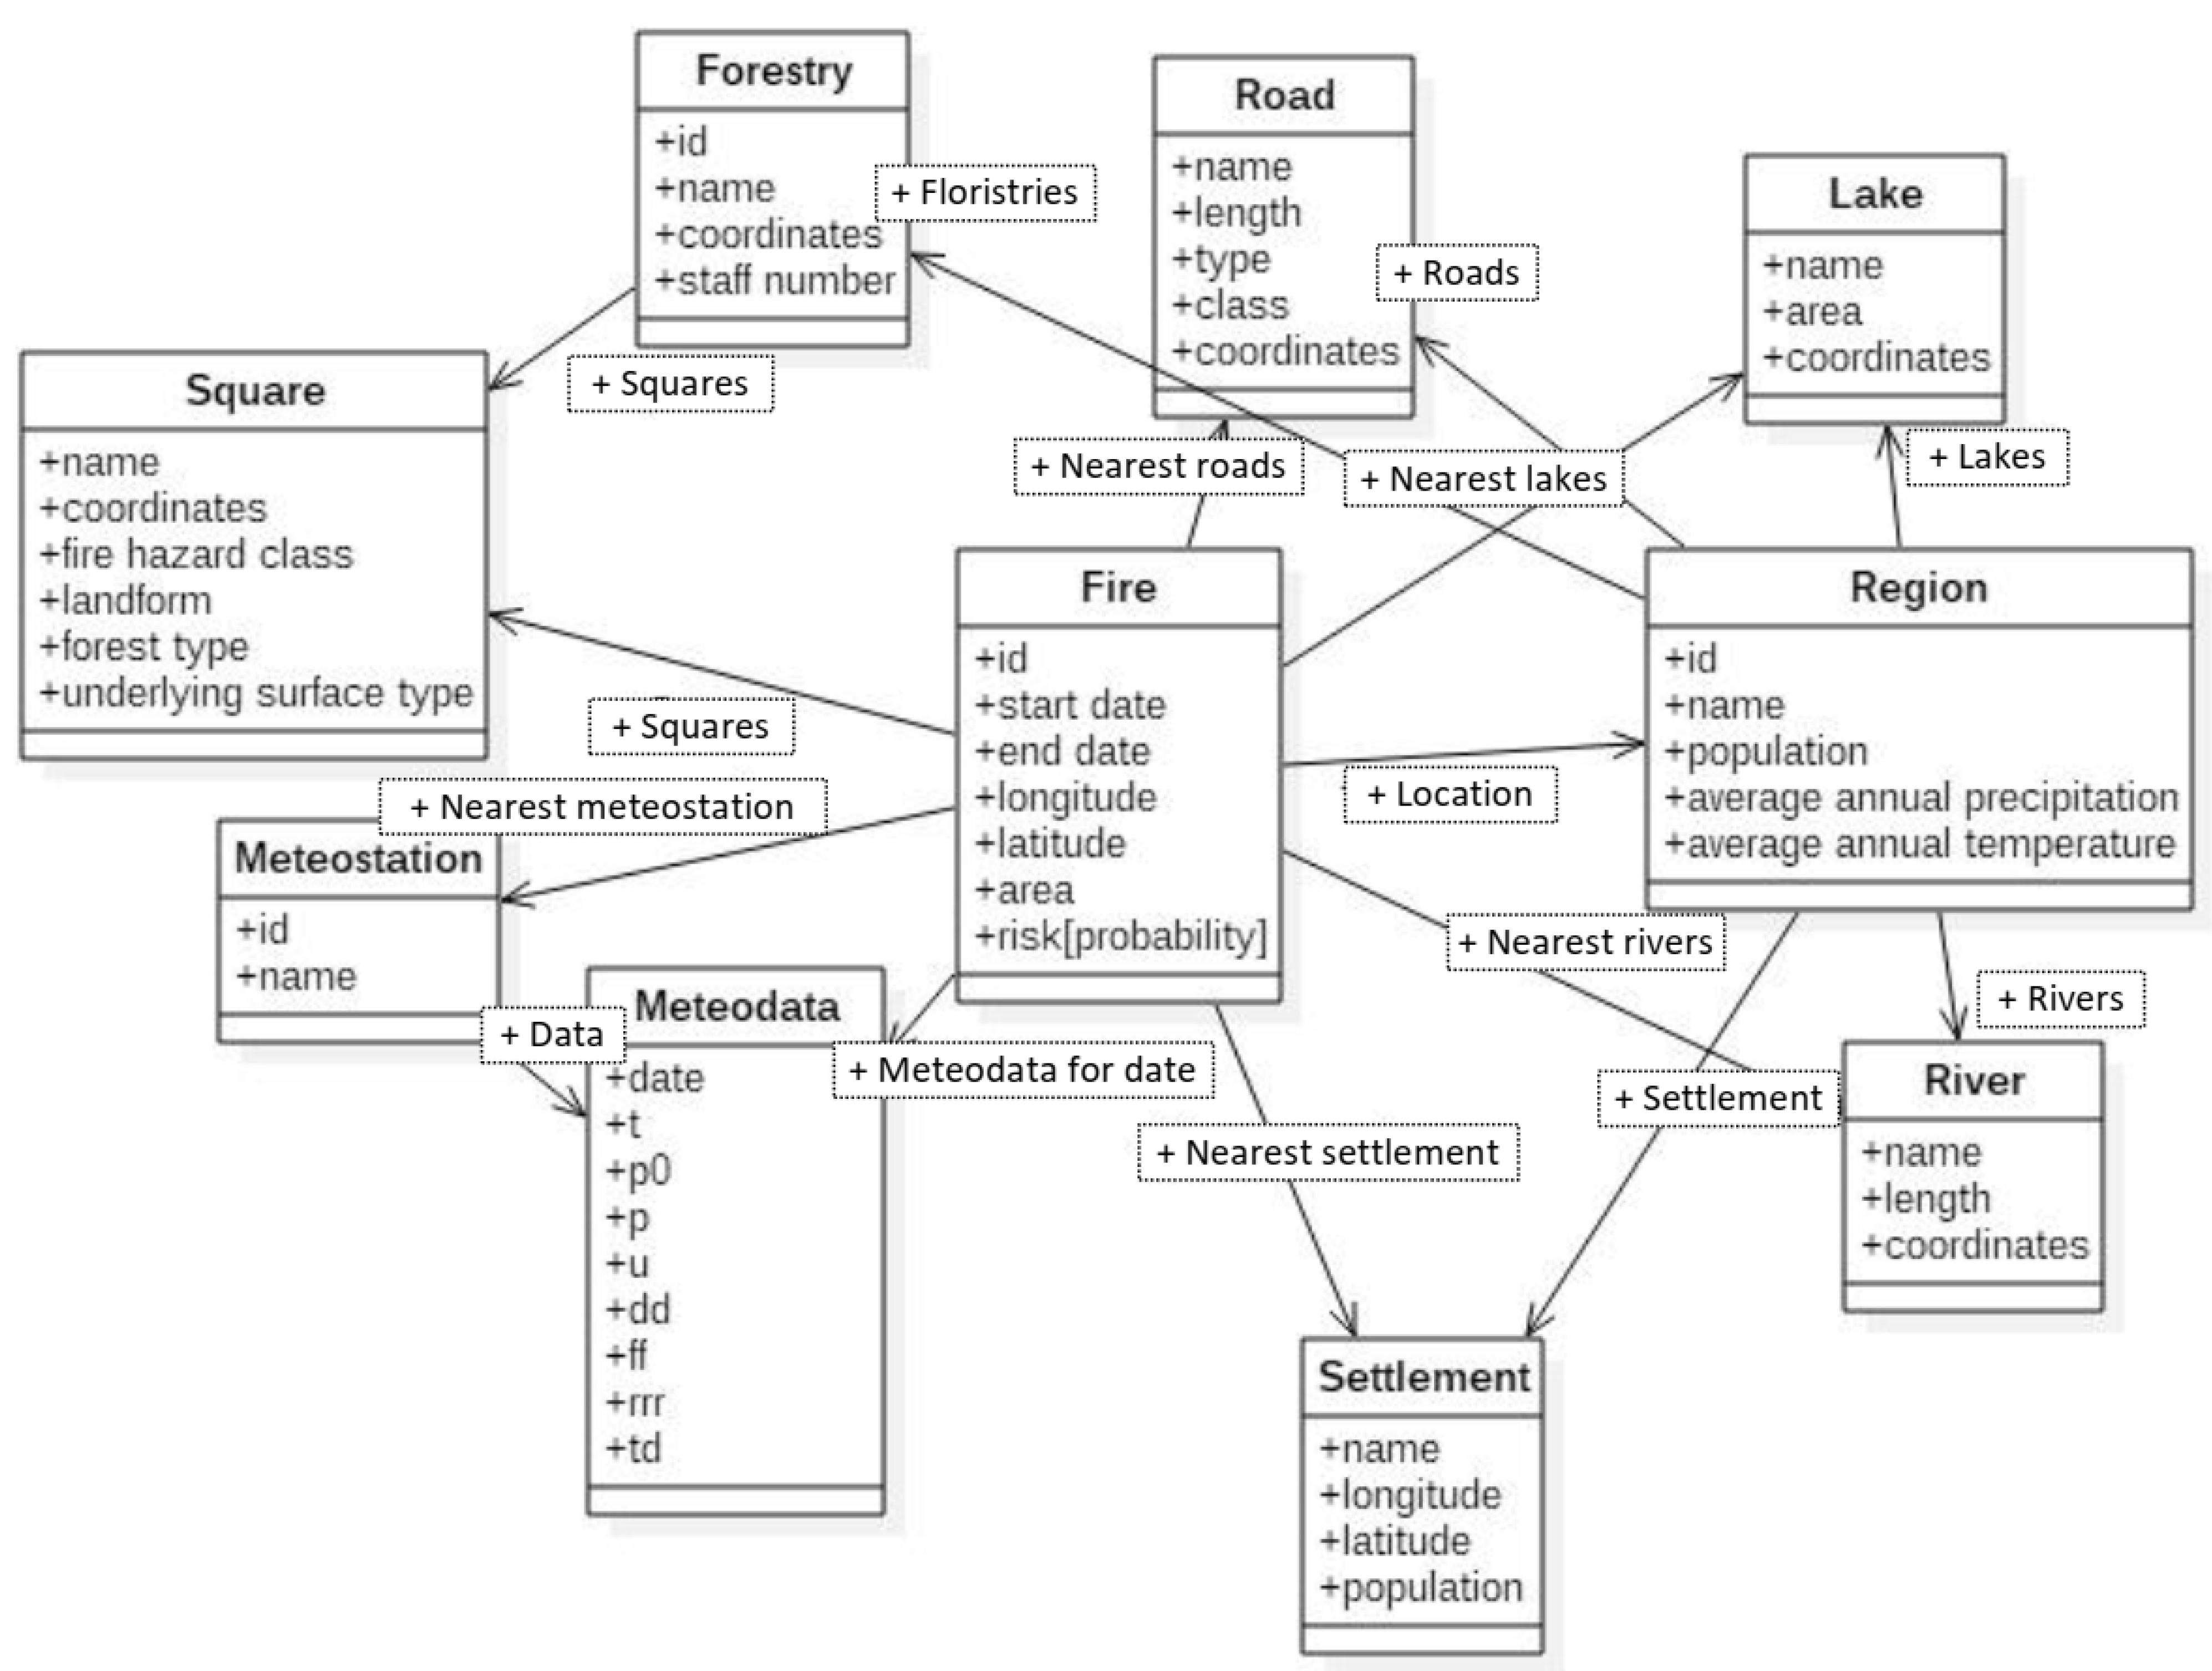
- Formalization. This stage’s main result is the structure of a case model;
- Conceptualization. This stage is dedicated to specifying a case model for the domain. In our case, the domain is the forecasting the risk of forest wildfires for Irkutsk Oblast;
- Prototyping a case base. This stage’s primary goal is to create and debug a case base based on information about fires and a specified case model;
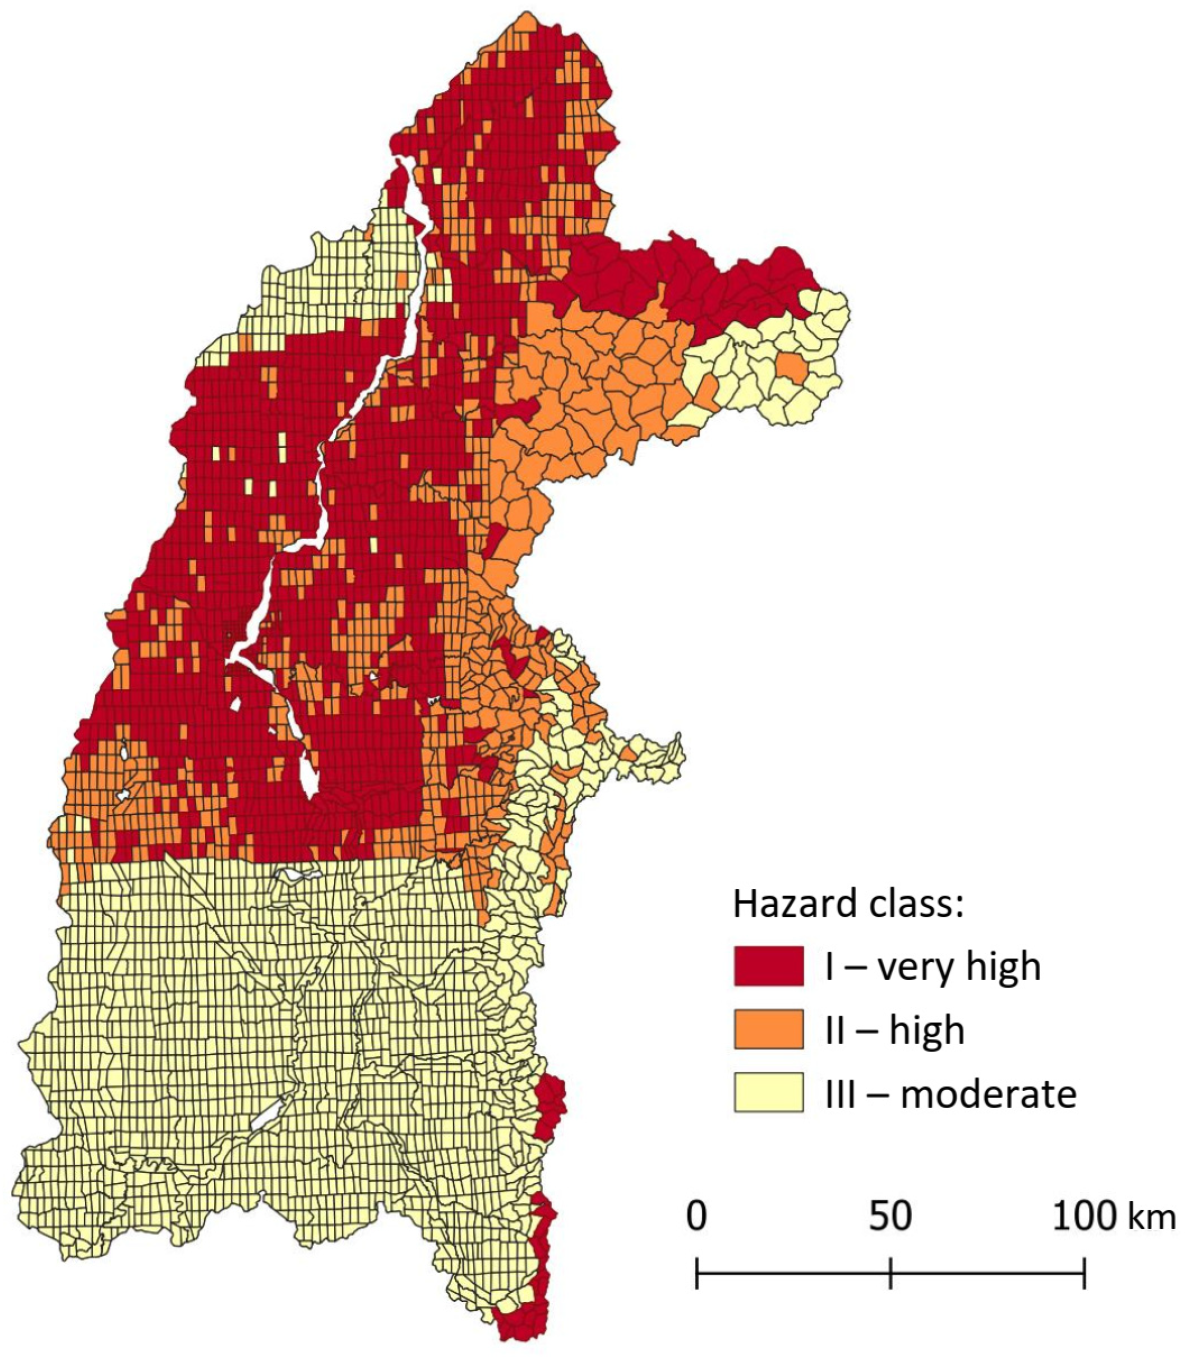
- Forest fire risk forecasting. This stage’s main result is fire risk assessments for forest quarters.
3.3.1. Data Preprocessing
- Thermal points located within the boundaries of industrial zones, populated areas, and mining zones that are not forest fires were identified, with their subsequent exclusion from consideration. The remaining thermal points were later interpreted as forest fires.
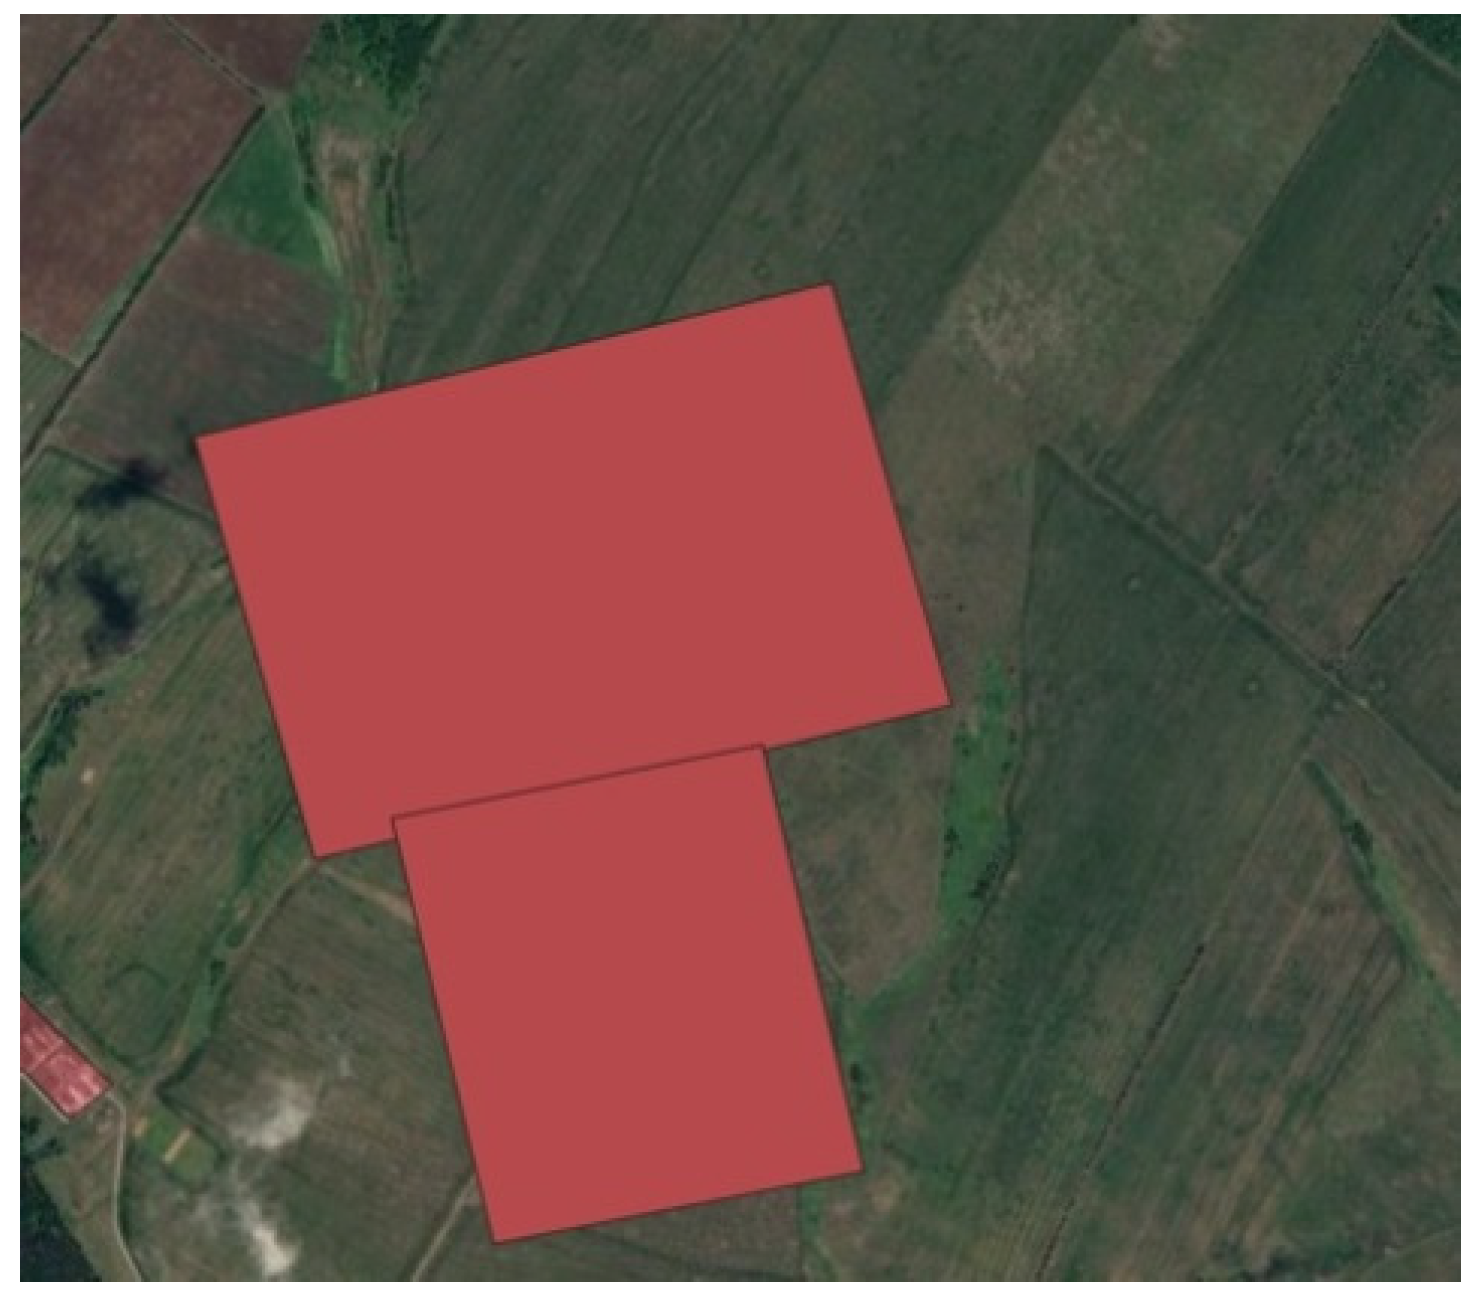
- Grouped (aggregated) information about fires is gathered by combining data characterized by the location of the fire on intersecting polygons and the minimum time interval, with the determination of the duration, minimum, and maximum area of the detected fire.
- The initial events (ignitions) of a forest fire are highlighted with the determination of the date of detection, coordinates, and the fire polygon.
- Calculation of characteristics of each fire:
- Area of each fire;
- Municipal formation, forestry, forest area, forest quarter on whose territory a fire was detected;
- Fire hazard class of the forest of the allocated territory;
- Fire hazard class of the forest of the allocated territory according to weather conditions;
- Forest-growing zone and forest-seed zoning area;
- Weather conditions based on the data of the meteorological stations closest to the fire;
- Data on the population density of municipalities affected by fires;
- Distances from each fire to roads and railways as well as rivers and lakes and the nearest settlements; determination of the intervals of these indicators.
- Calculation of statistical indicators:
- Number of fires and their areas in municipalities;
- Number of fires and their areas in forest zones;
- Number of fires and their areas in forest districts.
3.3.2. Formalization
3.3.3. Conceptualization and a Case Model
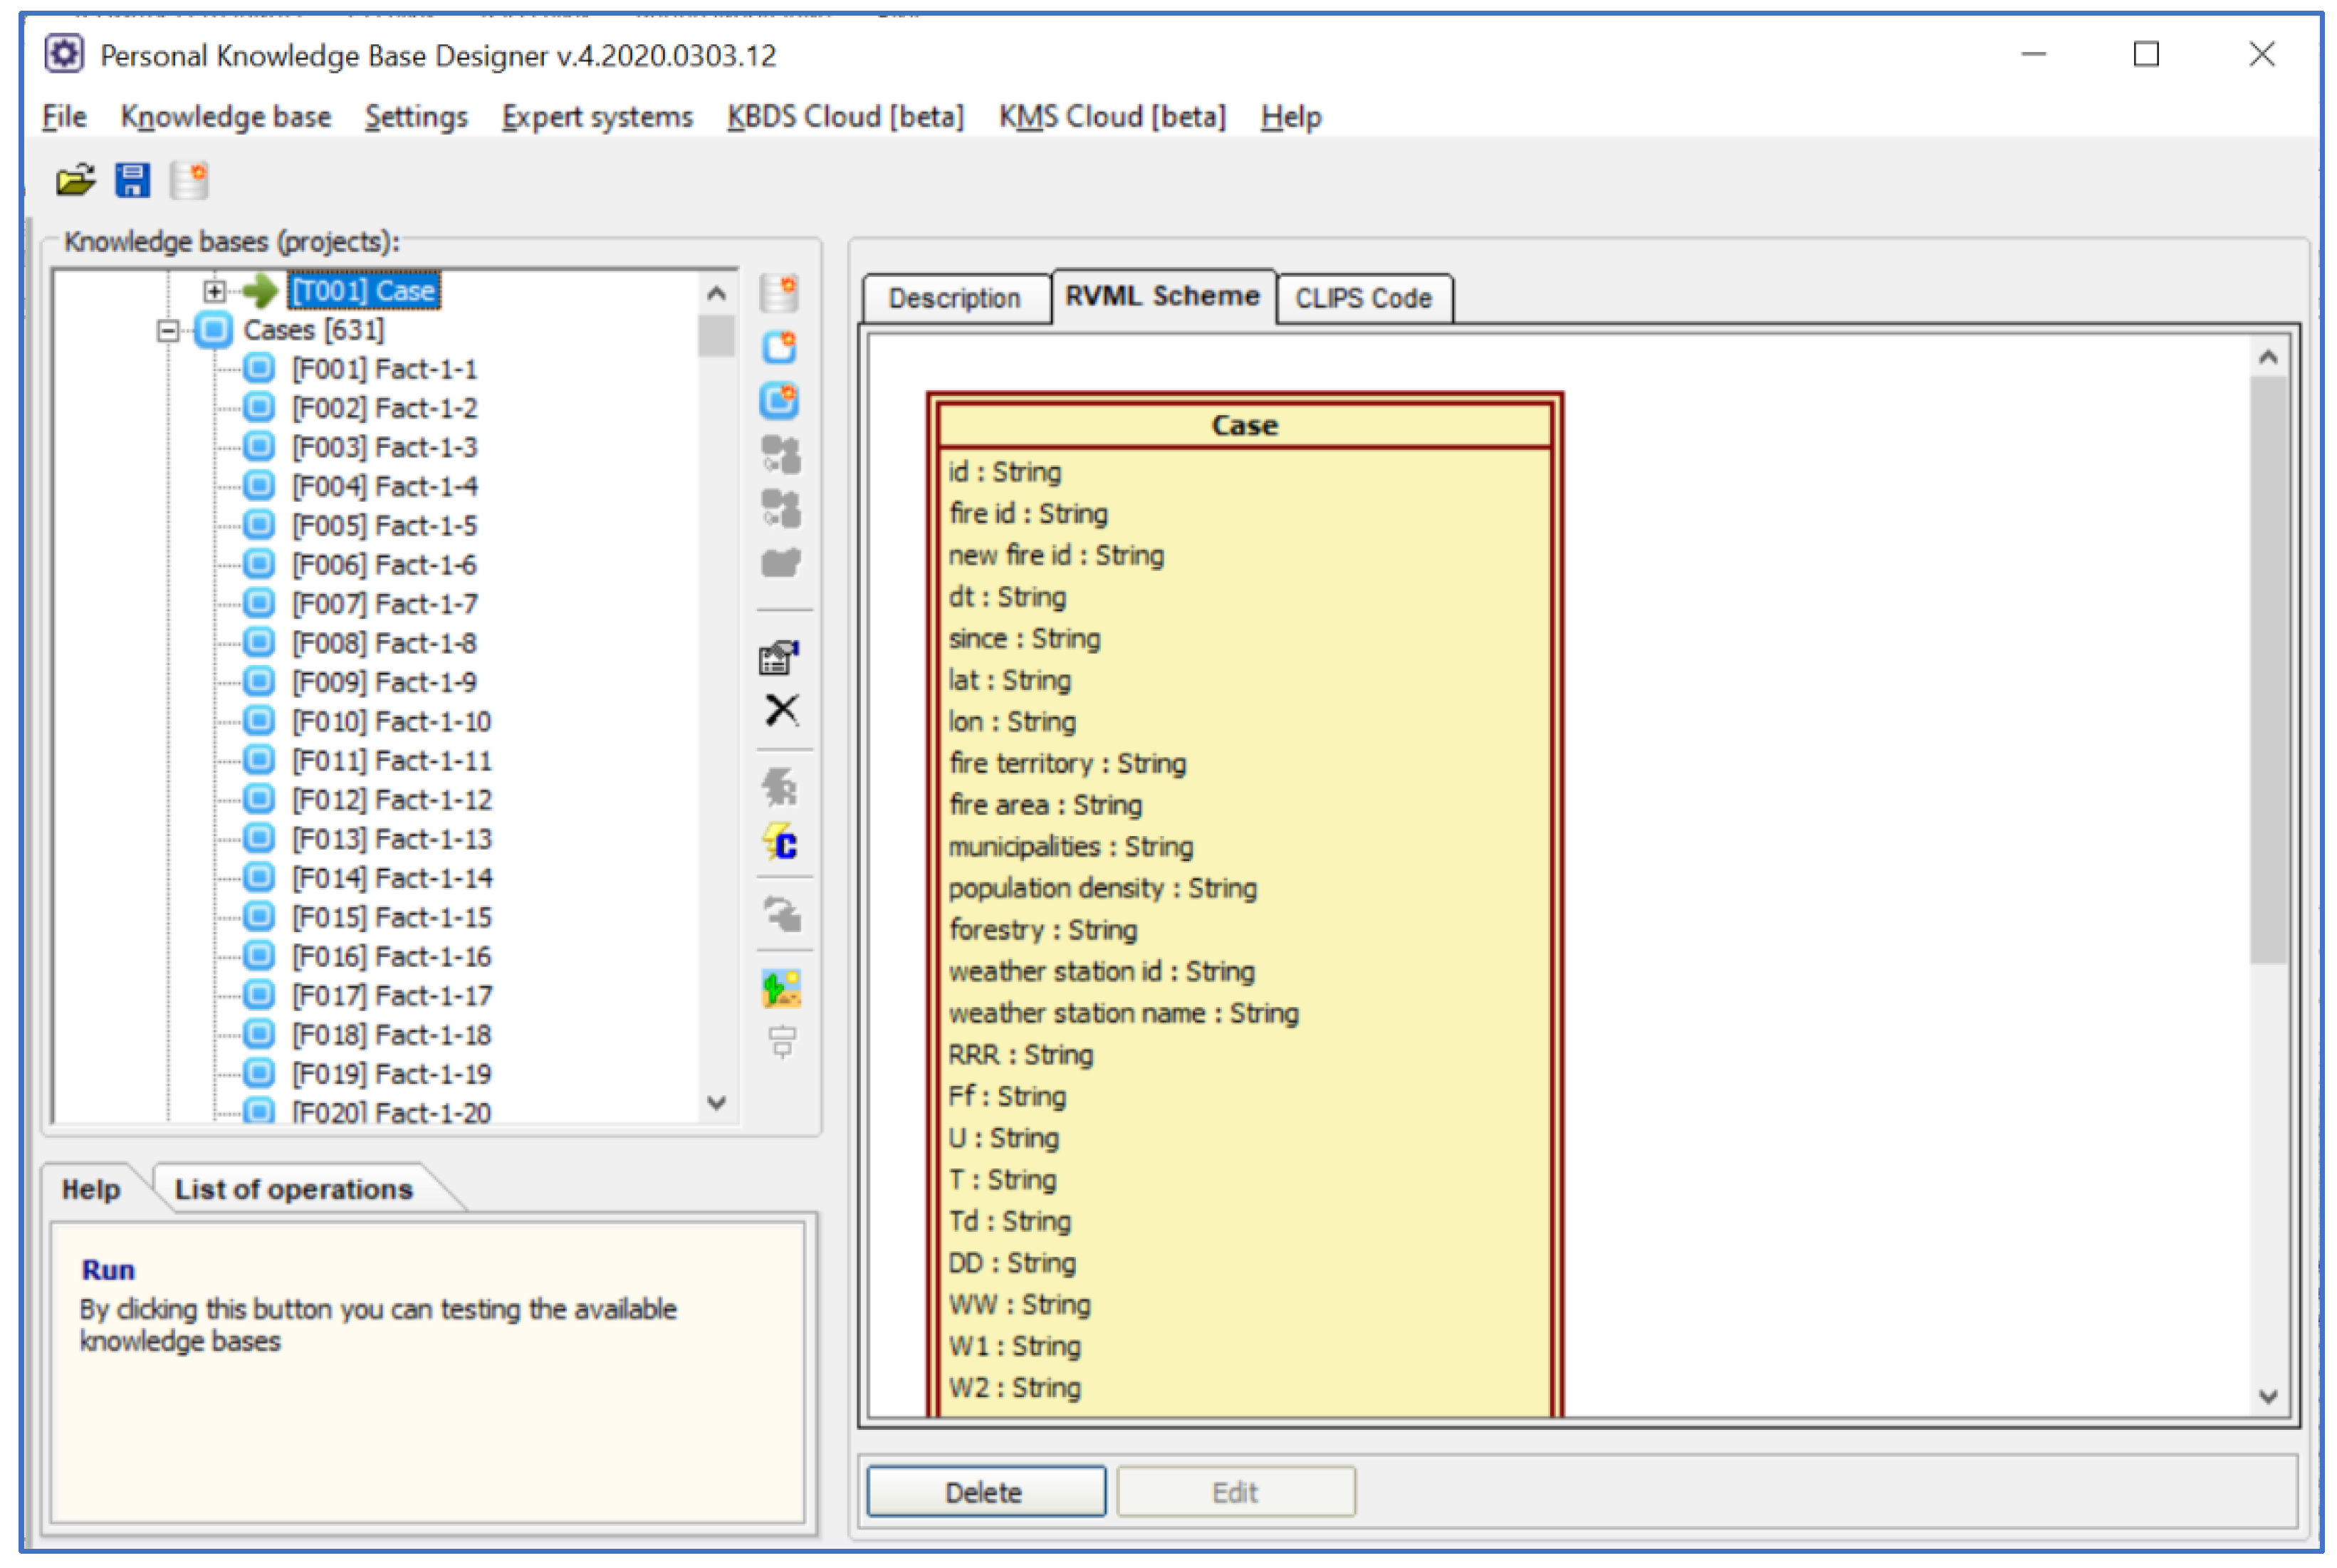
3.3.4. Prototyping a Case Base
- Preparing CSV files with decision tables for PKBD import;
- Importing CSV files containing information for cases with the creation of a knowledge base;
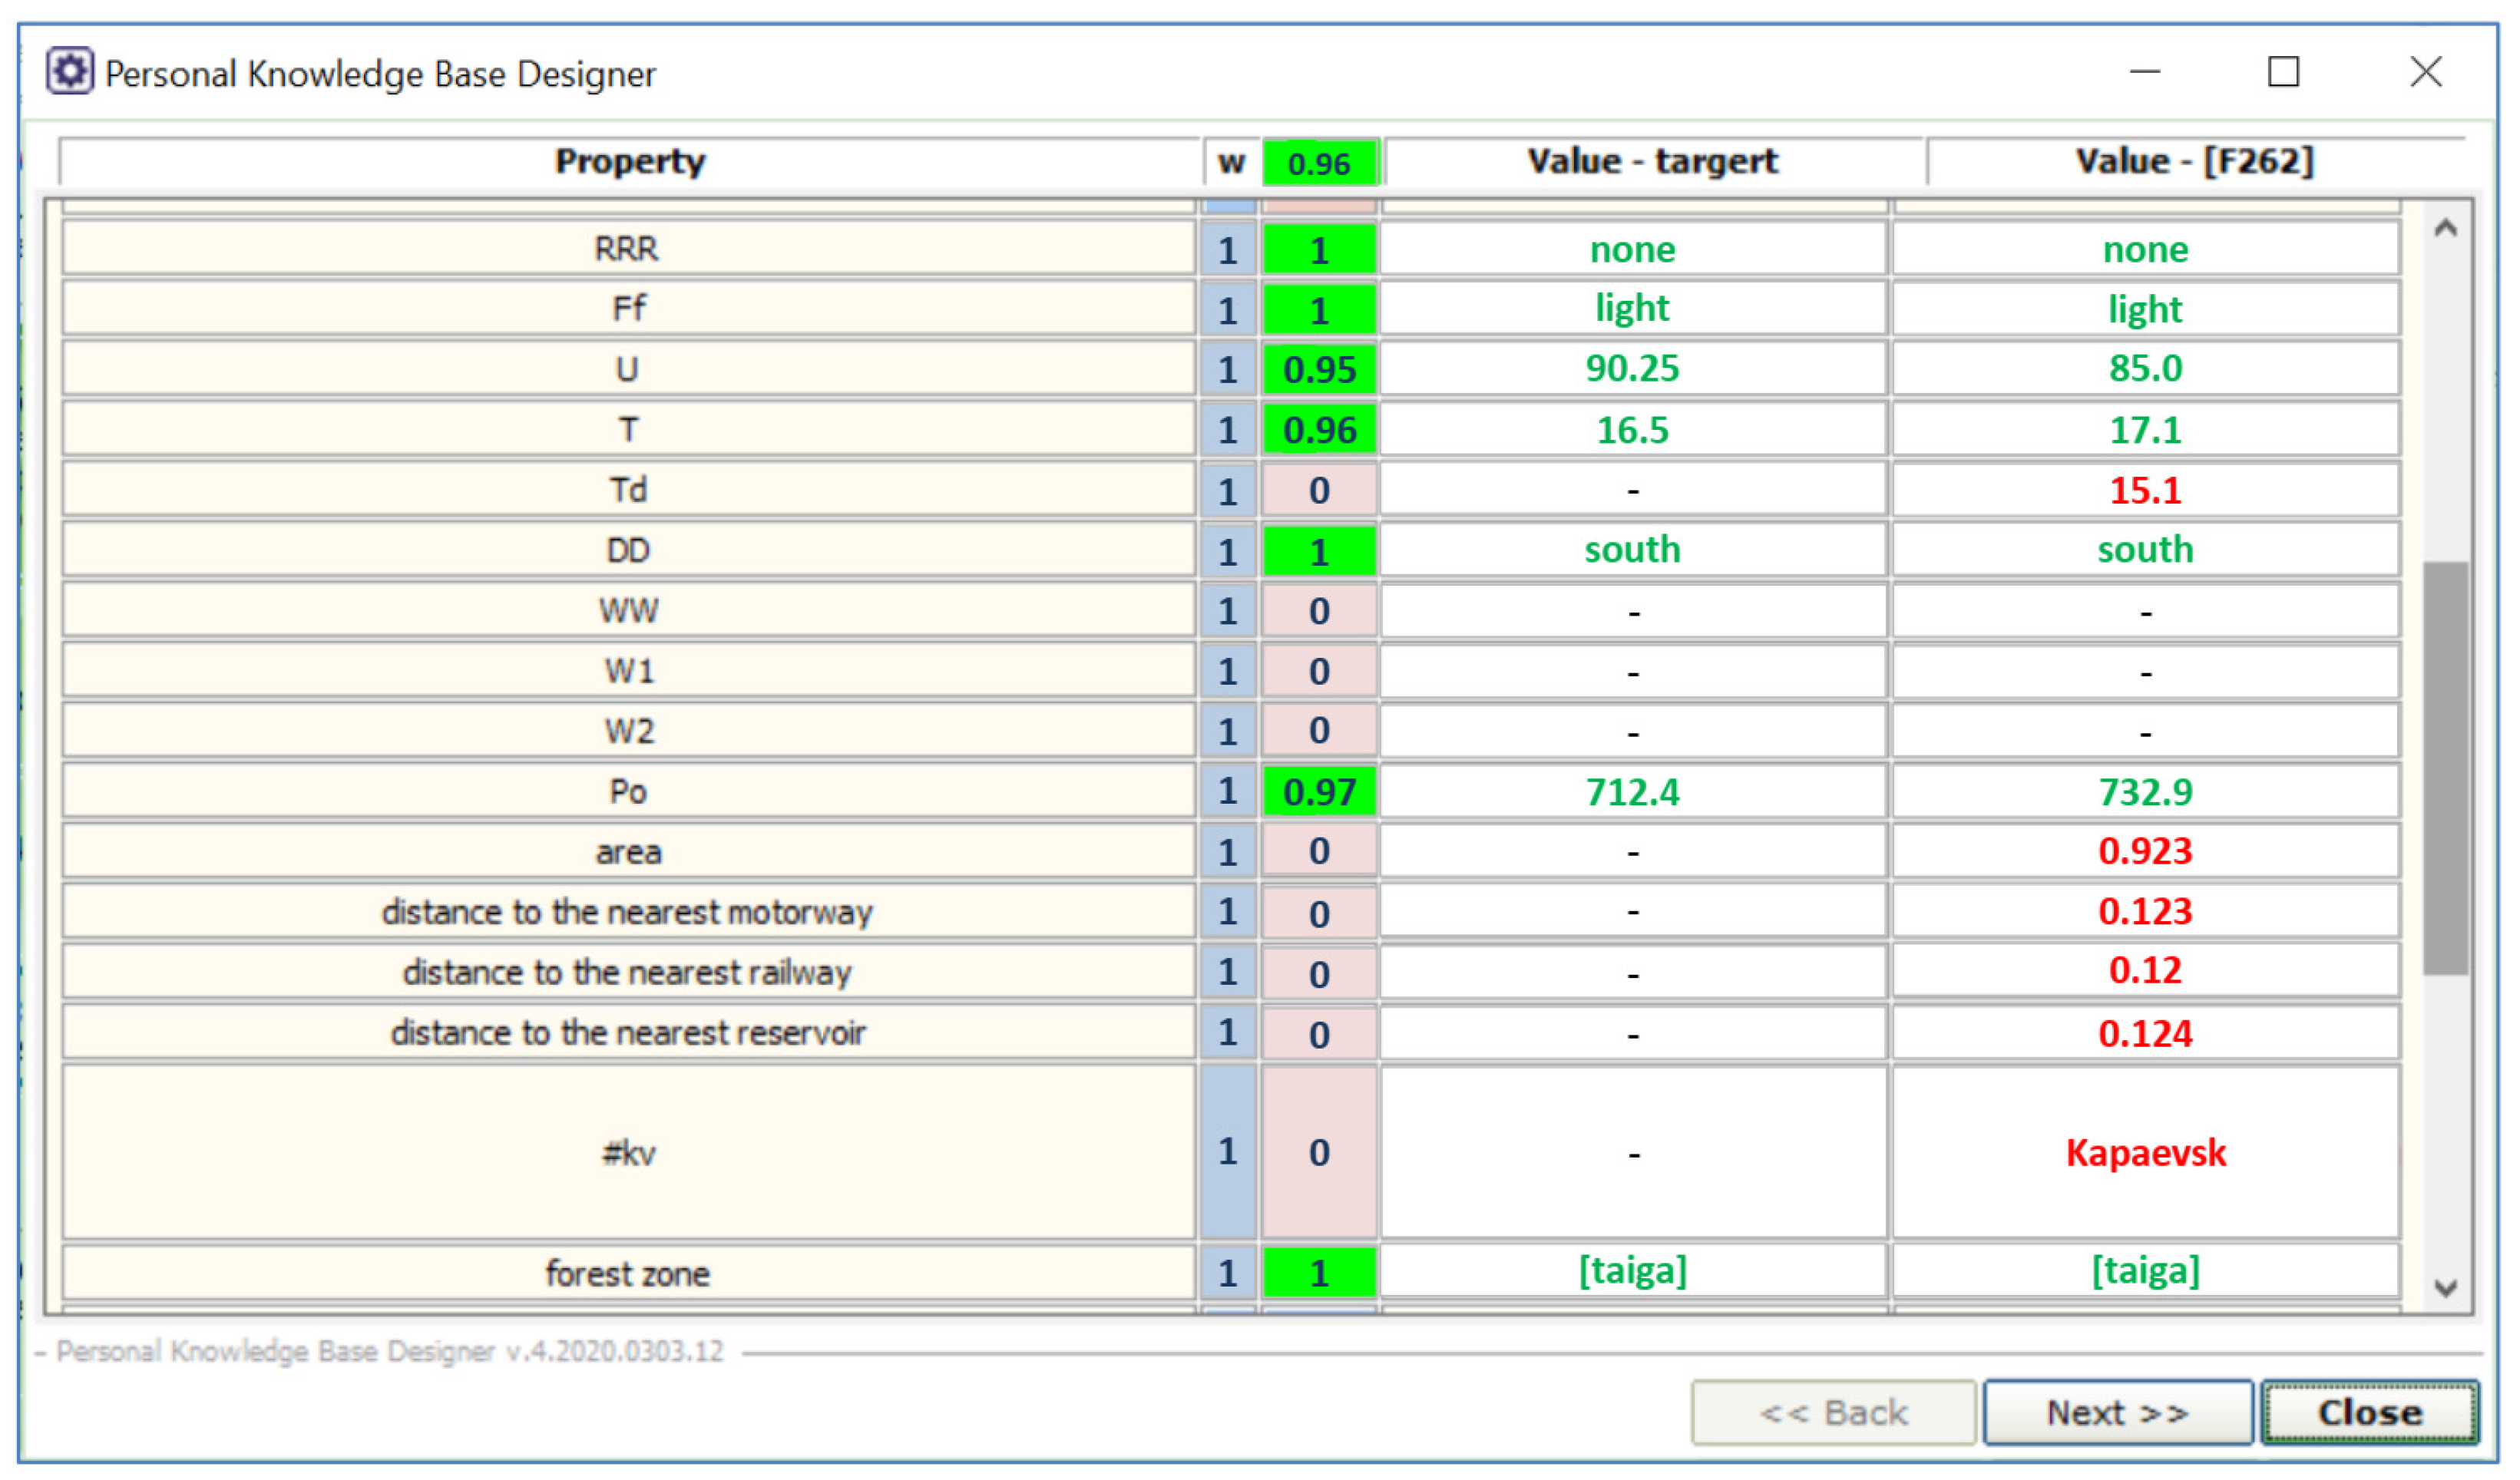
- Testing imported data by queries with subsequent correction of the data.
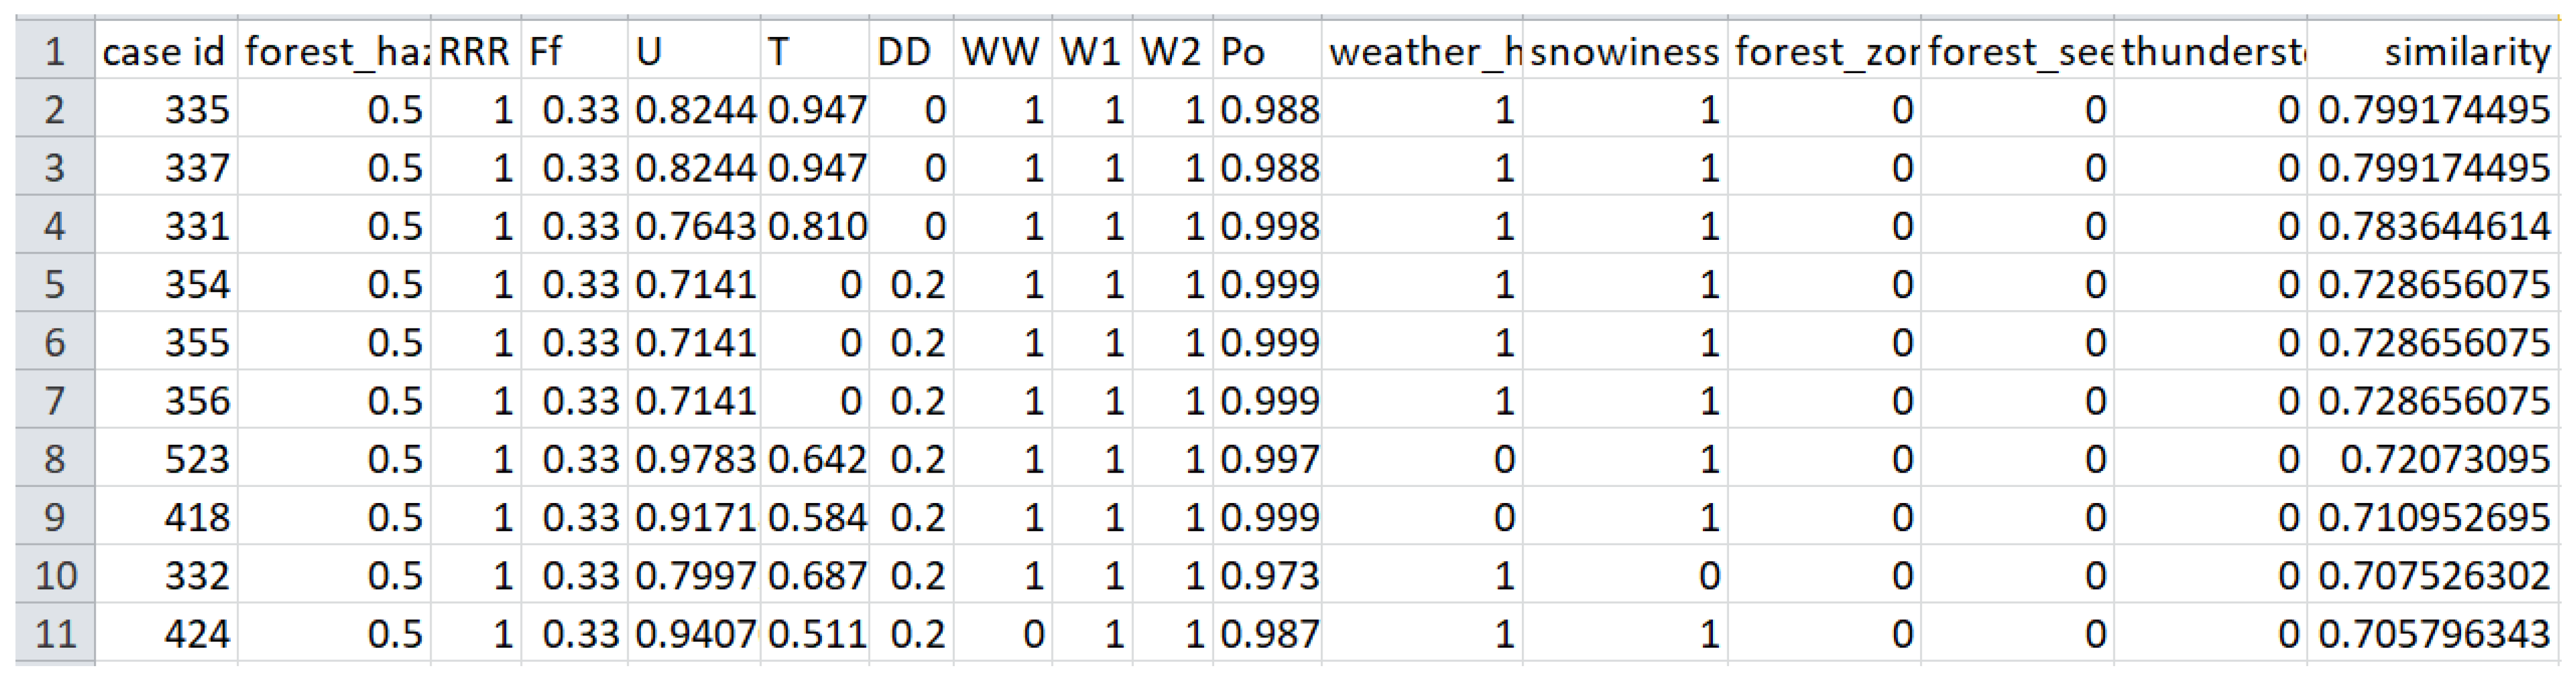
3.3.5. Forest Fire Risk Forecasting Based on CBR
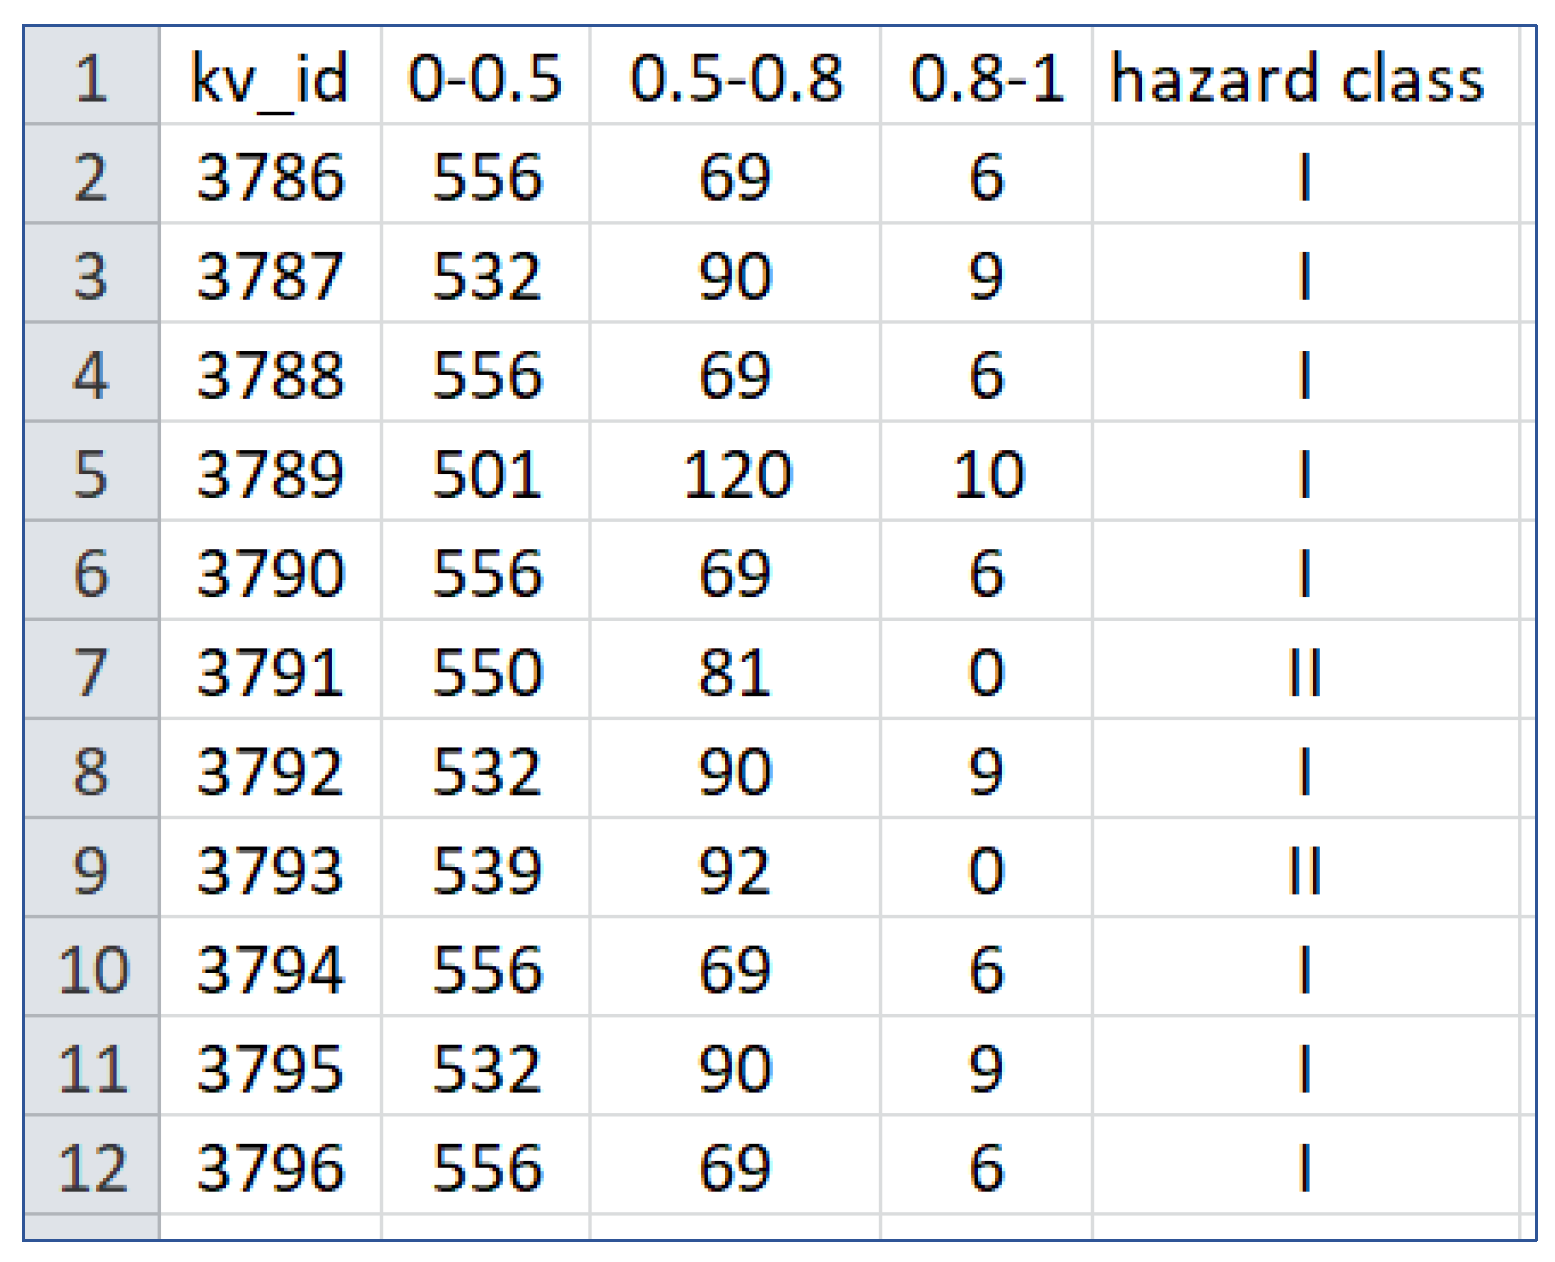
- IF no cases, THEN forest fire risk is improbable (hazard class V);
- IF there are cases with a similarity from 0 to 0.5, THEN forest fire risk is least probable (hazard class IV);
- IF there are cases with a similarity from 0.5 to 0.8, THEN forest fire risk is unlikely (hazard class III);
- IF there are more than 50 cases with a similarity from 0.5 to 0.8, THEN forest fire risk is probable (hazard class II);
- IF there are at list one to five cases with a similarity more than 0.8, THEN forest fire risk is probable (hazard class II);
- IF there are more than five cases with a similarity more than 0.8, THEN forest fire risk is most probable (hazard class I).
4. Discussion and Conclusions
Accuracy = nCBR/nF, nCBR < nF
Author Contributions
Funding
Institutional Review Board Statement
Informed Consent Statement
Data Availability Statement
Conflicts of Interest
References
- Eskandari, S.; Chuvieco, E. Fire danger assessment in Iran based on geospatial information. Int. J. Appl. Earth Obs. Geoinf. 2015, 42, 57–64. [Google Scholar] [CrossRef]
- Semeraro, T.; Mastroleo, G.; Aretano, R.; Facchinetti, G.; Zurlini, G.; Petrosillo, I. GIS Fuzzy Expert System for the assessment of ecosystems vulnerability to fire in managing Mediterranean natural protected areas. J. Environ. Manag. 2016, 168, 94–103. [Google Scholar] [CrossRef]
- Jaafari, A.; Gholami, D.M.; Zenner, E.K. A Bayesian modeling of wildfire probability in the Zagros Mountains, Iran. Ecol. Inf. 2017, 39, 32–44. [Google Scholar] [CrossRef]
- Oliveira, S.; Félix, F.; Nunes, A.; Lourenço, L.; Laneve, G.; Sebastián-López, A. Mapping wildfire vulnerability in Mediterranean Europe. testing a stepwise approach for operational purposes. J. Environ. Manag. 2018, 206, 158–169. [Google Scholar] [CrossRef]
- Tutmez, B.; Ozdogan, M.G.; Boran, A. Mapping forest fires by nonparametric clustering analysis. J. For. Res. 2018, 29, 177–185. [Google Scholar] [CrossRef]
- Hong, H.; Jaafari, A.; Zenner, E.K. Predicting spatial patterns of wildfire susceptibility in the Huichang County, China: An integrated model to analysis of landscape indicators. Ecol. Indic. 2019, 101, 878–891. [Google Scholar] [CrossRef]
- Neary, D.G.; Ryan, K.C.; DeBano, L.F. Wildland Fire in Ecosystems: Effects of Fire on Soils and Water; General Technical Report; RMRSGTR-42-Volume 4; USDA, Forest Service, Rocky Mountain Research Station: Ogden, UT, USA, 2005; p. 250. [Google Scholar]
- Rafaqat, W.; Iqbal, M.; Kanwal, R.; Song, W. Study of Driving Factors Using Machine Learning to Determine the Effect of Topography, Climate, and Fuel on Wildfire in Pakistan. Remote Sens. 2022, 14, 1918. [Google Scholar] [CrossRef]
- FerreirA-leiTe, F.; Lourenço, L.; Bento-Gonçalves, A. Large forest fires in mainland Portugal, brief characterization. J. Mediterr. Geogr. 2013, 19, 53–65. [Google Scholar] [CrossRef]
- Xu, R.; Yu, P.; Abramson, M.J.; Johnston, F.H.; Samet, J.M.; Bell, M.L.; Haines, A.; Ebi, K.L.; Li, S.; Guo, Y. Wildfires, global climate change, and human health. N. Engl. J. Med. 2020, 383, 2173–2181. [Google Scholar] [CrossRef]
- Johnston, L.M.; Wang, X.; Erni, S.; Taylor, S.W.; McFayden, C.B.; Oliver, J.A.; Stockdale, C.; Christianson, A.; Boulanger, Y.; Gauthier, S. Wildland fire risk research in Canada. Environ. Rev. 2020, 28, 164–186. [Google Scholar] [CrossRef]
- Pyne, S.J.; Andrews, P.L.; Laven, R.D. Introduction to Wildland Fire; Wiley-Interscience Publication: Hoboken, NJ, USA, 1996. [Google Scholar]
- Timofeeva, S.S.; Garmyshev, V.V. Ecological consequences of forest fires in the Irkutsk region. Ecol. Ind. Russ. 2017, 21, 46–49. (In Russian) [Google Scholar] [CrossRef]
- Gheshlaghi, H.A.; Feizizadeh, B.; Blaschke, T. GIS-based forest fire risk mapping using the analytical network process and fuzzy logic. J. Environ. Plan. Manag. 2019, 63, 481–499. [Google Scholar] [CrossRef]
- Eugenio, F.C.; Dos Santos, A.R.; Fiedler, N.C.; Ribeiro, G.A.; Da Silva, A.G.; Dos Santos, A.B.; Paneto, G.G.; Schettino, V.R. Applying GIS to Develop a Model for Forest Fire Risk: A Case Study in Espirito Santo, Brazil. J. Environ. Manag. 2016, 173, 65–71. [Google Scholar] [CrossRef] [PubMed]
- Tian, X.; Zhao, F.; Shu, L.; Wang, M. Distribution Characteristics and the Influence Factors of Forest Fires in China. For. Ecol. Manag. 2013, 310, 460–467. [Google Scholar] [CrossRef]
- Bychkov, I.V.; Ruzhnikov, G.M.; Fedorov, R.K.; Khmelnov, A.E.; Popova, A.K. Organization of digital monitoring of the Baikal natural territory. IOP Conf. Ser. Earth Environ. Sci. 2021, 629, 012067. [Google Scholar] [CrossRef]
- Bot, K.; Borges, J.G. A Systematic Review of Applications of Machine Learning Techniques for Wildfire Management Decision Support. Inventions 2022, 7, 15. [Google Scholar] [CrossRef]
- Pourghasemi, H.; Beheshtirad, M.; Pradhan, B. A comparative assessment of prediction capabilities of modified analytical hierarchy process (M-AHP) and Mamdani fuzzy logic models using Netcad-GIS for forest fire susceptibility mapping. Geomat. Nat. Hazards Risk 2016, 7, 861–885. [Google Scholar] [CrossRef]
- Aamodt, A.; Plaza, E. Case-based reasoning: Foundational issues, methodological variations, and system approaches. AI Commun. 1994, 7, 39–59. [Google Scholar] [CrossRef]
- Berman, A.F.; Nikolaychuk, O.A.; Yurin, A.Y.; Pavlov, A.I. A methodology for the investigation of the reliability and safety of unique technical systems. Proc. Inst. Mech. Eng. Part O J. Risk Reliab. 2014, 228, 29–38. [Google Scholar] [CrossRef]
- Nikolaychuk, O.A.; Yurin, A.Y. Computer-aided identification of mechanical system’s technical state with the aid of case-based reasoning. Expert Syst. Appl. 2008, 34, 635–642. [Google Scholar] [CrossRef]
- Yurin, A.Y.; Dorodnykh, N.O. Personal knowledge base designer: Software for expert systems prototyping. SoftwareX 2020, 11, 100411. [Google Scholar] [CrossRef]
- Yurin, A.Y.; Dorodnykh, N.O.; Nikolaychuk, O.A.; Grishenko, M.A. Designing rule-based expert systems with the aid of the model-driven development approach. Expert Syst. 2018, 35, 12291. [Google Scholar] [CrossRef]
- Chuvieco, E.; Coceroa, D.; Riano, D.; Martinc, P.; Martıiez-Vega, J.; de la Riva, J.; Perez, F. Combining NDVI and surface temperature for the estimation of live fuel moisture content in forest fire danger rating. Remote Sens. Environ. 2004, 92, 322–331. [Google Scholar] [CrossRef]
- Garcia, M.; Chuvieco, E.; Nieto, H.; Aguado, I. Combining AVHRR and meteorological data for estimating live fuel moisture content. Remote Sens. Environ. 2008, 112, 3618–3627. [Google Scholar] [CrossRef]
- Renard, Q.; Pelissier, R.; Ramesh, B.R.; Kodandapani, N. Environmental susceptibility model for predicting forest fire occurrence in the Western Ghats of India. Int. J. Wildland Fire 2012, 21, 368–379. [Google Scholar] [CrossRef]
- Iban, M.C.; Sekertekin, A. Machine learning based wildfire susceptibility mapping using remotely sensed fire data and GIS: A case study of Adana and Mersin provinces, Turkey. Ecol. Inform. 2022, 69, 101647. [Google Scholar] [CrossRef]
- Bisquert, M.; Caselles, E.; Sanchez, E.; Caselles, V. Application of artificial neural networks and logistic regression to the prediction of forest fire danger in Galicia using MODIS data. J. Wildland Fire 2012, 1, 1025–1029. [Google Scholar] [CrossRef]
- Safi, Y.; Bouroumi, A. Prediction of forest fires using artificial neural networks. Appl. Math. Sci. 2013, 7, 271–286. [Google Scholar] [CrossRef]
- Goldarag, Y.J.; Mohammadzadeh, A.; Ardakani, A.S. Fire Risk Assessment Using Neural Network and Logistic Regression. J. Indian Soc. Remote Sens. 2016, 44, 885–894. [Google Scholar] [CrossRef]
- Bui, D.T.; Bui, Q.T.; Nguyen, Q.P.; Pradhan, B.; Nampak, H.; Trinh, P.T. A Hybrid Artificial Intelligence Approach Using GIS-Based Neural-Fuzzy Inference System and Particle Swarm Optimization for Forest Fire Susceptibility Modeling at a Tropical Area. Agric. For. Meteorol. 2017, 233, 32–44. [Google Scholar]
- Wu, Z.; Wang, B.; Li, M.; Tian, Y.; Quan, Y.; Liu, J. Simulation of forest fire spread based on artificial intelligence. Ecol. Indic. 2022, 136, 108653. [Google Scholar] [CrossRef]
- Carvalho, J.P.; Carola, M.; Tome, J.A.B. Forest fire modeling using rule-based fuzzy Cognitive maps and Voronoi based cellular automata. In Proceedings of the NAFIPS 2006–2006 Annual Meeting of the North American Fuzzy Information Processing Society, Montreal, QC, Canada, 3–6 June 2006; pp. 217–222. [Google Scholar]
- Soto, M.E.C. The Identification and Assessment of Areas at Risk of Forest Fire Using Fuzzy Methodology. Appl. Geogr. 2012, 35, 199–207. [Google Scholar] [CrossRef]
- Leal, B.E.Z.; Hirakawa, A.R.; Pereira, T.D. Onboard Fuzzy Logic Approach to Active Fire Detection in Brazilian Amazon Forest. IEEE Trans. Aerosp. Electron. Syst. 2016, 52, 883–890. [Google Scholar] [CrossRef]
- Mosadeghi, R.; Warnken, J.; Tomlinson, R.; Mirfenderesk, H. Uncertainty Analysis in the Application of Multi-Criteria Decision-Making Methods in Australian Strategic Environmental Decisions. J. Environ. Plan. Manag. 2013, 56, 1097–1124. [Google Scholar] [CrossRef]
- Feizizadeh, B.; Omrani, K.; Aghdam, F.B. Fuzzy Analytical Hierarchical Process and Spatially Explicit Uncertainty Analysis Approach for Multiple Forest Fire Risk Mapping. J. Geogr. Inf. Sci. 2015, 3, 72–80. [Google Scholar] [CrossRef]
- Sivrikaya, F.; Küçük, Ö. Modeling forest fire risk based on GIS-based analytical hierarchy process and statistical analysis in Mediterranean region. Ecol. Inform. 2022, 68, 101537. [Google Scholar] [CrossRef]
- Sharma, L.K.; Kanga, S.; Nathawat, M.S.; Sinha, S.; Pandey, P.C. Fuzzy AHP for Forest Fire Risk Modeling. Disaster Prev. Manag. Int. J. 2012, 21, 160–171. [Google Scholar] [CrossRef]
- Hong, H.; Naghibi, S.A.; Dashtpagerdi, M.M.; Pourghasemi, H.R.; Chen, W. A Comparative Assessment Between Linear and Quadratic Discriminant Analyses (LDA-QDA) with Frequency Ratio and Weights-of-Evidence Models for Forest Fire Susceptibility Mapping in China. Arab. J. Geosci. 2017, 10, 167. [Google Scholar] [CrossRef]
- Si, L.; Shu, L.; Wang, M.; Zhao, F.; Chen, F.; Li, W.; Li, Wei. Study on forest fire danger prediction in plateau mountainous forest area. Nat. Hazards Res. 2022, 2, 25–32. [Google Scholar] [CrossRef]
- Pan, Y.; Birdsey, R.A.; Phillips, O.L.; Jackson, R.B. The Structure, Distribution, and Biomass of the World’s Forests. Annu. Rev. Ecol. Evol. Syst. 2013, 44, 593–622. [Google Scholar] [CrossRef]
- Liu, W.; Wang, S.; Zhou, Y.; Wang, L.; Zhu, J.; Wang, F. Lightning-caused forest fire risk rating assessment based on case-based reasoning: A case study in DaXingAn Mountains of China. Nat. Hazards 2016, 81, 347–363. [Google Scholar] [CrossRef]
- Mata, A.; Baruque, B.; Lancho, B.; Corchado, E.; Corchado Rodríguez, J. Forest Fire Evolution Prediction Using a Hybrid Intelligent System. IFIP Adv. Inf. Commun. Technol. 2010, 322, 64–71. [Google Scholar]
- Júnior, J.S.S.; Paulo, J.R.; Mendes, J.; Alves, D.; Ribeiro, L.M.; Viegas, C. Automatic forest fire danger rating calibration: Exploring clustering techniques for regionally customizable fire danger classification. Expert Syst. Appl. 2022, 193, 116380. [Google Scholar] [CrossRef]
- Pourghasemi, H.R.; Gayen, A.; Lasaponara, R.; Tiefenbacher, J.P. Application of learning vector quantization and different machine learning techniques to assessing forest fire influence factors and spatial modeling. Environ. Res. 2020, 184, 109321. [Google Scholar] [CrossRef] [PubMed]
- Álvarez-Díaz, M.; González-Gómez, M.; Otero-Giraldez, M.S. Detecting the socioeconomic driving forces of the fire catastrophe in NW Spain. Eur. J. For. Res. 2015, 134, 1087–1094. [Google Scholar] [CrossRef]
- Tymstra, C.; Jain, P.; Flannigan, M.D. Characterisation of initial fire weather conditions for large spring wildfires in Alberta, Canada. Int. J. Wildland Fire 2021, 30, 823–835. [Google Scholar] [CrossRef]
- Golubeva, L.V.; Latysheva, A.V.; Loshchenko, K.A.; Shcheblykin, A.S. Investigation of the influence of meteorological factors on the occurrence and spread of forest fires in the Irkutsk region. News Irkutsk. State Univ. Ser. Earth Sci. 2017, 22, 30–40. (In Russian) [Google Scholar]
- Zalesov, S.V.; Godovalov, G.A.; Platonov, E.Y. A refined scale of distribution of forest fund plots by classes of natural fire hazard. Agrar. Bull. Ural. 2013, 10, 45–49. (In Russian) [Google Scholar]
- Rubtsov, A.V.; Sukhinin, A.I.; Vaganov, E.A. System analysis of weather fire danger in forecasting large fires in the forests of Siberia. Explor. Earth Space 2010, 3, 62–70. (In Russian) [Google Scholar]
- Shur, Y.Z.; Neshataev, V.Y.; Stepchenko, A.A.; Shapoval, N.V. Regional scales of assessment of natural fire hazard of forests. Proc. St. Petersburg Sci. Res. Inst. For. 2020, 2, 59–69. (In Russian) [Google Scholar]
- Sofronova, A.V.; Volokitina, A.V. Assessment of the natural fire hazard of forest areas on the territory of oil and gas complexes using Earth remote sensing data. Sib. For. J. 2017, 5, 84–94. (In Russian) [Google Scholar]
- Bergmann, R. Experience Management: Foundations, Development Methodology, and Internet-Based Applications; Springer: Berlin/Heidelberg, Germany, 2002. [Google Scholar]
- Berman, A.F.; Maltugueva, G.S.; Yurin, A.Y. Application of case-based reasoning and multi-criteria decision-making methods for material selection in petrochemistry. Proc. Inst. Mech. Eng. Part L J. Mater. Des. Appl. 2018, 232, 204–212. [Google Scholar] [CrossRef]
- De Mantaras, L.R.; Mcsherry, D.; Bridge, D.; Leake, D.; Smyth, B.; Craw, S.; Faltings, B.; Maher, M.L.; Cox, M.T.; Forbus, K.; et al. Retrieval, reuse, revision and retention in case-based reasoning. Knowl. Eng. Rev. 2005, 20, 215–240. [Google Scholar] [CrossRef]
- Zhuravlev, Y.I. Recognition, classification, forecast. In Mathematical Methods and Their Application; Nauka: Moscow, Russia, 1989; 302p. (In Russian) [Google Scholar]
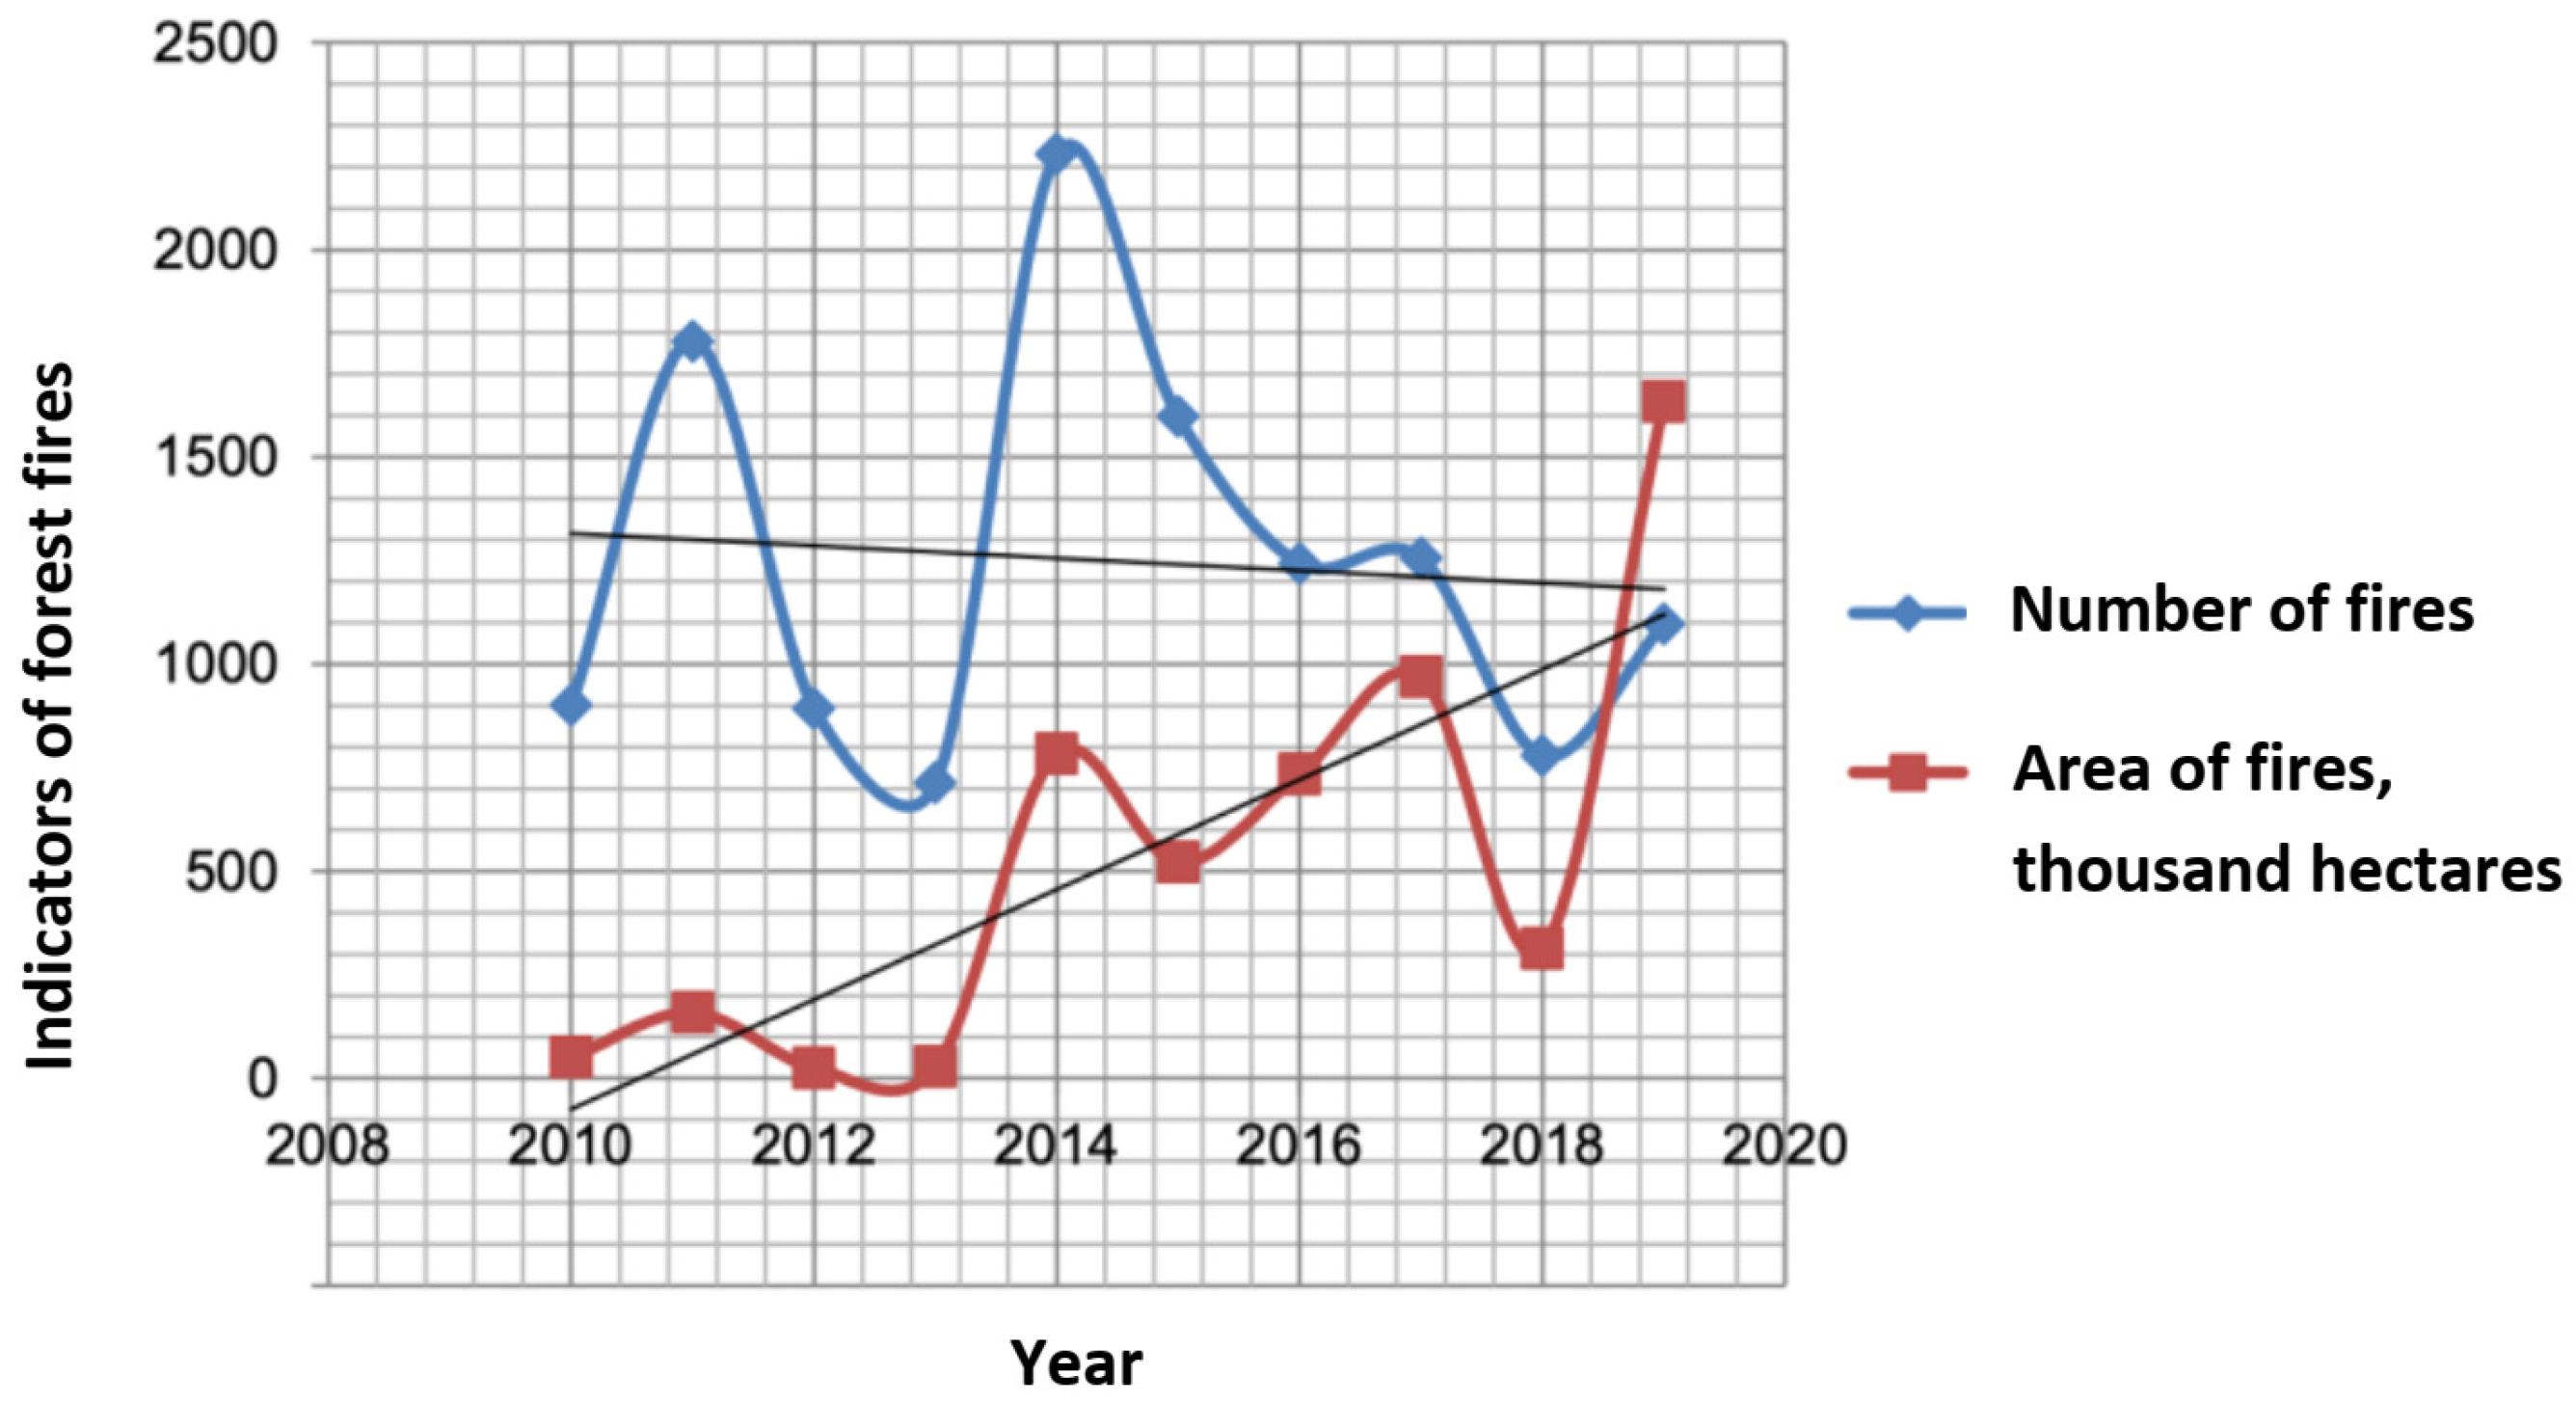
- Drozdova, T.I.; Sorokovikova, E.V. Analysis of forest fires in Irkutsk region for 2010–2019. XXI Century Technosphere Saf. 2021, 6, 29–41. (In Russian) [Google Scholar] [CrossRef]
- ISTP SB RAS. Available online: http://en.iszf.irk.ru/Main_Page (accessed on 13 August 2022).
- Abushenko, N.A.; Altyntsev, D.A.; Muzurov, A.A.; Min’ko, N.P. AVHRR/NOAA data in estmating areas of large forest fires. Mapp. Sci. Remote Sens. 2000, 37, 180–188. [Google Scholar]
- Abushenko, N.A.; Altyntsev, D.A.; Semenov, S.M. Evaluation of the accuracy of satellite methods for detecting forest fires. Sol. Terr. Phys. 2004, 5, 27–29. (In Russian) [Google Scholar]
- GitHub–Lab42-Team/Geoanalitics: An Application to Analyzing Geo-Data. Available online: https://github.com/Lab42-Team/geoanalytics (accessed on 13 August 2022).
- GOST R 22.1.09-99 Safety in emergency situations. In Monitoring and Forecasting of Forest Fires; Gosstandart of Russia: Moscow, Russia, 1999. (In Russian)
- Sochava, V.B. Institute of Geography SB RAS. Available online: http://www.irigs.irk.ru/# (accessed on 13 August 2022).
- Irkutsk Department of Hydrometeorology and Environmental Monitoring. Available online: https://www.irmeteo.ru/ (accessed on 13 August 2022).
- Yurin, A.Y.; Dorodnykh, N.O.; Nikolaychuk, O.A. Update (4.2020.0303) to “Personal Knowledge Base Designer: Software for expert systems prototyping”, (PII: S2352711019303334). SoftwareX 2021, 16, 100825. [Google Scholar] [CrossRef]
- Yurin, A.Y.; Dorodnykh, N.O. Creating Web Decision-Making Modules on the Basis of Decision Tables Transformations. Commun. Comput. Inf. Sci. 2021, 1341, 167–184. [Google Scholar]


| Satellite | Range, Microns | Spatial Resolution, m | Field of View, km | Repeatability of Shooting Single Territory |
|---|---|---|---|---|
| NOAA18, NOAA19 | 0.58–0.68; 0.725–1.0; 3.55–3.93; 10.3–11.3; 11.4–12.4 | 1100 | ~3000 | 3–4 times a day |
| Case Properties | Description/Possible Values/Units of Measurement | Source of Information |
|---|---|---|
| Problem description | ||
| Date and time of the start (detection) of the fire | Satellite images | |
| Fire territory | Polygon | Satellite images |
| Fire area | Square kilometers | Satellite images |
| Forest quarter | Name of the forestry, plot, quarter | GIS data |
| Forest-seed zoning zone | Pine, spruce, larch, cedar | Forest regulations |
| Forest growing area | Forest-steppe, taiga, South Siberian mountain | Forest regulations |
| Fire hazard class of the forest area | High—I, above average—II, average—III, below average—IV, low—V | Forest regulations |
| Fire hazard class of the forest according to weather conditions | V—extreme (more than 10,000), IV—high (from 4001 to 10,000), III—medium (from 1001 to 4000), II—small (from 301 to 1000), I (up to 300) | Determined by the complex indicator of V. G. Nesterov [64] |
| Distance to the nearest railway | Kilometers, intervals of values: 0–0.5; 0.5–3; 3–10; 10–15; more than 15 | GIS data |
| Distance to the nearest motorway | Kilometers, intervals of values: 0–0.5; 0.5–3; 3–10; 10–15; more than 15 | GIS data |
| Distance to the nearest reservoir | Kilometers, intervals of values: 0–0.5; 0.5–3; 3–10; 10–15; more than 15 | GIS data |
| Distance to the nearest settlement | Kilometers, intervals of values: 0–0.5; 0.5–3; 3–10; 10–15; more than 15 | GIS data |
| Population density | Number of inhabitants per square kilometer | Statistics of Irkutsk Oblast |
| Air temperature (T) | Degrees Celsius | Meteostations data |
| Dew point temperature (Td) | Degrees Celsius | Meteostations data |
| Atmospheric pressure (Po) | Millimeters | Meteostations data |
| Relative humidity of the air (U) | % | Meteostations data |
| Wind direction (rumba) (DD) | West-southwest; north; west-southwest; | Meteostations data |
| Wind strength (Ff) | Calm, etc., meters per second, quantitative values were converted into qualitative ones on the 12-point F. Beaufort scale: calm (0–0.2), quiet (0.3–1.5), light (1.6–3.3), weak (3.4–5.4), moderate (5.5–7.9), fresh (8.0–10.7), strong (10.8–13.8), etc. | Meteostations data |
| The amount of precipitation (RRR) | Millimeters, quantitative values were converted into qualitative ones: light rain (0.0–2), rain (3–14), heavy rain (15–49), very heavy rain (more than 50), etc. | |
| Description of precipitation | Heavy rain(s) light rain(s) during the observation period or in the last hour, etc. | Meteostations data |
| Dry thunderstorm | Yes, no | Meteostations data |
| Snowiness of winter | Low snow, norm, multi-snow | Meteostations data |
| Decision description | ||
| Forest quarter | Name of the forestry, plot, quarter | GIS data |
| Fire risk assessment | The value determining the risk of losses from a forest fire | Calculated based on statistical data |
| Assessment of the possibility of fire | Improbable, least probable, unlikely, probable, most probable | it is determined using the analysis of cases: improbable (very low)—no cases, least probable (low)—cases with similarity from 0 to 0.5, unlikely (moderate)—cases with similarity from 0.5 to 0.8, probable (high)—from 1 to 5 cases with similarity more than 0.8, most probable (very high)—more than 5 cases with similarity more than 0.8. |
| Variable (Property) | Average Similarity between Separate Properties (Local Similarity) | Contribution to the Formation of the Total (Global) Similarity, % |
|---|---|---|
| The amount of precipitation (RRR) | 1 | 9.65 |
| Fire hazard class of the forest according to Weather conditions | 1 | 9.65 |
| Snowiness of winter | 1 | 9.65 |
| Forest hazard classes | 1 | 9.65 |
| Forest zone | 1 | 9.65 |
| Atmospheric pressure (Po) | 0.99 | 9.55 |
| Air temperature (T) | 0.92 | 8.88 |
| Current weather reported from the weather station (WW) | 0.75 | 7.23 |
| Forest-seed zoning zones | 0.75 | 7.23 |
| Relative humidity of the air (U) | 0.63 | 6.08 |
| Past weather between observation dates 1 (W1) | 0.33 | 3.18 |
| Past weather between observation dates 2 (W2) | 0.33 | 3.18 |
| Wind strength (Ff) | 0.33 | 3.18 |
| Wind direction (rumba) (DD) | 0.33 | 3.18 |
| Work/Criteria | Area Name | Area Features | The Main Fire Reason | The Volume of the Case-Base or Training Sample | Number of Case Properties or Factors | Technique | The Accuracy or Prediction Score |
|---|---|---|---|---|---|---|---|
| Our research | Irkutsk Oblast (Russia) | Low population density; taiga is a overexposed vegetation type; a small number of weather stations | Weather and forest condition | 2240 | 41 (38/2) a | CBR | 0.51 |
| [44] | DaXingAnMountains (China) | Hard-to-reach places; a small number of weather stations | Careless handling of fire when visiting the forest; lightning (dry thunderstorms) | 560 | 5 b | CBR | 0.688 |
| [45] | Mediterranean areas | - | - | 2000 | 20 (10/10) c | Radial Basis Function (RBF) Network | 0.52 |
| CBR | 0.58 | ||||||
| CBR + RBF | 0.66 | ||||||
| [14] | Noshahr forests (Iran) | A popular tourist destination | Careless handling of fire when visiting the forest | 30 | 10 | Analytical NetworkProcess (ANP) and Fuzzy Logic (FL) | 0.819 |
| [6] | Huichang County (China) | Long fire season; the presence of meadows | - | 244 (122 + 122) d | 10 | Weights-of-Evidence (WOE) model and a knowledge-based AnalyticalHierarchy Process (AHP) | 0.91 |
| Logistic regression | 0.77 | ||||||
| [47] | Minudasht Forests (Iran) | Tropical dry forests is a overexposed vegetation type | - | 151 | 7 | Modified AHP | 0.777 |
| Mamdani FL | 0.882 | ||||||
| [8] | Pakistan | Arid climate | 44,622 (22,311 + 22,311) e | 34 | Machine learning (8 algorithms) | 0.577–0.852 |
Publisher’s Note: MDPI stays neutral with regard to jurisdictional claims in published maps and institutional affiliations. |
© 2022 by the authors. Licensee MDPI, Basel, Switzerland. This article is an open access article distributed under the terms and conditions of the Creative Commons Attribution (CC BY) license (https://creativecommons.org/licenses/by/4.0/).
Share and Cite
Dorodnykh, N.; Nikolaychuk, O.; Pestova, J.; Yurin, A. Forest Fire Risk Forecasting with the Aid of Case-Based Reasoning. Appl. Sci. 2022, 12, 8761. https://doi.org/10.3390/app12178761
Dorodnykh N, Nikolaychuk O, Pestova J, Yurin A. Forest Fire Risk Forecasting with the Aid of Case-Based Reasoning. Applied Sciences. 2022; 12(17):8761. https://doi.org/10.3390/app12178761
Chicago/Turabian StyleDorodnykh, Nikita, Olga Nikolaychuk, Julia Pestova, and Aleksandr Yurin. 2022. "Forest Fire Risk Forecasting with the Aid of Case-Based Reasoning" Applied Sciences 12, no. 17: 8761. https://doi.org/10.3390/app12178761
APA StyleDorodnykh, N., Nikolaychuk, O., Pestova, J., & Yurin, A. (2022). Forest Fire Risk Forecasting with the Aid of Case-Based Reasoning. Applied Sciences, 12(17), 8761. https://doi.org/10.3390/app12178761