1. Introduction
The need and ability to assess large pools of users quickly and inexpensively has led to strong interest in online data-collection methodologies. In this article, we specifically discuss Online Panels (Ops). Ops have become increasingly useful for different research fields [
1], including market research [
2,
3,
4], social research [
5], psychological research [
6], and medical research [
7]. Aguinis and collaborators [
8], reported a 2117% increase in the use of OPs from 2012 to 2019 (see also [
9,
10]). As introduced above, this massive growth is justified by the convenience of having access to a large pool of users, which is much higher than in traditional studies [
11]. Furthermore, the current availability of robust online testing platforms, some of which are specifically dedicated to UX research and already connected to one or more OPs. In addition, the COVID-19 pandemic restrictions may also have increased the interest in online research platforms that allow remote administration of tests and surveys [
12]. This growth in the use of OPs poses the issue of data quality. Data quality consists of various attributes that have different levels of importance for different disciplines. For example, researchers are concerned with the reliability and validity of the scales, requiring participants to pay close attention to the stimuli, and asking them to read the instructions accurately. In addition, if incentives are used, researchers will need to make sure that participants do not try to cheat for greater gains. Regardless of the discipline or the research goals, a thoughtful combination of these and other attributes provides a concept of data quality that is critical to the validity of any behavioral research, regardless of the purpose, be it academic or commercial.
1.1. Professional Respondents and Data Quality
An Online Panel (OP; also known as crowdsourced community) is a group of people enrolled in a web platform who have agreed to participate regularly in online studies and/or in the execution of simple and repetitive operations. An OP is a form of access panel, defined by ISO 20252 as “a database of potential users who will collaborate on future data collections if selected.” OPs have many advantages: they are fast, inexpensive, and allow for the implementation of complex research studies (e.g., questionnaires with audiovisual stimuli, usability tests). Recruitment methodologies often rely on the self-selection of users who choose to become members of an online panel [
13]. Additionally, researchers commonly use incentives to engage users, such as money or bonus points that can be exchanged later [
14]. Moreover, the OPs are increasingly challenging the people involved with a wide range of studies and activities such as answering market research surveys, participating in usability evaluation, and managing bug-hunting tasks.
The combination of self-selection, incentives, and increased use of OPs has led to a growing concern about “professional respondents” (PR) (also referred to as “frequent survey responders”, see [
15]) and how they might affect the data quality. Comley [
16], defined this category of users as “respondents who participate in many online surveys, only when offered an incentive.” Other authors describe them as users who participate in many surveys or are members of several POs [
17,
18,
19]. These users may only be interested in receiving the incentive [
15,
17]. As a result, they may participate in a survey using shortcuts and heuristics to complete it with minimal effort and/or they could present skill sets hardly comparable with the general population characteristics. This response behavior is called “satisficing” [
20,
21], and can lead to less accurate responses and poor data quality [
22]. Indeed, the supporting literature does not provide evidence against the latter hypothesis [
13,
15,
23,
24]. Moreover, and this is our main concern, professional respondents may no longer represent a “typical” target user and instead provide feedback more akin to a subject-matter expert [
25].
1.2. Research Project
Usability and User Experience, widely discussed in the academic field [
26], and defined by the Internationational Organization for Standardization [
27], are nowadays key issues for developing effective digital products and services [
28].
However, studies on the quality of data provided by OPs have focused most exclusively on survey responses for market, social, psychological, and medical research. Studies focusing on the quality of data provided by PRs when they are involved in usability testing are lacking.
This research project is aimed at extending the literature on online panels, exploring the relationship between the level of expertise of the OPs and the usability ratings. Therefore, we selected two types of users from the international online platform UNGUESS whose mission is finding and sharing users’ feedback through online usability and debugging research (
https://www.unguess.io, accessed 15 July 2022):
Professional respondents (PR)—Highly experienced users of online studies, who have performed a large number of debugging (where the goal is to find as many bugs as possible in digital products) and usability tests. They accurately report and describe many bugs, browsing and interacting with the digital product in-depth and repeatedly;
Non-professional respondents (NPR)—Users with negligible or no experience with online studies, who have never done neither debugging or usability testing.
In addition to the two categories described above, an additional category of users was recruited based on a survey conducted on social networks and employed exclusively in study 3:
The PRs group is consistent with Comley’s definition [
16]. However, as argued by Hillygus, Jackson, and Young [
23], there are different criteria in the literature for defining PRs and consequently NPRs. As for the purposes of this research project, both categories were created by setting a threshold that allowed us to clearly distinguish between the two groups. PRs were those individuals who had served in at least 30 online studies (10 in the last 6 months), whereas NPR were individuals freshly included in the panel and not yet involved in any study. This research project was conducted in accordance with the tenets of the Declaration of Helsinki and each participant signed an informed consent explaining the general purpose of research and its risks. Access to the UNGUESS platform was granted for data collection by one of the authors.
The project had two objectives:
Investigating the impact of prior experience with online studies (high/low) on perceived usability ratings expressed during different types of tests (debugging/usability);
Investigating the impact of the type of test carried out (debugging/usability) on the perceived usability ratings expressed by users with two different levels of experience with online studies (high/low).
1.3. Online Panel
Users belonging to the OP managed by UNGUESS are rewarded for each test performed and for each bug found. Two rewarding systems are used to ensure the quality of the work of each member:
Experience points—To earn points, you need to sign up for the starting campaigns, complete the tasks offered by the individual studio, and upload bugs (indicating the gravity level and type). The more experience points you earn, the more you are eligible to participate in new touring. Members can also lose points if they do not comply with test instructions;
Financial compensation—Users are paid for the work done, the quality of the output, and the bugs found.
Thus, appropriate testers are selected according to the type of test to be carried out:
Experts, who devote time and effort to thoroughly testing interactions with the digital product, are required to carry out functional tests; for example, when testing the functioning of an online form to be filled out, testers enter a city with a mismatched postcode or write incomplete telephone numbers. In this way, they are able to identify the bugs related to the specific form and, more generally, to the product under evaluation;
On the other hand, users considered as having the same characteristics as the target audience are required to carry out experiential tests. In this case, users will carry out activities specific to the site (e.g., “buy a pair of sunglasses on the site”) and, subsequently, they will be asked to express their experience with the product through appropriate surveys.
2. Study 1
The objective of this study was to compare the usability assessments provided by both PRs and NPRs. Moreover, in order to account for both the effect of experience and the effect of the specific type of activity carried out, we involved both PRs and NPRs in both functional (namely, debugging) and experiential (namely, usability) tests. Basically, this study was designed to understand whether any bias is introduced either in light of differences in proficiency or because of the bug-finding activity itself. Indeed, PRs are presumably more expert than NPRs, and this can affect the usability assessment. Likewise, the activity of identifying bugs may affect usability assessments differently from just browsing the site.
2.1. Participants
Twenty PR (mean age = 31; st. dev. = 9; 3 females) and 20 NPR (mean age = 32; st. dev. = 10; 11 females) were involved in both functional and experiential tests (see below) on the same website (
http://www.umbriatourism.it, accessed 1 February 2021, a touristic information website concerning the Umbria region in Italy). The website was chosen among the ongoing testing activity running in the period of our experimentation. Accordingly, 10 individuals were assigned to each condition in a between-subject experimental design: 10 PR performing the functional test; 10 PR performing the experiential test; 10 NPR performing the functional test; and 10 NPR performing the experiential test. All participants were Italian.
2.2. Procedure
The functional test always consisted of the flows related to three tasks within the “
www.umbriatourism.it” site:
Check the correct behavior of the “umbria-tourism” portal by specifically exploring the following path “Home Page > City and Villages from A to Z > Discover all the villages in Umbria > Perugia”;
Verify that all the functions are working properly by filling in the fields. Stress the search tool using different mixes of filters and go into the details of the proposed solutions to verify their correctness;
Check the correct behavior of the “Organise your trip” function: plan an itinerary by freely choosing different solutions.
The experiential test consisted in performing 3 tasks within the test website:
Searching for information about the city of Perugia: “without using the search engine (represented by the magnifying glass), find the page with the historical and cultural information about the city of Perugia”;
Requesting information on accommodation: “book accommodation in Perugia with specific characteristics. Consider the task completed when you have filled in the booking form (do not send the request!)”;
Build an itinerary: “using the site’s “Build your own itinerary” function, prepare and print a list of specific activities to do in Perugia”.
At the end of both tests (functional and experiential), subjective measures of perceived usability were collected using the Italian version of the following scales:
Net Promoter Score (NPS): Developed by Fred Reichheld [
29], this is a single item tool: “How likely would you be to recommend this product/brand/service to a friend or colleague?”. Participants can answer using an 11-point scale (from 0 to 10). Responses can be categorized into three profile groups [
30]: Promoters (who provided ratings from 9 to 10); Neutrals (who provided ratings from 7 to 8); and Detractors (who provided ratings from 0 to 6). As for the purposes of this research, the NPS raw value (ratings from 0 to 10) was used as a dependent variable.
Usability Evaluation (Us.E.) 2.0: This is a multidimensional questionnaire to evaluate website usability [
31]. The questionnaire was originally developed in Italian and consists of 19 items subdivided into three subscales, representing the framework users would adopt for evaluating the quality of their interaction with the interface: (Mental) Handling, Satisfaction, and Attractiveness. Us.E. 2.0 allows a quick assessment of website perceived usability, identifying critical issues that could be eventually addressed by more extensive testing and re-design. Recent studies have confirmed its construct validity [
32].
System Usability Scale (SUS): This is a 10-item questionnaire that provides a global assessment of the usability of different systems, such as hardware, software, or web services [
33]. Although some items may be considered outdated, the SUS is still one of the most widely used usability questionnaires in the literature.
Usability Metrics for User Experience (UMUX): This is a shorter alternative to the SUS [
34]. It is composed of 4 items using a 5-point Likert scale.
Instantaneous Self-Assessment (ISA): This procedure (basically a single item for rating the difficulty of a task) was developed to provide immediate subjective assessments of job demands while performing primary work tasks [
35]. The ISA allowed us to assess the level of difficulty perceived by the participants when performing the test (functional or experiential).
2.3. Data Analysis and Results
NPS, SUS, UMUX, and ISA scores were used as dependent variables in a factorial ANOVA design Experience (Professional vs. Non-professional Respondents) by Test (experiential vs. functional). The three subscales of Us.E. 2.0 were used as dependent variables in a MANOVA design using Test (experiential vs. functional) and Experience (PR vs. NPR) as factors. The following subsection will describe the results obtained for each measure.
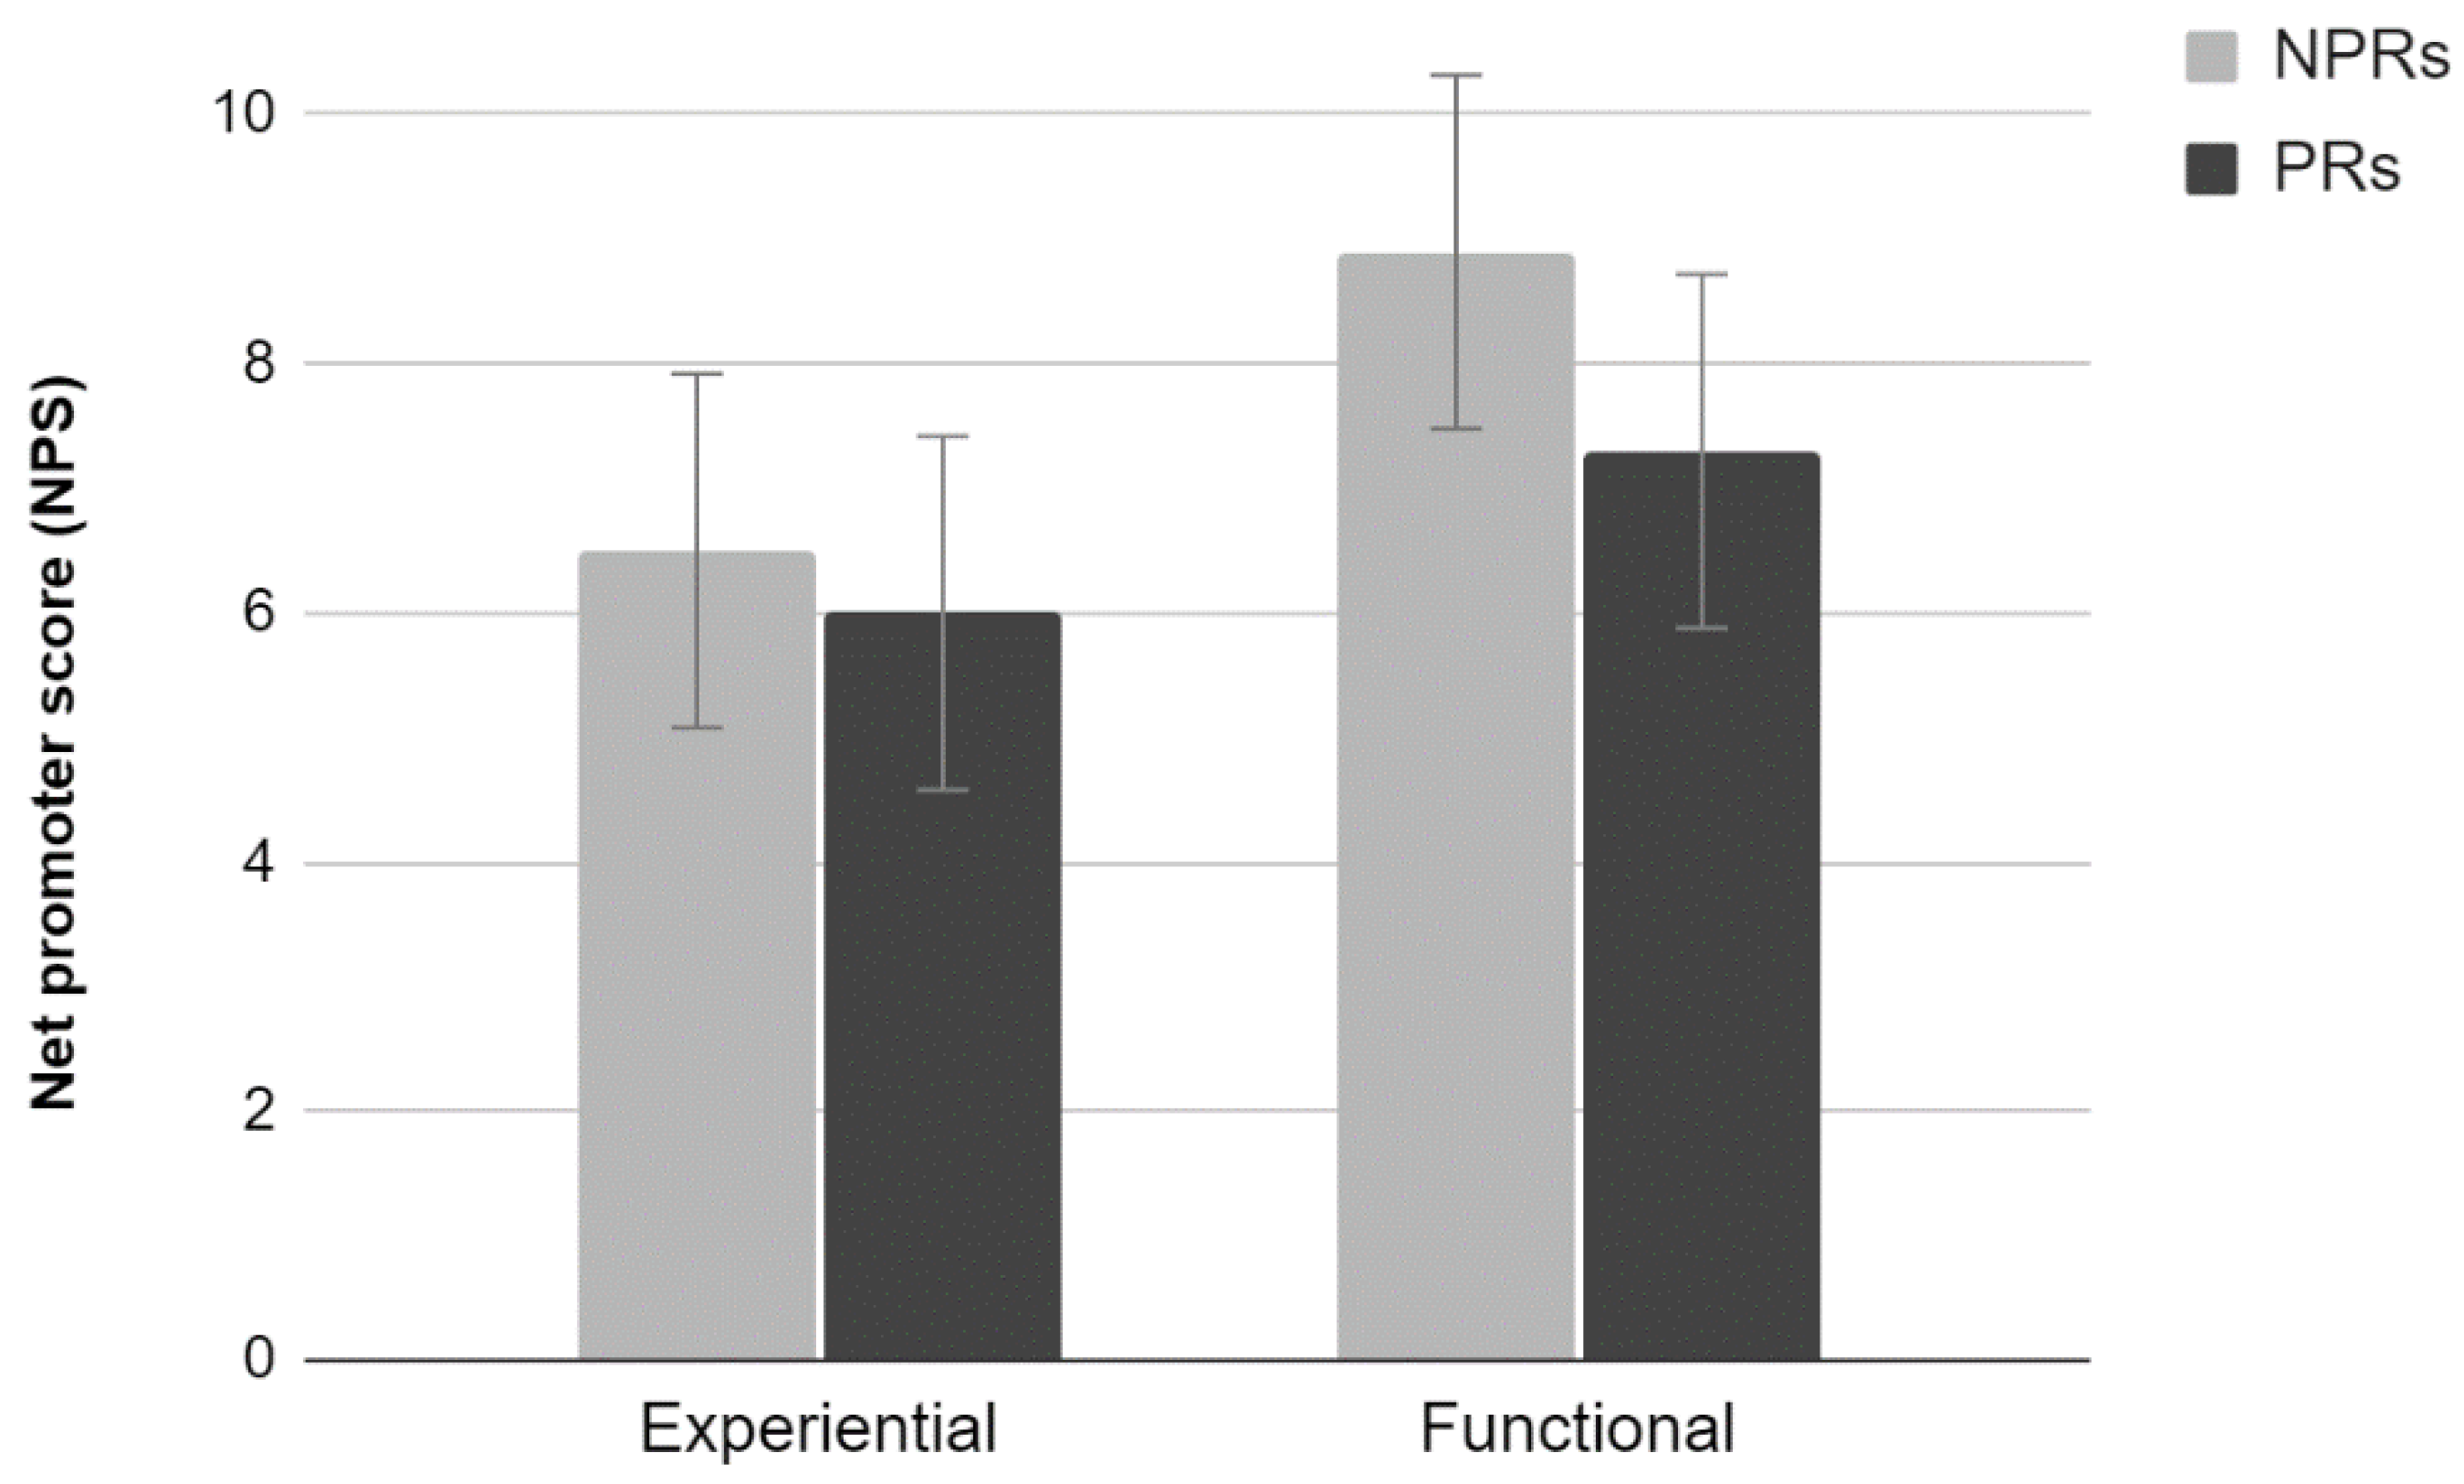
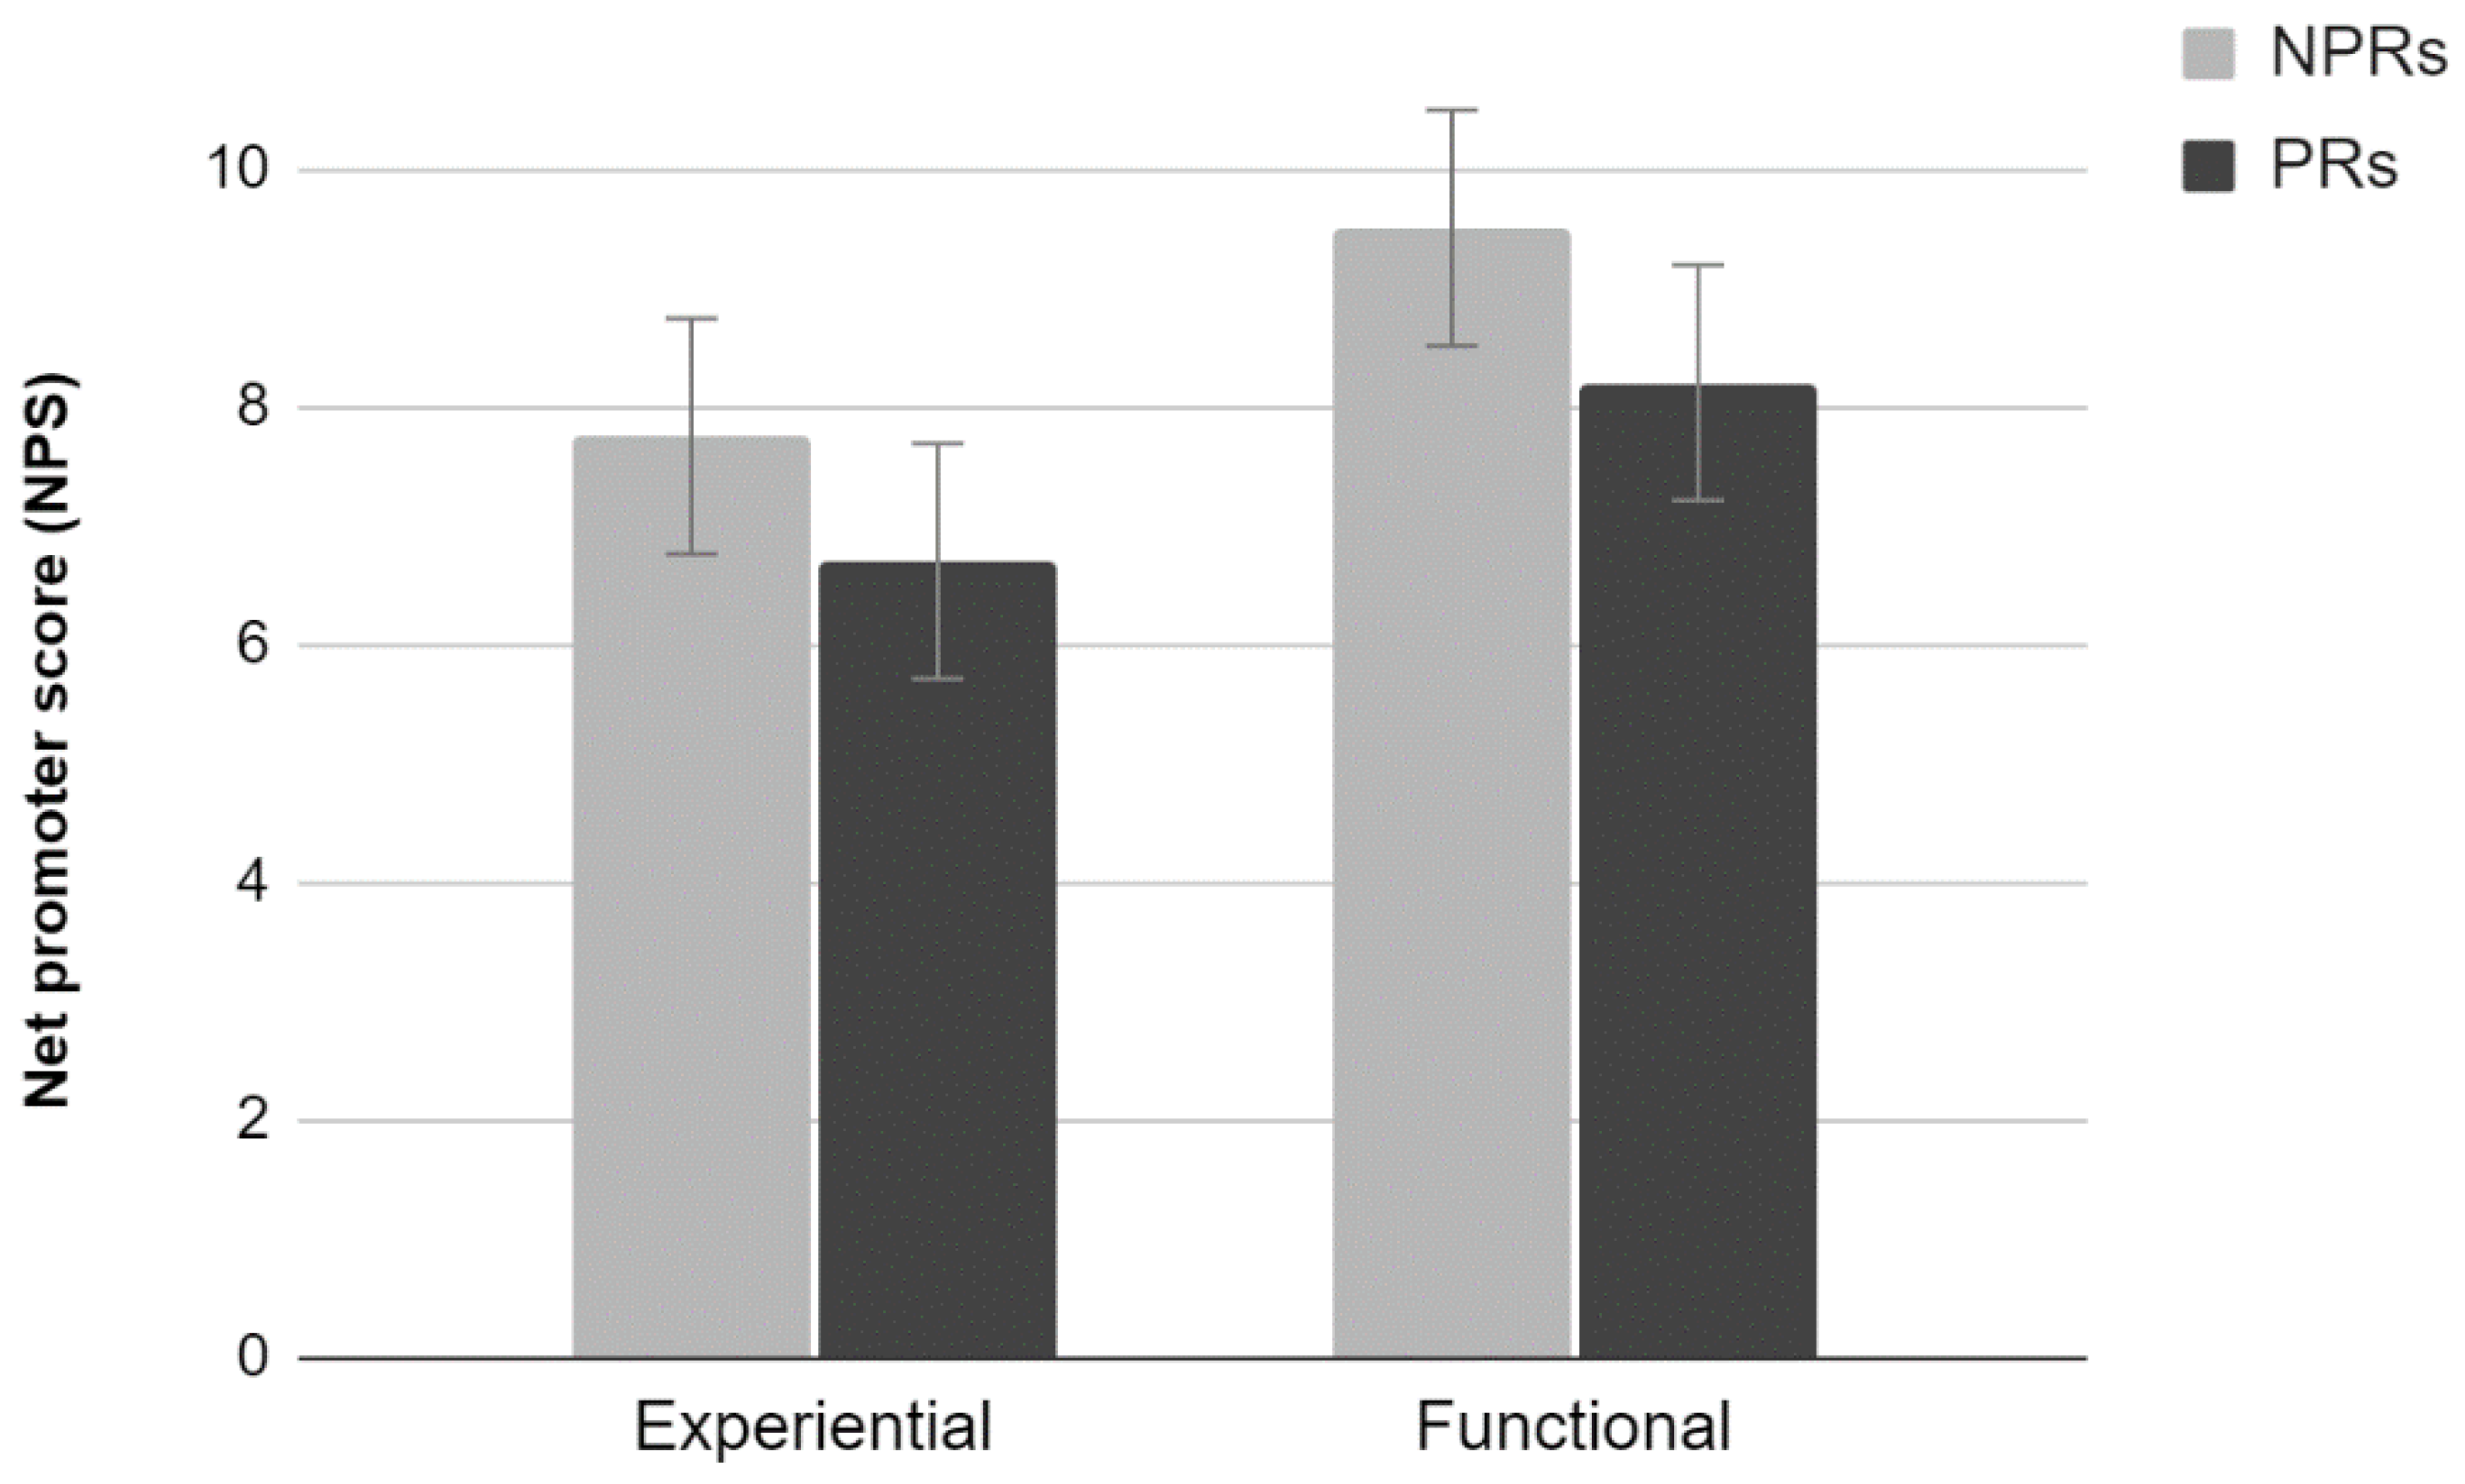
2.3.1. NPS
The analysis of the average scores provided by the NPS scale did not show a significant interaction effect (
Figure 1). Results show a significant main effect of Test (F
1,36 = 6.71,
p < 0.05). Participants who carried out a functional test tend to evaluate the site more positively than those who carried out an Experiential test. There were no significant differences between PR and NPR (
p > 0.05).
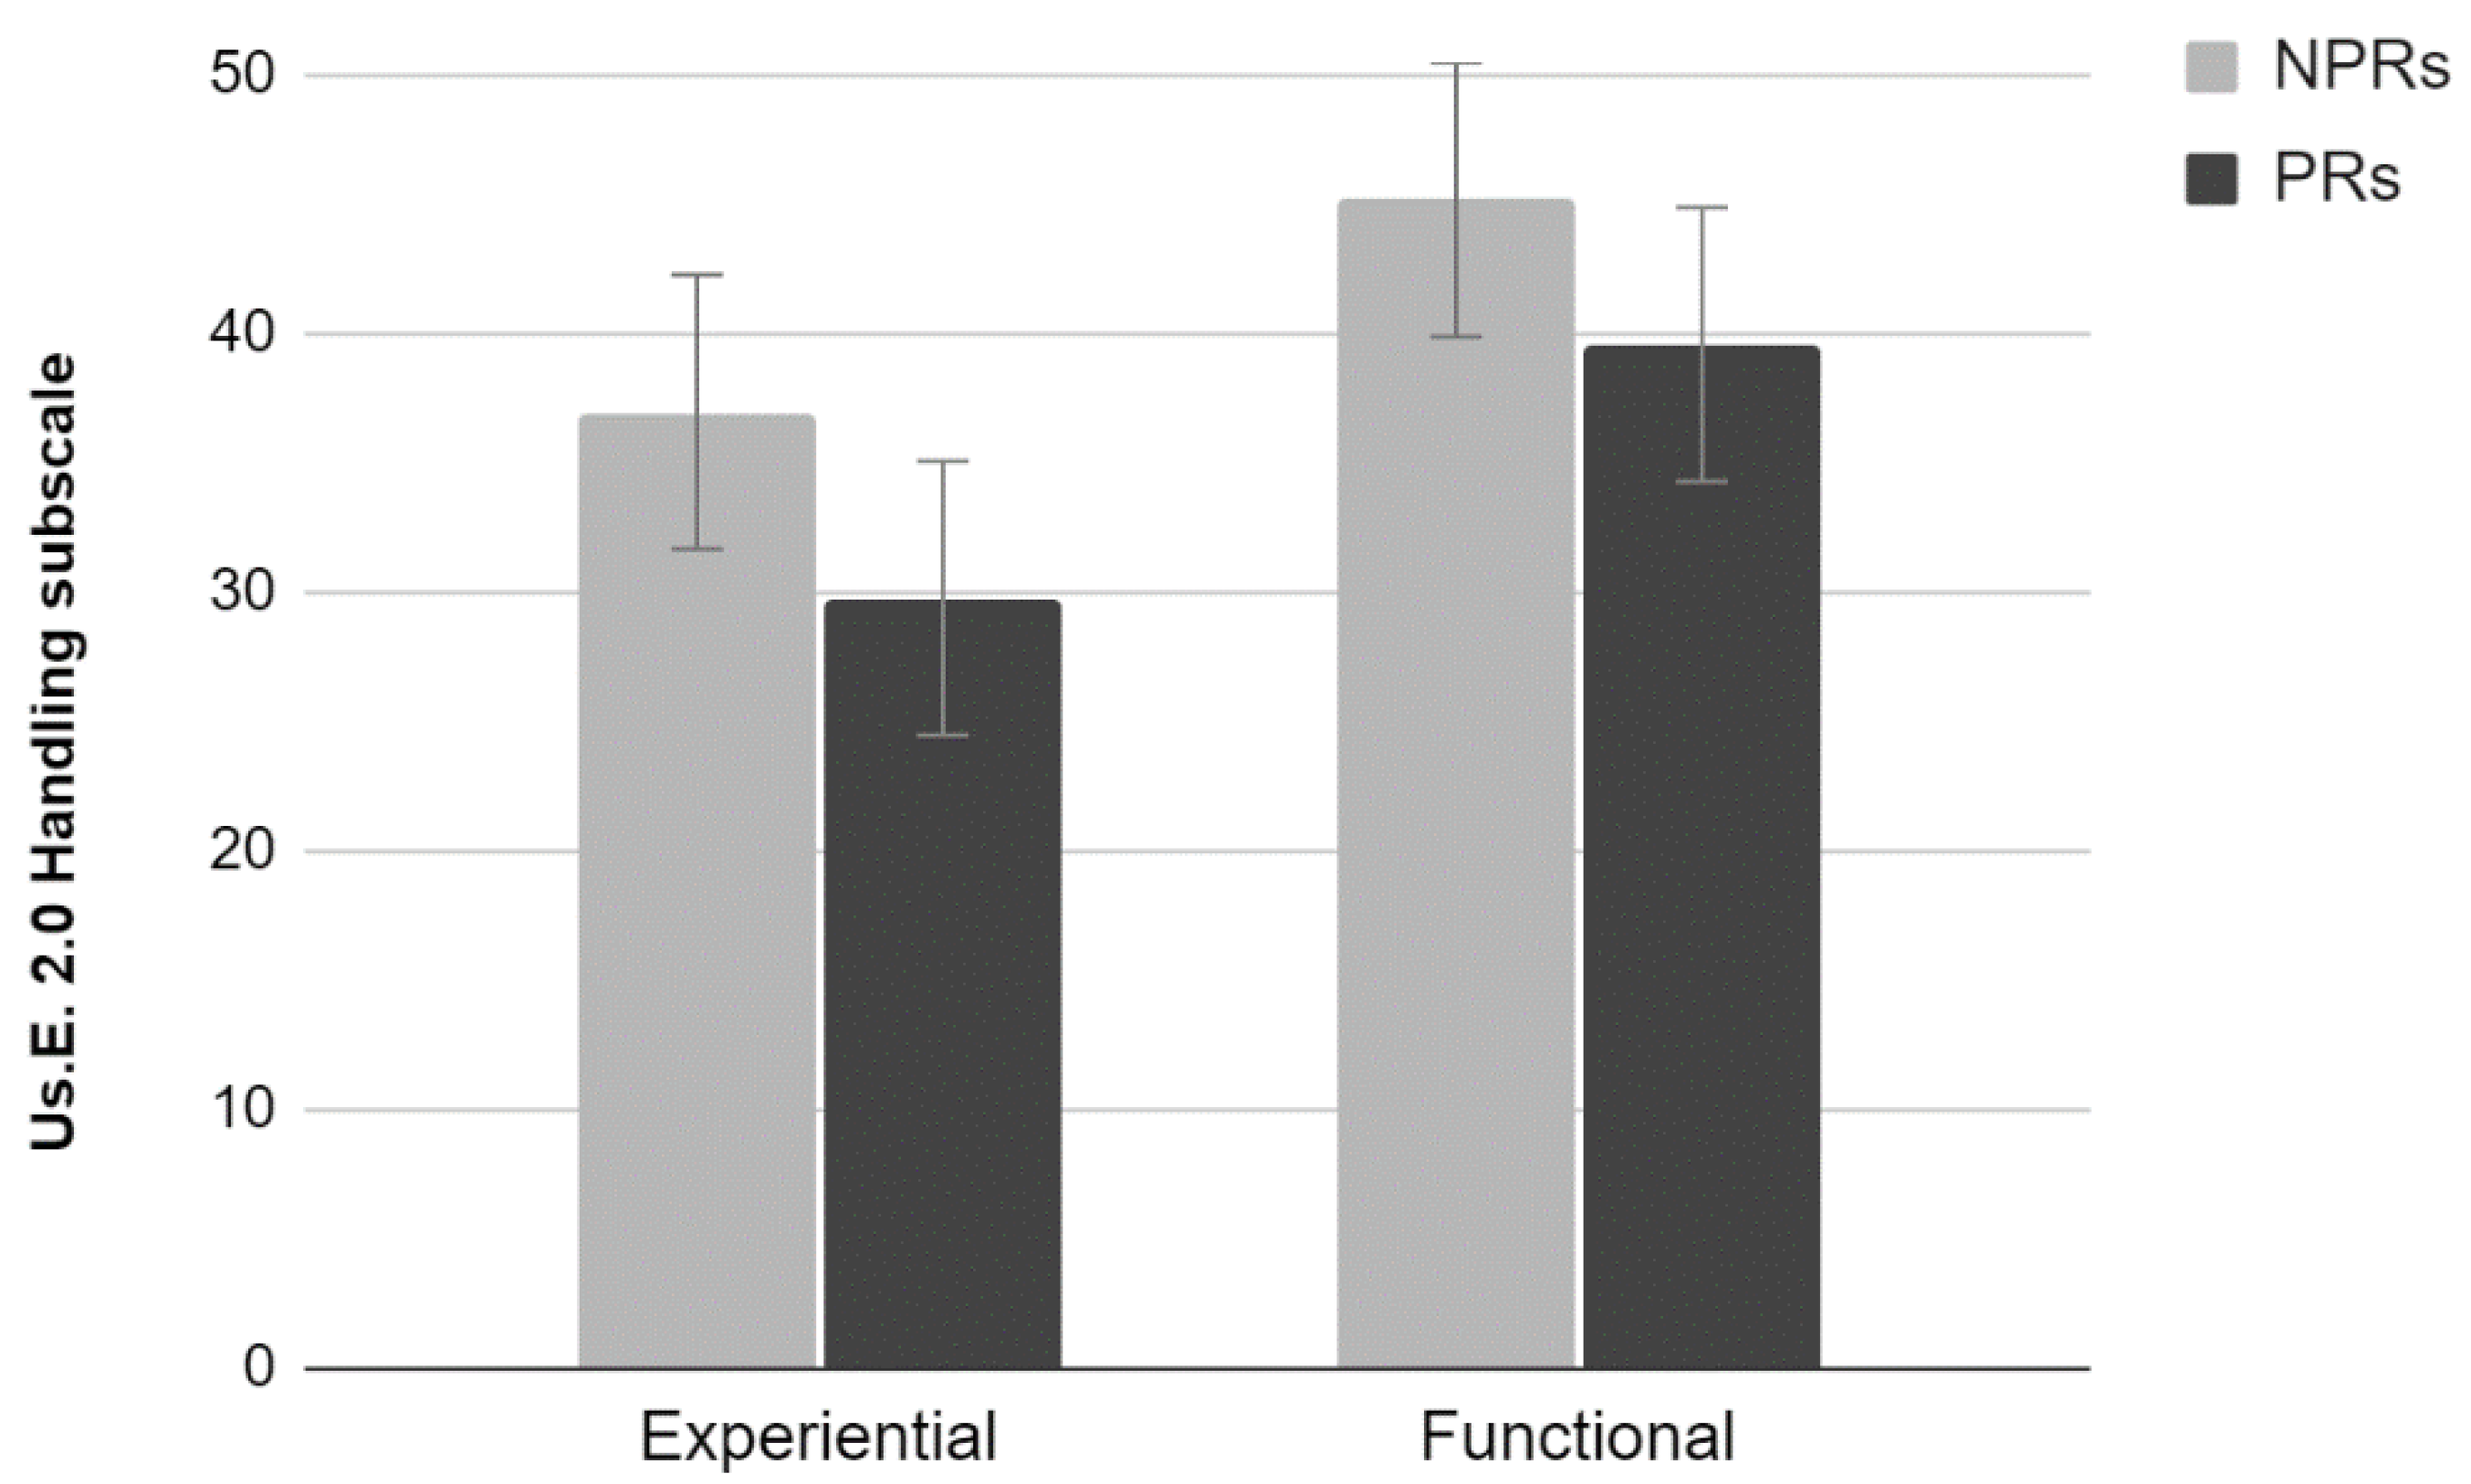
2.3.2. Us.E. 2.0
Results showed a significant effect of Test (Wilks lambda = 0.66, F
3,34 = 5.68,
p < 0.01). Univariate analyses using Test as factor showed a significant effect for the Handling subscale (F
1,36 = 11.52,
p < 0.01) (
Figure 2). Participants who performed the experiential test rated the site lower than those who performed the functional test. No significant effects for the Satisfaction and Attractiveness subscales were found (
p > 0.05).
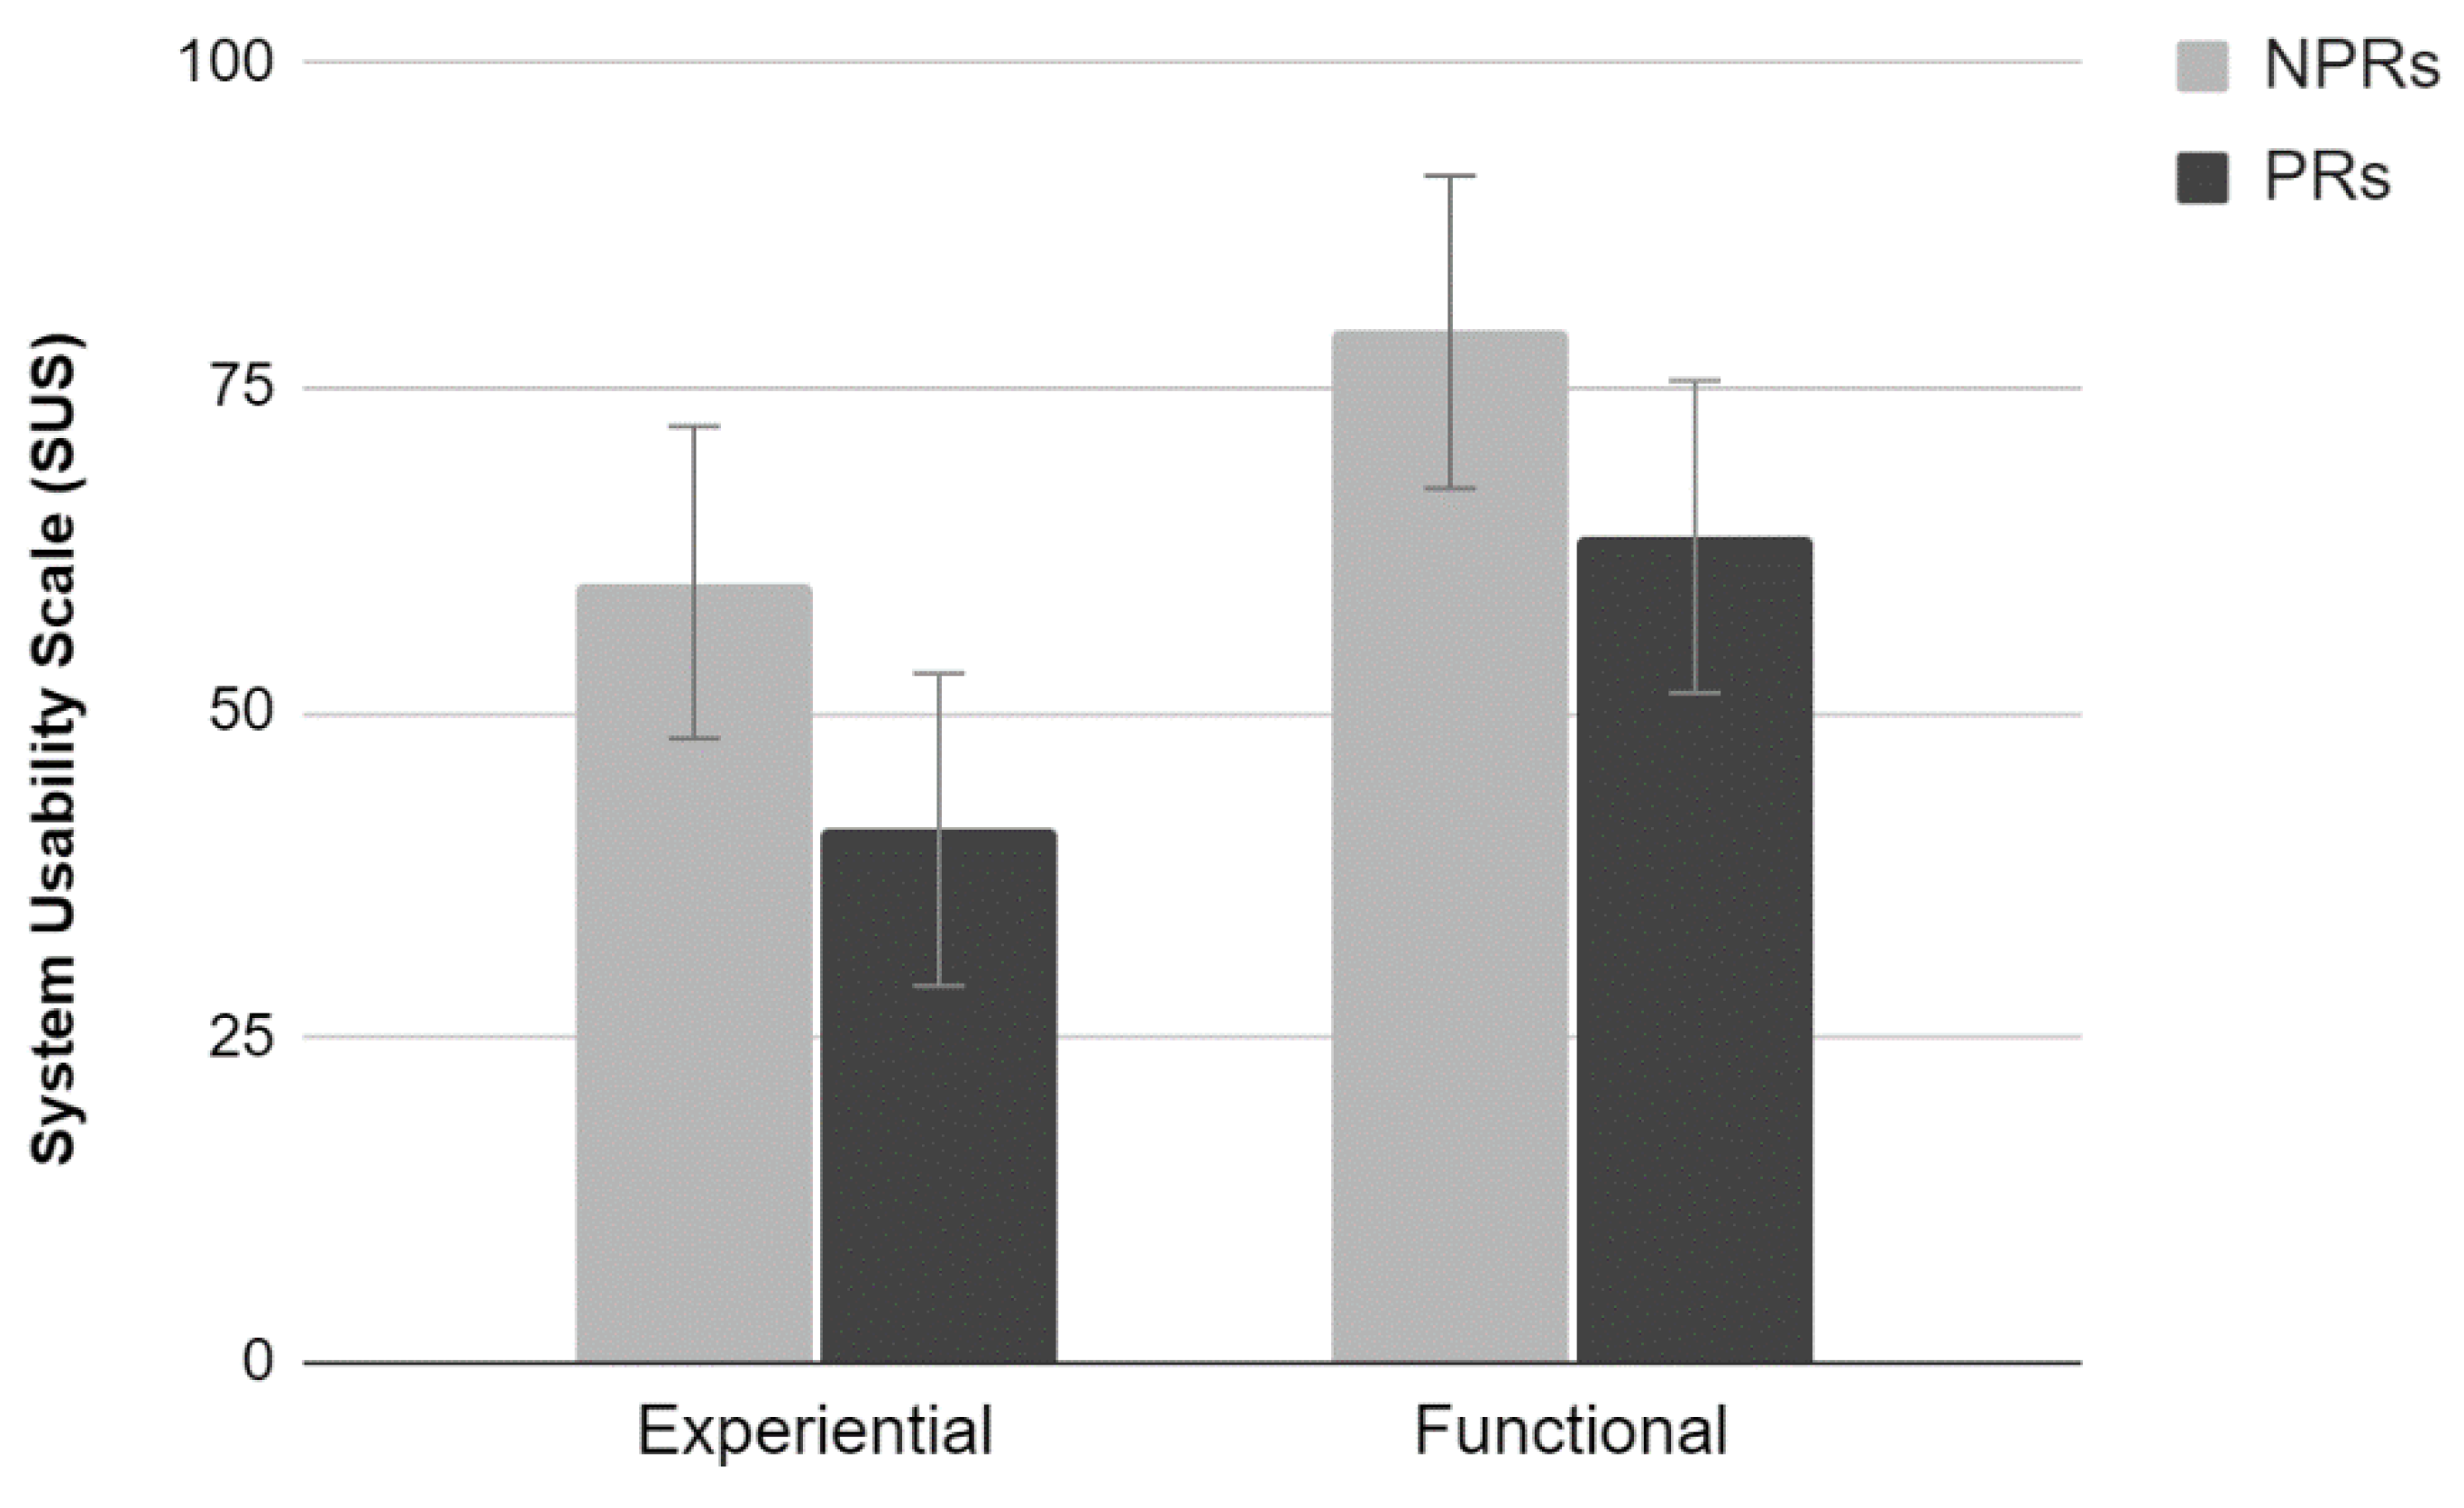
2.3.3. SUS
The analysis of the average scores provided by the SUS scale showed a significant main effect of Test (F
1,36 = 11.45,
p < 0.01). Participants who performed the experiential test rated the site lower than those who performed the functional test. Furthermore, there was a significant main effect of Experience (F
1,36 = 7.93,
p < 0.01). PRs rated the site significantly lower than NPRs. No significant interaction between the two factors was found (
Figure 3).
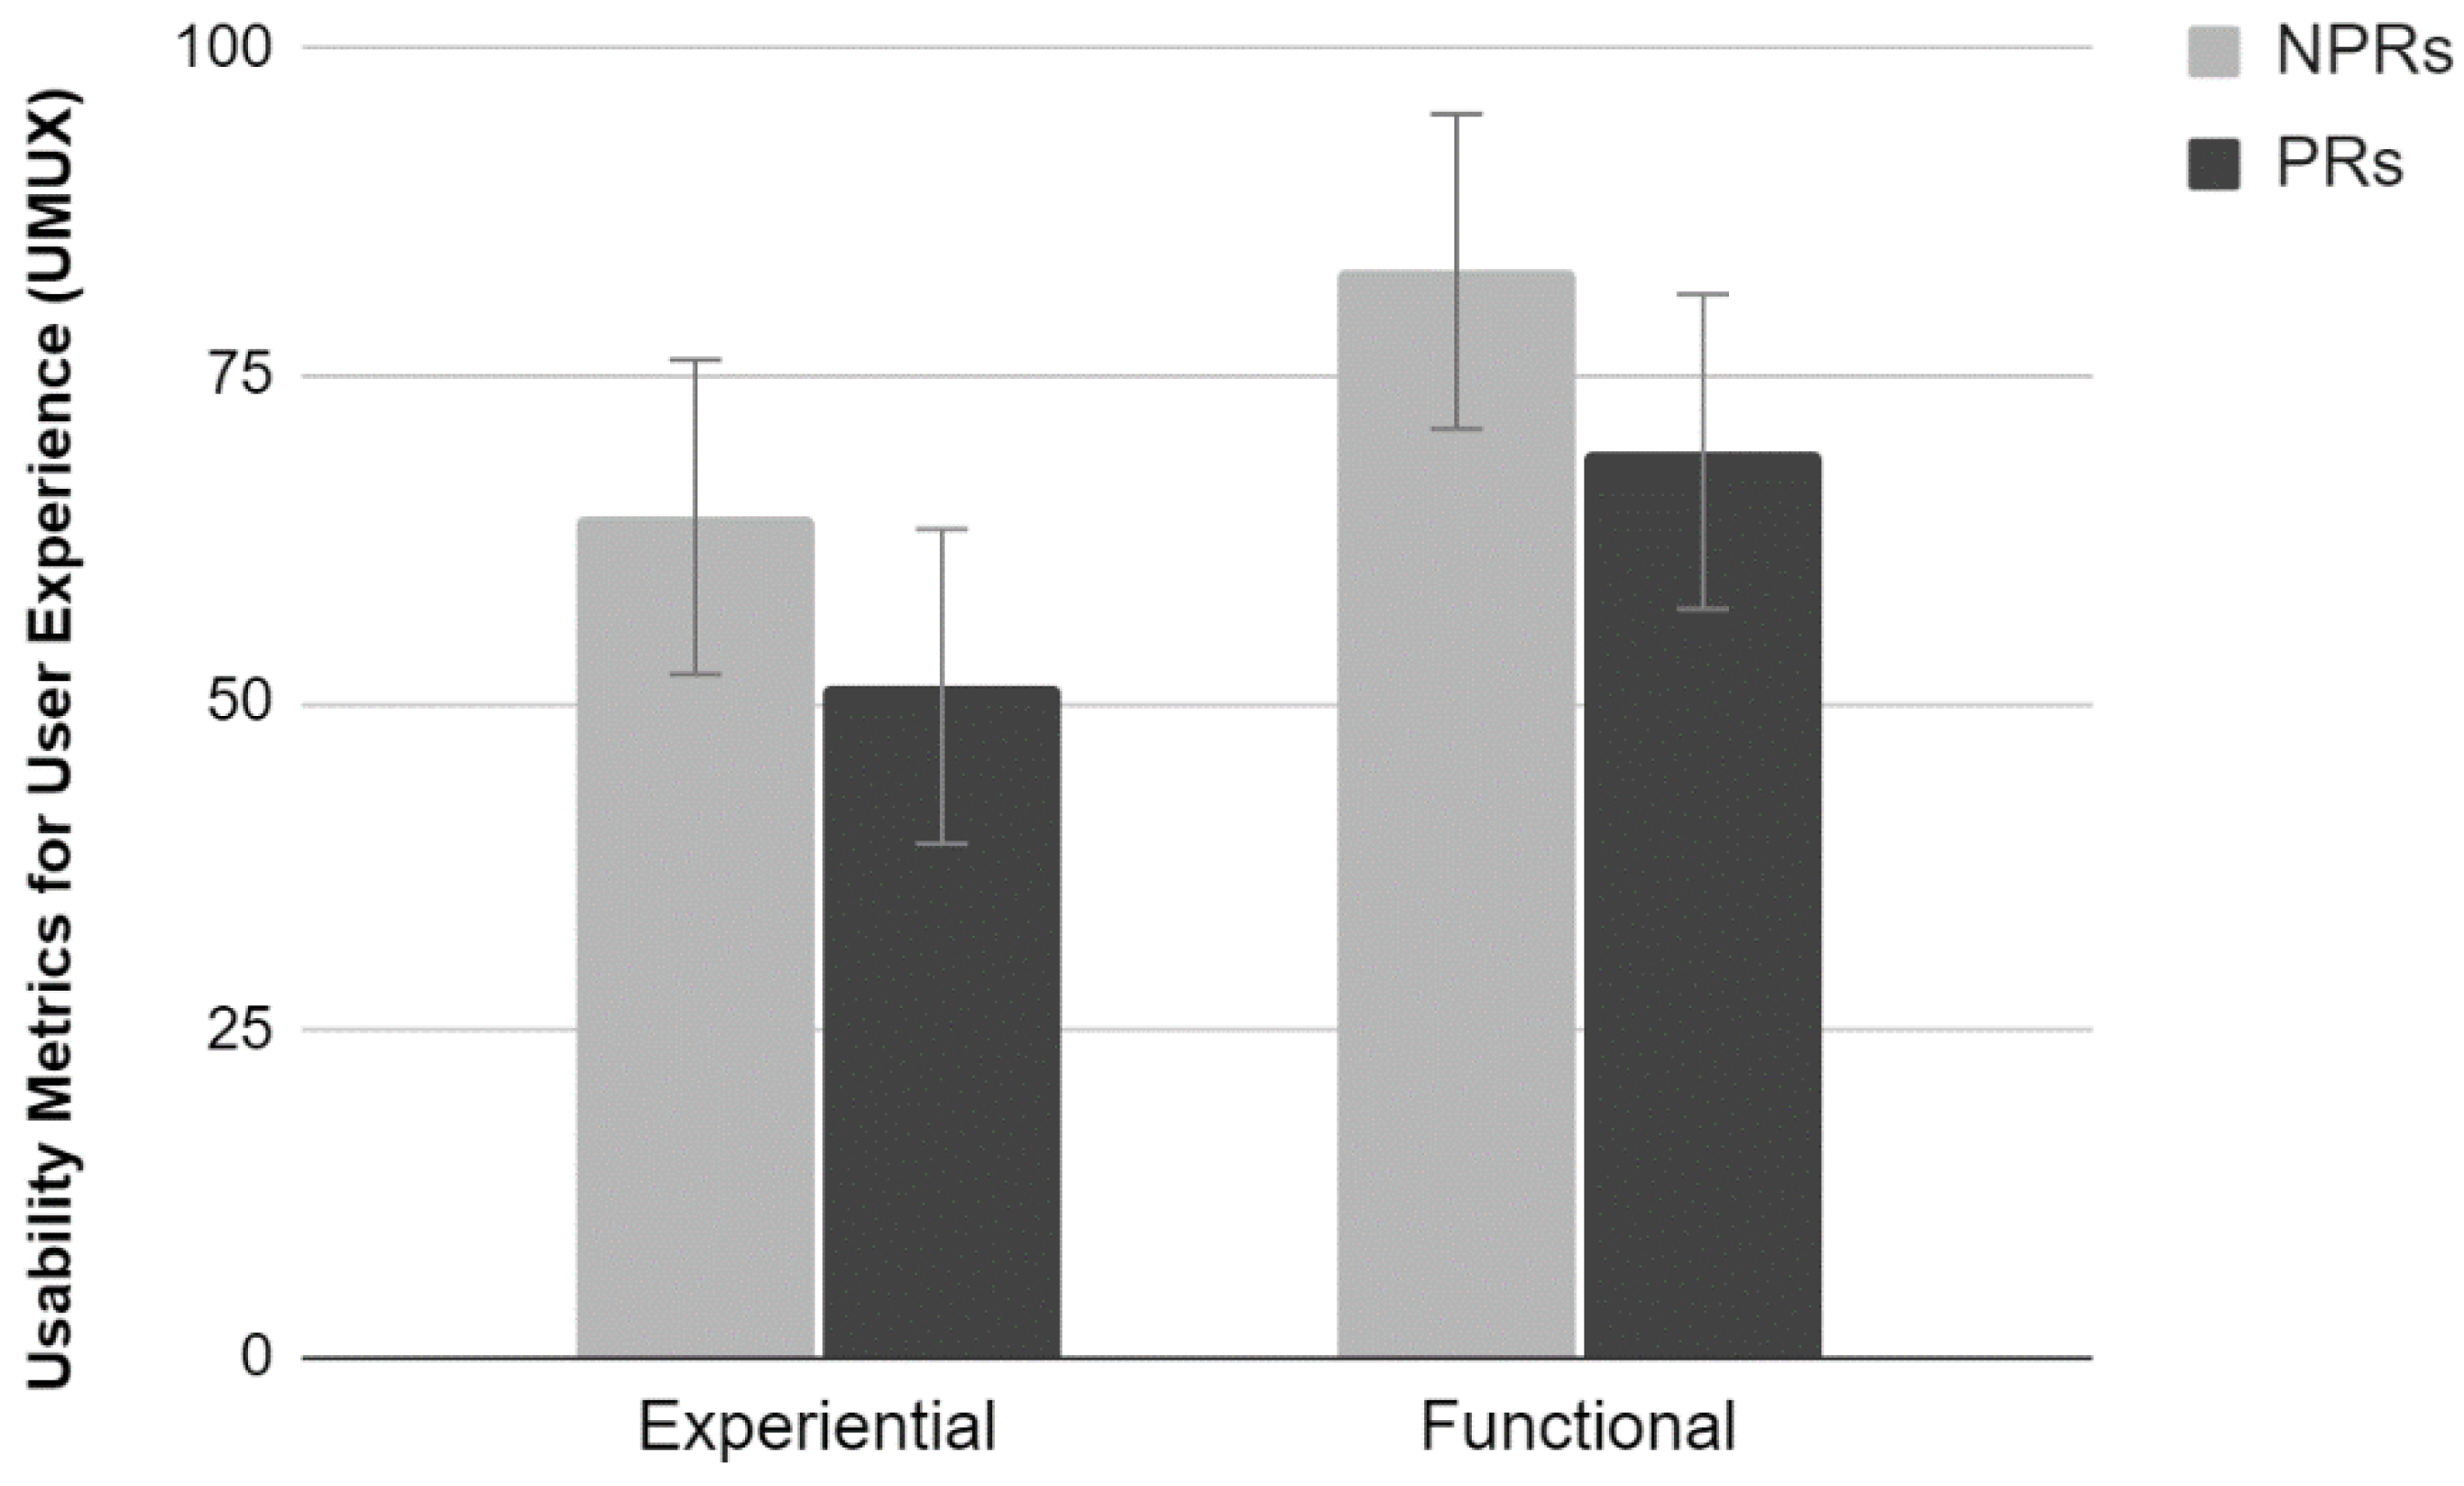
2.3.4. UMUX
The analysis of the average scores provided by the UMUX scale did not show a significant interaction effect between the factors (
Figure 4). Results show a significant main effect of Test (F
1,36 = 9.39,
p < 0.01). Participants who have carried out the functional test evaluated the site more positively than those who carried out the Experiential test. In addition, there was a significant main effect of Experience. PR evaluated the site more critically than NPR, providing lower perceived usability scores (F
1,36 = 4.96,
p < 0.05).
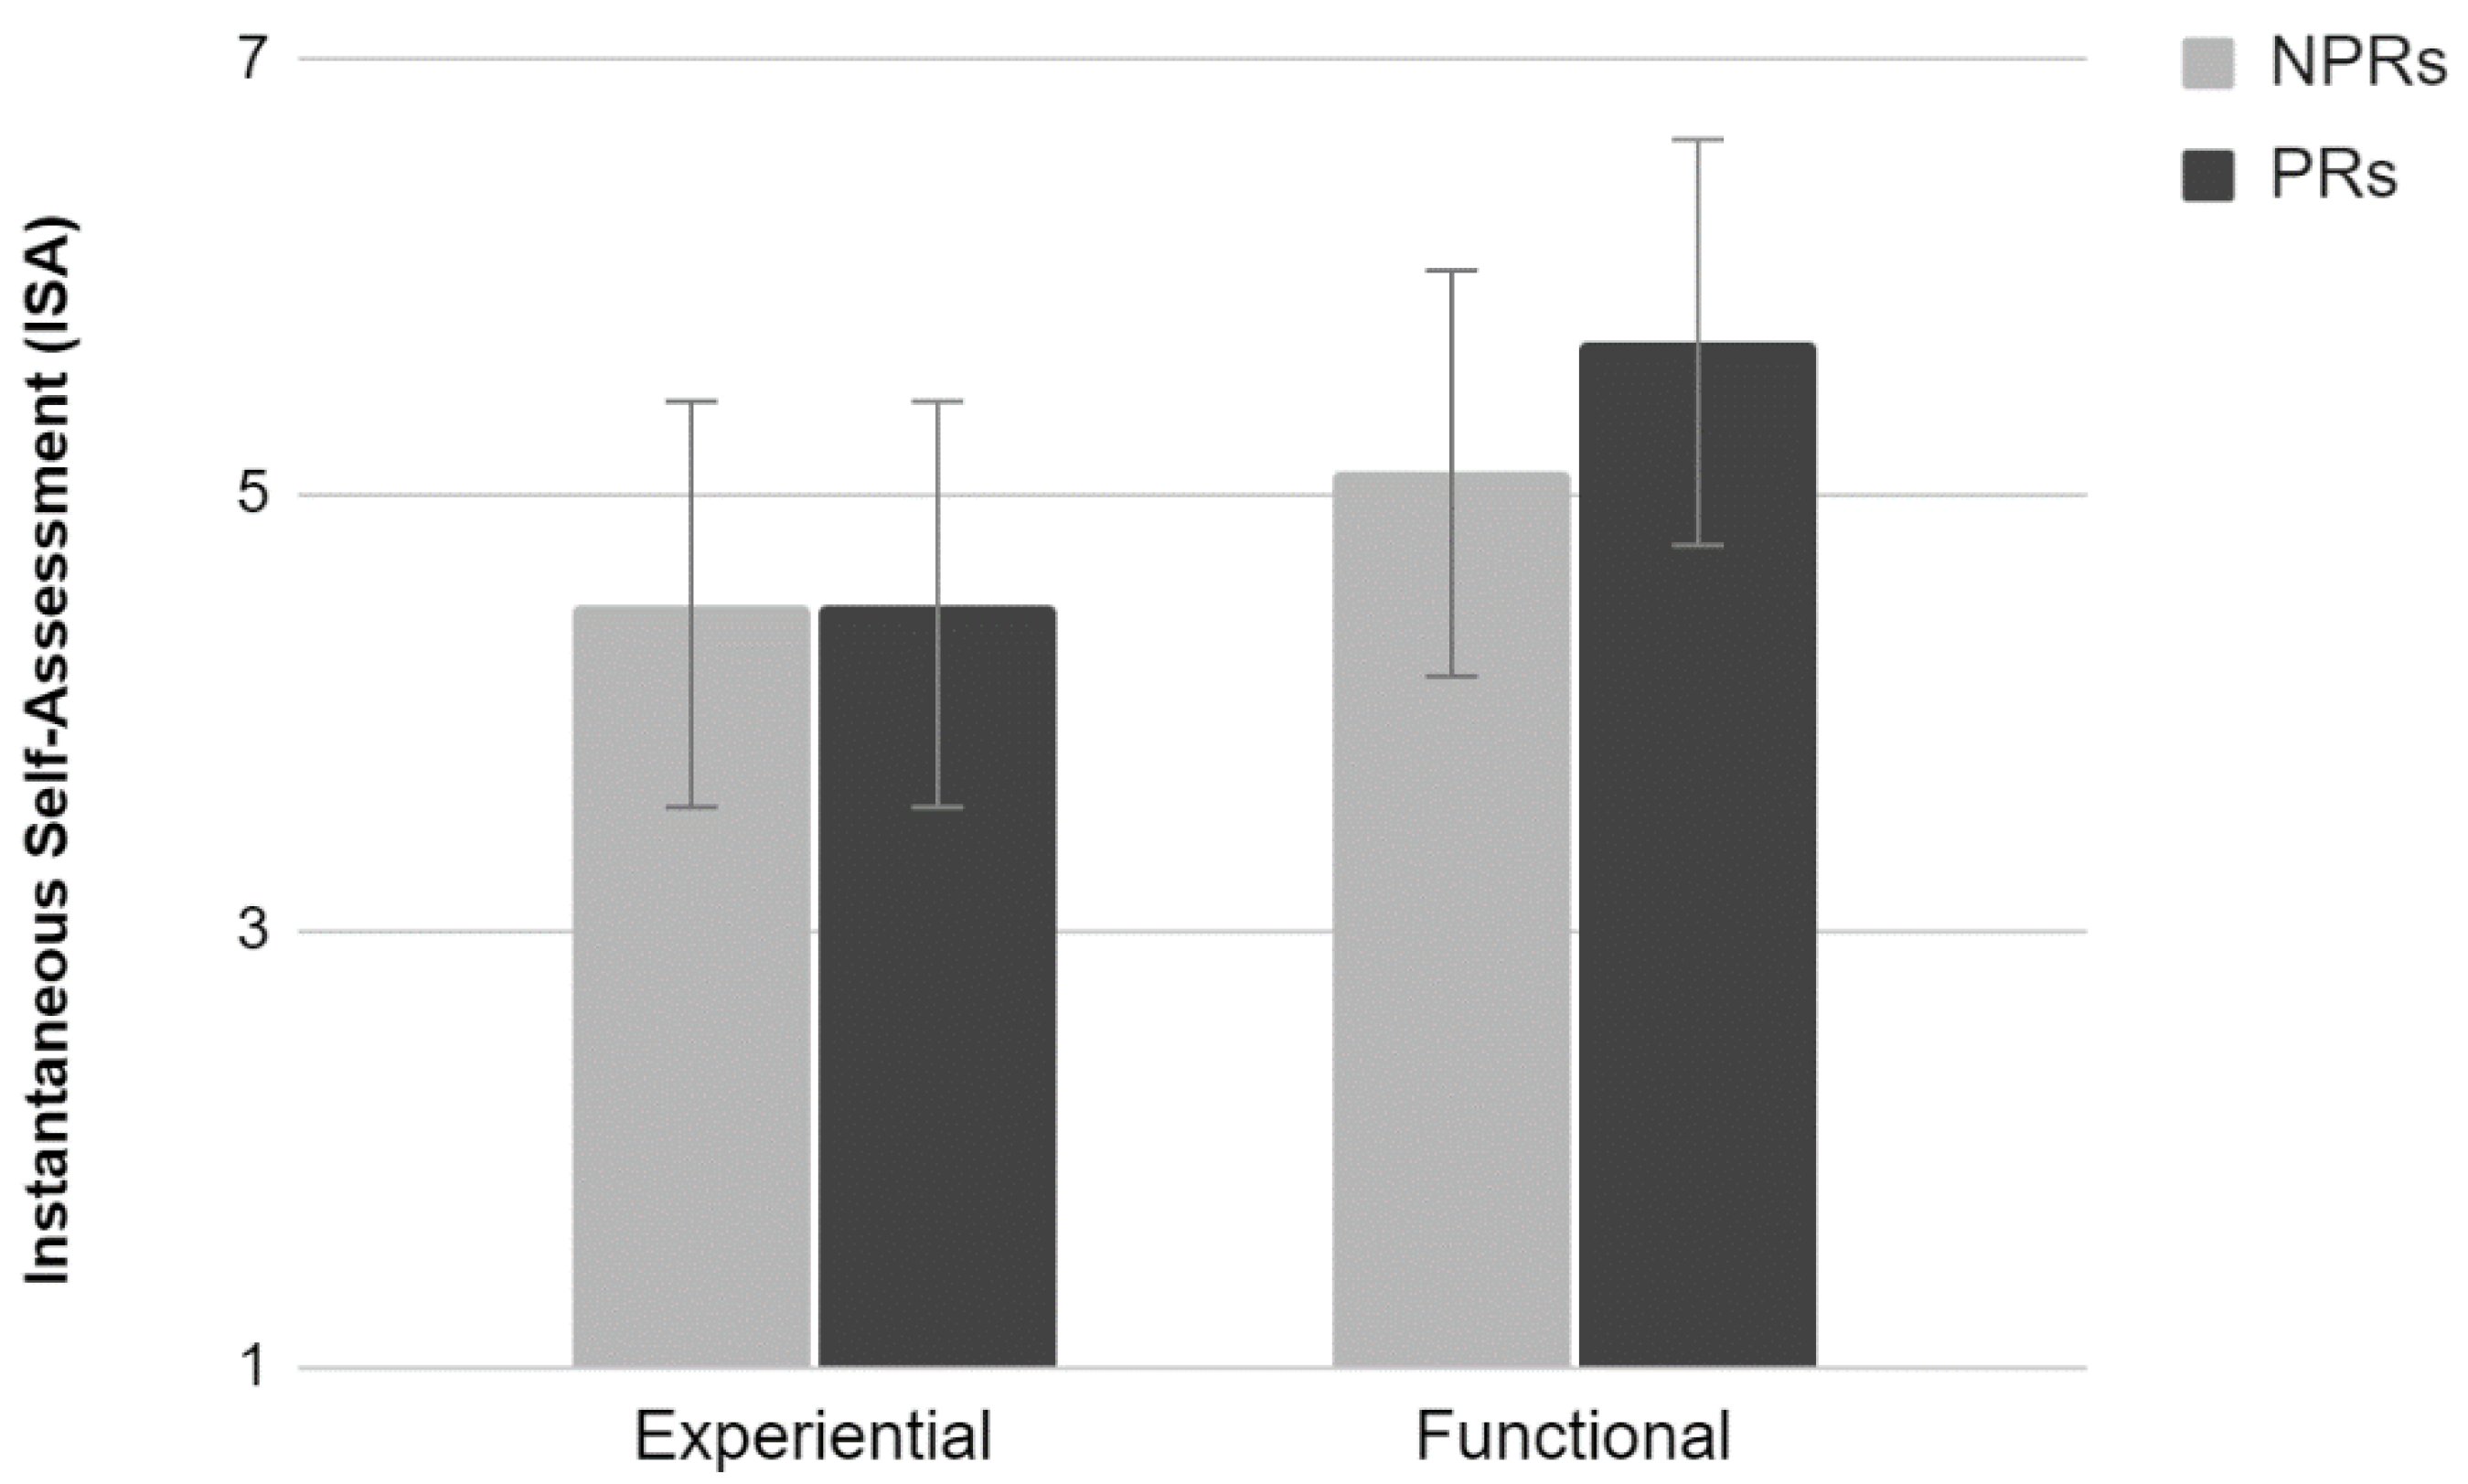
2.3.5. ISA
The analysis of the average scores provided by the ISA scale did not show a significant interaction effect between the factors (
Figure 5). Results show a tendency toward statistical significance of Test (F
1,36 = 3.73,
p = 0.06). Participants who performed the functional test tended to evaluate the activity as easier compared to those who performed the Experiential test.
2.4. Discussion—Study 1
One of the most interesting results of this first study is the absence of significant interactions between Test and Experience in all analyses. One would have expected different patterns for PR and NPR due to the type of activity carried out. Instead, the two factors appear to be independent. Firstly, there is a pervasive difference between PRs and NPRs. PRs reflect the characteristics of the category they belong to, as they have participated in many online studies. They are more likely to detect faults while exploring a website. The ratings provided by PRs along the various subjective metrics tend to be more severe than those provided by the NPRs, therefore suggesting that the level of experience negatively affects usability assessment. Is this a characteristic of this population or is it an effect due to the type of activity carried out just before the usability assessment? Results show that carrying out a functional test led to a more positive usability assessment, therefore excluding that the bias is introduced by the type of activity carried out. PRs provide different usability assessments with respect to the NPRs because of their very nature of experts.
Testing a website is qualitatively different from browsing a website, even if you are not an experienced tester. However, the evaluation of a website may be jeopardized by the fact of being a professional tester who easily notices bugs and faults, more than the end-user. Results of this first study confirm that we should raise the question of how confident we can be with usability assessments provided by professional respondents.
3. Study 2
The results of the first study showed interesting effects and shed light on the differences between the usability evaluations provided by professional and non-professional respondents. Additionally, no interaction between experience and the type of task was found. One main limitation of that study was that navigation strategies (page visited, completion time) were not investigated; therefore no information was available for explaining the details of the peculiarity of the PRs. The problem was related to the absence of information about visited pages and completion time in the functional test. PRs performing functional tests normally perform it outside any testing platform (e.g., Loop 11, UXarmy, UXtweak.) because they are only required to report the bugs they find. In the following study, instead, we collected this information through a custom browser extension that all participants were requested to start at the beginning of the test. In the present study, the number of participants was also doubled to increase the statistical power.
3.1. Participants
Forty PRs (mean age = 31 years; sd = 9; 9 females) and 40 NPRs (mean age = 32; dev. st. = 10; 11 females) were involved in both functional and experiential tests on the same website (
http://www.umbriatourism.it, a tourist information website concerning the Umbria region in Italy). Accordingly, 20 individuals were assigned to each condition in a between-subjects experimental design identical to that reported in Study 1. All participants were Italian.
3.2. Procedure
Procedure and measures were the same as in Study 1, except that visited pages and completion time were also collected in this case.
3.3. Data Analysis and Results
NPS, SUS, UMUX, ISA scores, number of visited pages, and completion times were used as dependent variables in a factorial ANOVA design Experience (Professional vs. Non-professional respondents) by Test (experiential vs. functional). The three subscales of Us.E. 2.0 were used as dependent variables in a MANOVA design using Test (experiential vs. functional) and Experience (PRs vs. NPRs) as factors. The following subsection will describe the results obtained for each measure.
3.3.1. NPS
Results showed a significant main effect of Test (F
1,76 = 10.72,
p < 0.01). Participants who performed the functional test provided higher promotion ratings for the site than those who performed the experiential test. A main effect of user type (F
1,76 = 5.60,
p < 0.05) was also found. Professionals provided more negative evaluations than Non-professionals. No interaction effect was found between the two factors (
Figure 6).
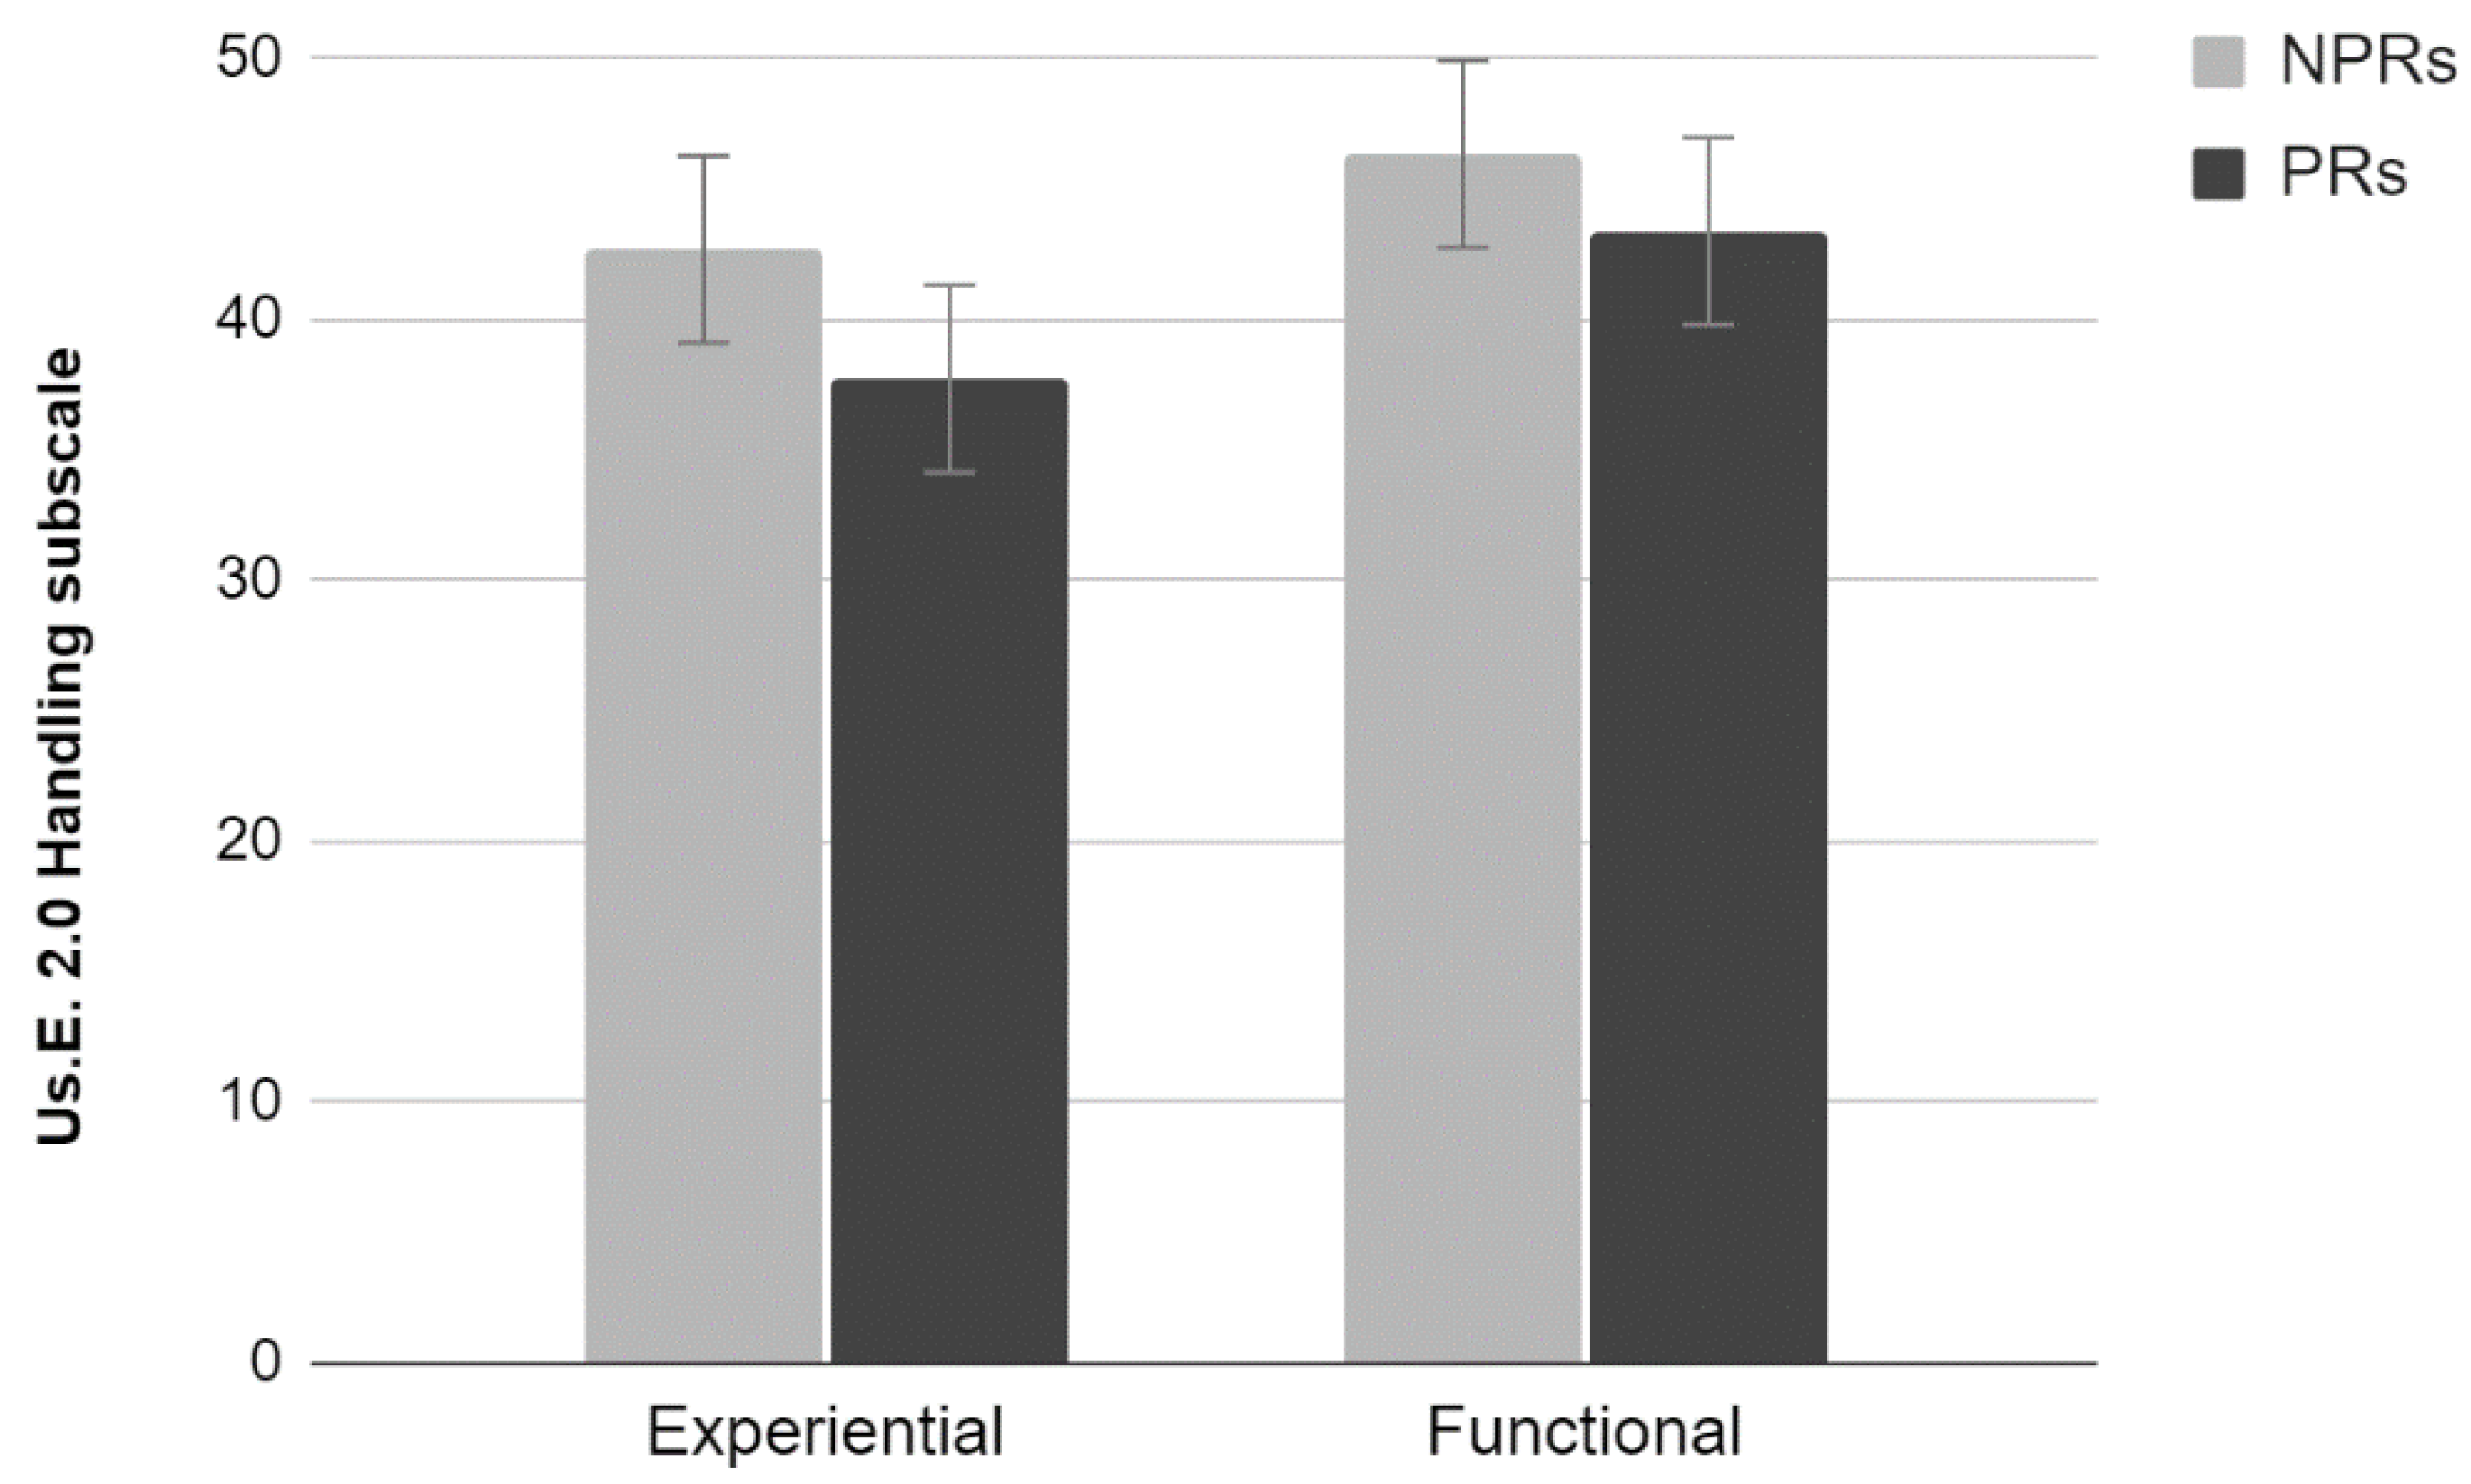
3.3.2. Us.E. 2.0
Results showed a significant effect of Test, Experience, and also an interaction effect between those two factors (Wilks lambda = 0.81, F
3,74 = 5.76,
p < 0.01, Wilks lambda = 0.88, F
3,74 = 3.29,
p < 0.05, and Wilks lambda = 0.79, F
3,74 = 6.43,
p < 0.001, respectively). Analyses run on each subscale showed a significant effect of Test (F
1,76 = 6.74,
p < 0.05) and Experience (F
1,76 = 4.86,
p < 0.05) and no significant interaction (
p > 0.05) for the Handling scale (
Figure 7). Particularly, PRs rated the site lower than NPRs, and participants who performed the experiential test rated the site lower than those who performed the functional test. No effects for the Satisfaction scale (
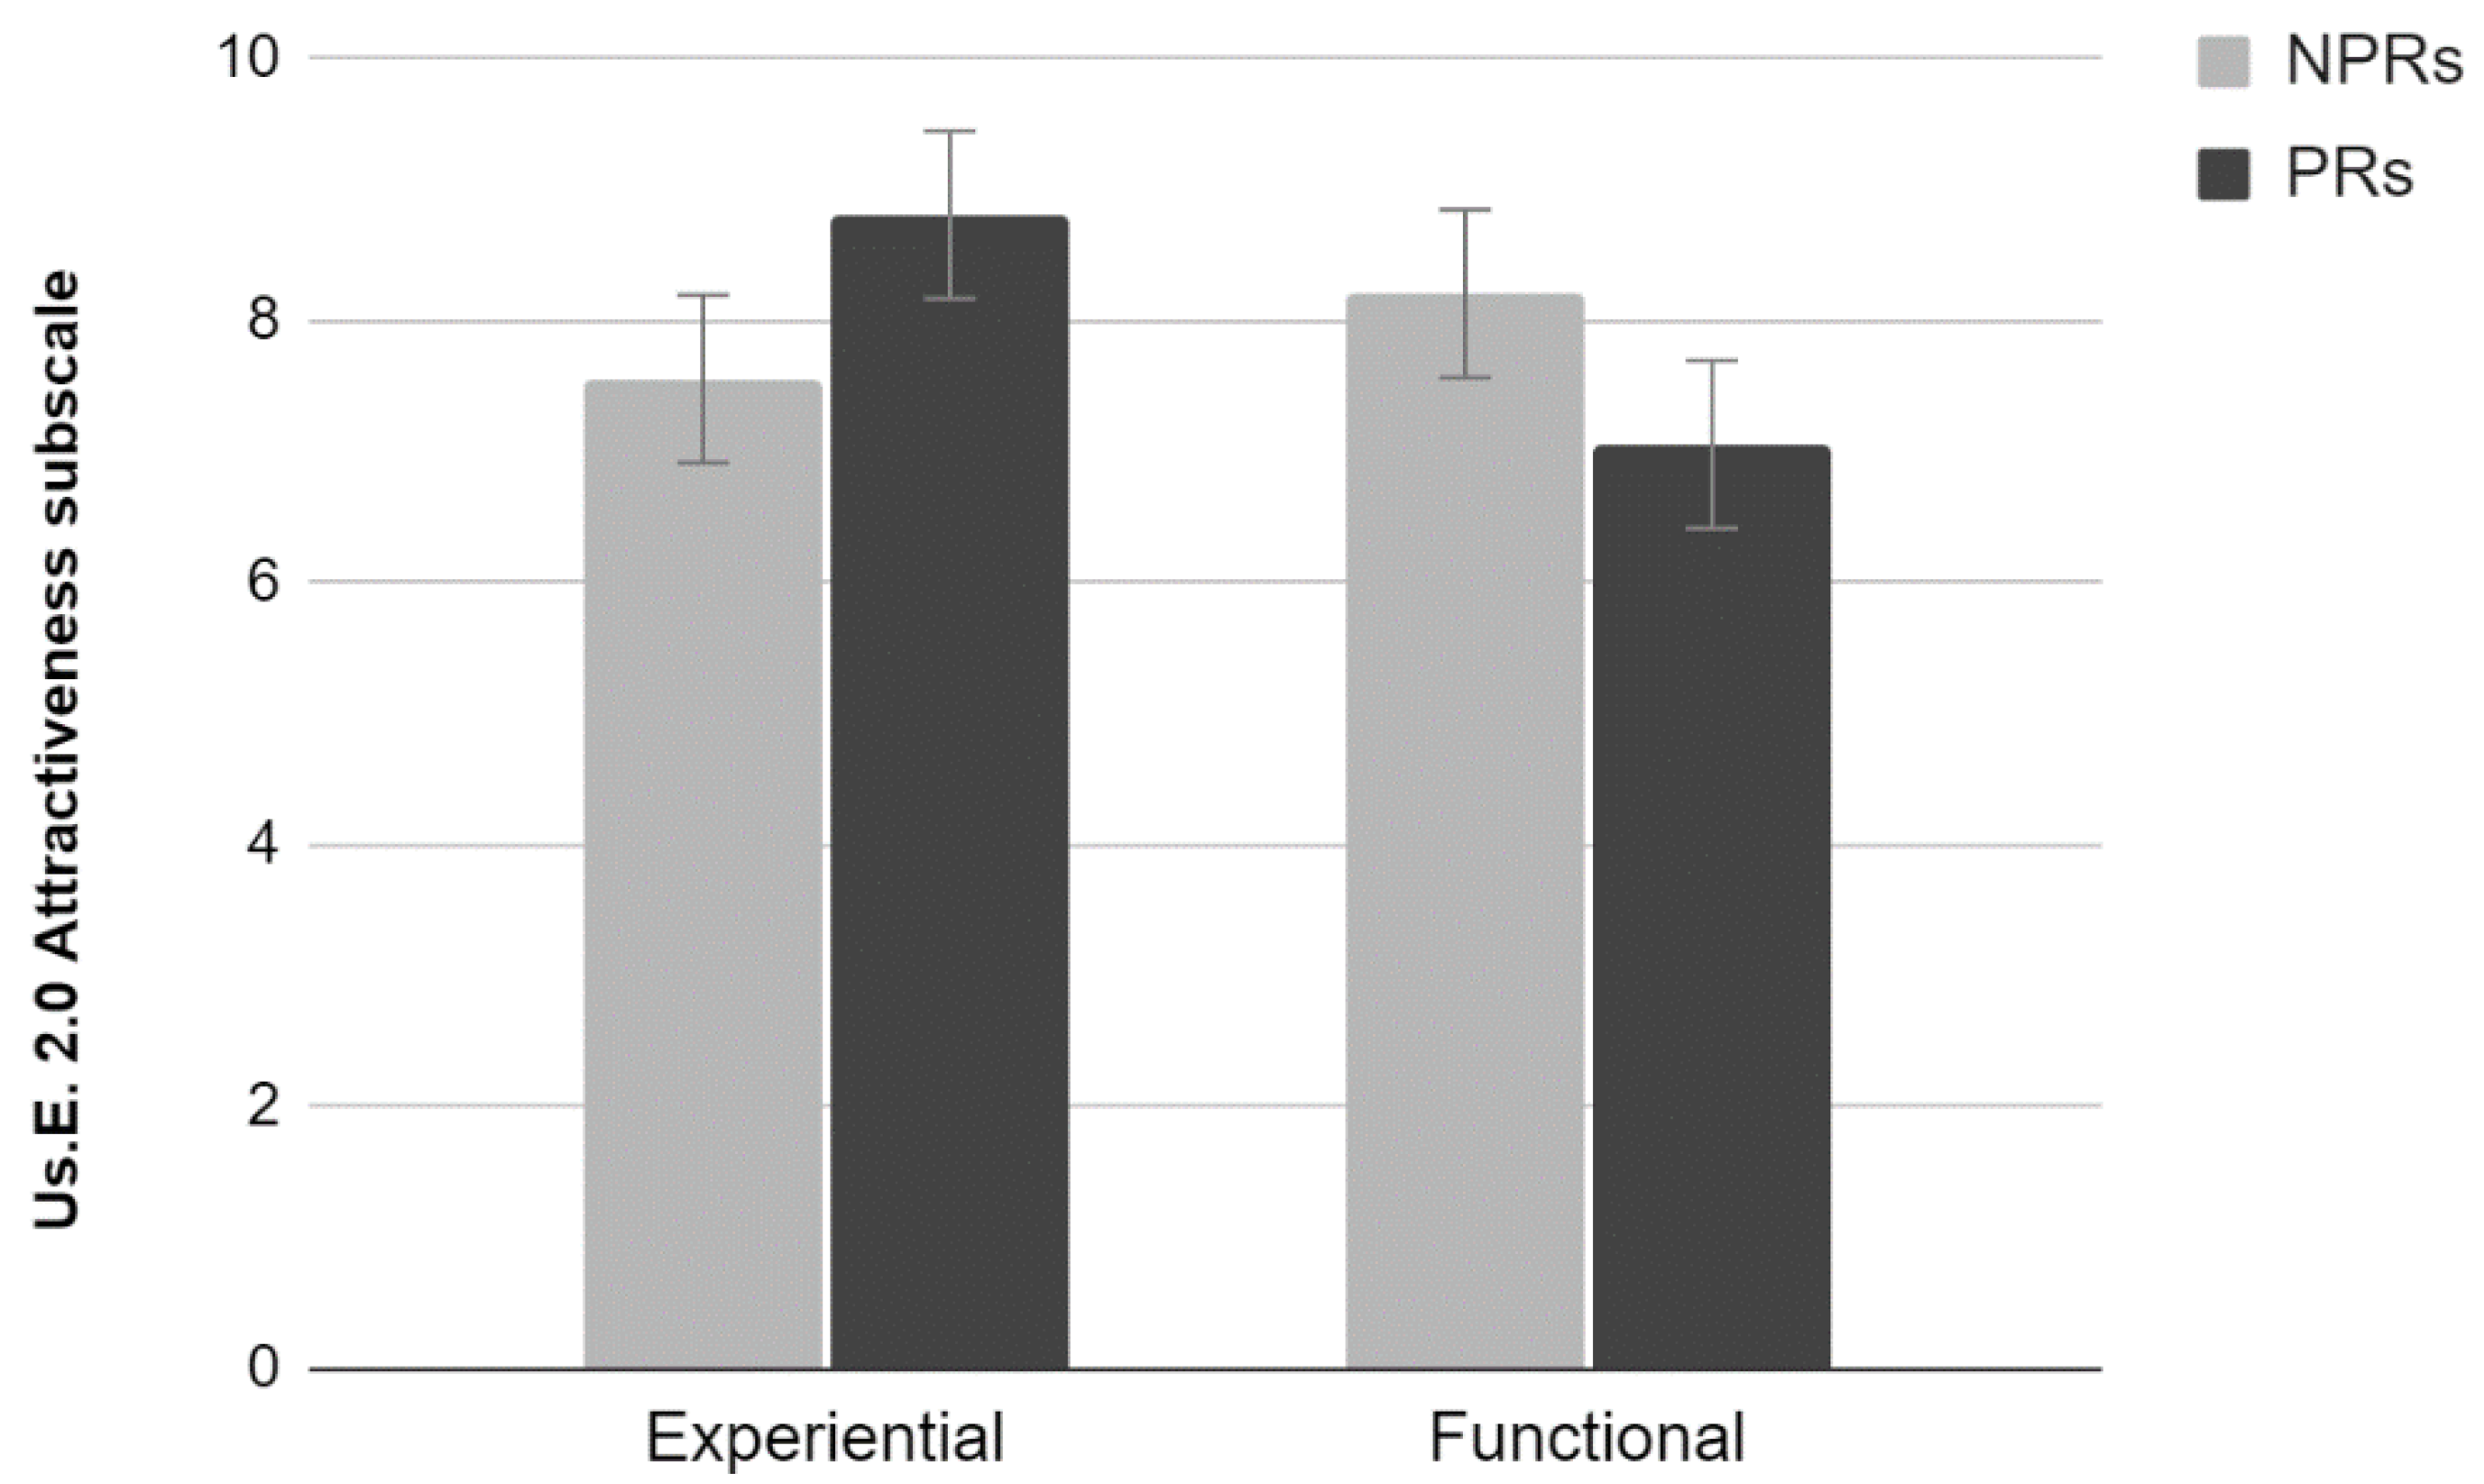
p > 0.05) were found. A significant interaction effect between Test and Experience (F
1,76 = 14.00,
p < 0.001) for the Attractiveness scale and no significant main effect of the two factors (
Figure 8). Post hoc Duncan testing showed that assessments provided by the NPR were not significantly different, whereas the PR rated the site as more attractive when performing the experiential rather than the functional test.
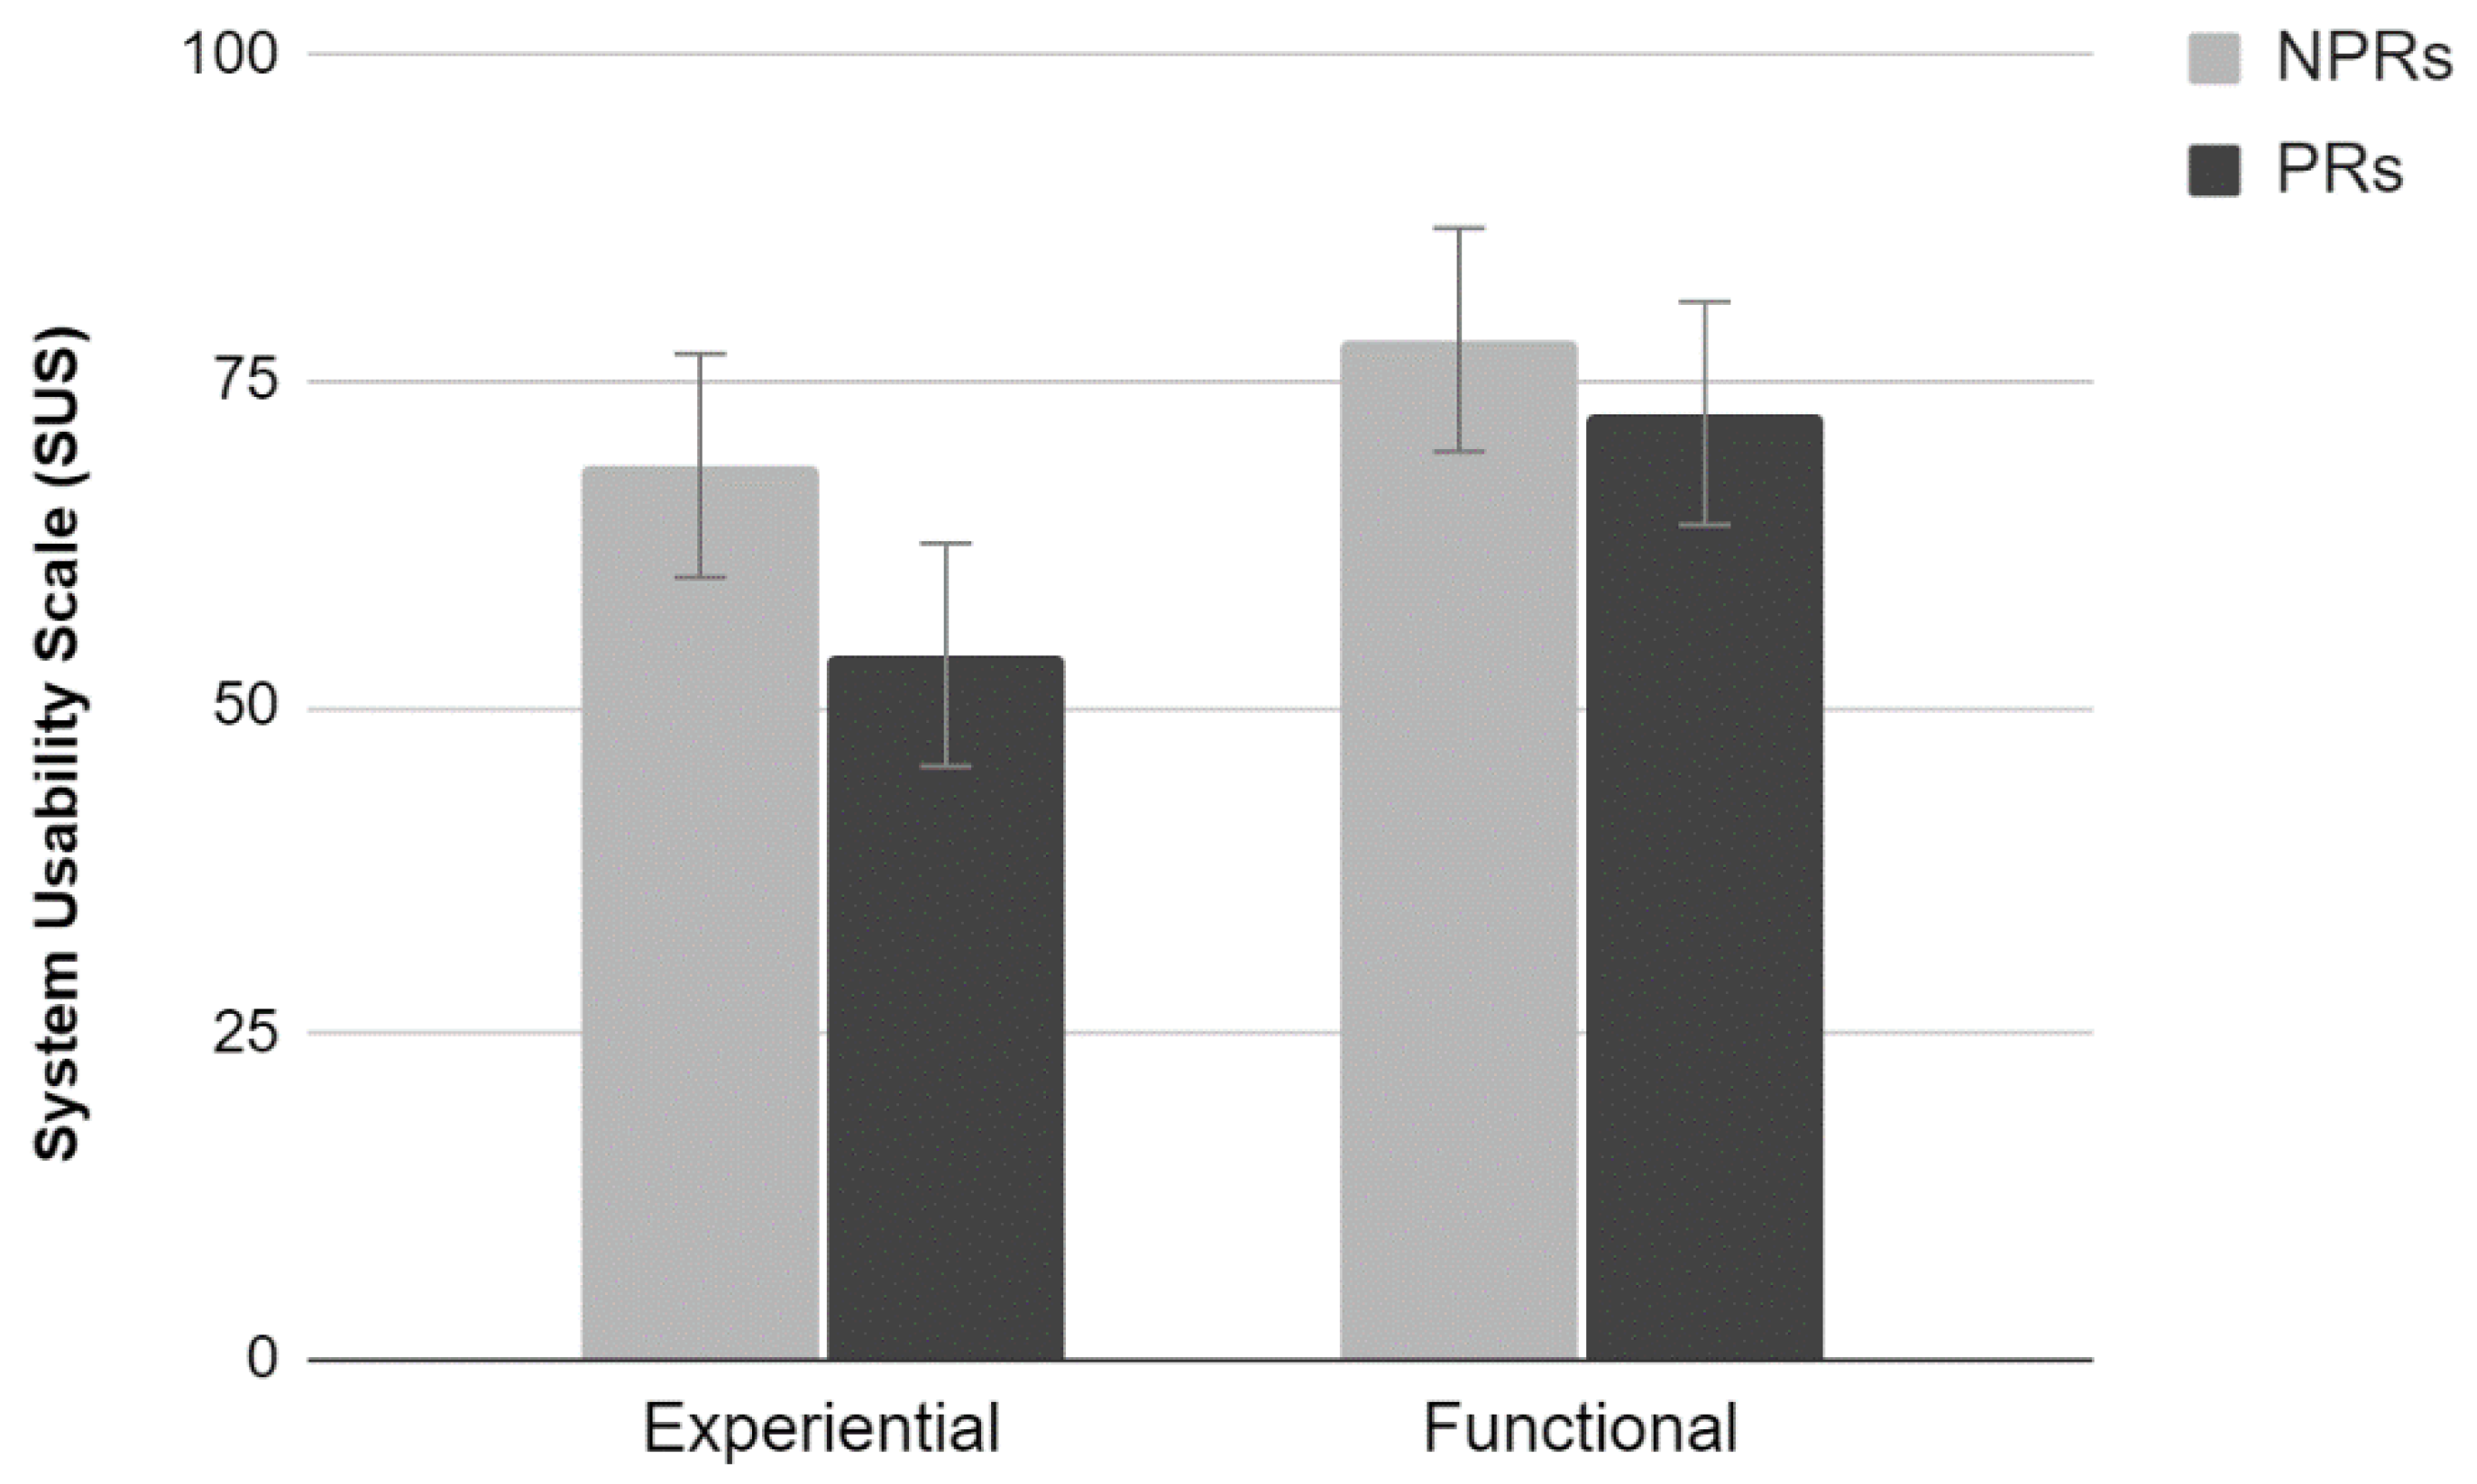
3.3.3. SUS
Results showed a significant main effect of Test (F
1,76 = 10.82,
p < 0.001). Participants who performed the functional test evaluated the site more positively than those who performed the experiential test. A main effect of Experience was also found (F
1,76 = 5.54,
p < 0.05). Regardless of the test performed, PRs provided more negative evaluations than non-professionals. No interaction between the two factors was found (
Figure 9).
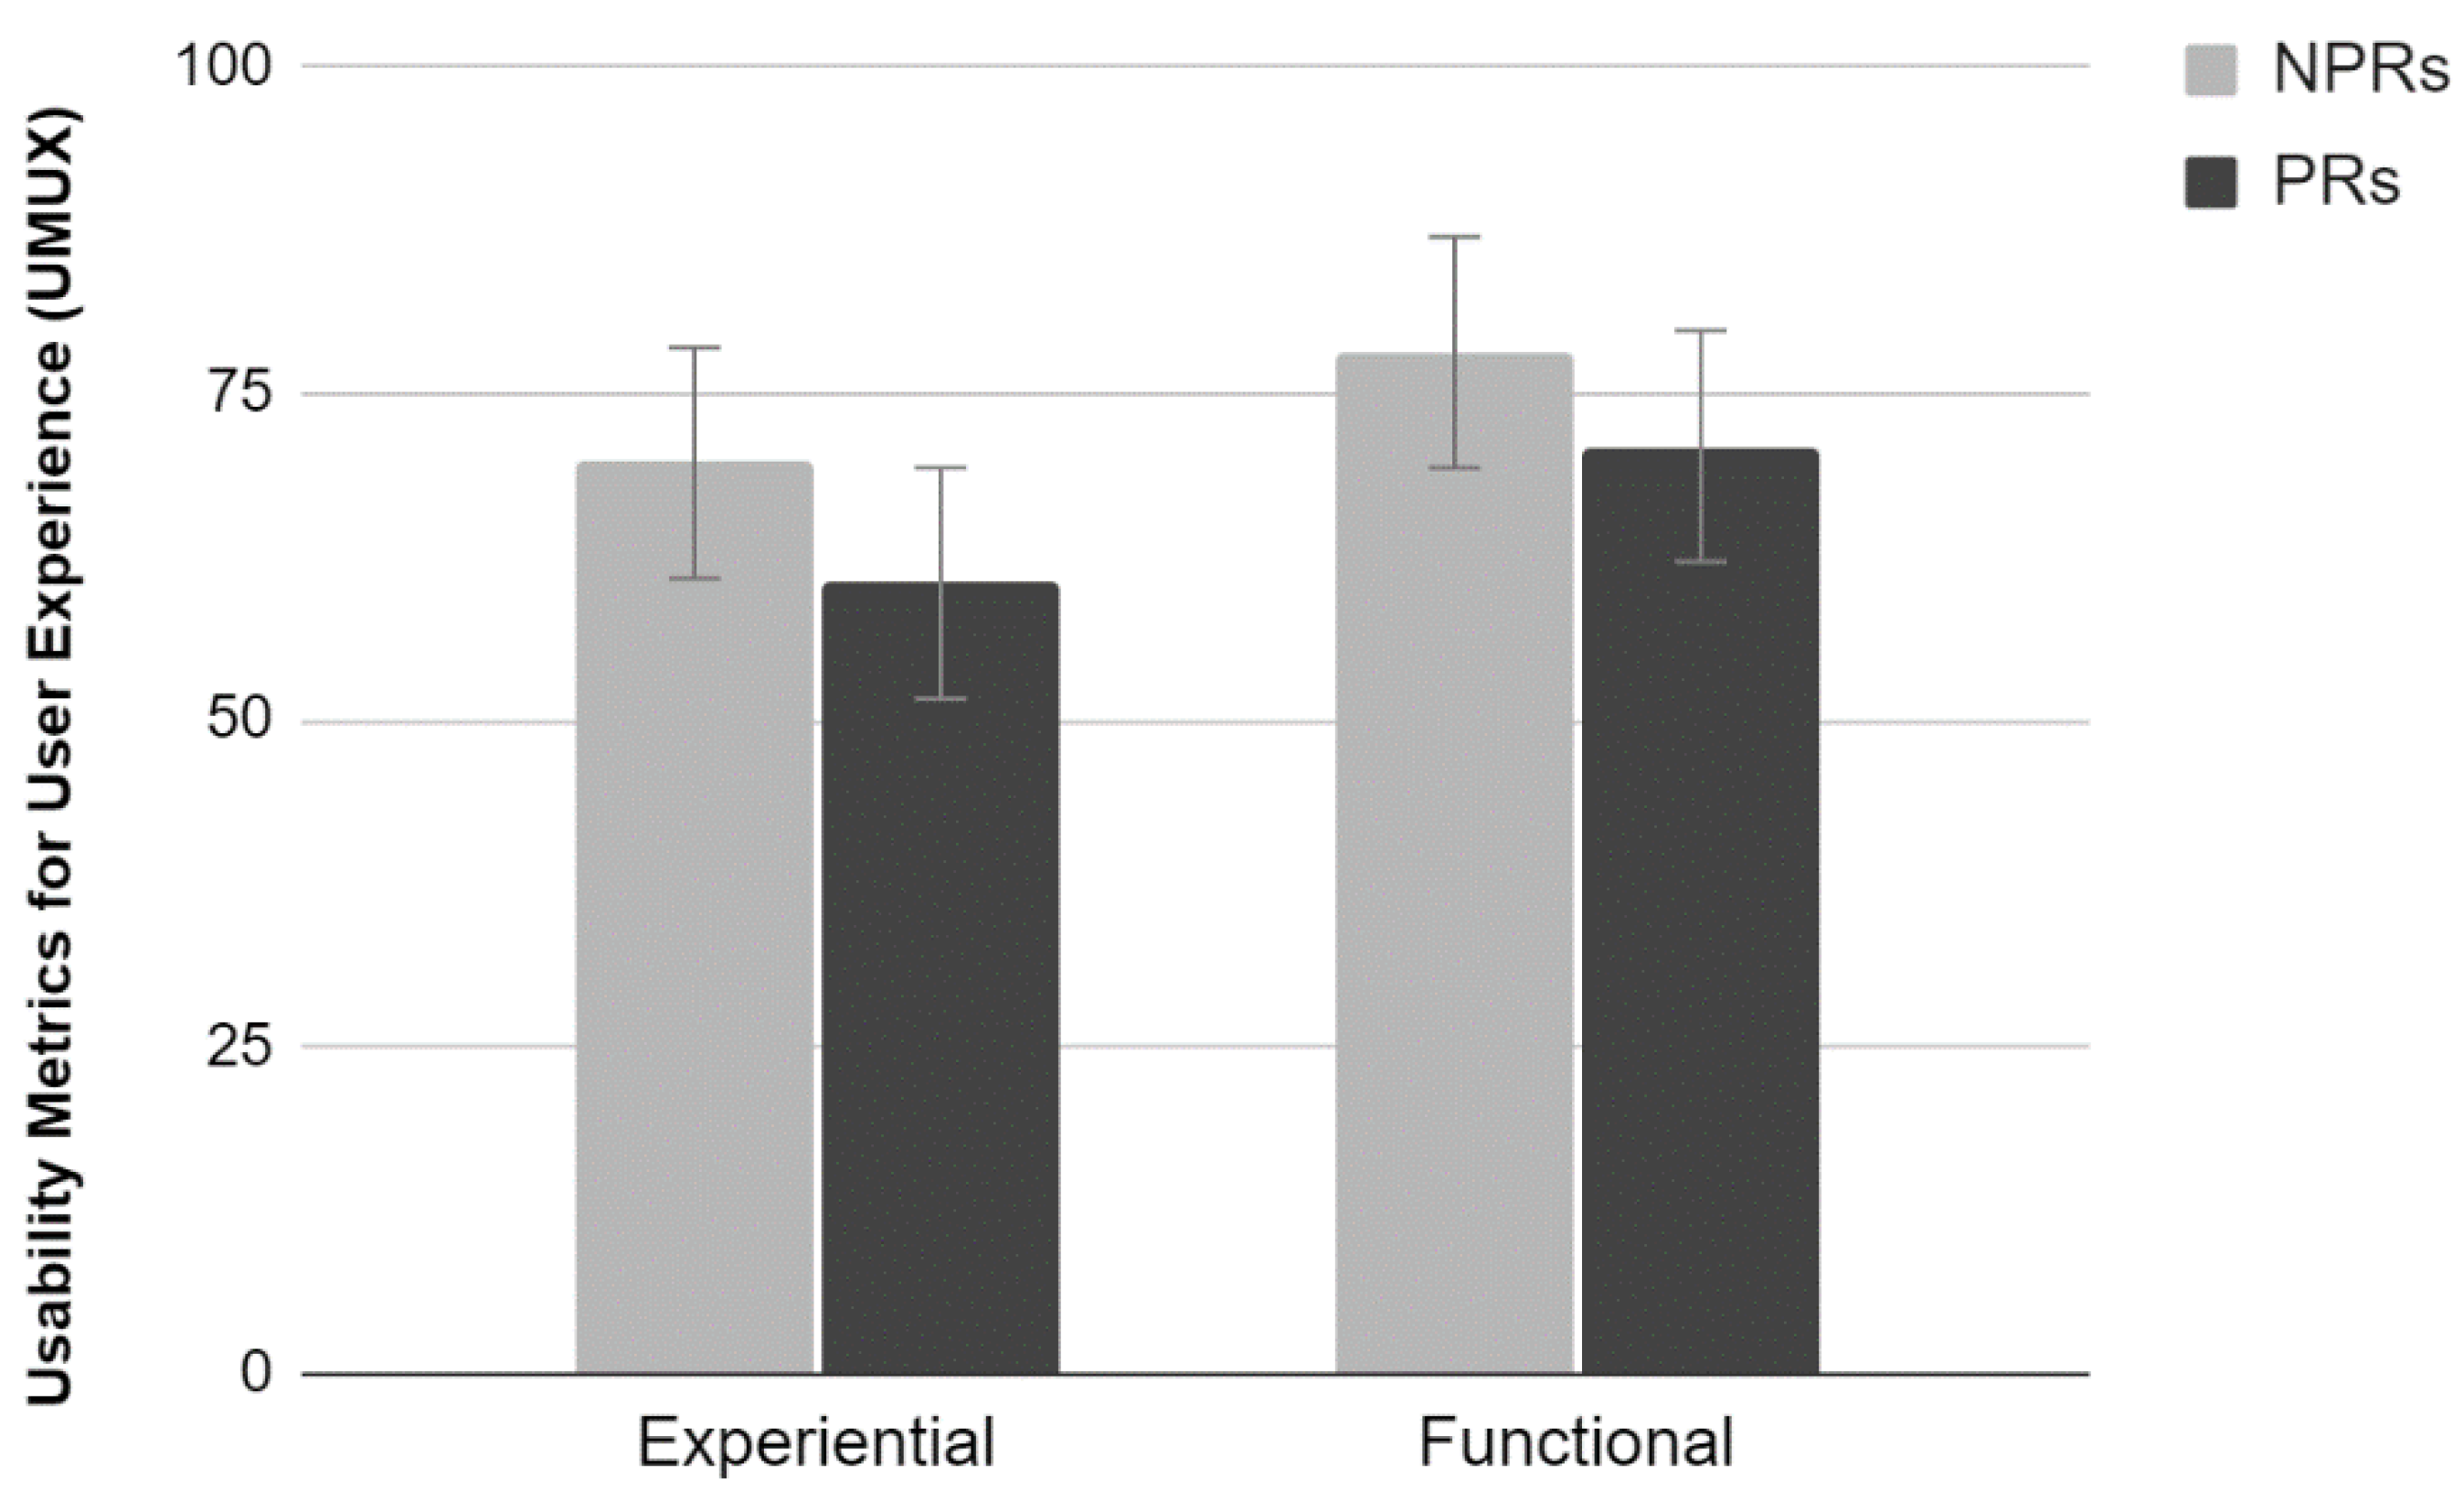
3.3.4. UMUX
Results showed a significant main effect of Test (F
1,76 = 4.61,
p < 0.05). Participants reported more positive evaluations when performing the functional than the experiential test. Experience did not reach statistical significance, but we report a tendency towards statistical significance (F
1,76 = 3.42,
p = 0.07). PRs provided significantly lower ratings than NPRs. No significant interaction between the two factors was found (
Figure 10).
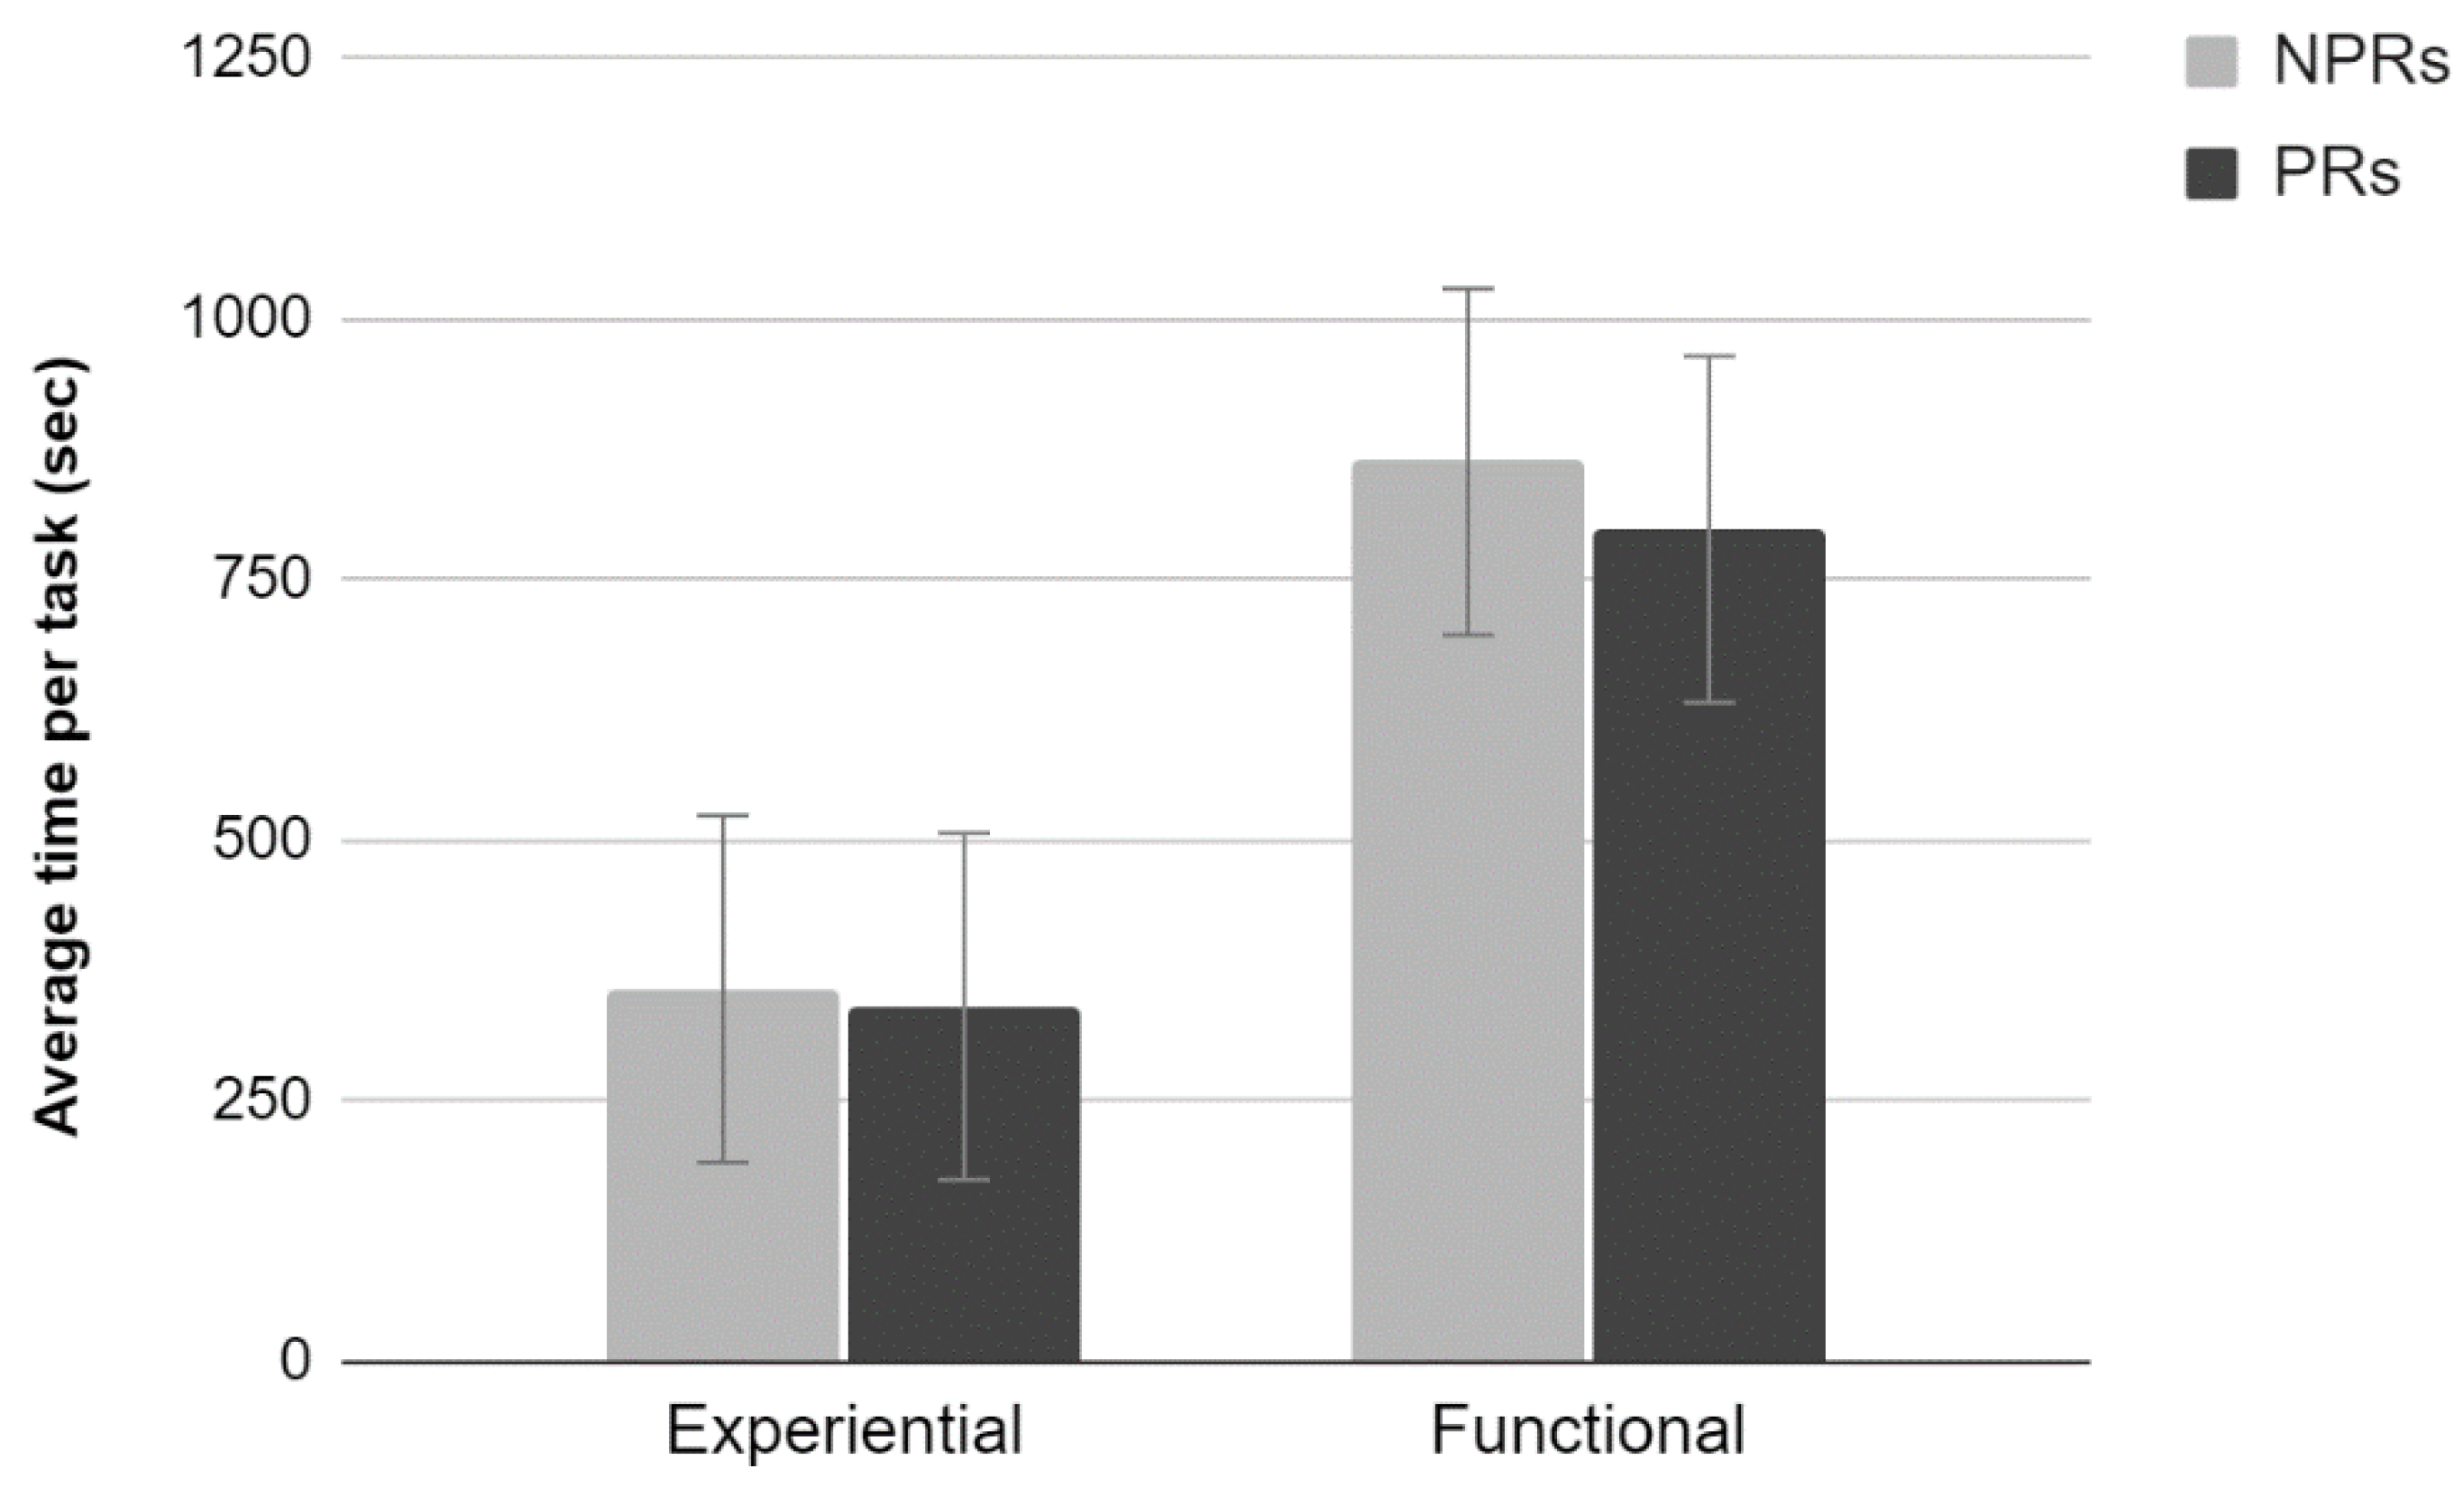
3.3.5. Average Time Per Task
Results showed a significant main effect of Test (F
1,76 = 33.38,
p < 0.001); completing the task took longer when performing the functional test than the experiential test. Neither an effect of Experience nor an interaction between the two factors was found (
Figure 11).
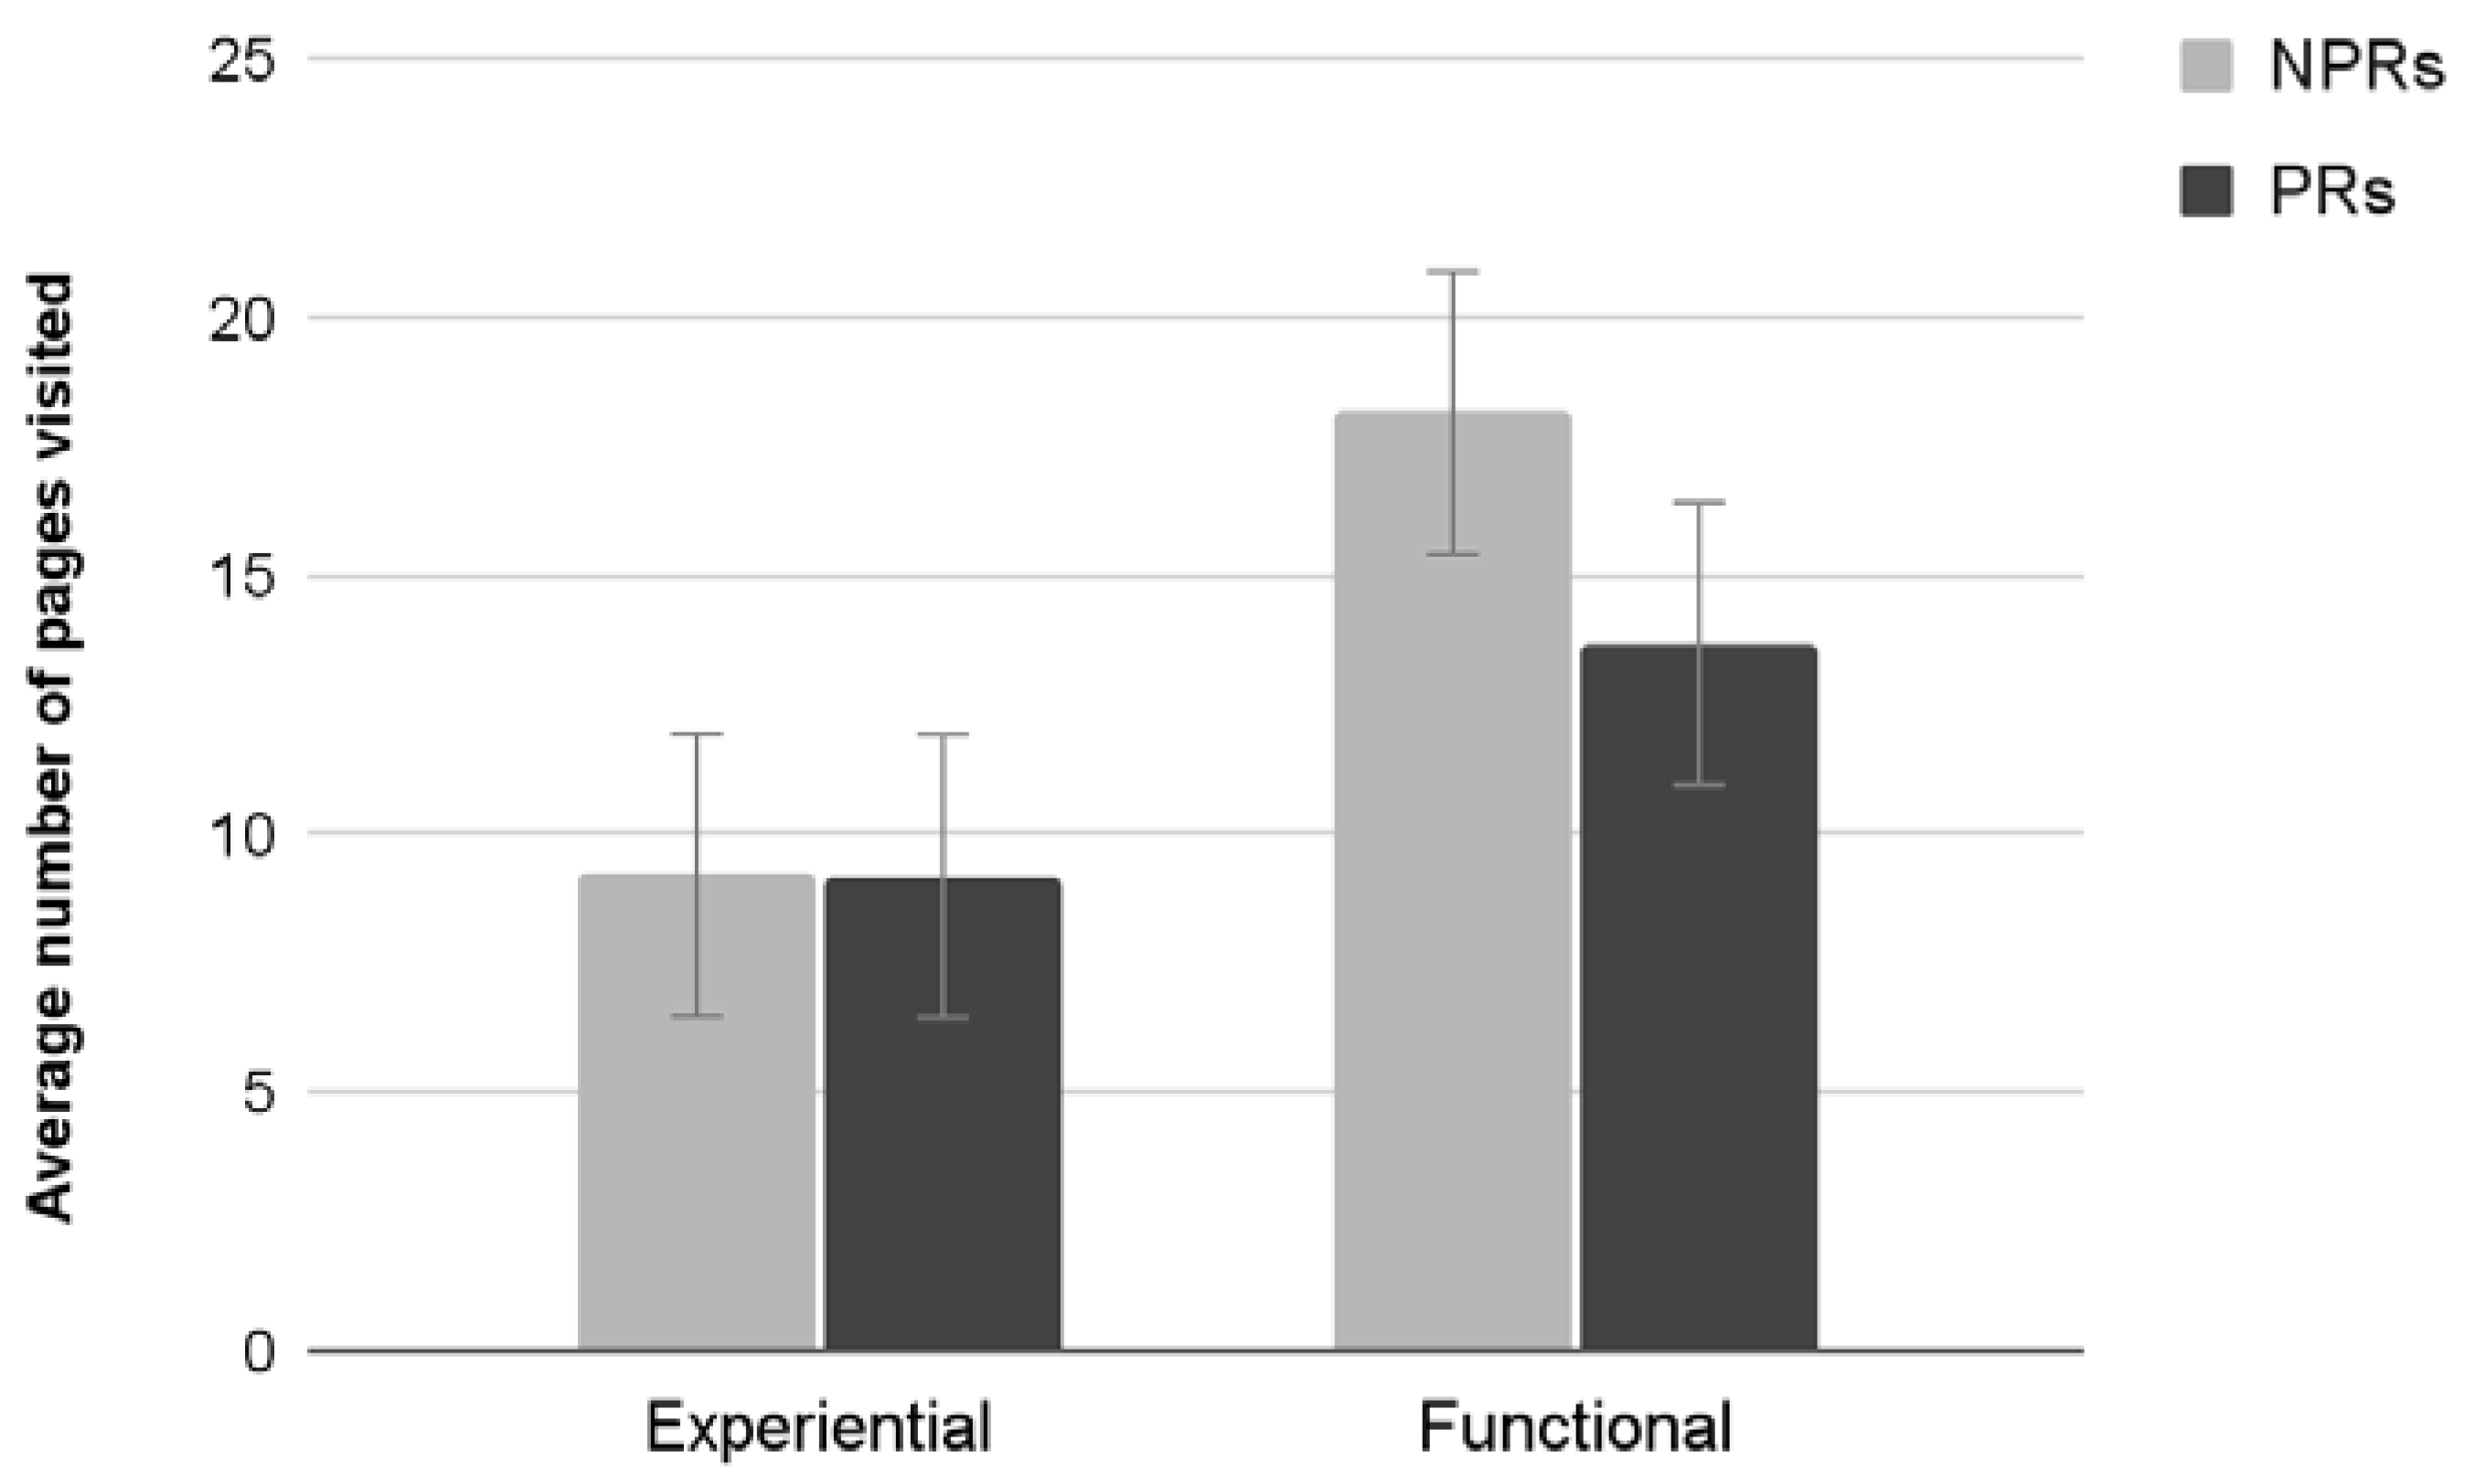
3.3.6. Average Number of Pages Visited
Results showed a significant main effect of Test (F
1,76 = 1994,
p < 0.001). Participants performing a functional test visited significantly more pages. Neither an effect of Experience nor an interaction between the two factors was found (
Figure 12).
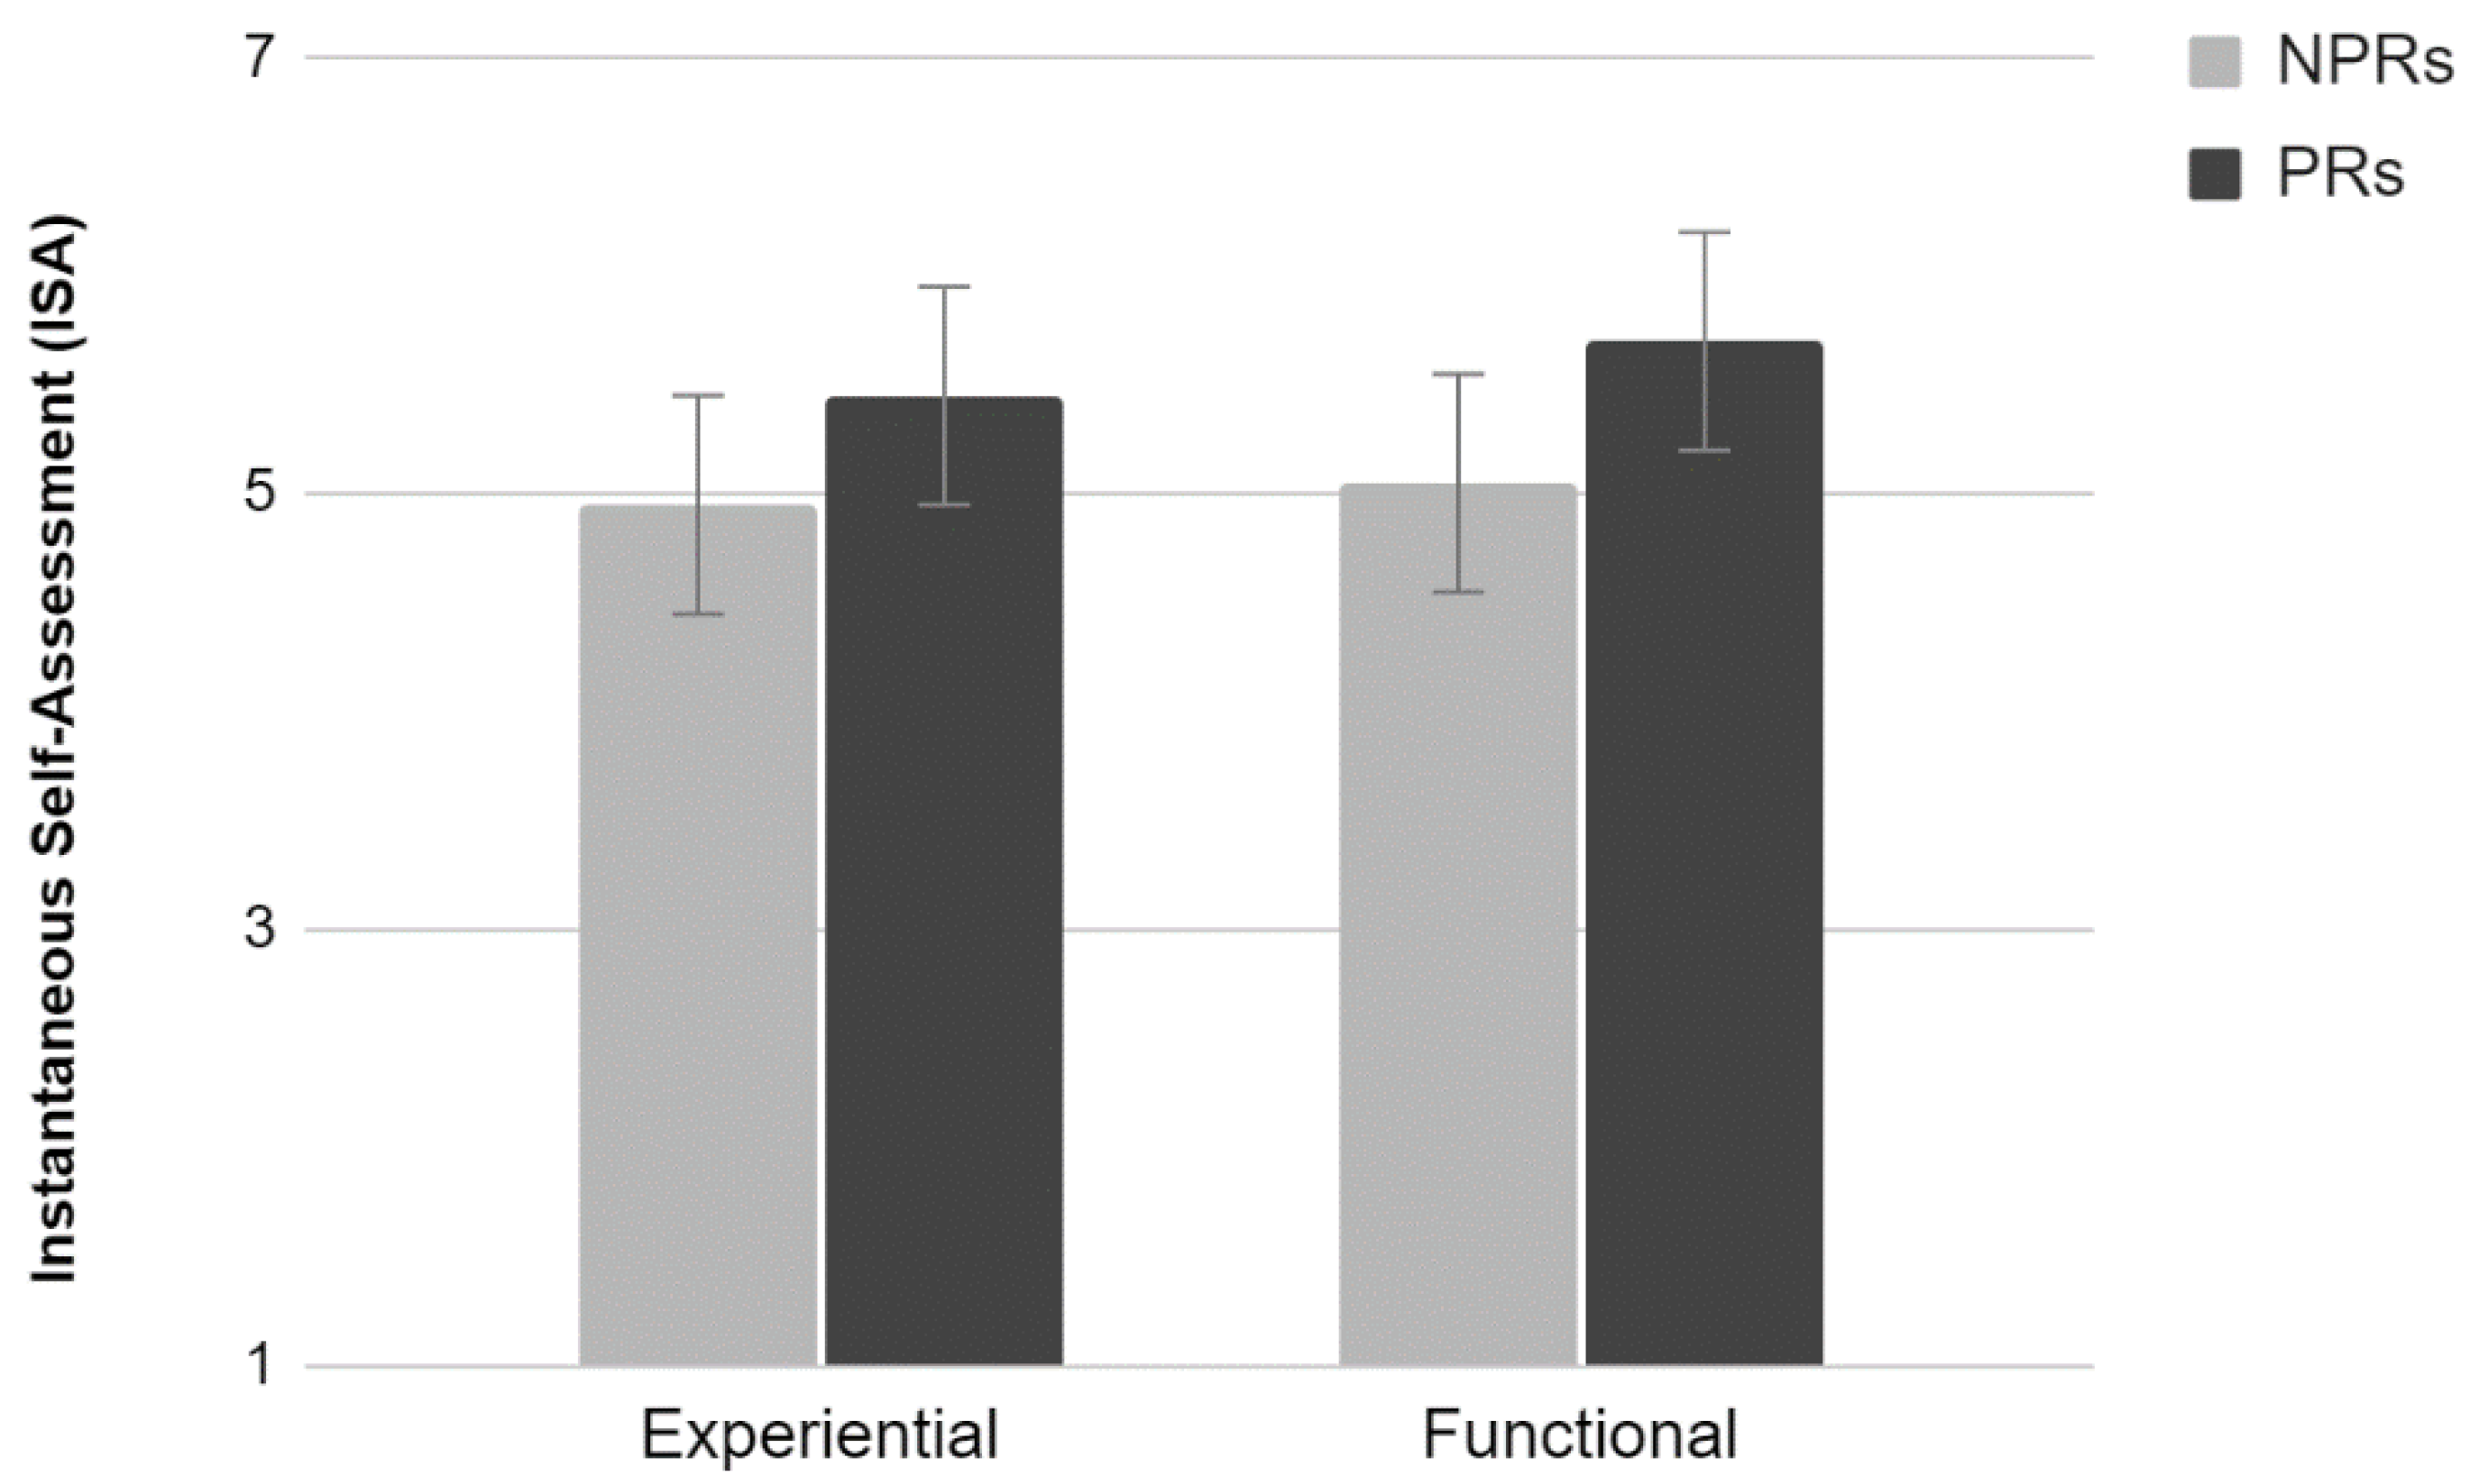
3.3.7. ISA
Results showed a significant main effect of Test (F
1,76 = 5.28,
p < 0.05). Participants evaluated the activity as easier when performing the functional compared to the experiential test. Neither an effect of Experience nor an interaction between the two factors were found (
Figure 13).
3.4. Discussion—Study 2
The results of this study confirm and extend those obtained in the first study. A larger sample allowed to isolate some effects for which a tendency towards statistical significance was previously found. In addition, in this case professional respondents provided more critical usability evaluations than non-professionals. Task completion time and the number of pages visited were homogenous between the two categories of participants and this would confirm that differences in perceived usability can be ascribed to the level of experience. Moreover, participants who carried out a functional test evaluated the site more positively (both in terms of usability and promotion), despite their level of experience. It is important to note that the functional test takes significantly longer to complete, and more pages are visited. This may have increased the level of familiarization with the site and consequently may be the factor that most influenced the usability ratings. Another important element is the absence of goals to achieve while browsing the site other than finding bugs. Therefore, the usability of the system becomes assessed independently of a clear interaction aim. Among all these consistent results, the only significant interaction effect was found for the Attractiveness of the website, which is differently rated by PRs according to the type of test in which they were involved. This result is quite puzzling, and it is difficult to come up with a sound explanation.
4. Study 3
Studies 1 and 2 involved individuals belonging to online panels as participants. Although non-professional respondents are not involved in the bug-finding process, they are apt to assess websites and apps (after all, they have requested to enter the OP). Consequently, we decided to examine whether such an attitude may have played a role in determining the usability ratings. In this third study, we recruited a group of Non-Crowd Respondents (NCRs), who were not belonging to any online panel and with no previous experience in usability evaluation, and compared their performance and ratings to that of the PRs and NPRs who carried out the experiential test in Study 2.
4.1. Participants
Twenty individuals were initially recruited based on a survey run on social networks. They had no previous experience with website testing and were specifically recruited for participating in an experimental study (with no other specification). Two participants did not complete the tasks and were consequently removed from the sample. The data of the remaining 18 NCRs (mean age = 35; st. dev. = 12.6; 6 females) were compared to those collected from 20 PRs and 20 NPRs who participated in Study 2. Also in this case, all participants were Italian.
4.2. Procedure
The same experiential test consisting of 3 tasks used in Studies 1 and 2 was used here. Measures were the same as in Study 2, including those related to the navigation strategy (page visited and completion time).
4.3. Data Analysis and Results
NPS, SUS, UMUX, ISA scores, number of visited pages, and completion time were used as dependent variables in a univariate ANOVA design using Group (PRs vs. NPRs vs. NCRs) as factors. The three subscales of Us.E. 2.0 were used as dependent variables in a MANOVA design using Group (PRs vs. NPRs vs. NCRs) as factors. The following subsection will describe the results obtained for each measure.
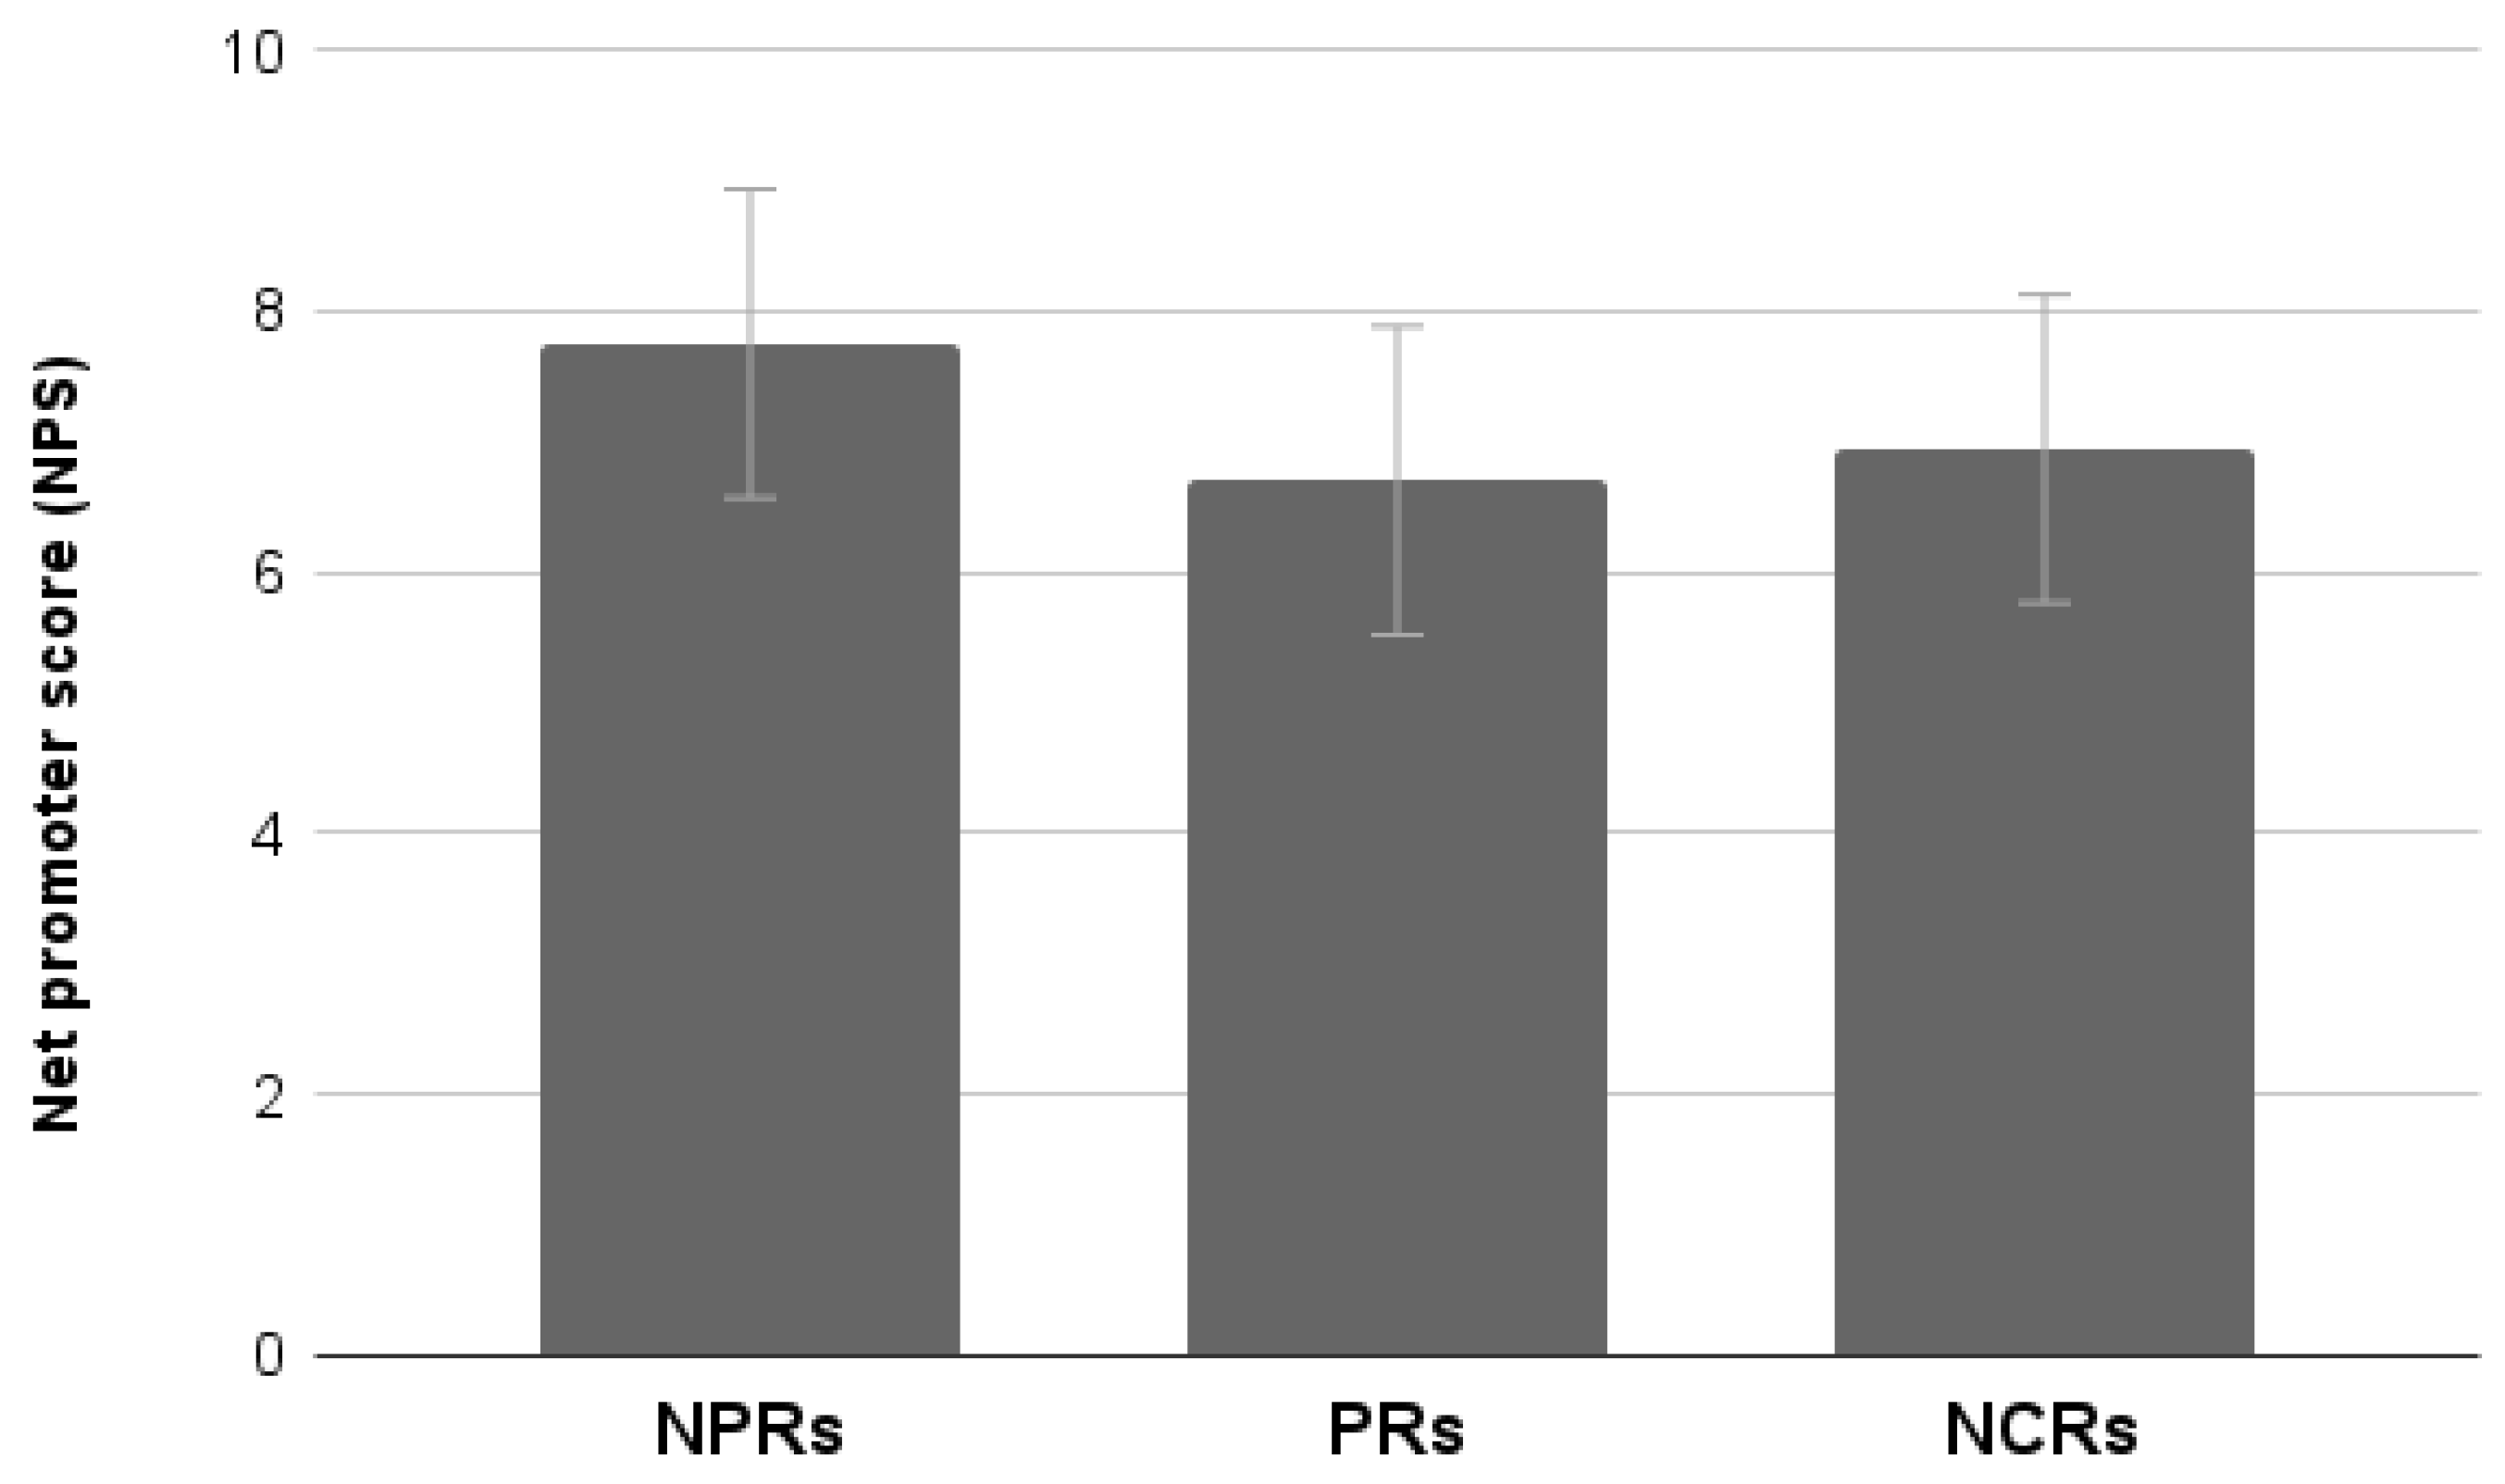
4.3.1. NPS
Results showed no significant differences between groups (
Figure 14).
4.3.2. Us.E. 2.0
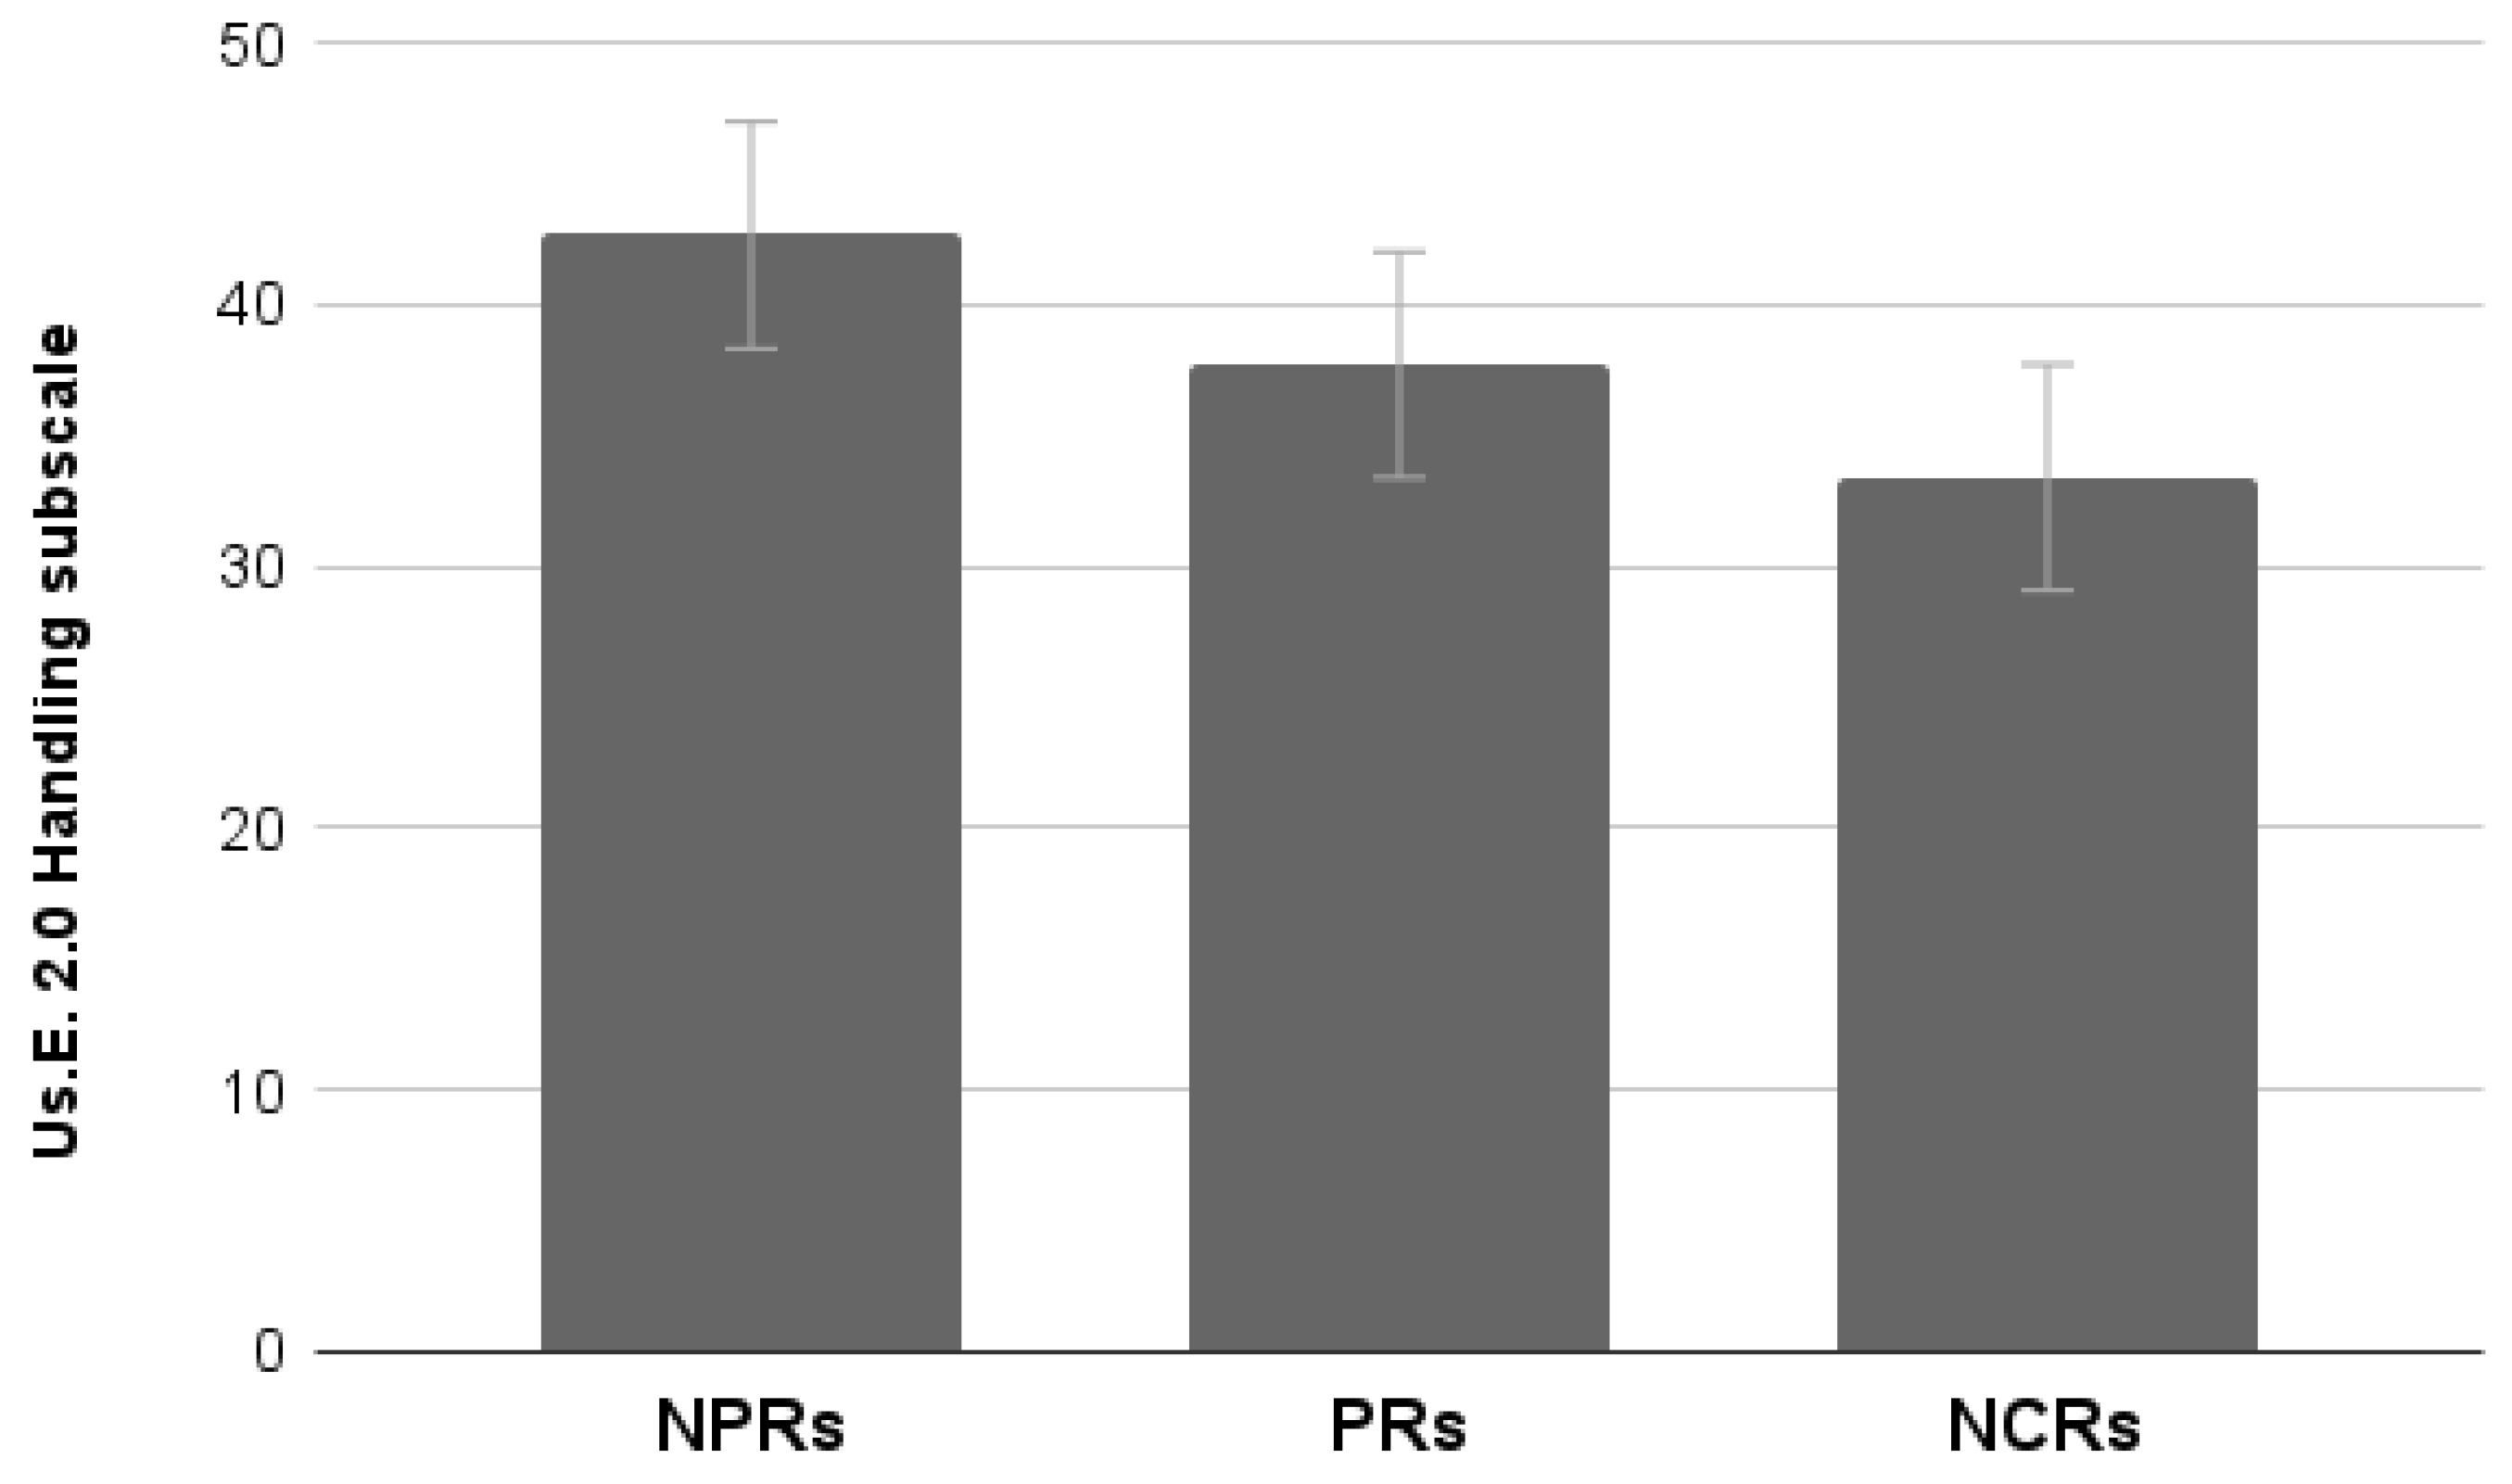
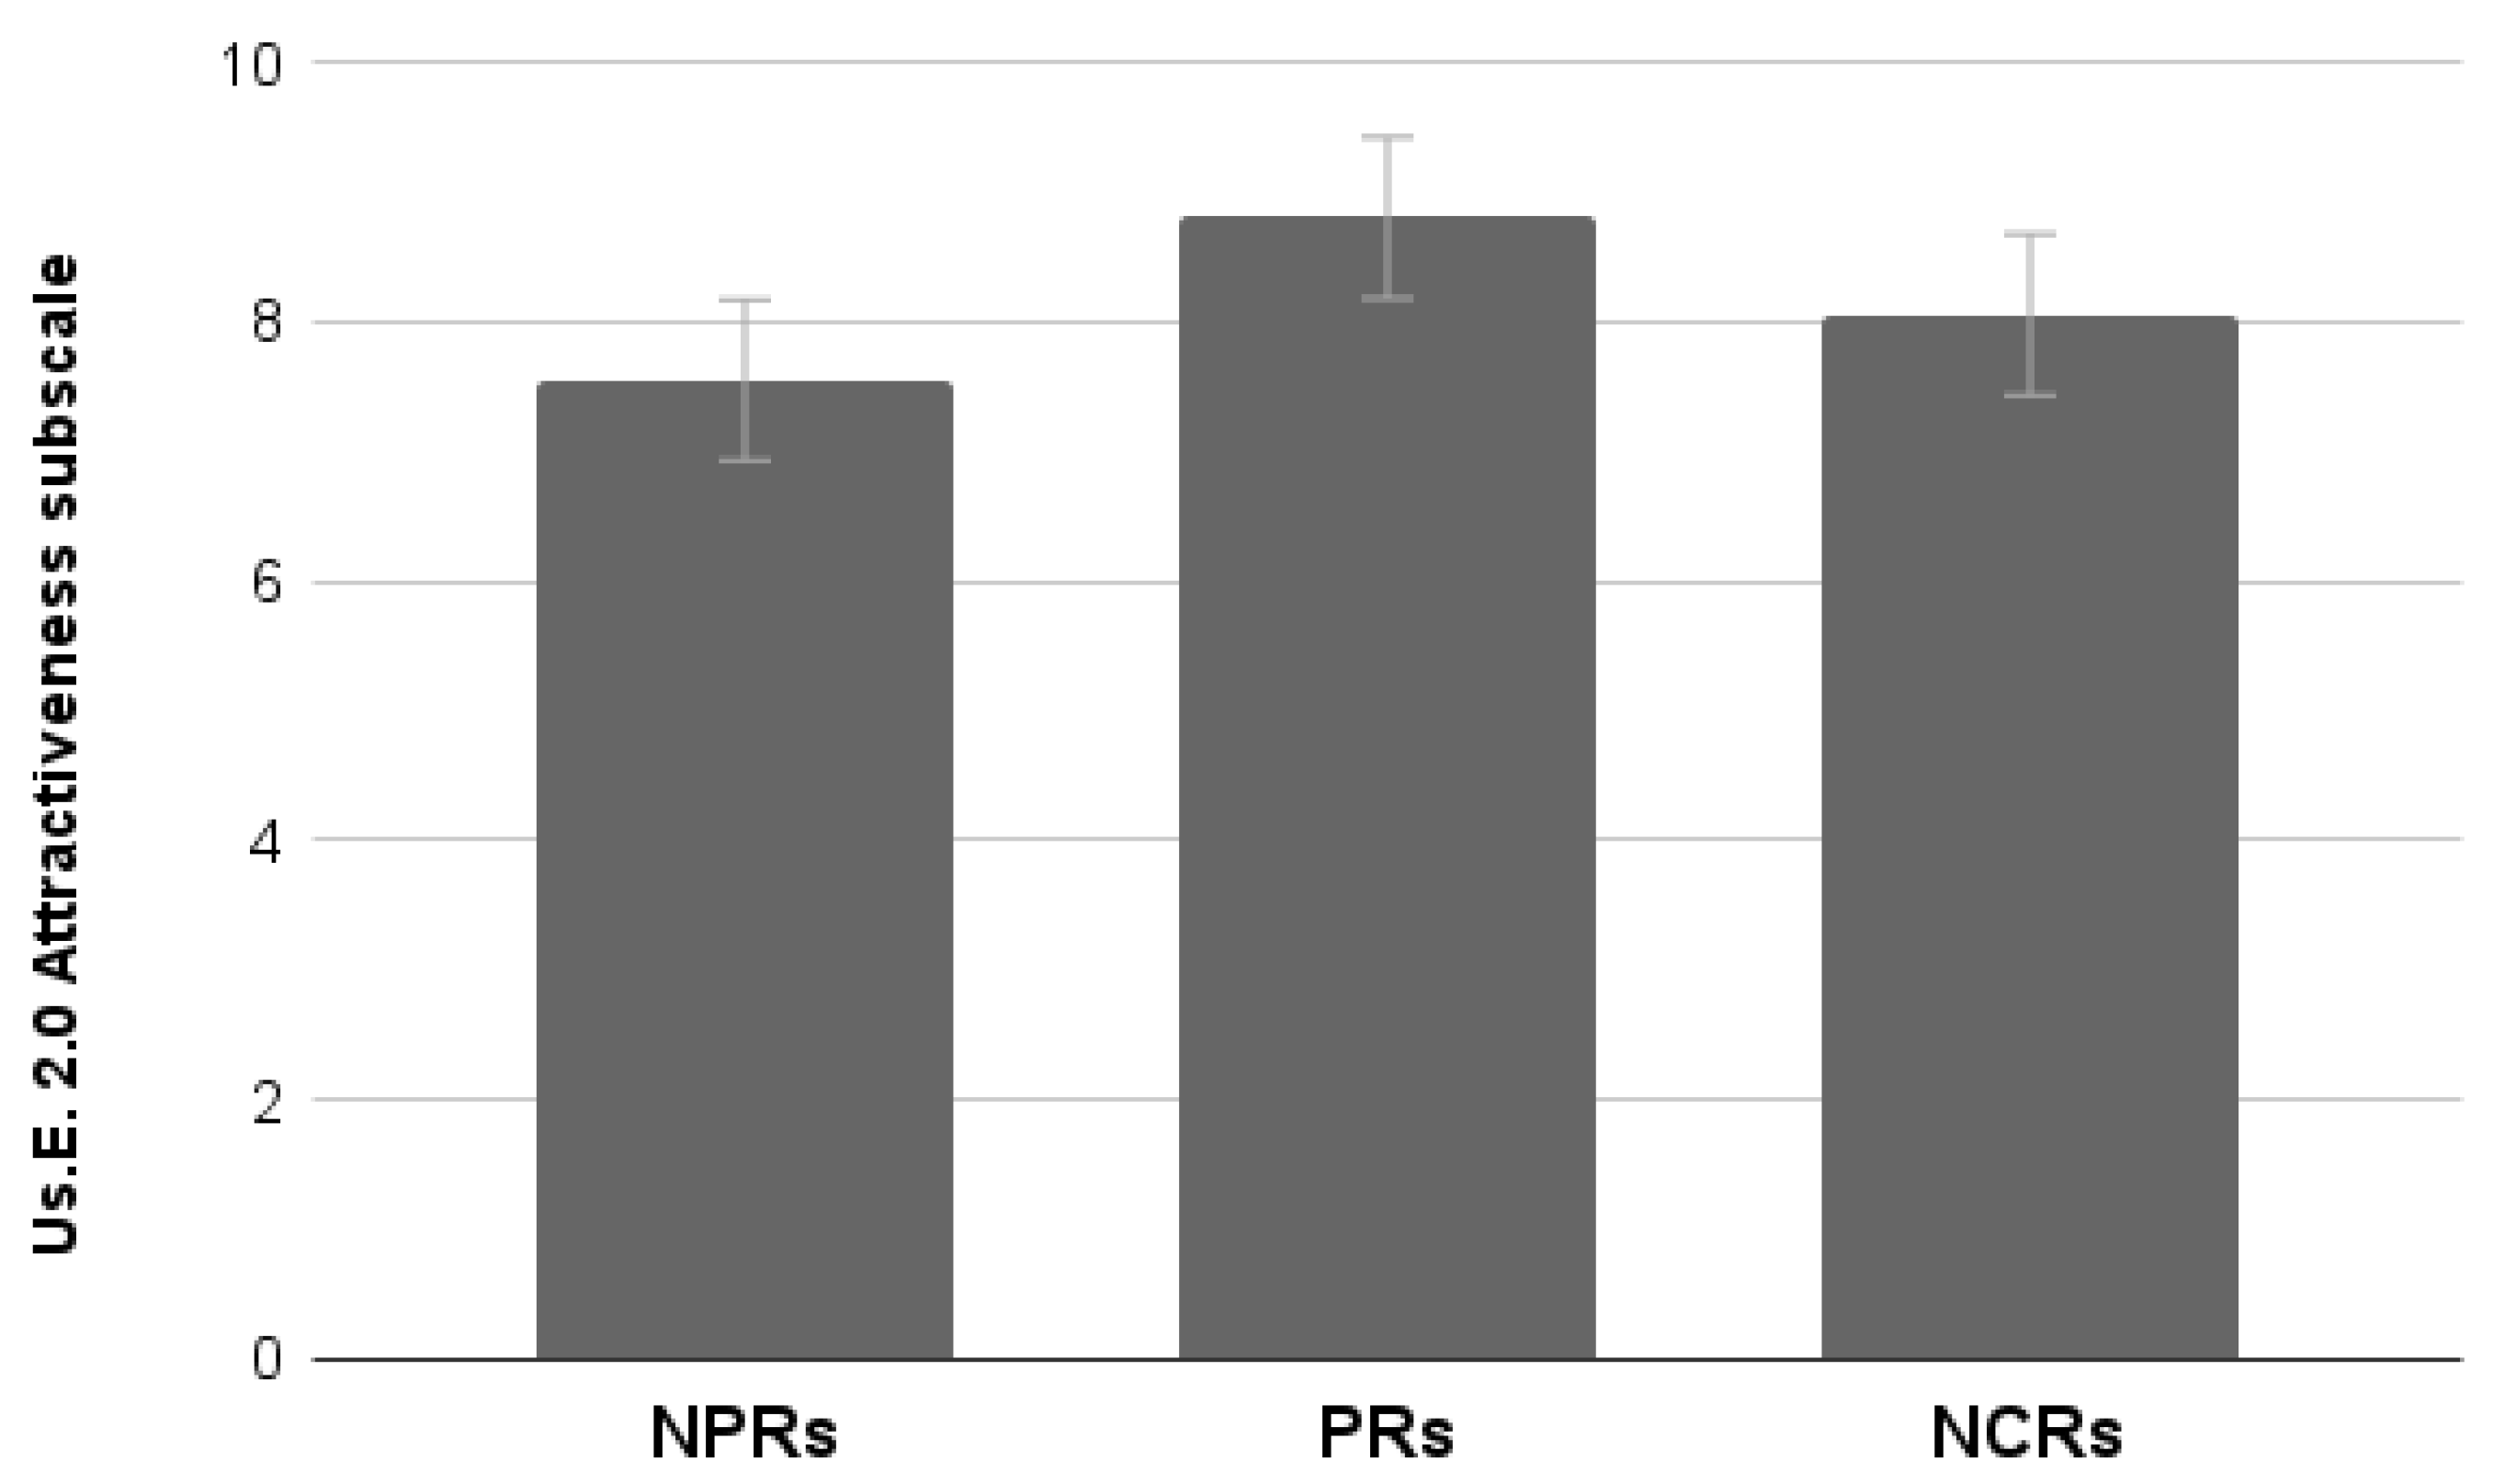
Results showed a significant effect of Group (Wilks lambda = 0.65, F6,106 = 4.24, p < 0.001). Univariate analysis run on each subscale showed a significant effect for the Handling scale (F2,55 = 4.37, p < 0.05), no effect for the Satisfaction scale (p > 0.05), and a significant effect for the Attractiveness scale (F2,55 = 3.98, p < 0.05).
Post hoc Duncan testing showed that:
Handling scores provided by NCRs are significantly lower (
p < 0.05) than those provided by NPRs but not different from those provided by PRs (
Figure 15);
Attractiveness scores provided by NCRs are neither different from those of the NPRs nor from those of the PRs. As demonstrated in Study 2 (participants are the same), Attractiveness scores provided by PRs are significantly higher than those provided by NPRs (
p < 0.05) (
Figure 16).
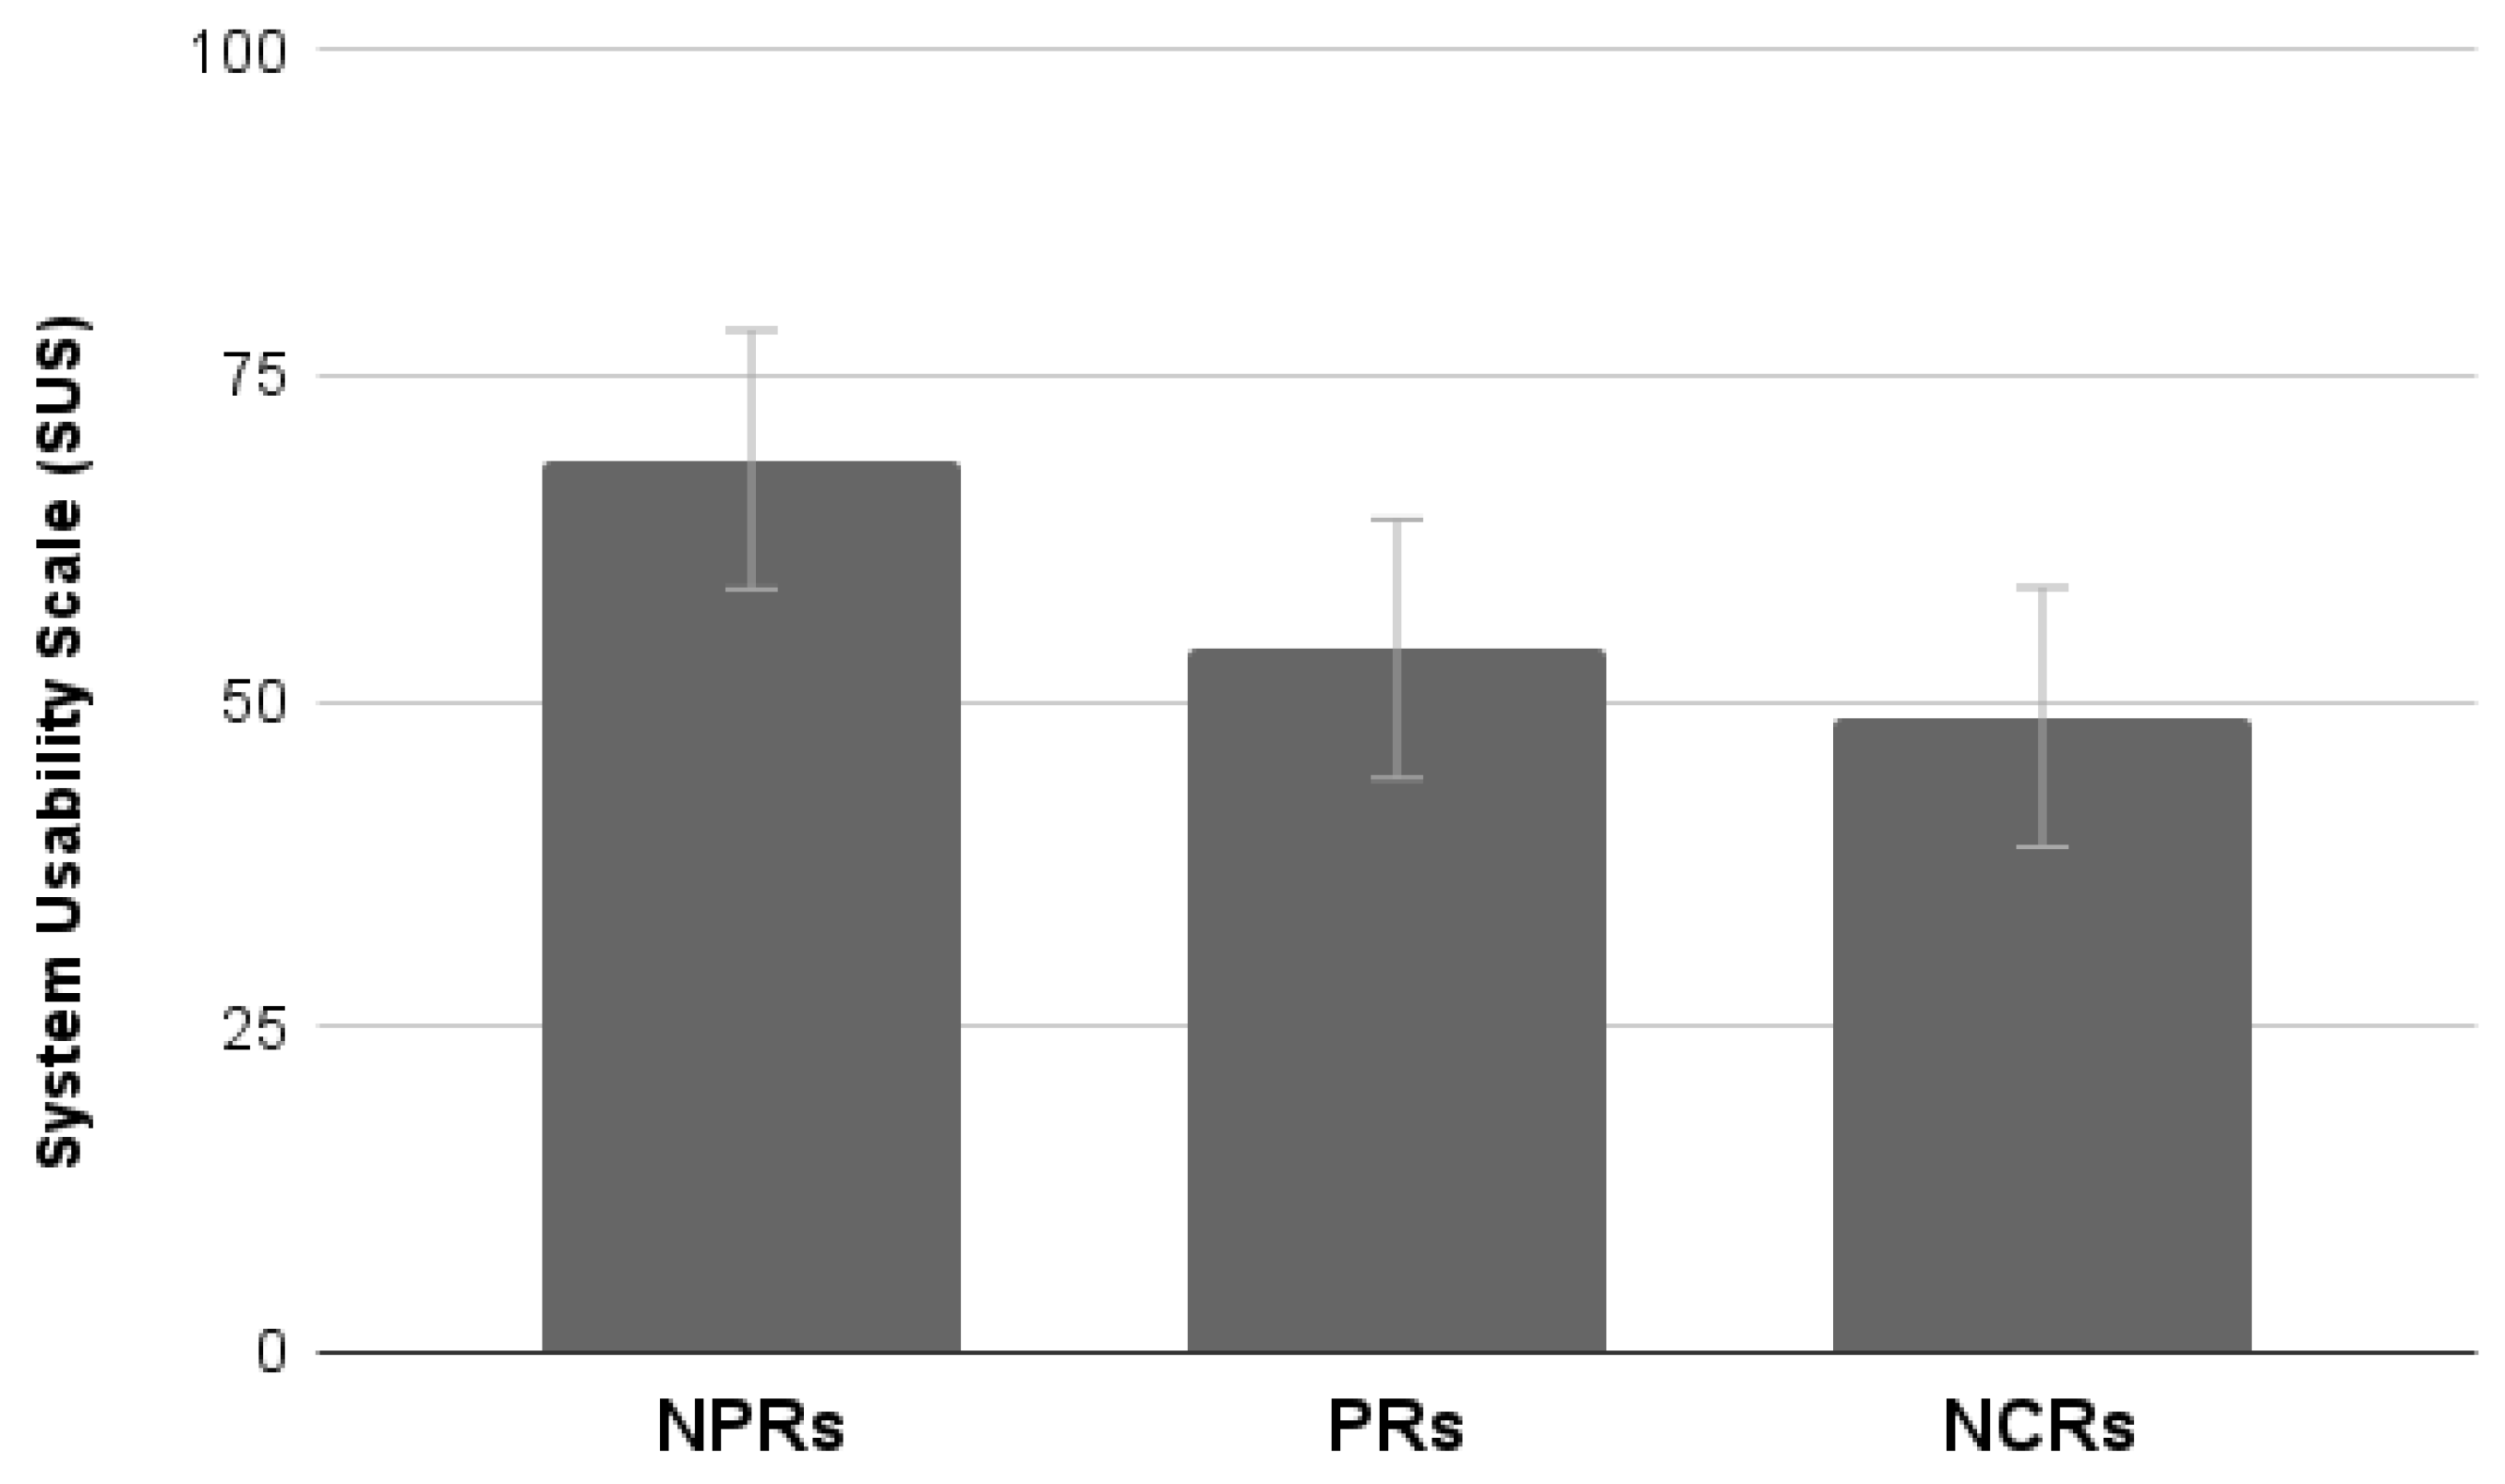
4.3.3. SUS
Results showed a significant effect of Group (F
2,55 = 4.09,
p < 0.05). Post hoc Duncan testing showed that NPRs provide higher usability ratings than PRs and NCRs (
Figure 17).
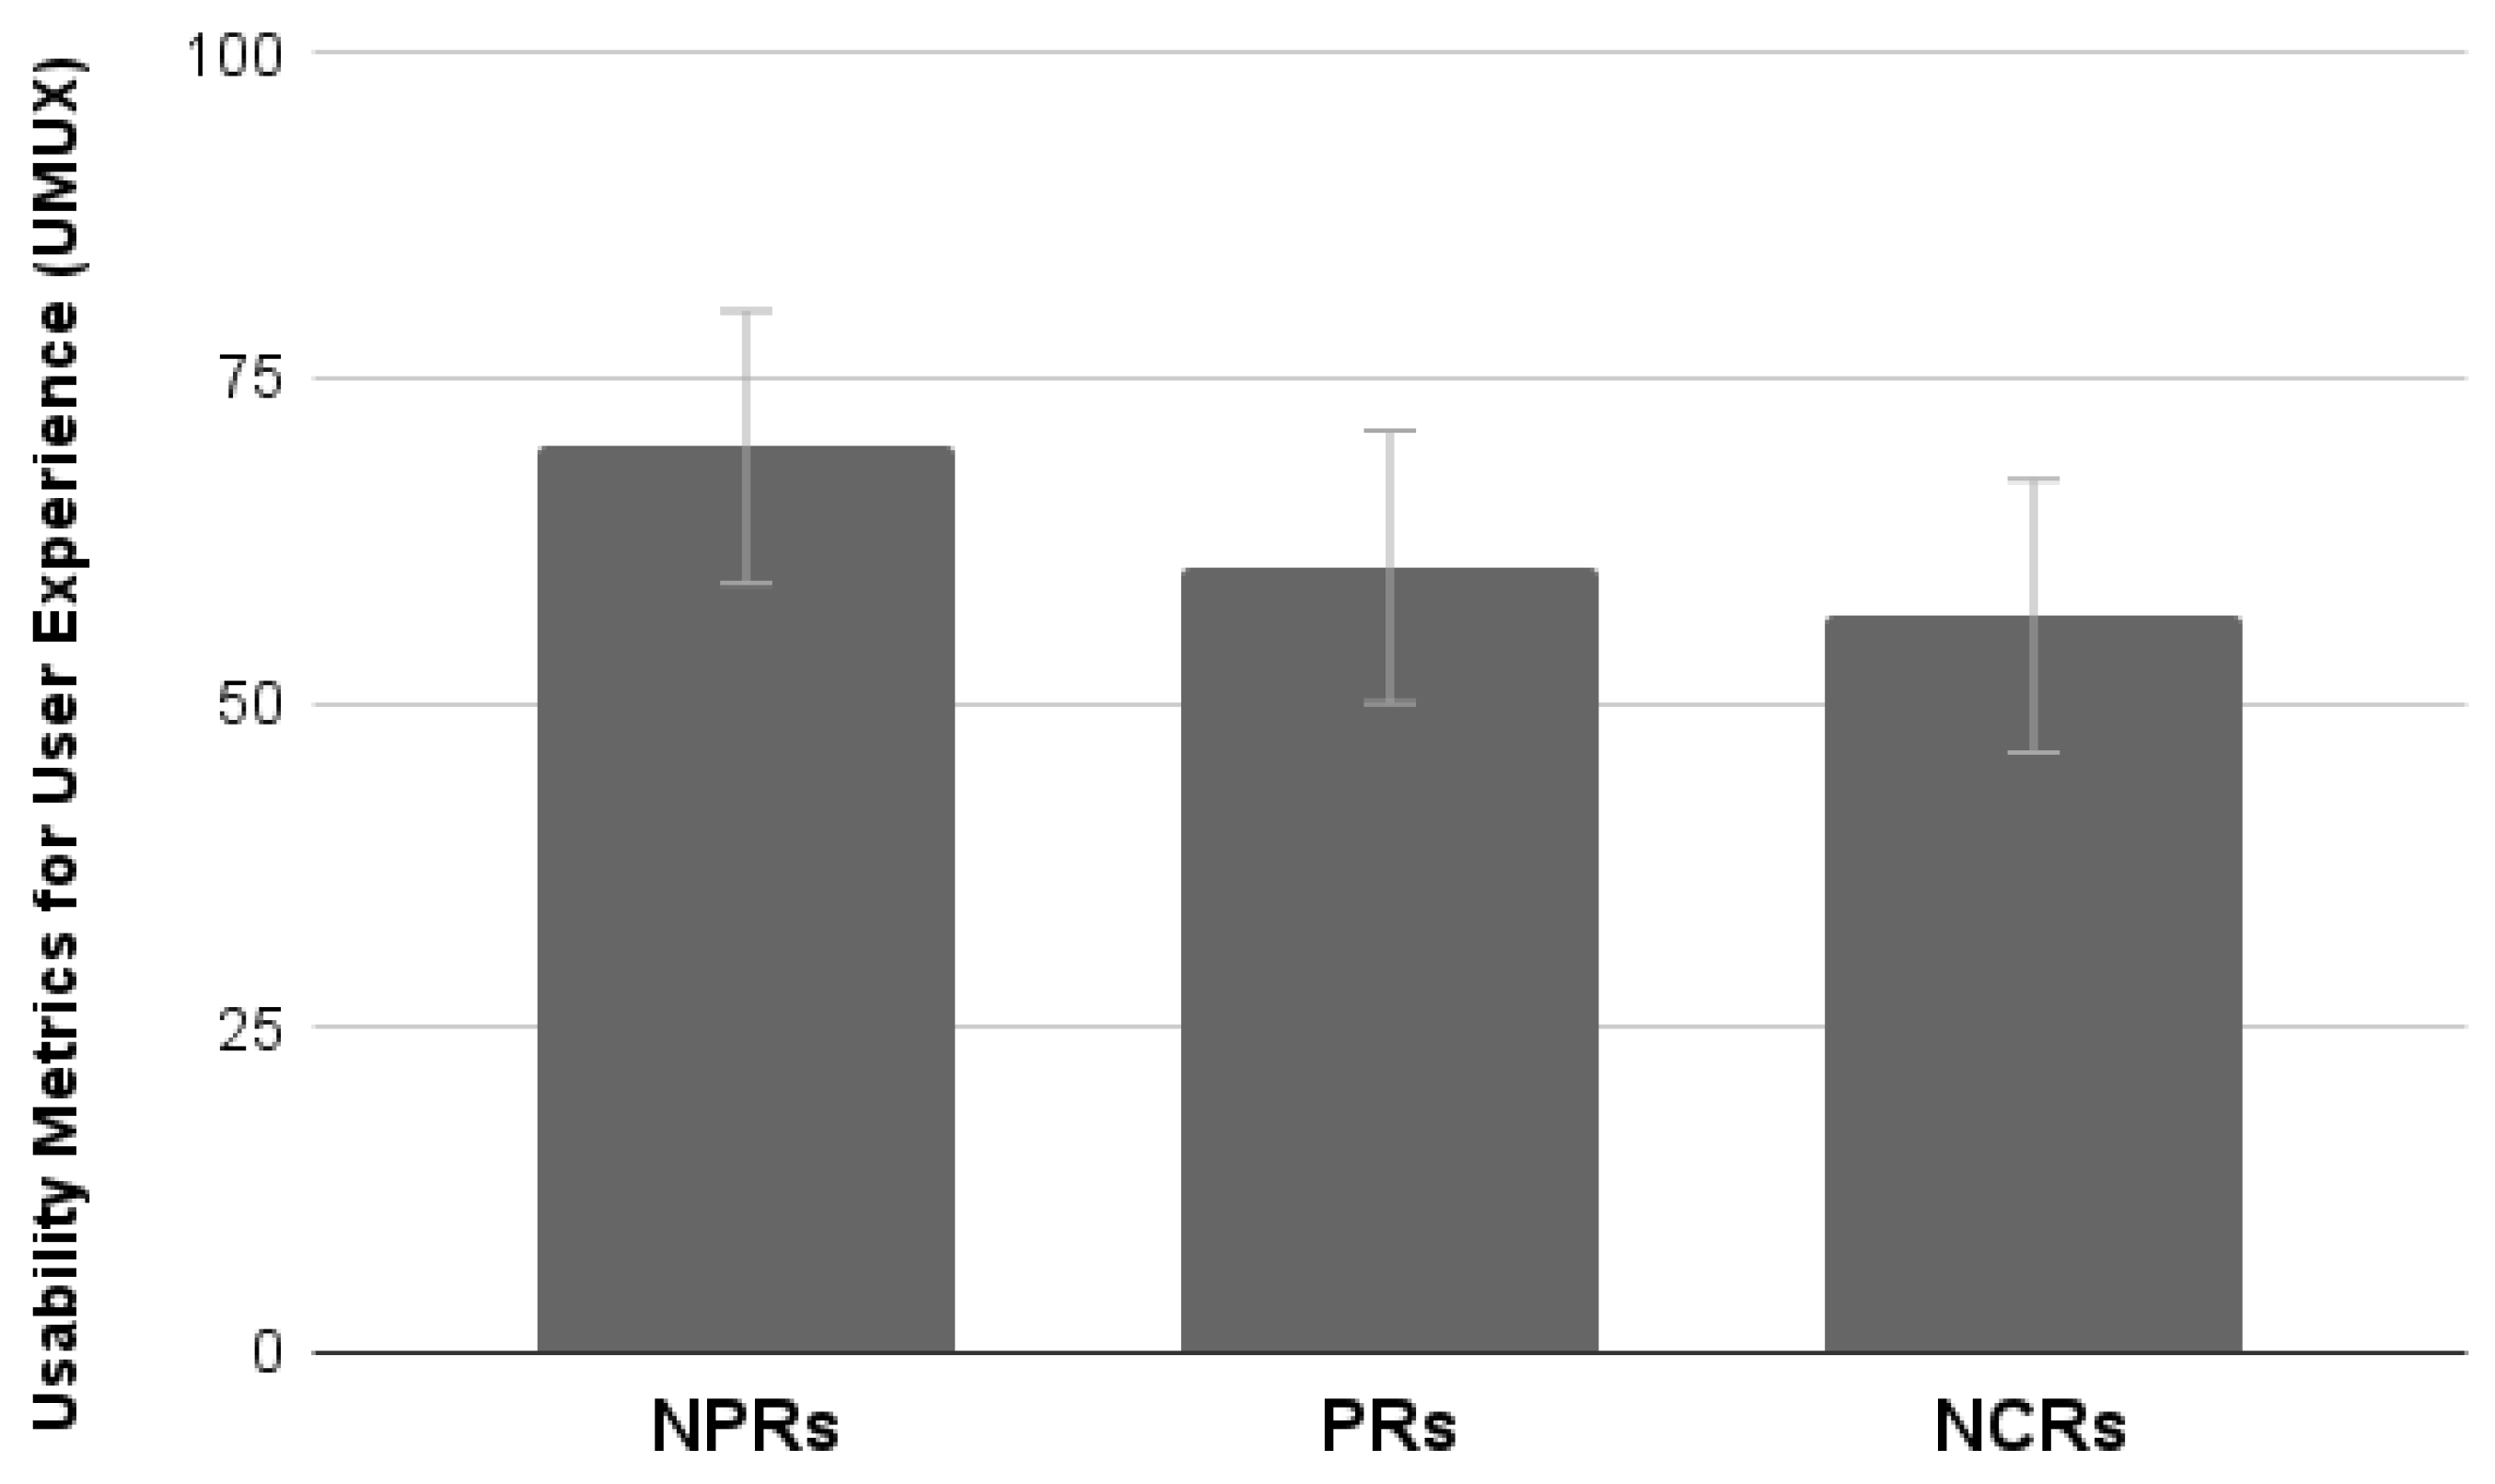
4.3.4. UMUX
The analysis of the mean scores provided by the UMUX scale showed no significant differences between groups (
p > 0.05) (
Figure 18).
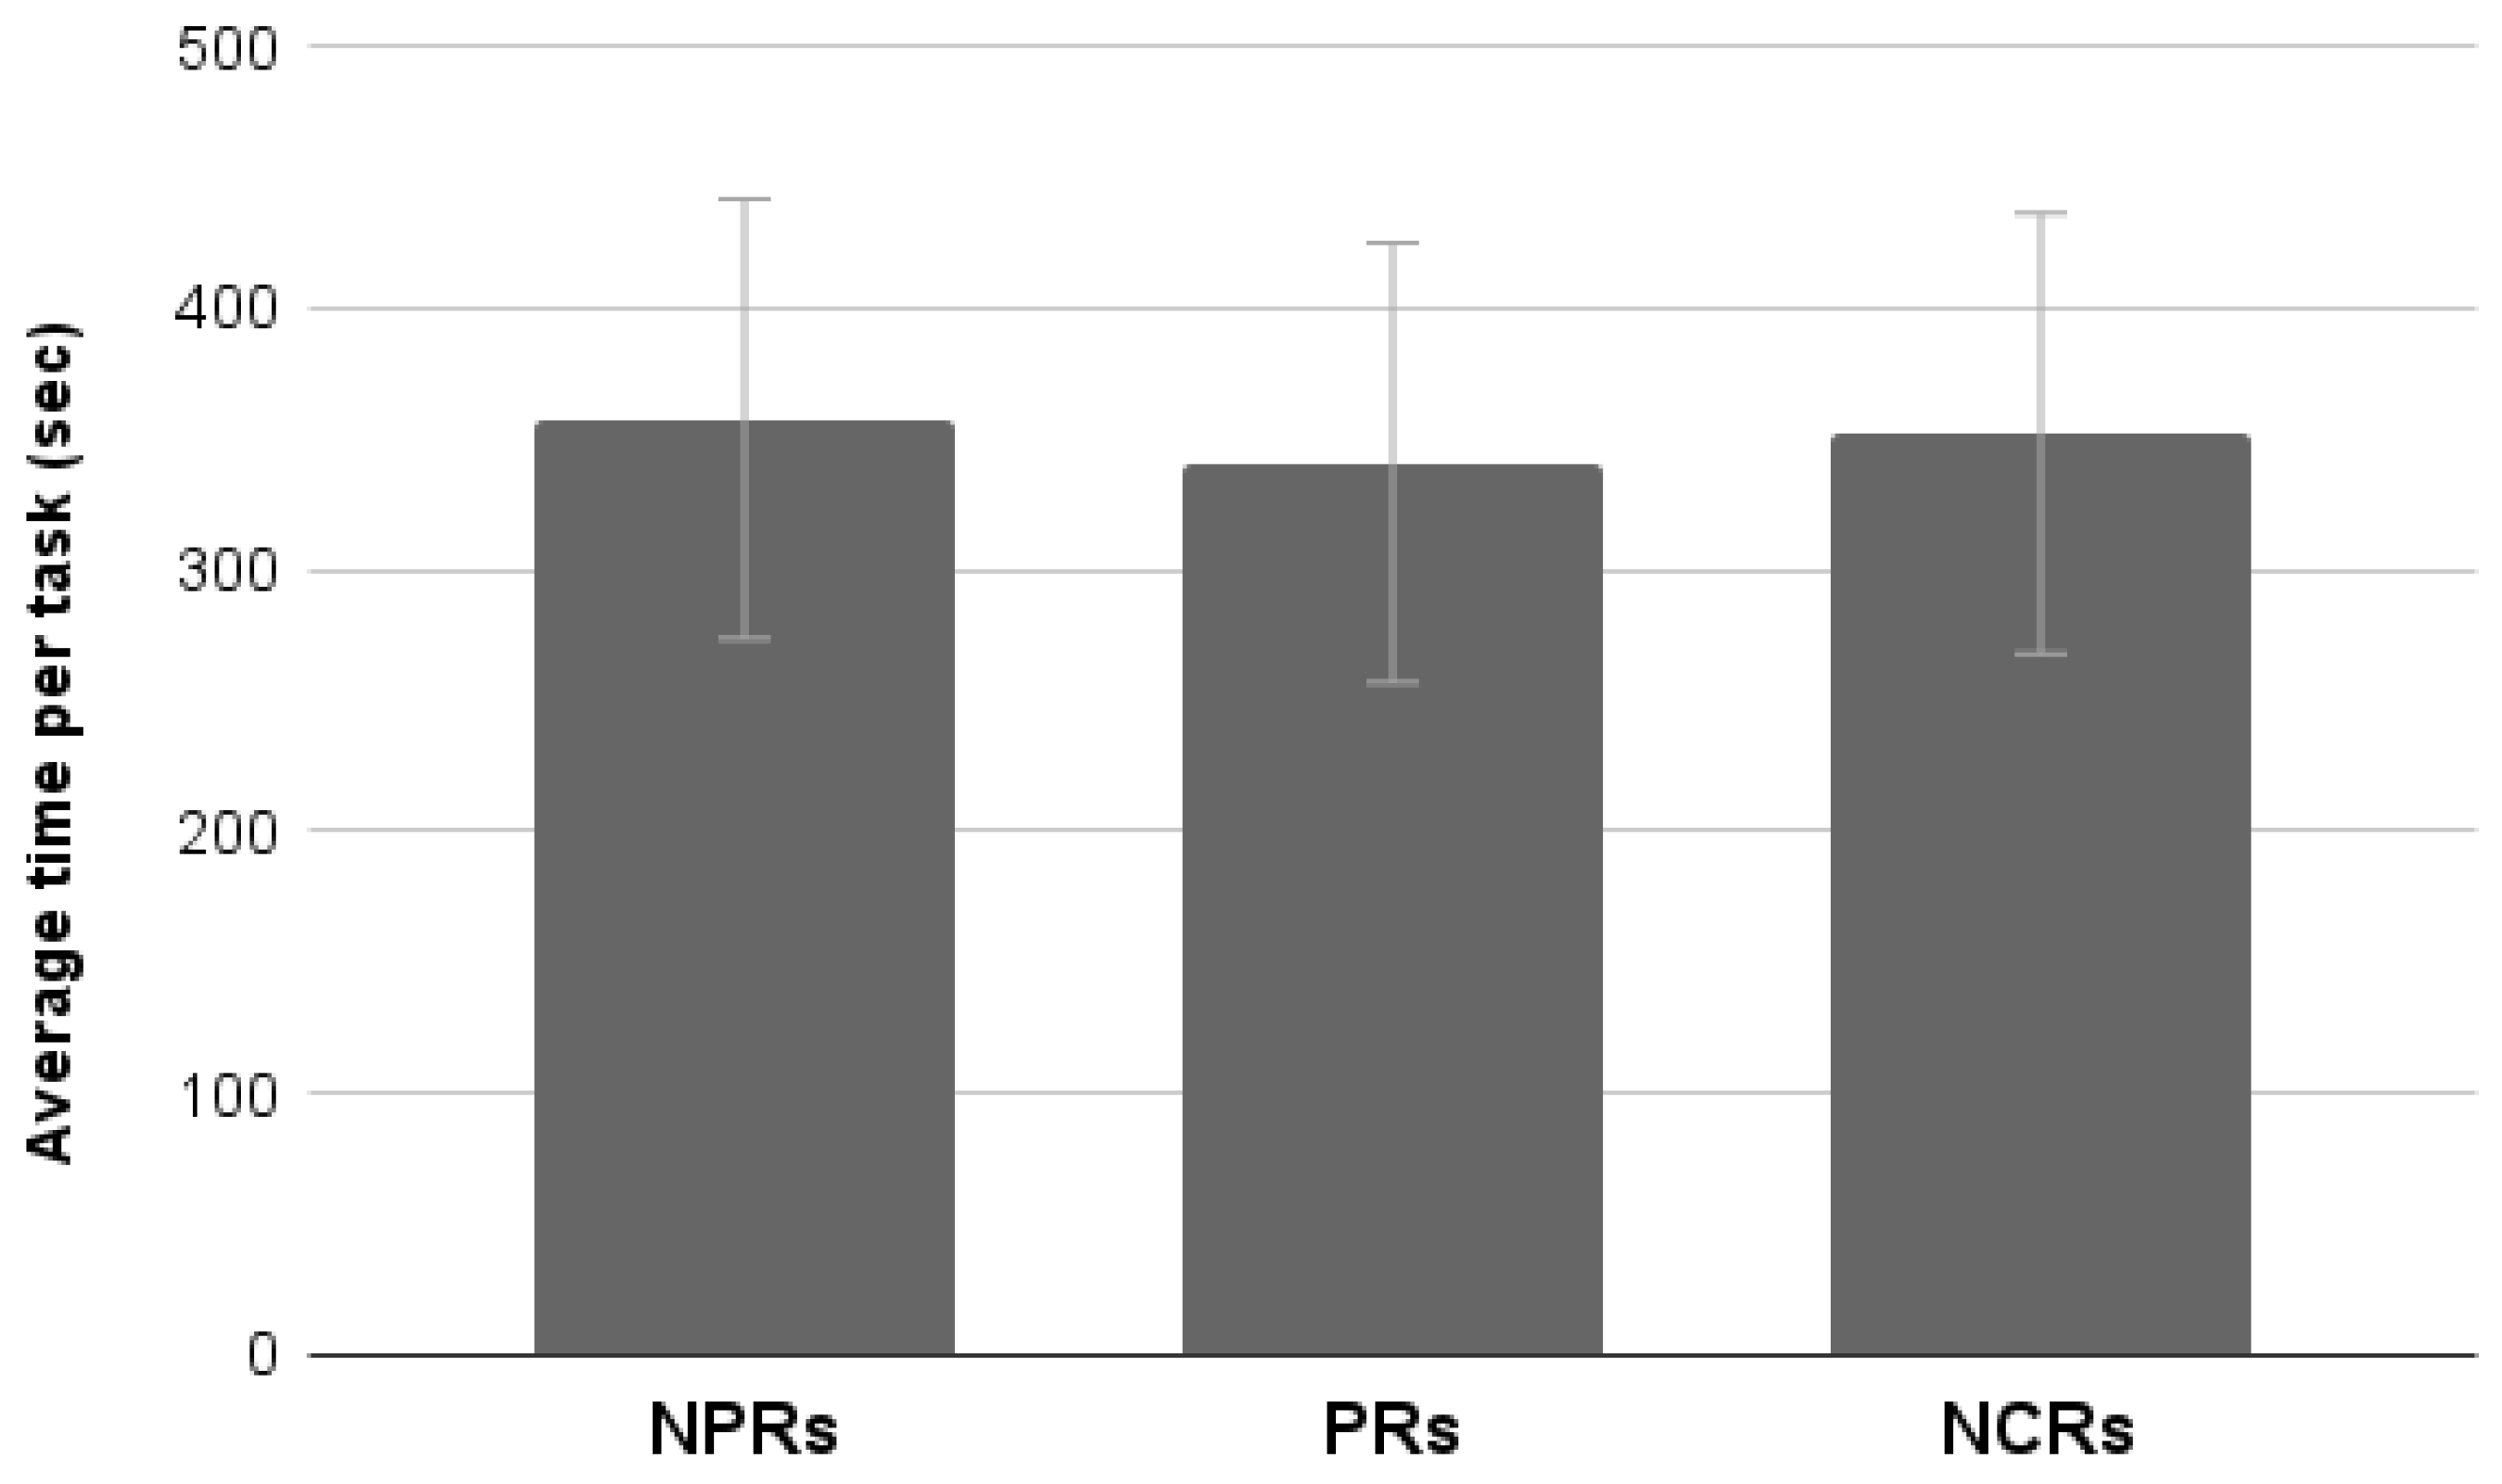
4.3.5. Average Time Per Task
The analysis of the average time of completion per task showed no significant differences between groups (
p > 0.05) (
Figure 19).
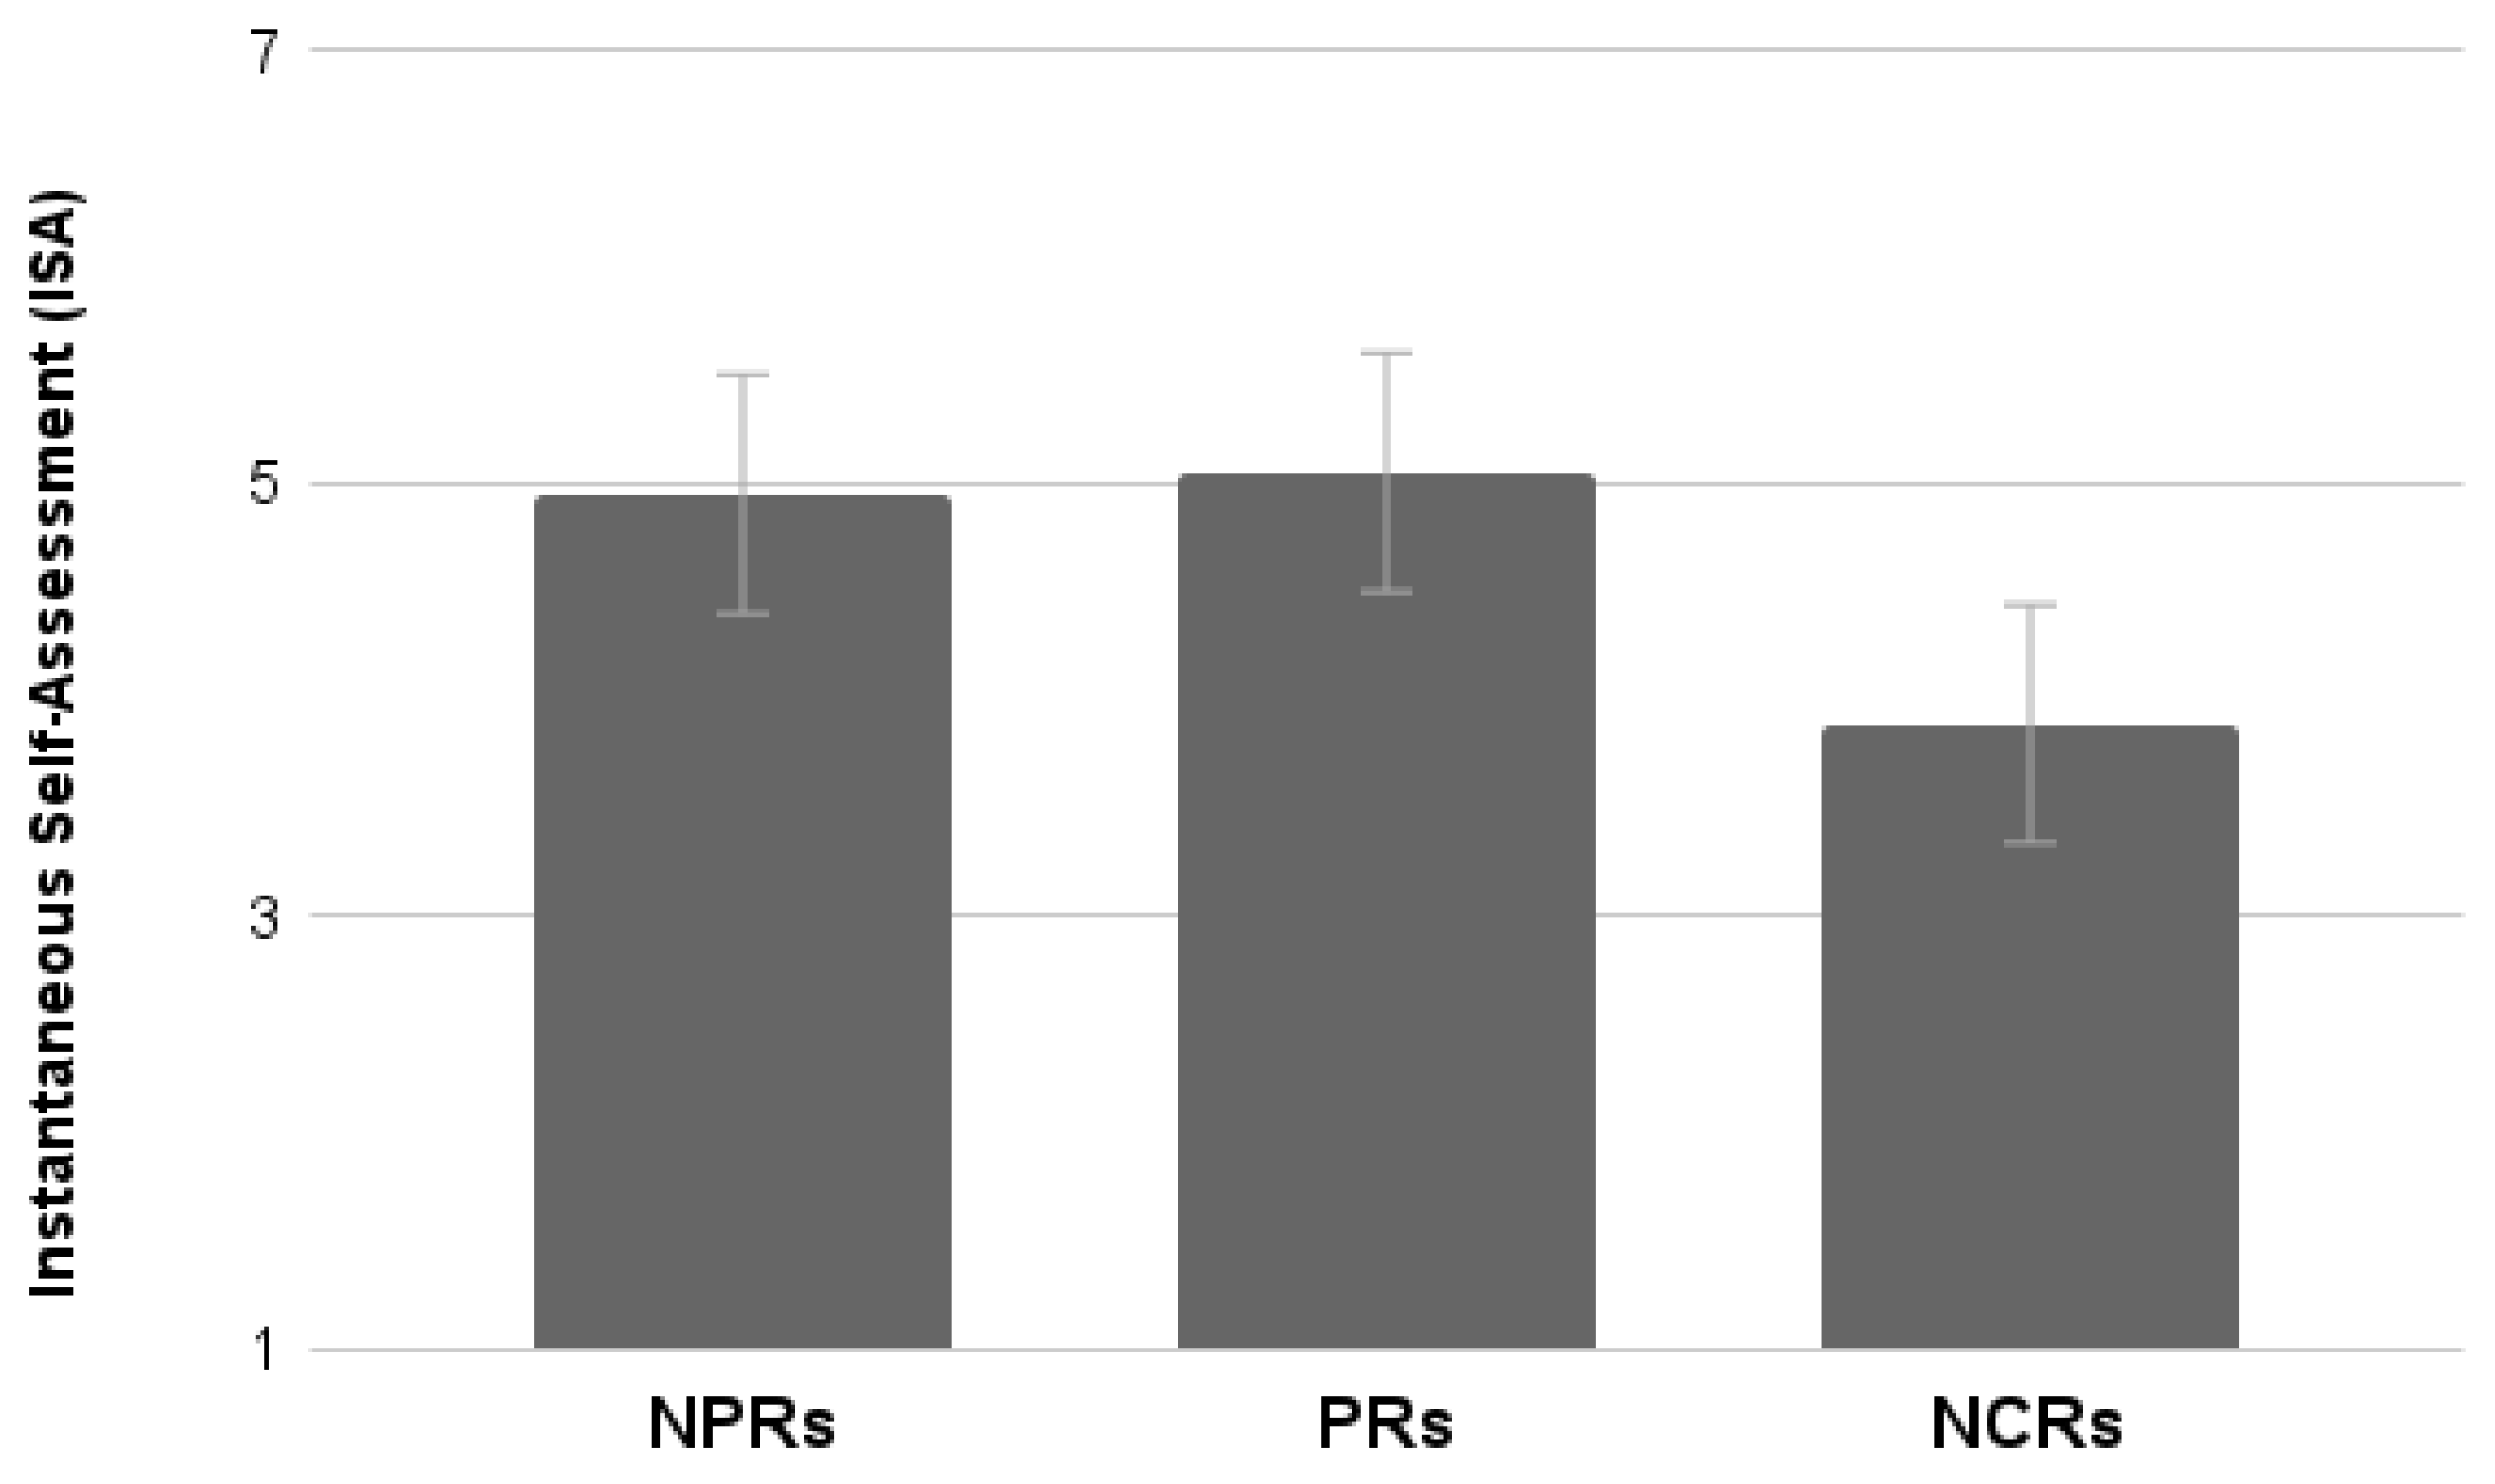
4.3.6. ISA
The analysis of the mean scores provided by the ISA scale shows a significant difference between the groups (F
2,55 = 5.07,
p < 0.01). NCRs rated the tasks as more difficult than PRs and NPRs. No significant differences between the latter two groups were found (
Figure 20).
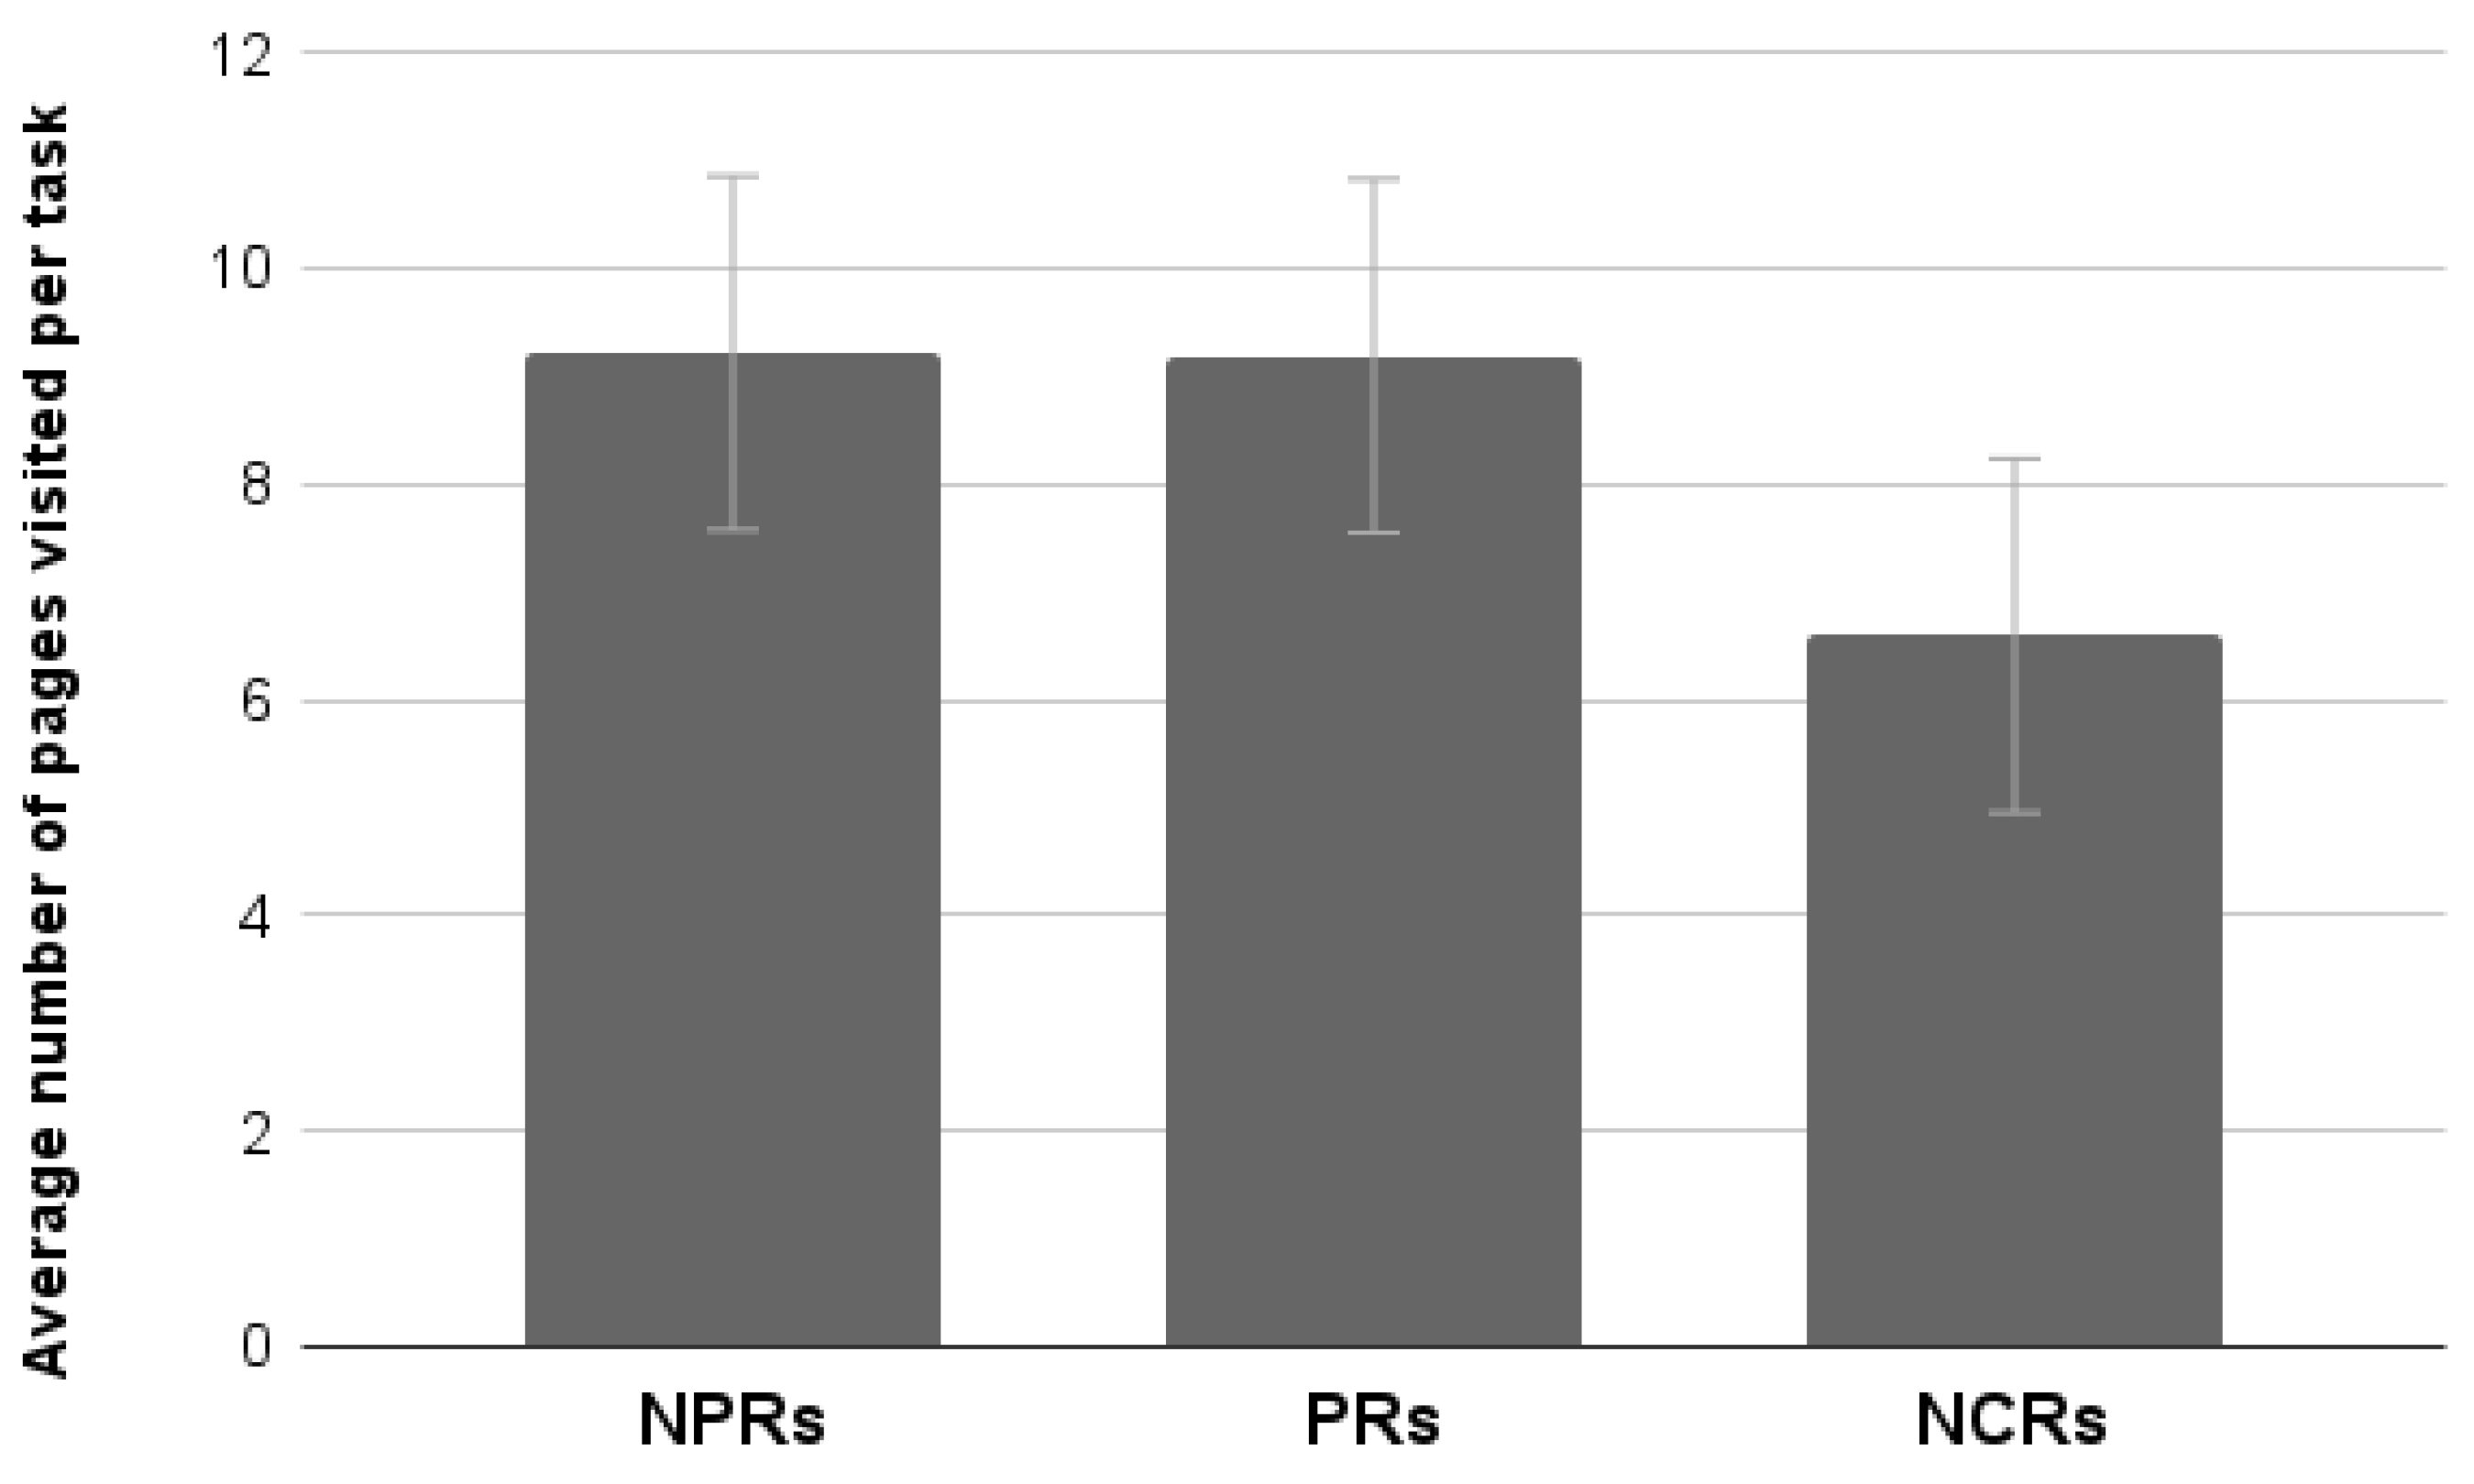
4.3.7. The Average Number of Pages Visited Per Task
Analysis of the average number of page views per task showed a tendency to statistical significance (F
2,55 = 3.09,
p = 0.053). However, post hoc Duncan testing showed that NCRs visit fewer pages than PRs and NPRs. No significant differences between the latter two groups were found (
Figure 21).
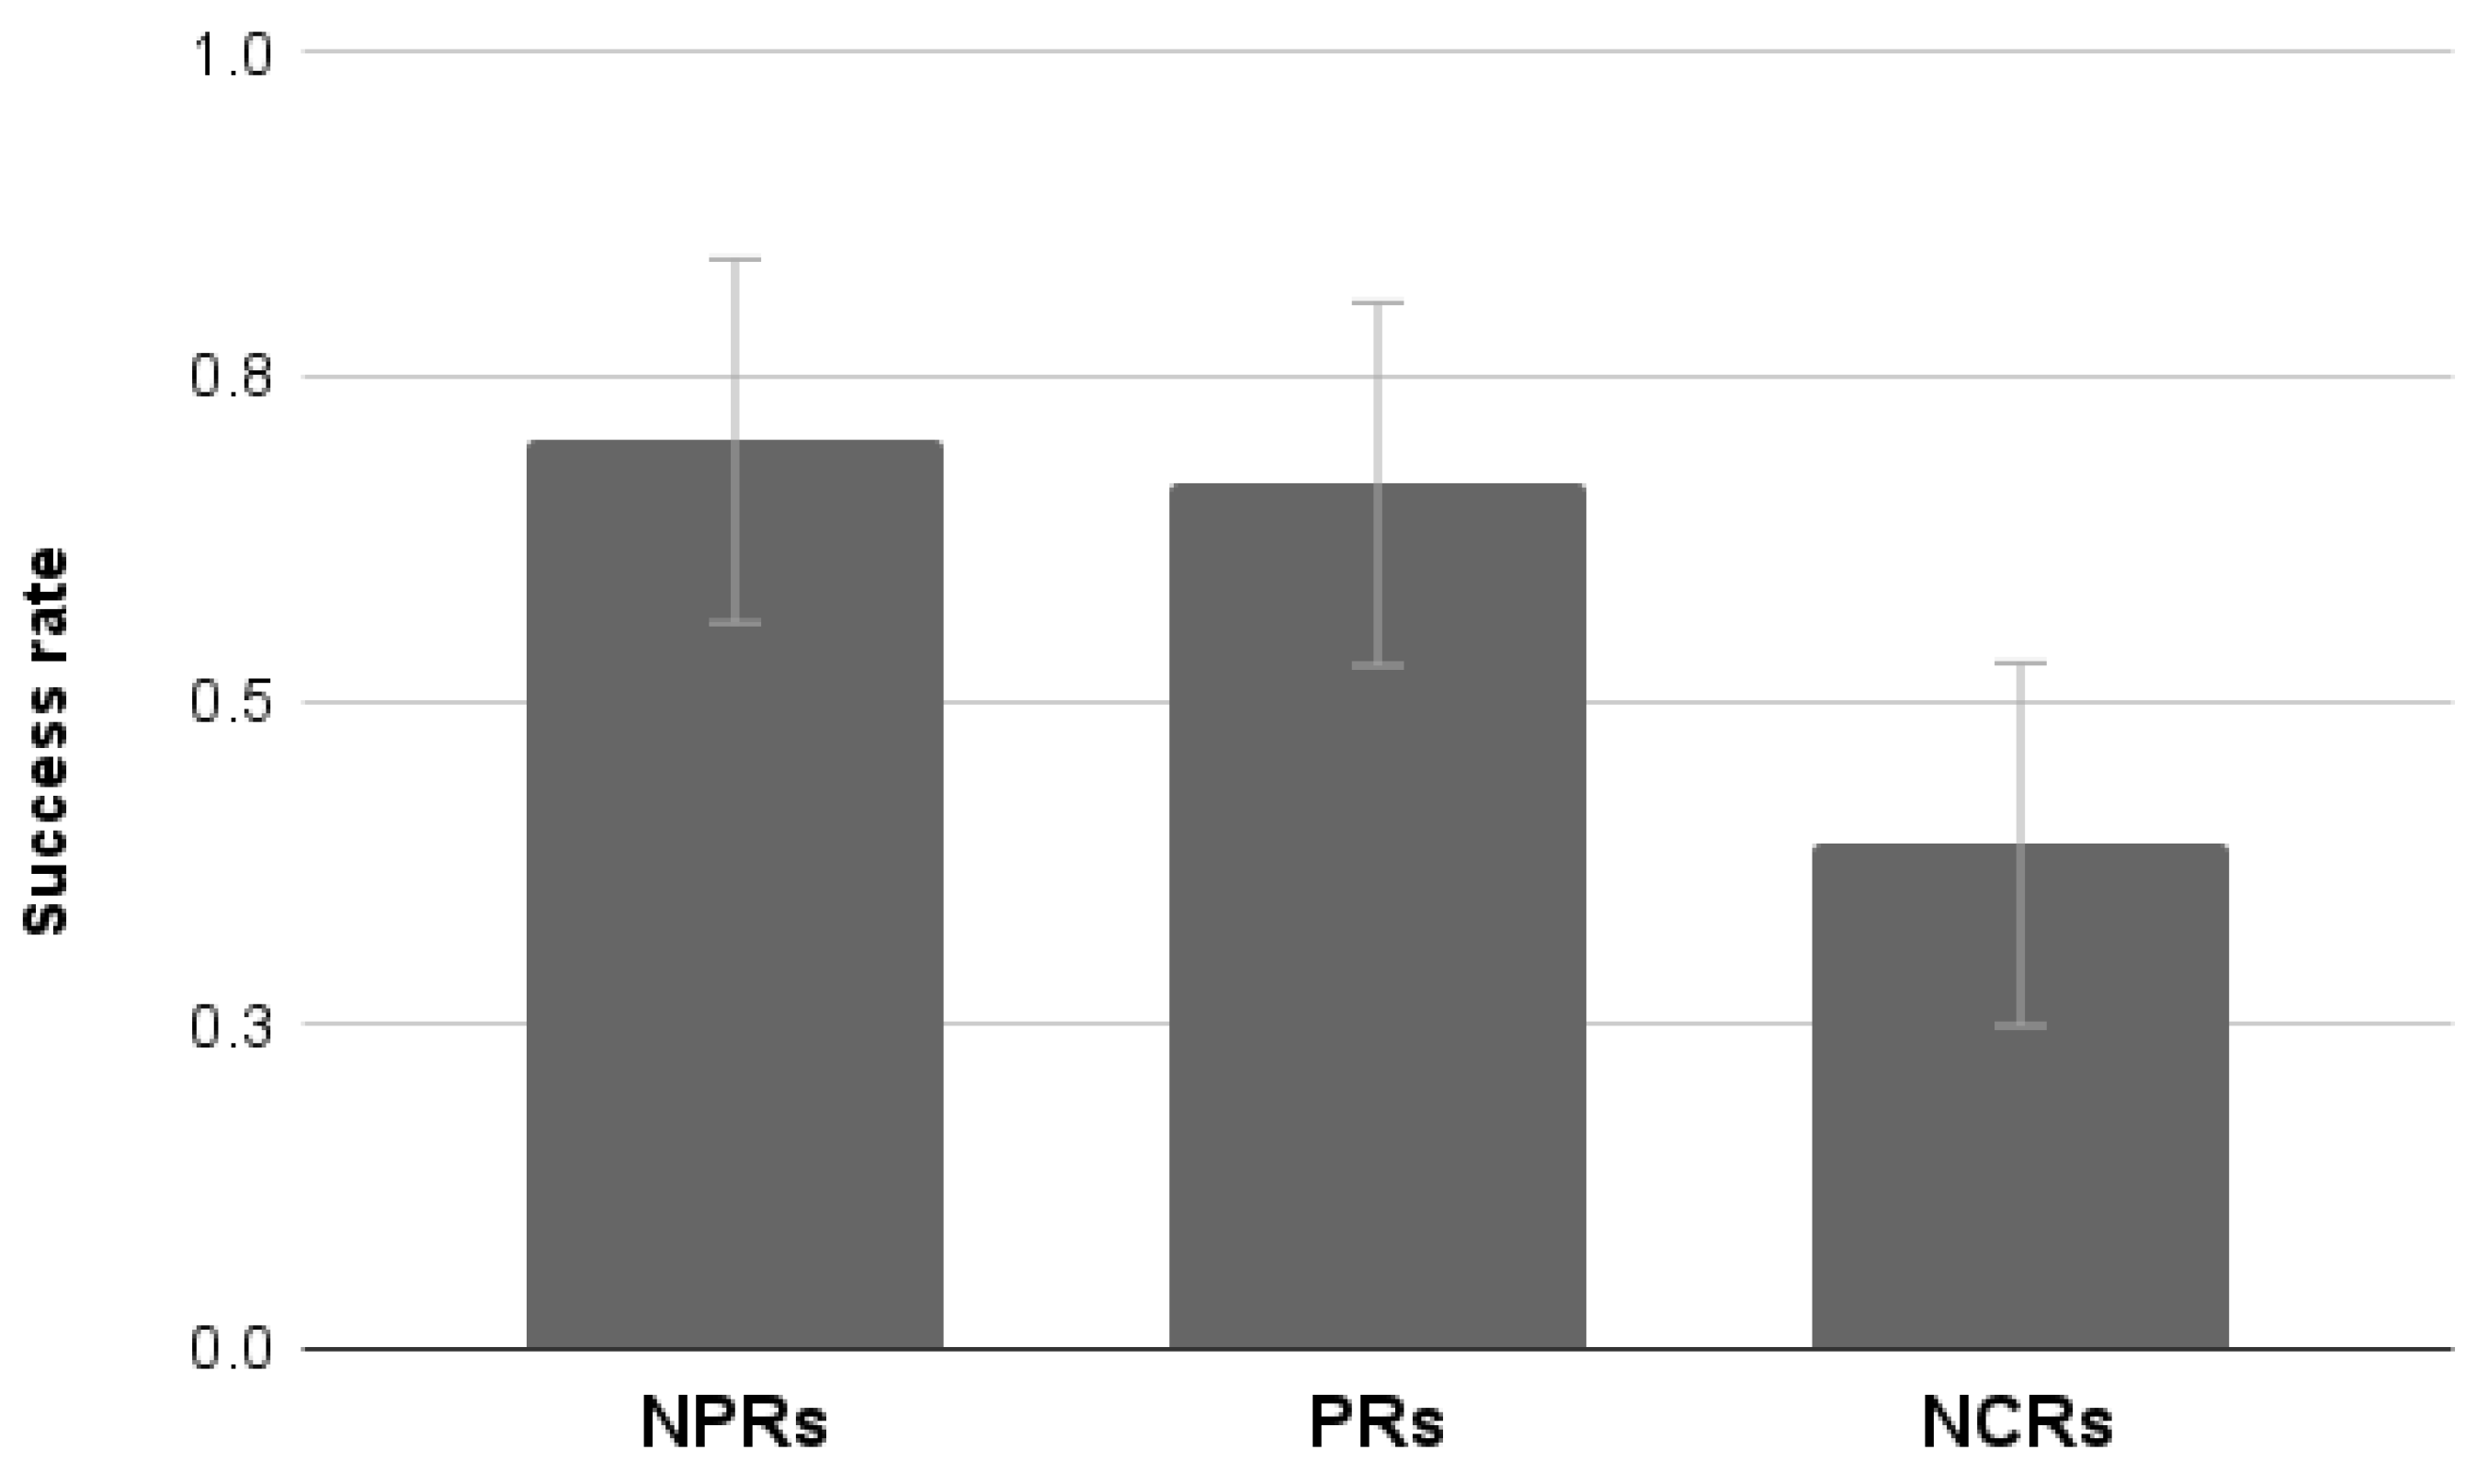
4.3.8. Success Rate
The analysis of the average success rate per task showed a significant effect of Group (F
2,55 = 5.35,
p < 0.01). NCRs showed a significantly lower success rate than PRs and NPRs. No significant differences between the latter two groups were found (
Figure 22).
4.4. Discussion—Study 3
Overall, the results of this third study showed that naive users (namely, the NCRs) behave quite differently from the online panelists. They perceive the task as more demanding, have a lower success rate, and visit fewer pages per task, suggesting lower proactivity in searching for information and reaching the goal. Furthermore, time for completing the task and usability ratings do not appear to differ from those of NPRs. The only noticeable difference in terms of usability evaluation has been recorded for the Handling scale of Us.E. 2.0 for which NCRs rate the site less usable than NPRs. However, PRs also rate the site as less usable than NPRs, most probably for different reasons. PRs have experience with debugging and may be aware of the structural aspects of the site that create problems (what the Handling scale measures), whereas the NCRs may simply be less experienced in carrying out tasks and find it generally more difficult to browse the website.
5. General Discussion and Conclusions
Online panels make large pools of users available quickly and inexpensively. Professional respondents, however, pose problems. They are well-trained users who participate in a high number of surveys for money and other incentives [
36]. Many researchers have wondered whether prolonged participation in a research panel can change the way participants respond to online surveys. Struminskaya [
37], speculated on the pros and cons of this bias. Reduced data quality may arise as a problem because they learn to answer questions in a way that reduces the utility of follow-up questions, increased trust with researchers, and accuracy on sensitive topics are factors which positively affect the data quality [
38,
39,
40]. To our knowledge, there is a lack of studies specifically addressing this issue in the usability-evaluation domain. This shortage is further critical considering the average digital skills of the population. For example, only 54% of Europeans have at least basic digital skills, and young people are not excluded from this digital literacy backwardness (see
https://digital-strategy.ec.europa.eu/library/digital-economy-and-society-index-desi-2022, accessed on 15 July 2022). The results of the experiments reported here can contribute to reducing this gap and devising future research opportunities.
As suspected, the type of activity had a priming effect on the usability evaluations. Thus, using a usability questionnaire during a debugging activity should be discouraged or further investigated. In addition, professional and non-professional respondents are confirmed to provide different usability assessments, although their performance is homogeneous. Namely, when examining data from individuals with different expertise, the fact of carrying out a functional test appears to lead to a more positive usability assessment. Moreover, professional respondents are those who typically provide lower usability ratings because of their very nature as experts. The salience of these results is underlined by the absence of interactions between the type of test performed and the type of respondents. Indeed, these two factors appear to influence usability evaluation consistently and independently.
Finally, the comparison between professional, non-professional, and naive respondents showed that, although inexperienced individuals perform differently, their ratings do not significantly differ from non-professional respondents.
What is the lesson learned from these studies? We have shown that the testing procedure and the subject’s proficiency influence usability subjective measures, but that poses new questions. The goal is now to understand how to exploit this knowledge to answer the following questions: can we use PRs in usability testing correcting through specific calibration standards targeting this group of users? Can we measure the perceived usability of a product during debugging tests? Are number and types of usability problems identified by PR, NPR, and NCR any different?
To answer those questions, controlled experimental studies are needed, perhaps comparing systems with (previously assessed) favorable and non-favorable usability. Answering those questions is also critical for supporting the emergent trend related to research repositories and insight-management tools.
In general, UX researchers using online panels and OPs managers should try to monitor certain parameters of respondents, such as the number of studies in which they participated, average compensation, etc. To ensure data quality, it is important to monitor these aspects and avoid recruiting homogeneous groups in terms of experience. Managers and researchers should also keep track of participants who may have misread instructions in a usability test or show obvious reliability issues. Finally, benchmarks need to be determined to limit the effects due to participants’ “professionalism” and eventually correct the scores.
In conclusion, the studies reported here showed that professional respondents provide biased assessments due to their expertise, and usability assessments collected at the end of a functional test (i.e., debugging) also lead to biased evaluations. Experts are outliers and, although they are sometimes seen as a resource in the Human Factors literature [
41], when it comes to usability assessments the bias they introduce should be corrected.
Results of the studies reported here suggest that members of online panels could be involved in usability evaluations using subjective metrics, but only if they have not cumulated too much experience with debugging. Using normative data for weighting their scores could be a strategy for coping with the bias introduced by the expertise. However, in the short term, using “fresh” samples of users seems to be a viable solution, though they do not need to be completely naive. Future research may also address what is the level of expertise (i.e., the threshold) that makes the difference, also in relation of different levels in digital skills.


 ,
, 