Article

Correlation between Acoustic Analysis and Psycho-Acoustic Evaluation of Violins

by
Silviu Marian Nastac
1,2,*,
Vasile Ghiorghe Gliga
3,4,
Mircea Mihalcica
2,
Alina Maria Nauncef
5,
Florin Dinulica
6 and
Mihaela Campean
3
1
Faculty of Engineering and Agronomy, “Dunarea de Jos” University of Galati, 810017 Braila, Romania
2
Faculty of Mechanical Engineering, Transilvania University of Brasov, 500036 Brasov, Romania
3
Faculty of Furniture Design and Wood Engineering, Transilvania University of Brasov, 500036 Brasov, Romania
4
S.C. Gliga Instrumente Muzicale S.A., Reghin, Str. Pandurilor 120, 545430 Mures, Romania
5
Faculty of Music, Transilvania University of Brasov, 500036 Brasov, Romania
6
Department of Forest Engineering, Forest Management Planning and Terrestrial Measurements, Transilvania University of Brasov, 500036 Brasov, Romania
*
Author to whom correspondence should be addressed.
Appl. Sci. 2022, 12(17), 8620; https://doi.org/10.3390/app12178620
Submission received: 21 July 2022 / Revised: 23 August 2022 / Accepted: 24 August 2022 / Published: 28 August 2022
(This article belongs to the Special Issue Mechanics, Dynamics and Acoustics of Musical Instruments)

Abstract

:
This paper presents the results of an experimental study performed on seven violins obtained from a top plate made of resonance spruce and a back plate made of curly maple. Each pair of plates had a different modification to its thickness profile. Some were thickened and others were thinned compared to the classical thickness profile. Then, a soloist played a musical sequence on each violin and the acoustic signals were recorded. The sound quality of the signals was evaluated with a psycho-acoustic evaluation based on a blind questionnaire completed by listeners. It turned out that: (1) respondents with more musical experience (especially those with over 26 years of experience) were more demanding in assessing sound clarity and offered the widest range of scores in assessing this quality; (2) the musical experience of the respondents influenced to the highest degree the appreciation of the warm sound quality; (3) the scores for the violins with thinned plates were weaker, especially according to the psycho-acoustic analysis; and (4) the highest score was obtained by the violin with the thickest plates, which can be correlated with the two dominant frequencies extracted from the FFT analysis, whose values coincide with the frequencies of the B1− and B1+ modes.

1. Introduction

In the literature there are studies that address the link between the acoustic quality of a violin and artistic perception based either on surveys completed by performers or listeners, or by using machine learning tools [1,2,3,4,5]. The sounds produced by a violin are the result of the interaction between the bow and the strings. The strings begin to vibrate both transversely in the direction of the force applied by the bow and longitudinally along the string. The transverse vibrations are transmitted through the bridge to the top plate of the violin and further to the entire air volume inside the violin body, which behaves like a Helmholtz-type resonator and produces an intense sound [6,7]. The fundamental frequencies of the generated sounds are determined by the geometric characteristics of the source from which the wave propagates, and the number of harmonics (violin timbre) is determined by the resonator that amplifies the initial sound, adding the series of its own frequencies [8,9,10]. Thus, it becomes obvious that the quality of the sounds generated by a violin greatly depends on very many factors. These are related to the quality of the wooden material used to manufacture the instrument and its accessories, the quality of the other materials used in the construction of a violin (e.g., strings), the type of varnish (lacquer) and the varnishing technology used, the skills of the violin maker, the skills of the musician, etc. Any modification—e.g., using a different wood species than maple for the back plate [11,12], or changing the position of the sound post, or increasing the number of varnish layers, or changing the drying time after applying each varnish layer, or changing the thickness of the plates—may affect the sound quality [13,14,15,16]. Optimization is possible only by a combined assessment, which must take into account both an objective evaluation, based on the determination of some measurable parameters, and a psycho-acoustic evaluation, based on the perception by specialists in the field of music (soloists and listeners). Even if the latter is a subjective type of assessment, when correlated to the objective evaluation it might validate some results which are impossible to be proven otherwise. The modal analysis is one of the most commonly used methods of acoustic assessment of modern or heritage violins [6,17,18,19,20]. By this method, dynamic parameters such as the fundamental frequencies of the vibrating components (top plate, back plate, air) can be determined, which can then be related to certain parameters of the sounds generated by the violin [9,10,21,22]. For instance, the first eigenfrequency, also called the fundamental frequency, is essential in tuning a musical instrument. In the case of the violin, the fundamental frequency is in the range of 270–280 Hz. The second eigenfrequency, corresponding to the 2# vibration mode, reflects the contribution of the top plate within the violin body. The eigenfrequency with the maximum amplitude indicates how intense the plate vibrates and how high its frequency values can reach [22,23].
Another objective method is to evaluate the acoustic spectrum based on the processing of violin signals. By applying the time and frequency domain analyses, the frequency spectrum and the power spectrum are determined. It is also possible to calculate a statistical analysis of the mode frequency, which is defined as the frequency of the vibration frequency in the 1/1 dB band or the 1/3 dB band [4,5,24,25].
The psycho-acoustic analysis is also a scientific method of evaluating sound quality, frequently applied in the evaluation of both old (heritage) and modern musical instruments. Such an assessment can be performed by experienced musicians, from the viewpoint of the soloist, and/or from that of the listener [1,2,3,4,5]. The main criteria on which such an assessment is usually based [4,6,8,25,26] refer to the sound amplitude, tone brightness, clarity, warmth, silkiness of the sounds, color, etc.
The main objective of the present research was to investigate what happens to the sound quality of the violin when the thickness profile of both violin plates is modified equally. All methods described above were applied in this evaluation. The aim was to build up a characterization matrix concerning the influence of the thickness profile of the plates on the sound quality of the violin, based both on objective and subjective evaluation items, and to formulate conclusions for violin makers. The novelty of this study consisted in: the acoustic and perceptual analysis of the sounds emitted by violins with modified internal volumes of air, achieved by changing the thickness of the plates; the correlating of the respondents’ assessments with the characteristics of age, experience, and gender; and, last but not least, the highlighting of the link between the values of the specific frequencies of signature modes and the scores assigned by the participants in the opinion surveys.

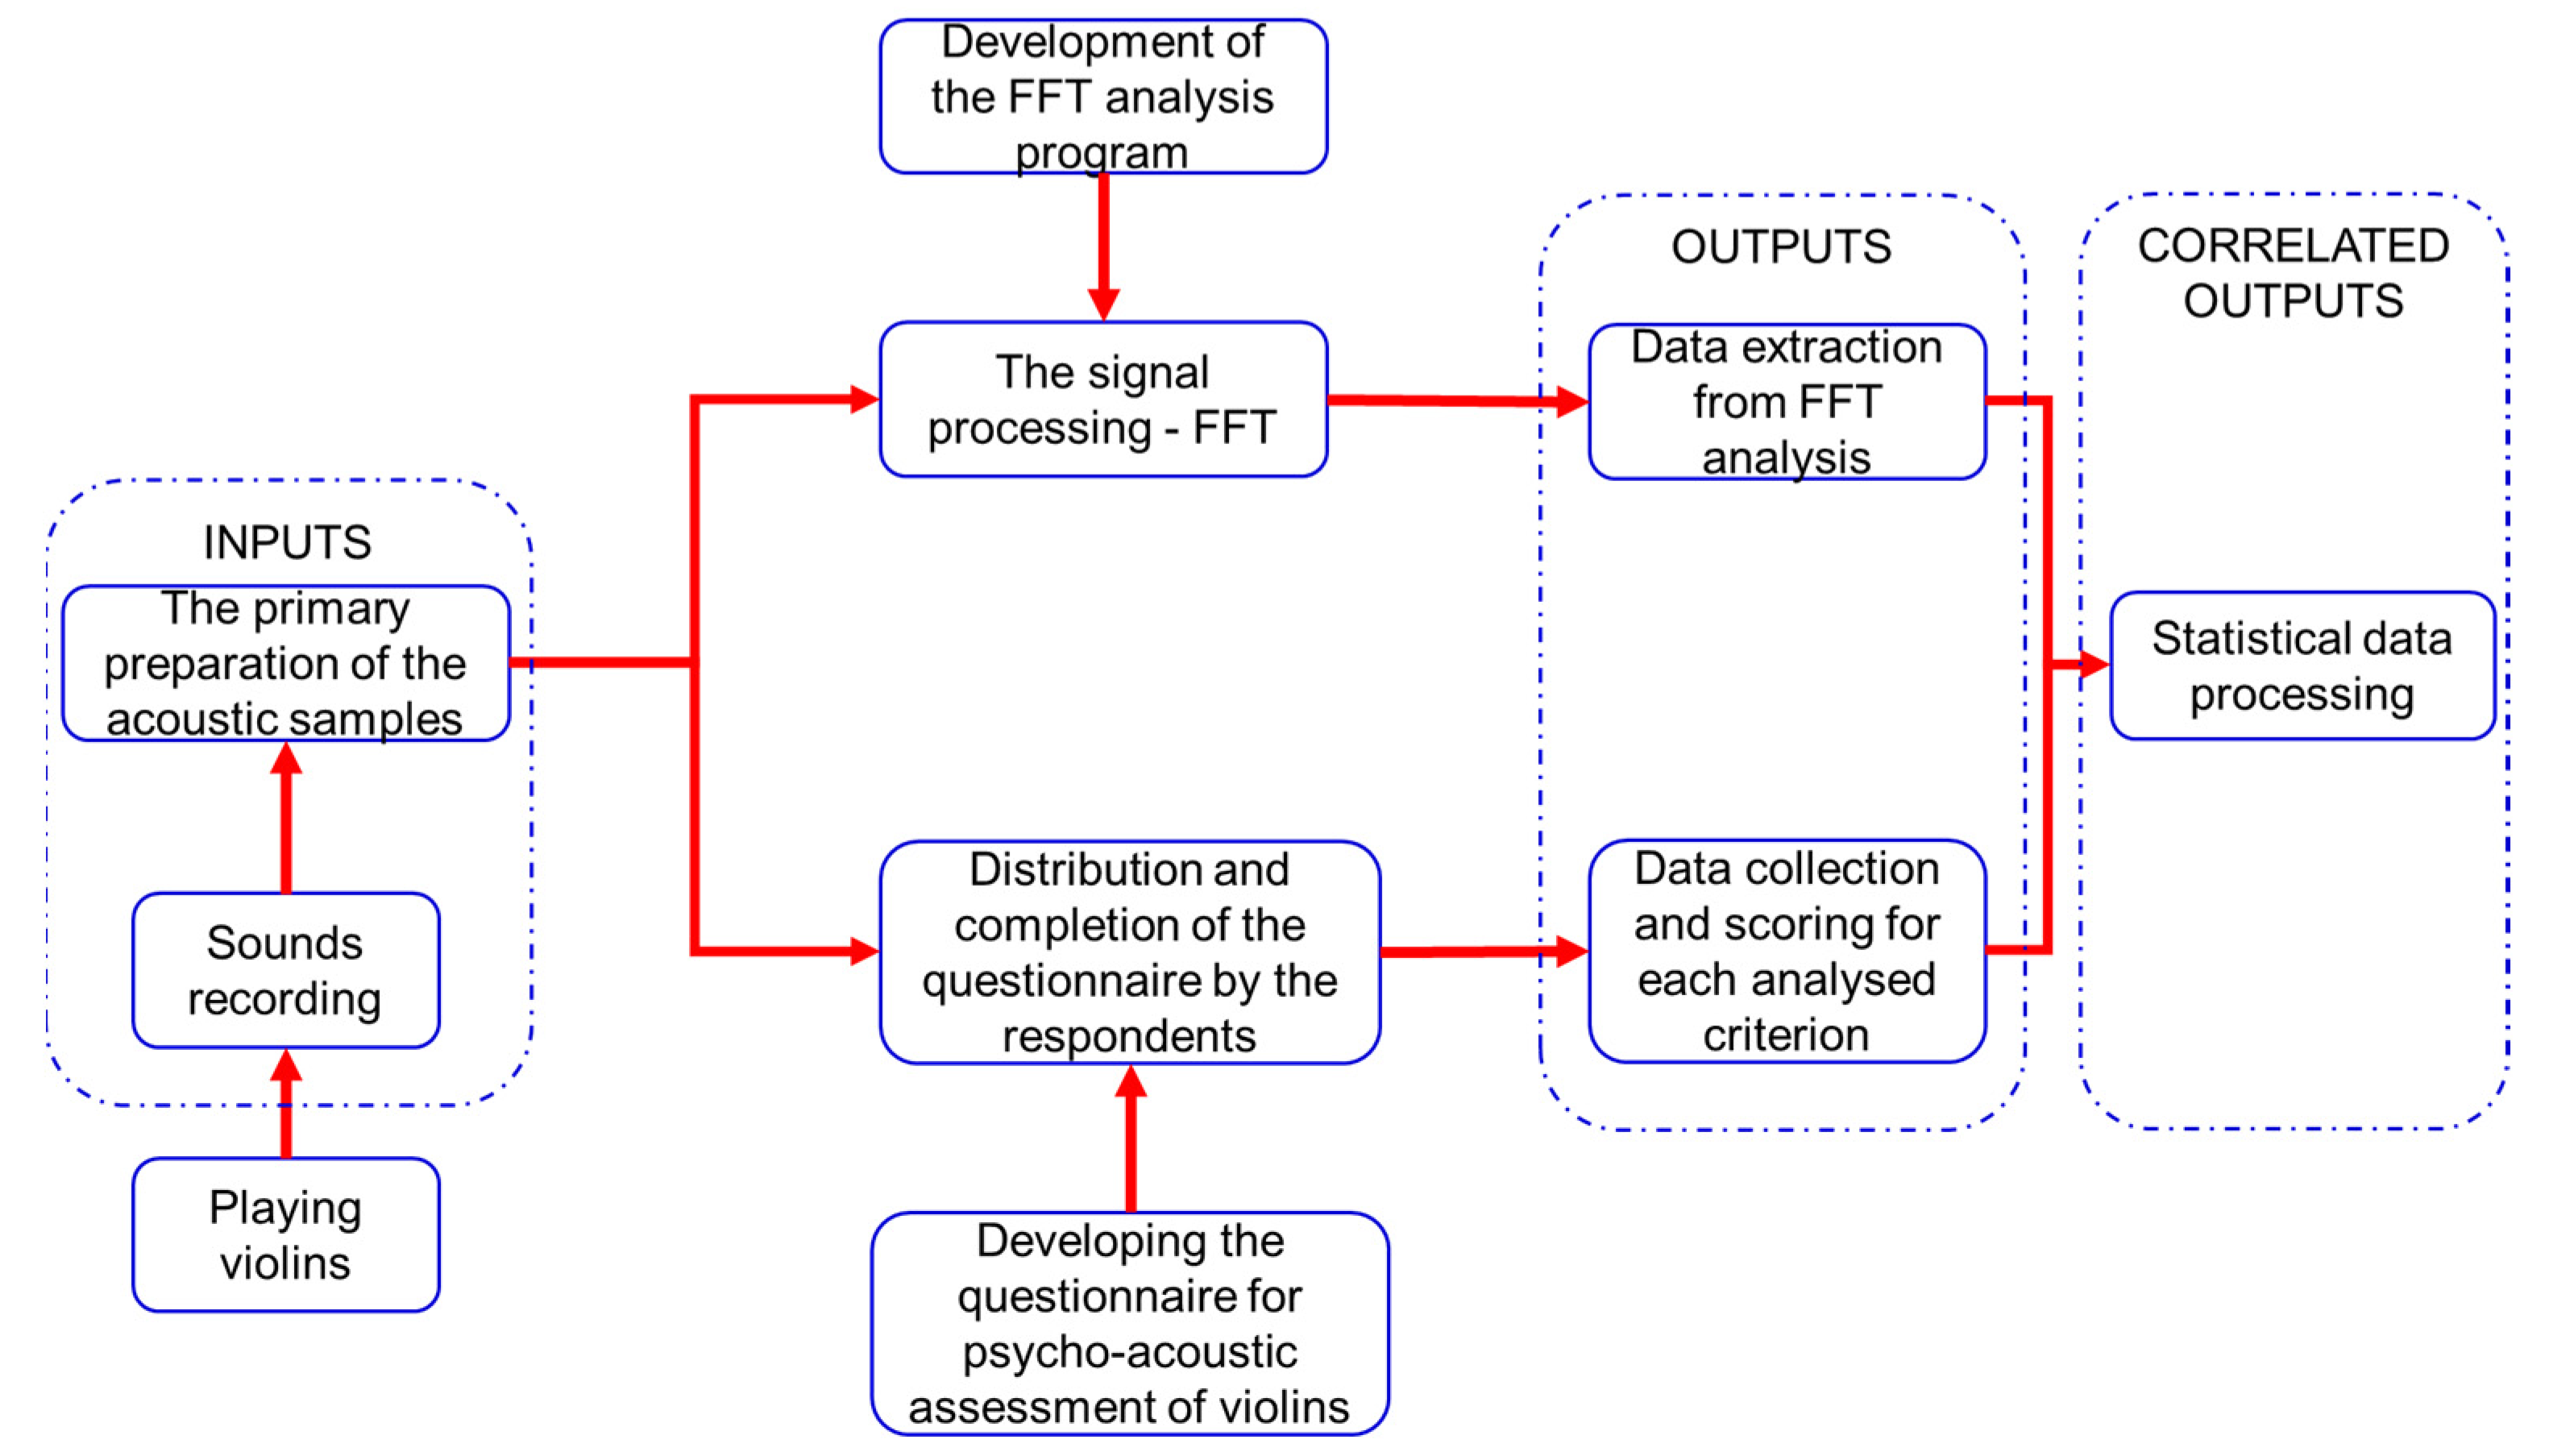
2. Materials and Methods

2.1. Materials

The acoustic tests were performed on seven unvarnished “Maestro” violins (Figure 1), one for each of the following thickness profiles:
  • reference thickness profile (corresponding to 4/4 violins, coded A00);
  • thickened thickness profile, obtained by increasing the reference thickness by 0.2 mm, 0.4 mm, and 0.6 mm over the whole profile (coded AP2, AP4, and AP6, respectively);
  • thinned thickness profile, obtained by decreasing the reference thickness by 0.2 mm, 0.4 mm, and 0.6 mm over the whole profile (coded AM2, AM4, and AM6, respectively).
Acoustic analysis and psycho-acoustic evaluation were performed on the unvarnished violins based on the recorded signals obtained from the musical sequences played on them (Figure 1).

2.2. Methods

A block diagram of the proposed research is presented in Figure 2.
Thus, in the first stage, the musical fragment was established considering the recording of both the sounds emitted by the free strings and the sounds produced by the violin during the interpretation of some musical passages. The duration of the acoustic passages (maximum 1 min) was also taken into account so that the acoustic samples used later in the psycho-acoustic evaluation did not exceed the attention threshold and maintained the same auditory sensitivity throughout the questionnaire. In the next stage, the recordings were made in the concert hall of the Philharmonic in Brasov, Romania. The raw recordings were prepared in order to eliminate the redundant acoustic parts, thereby obtaining the acoustic samples used later in the two analyses: the acoustic one with the signal processing program and the psycho-acoustic one based on the acoustic impression questionnaires that can be accessed on the following page: https://docs.google.com/forms/d/e/1FAIpQLSfVXB5dOIUC0ajVmUq5z5HHySPQUfxcuMO8M1XOSsH1PakIJA/viewform?usp=sf_link (accessed on 10 June 2022). After processing the signals and the results of the questionnaires, the data were statistically correlated. The technical data for the main stages are detailed below.

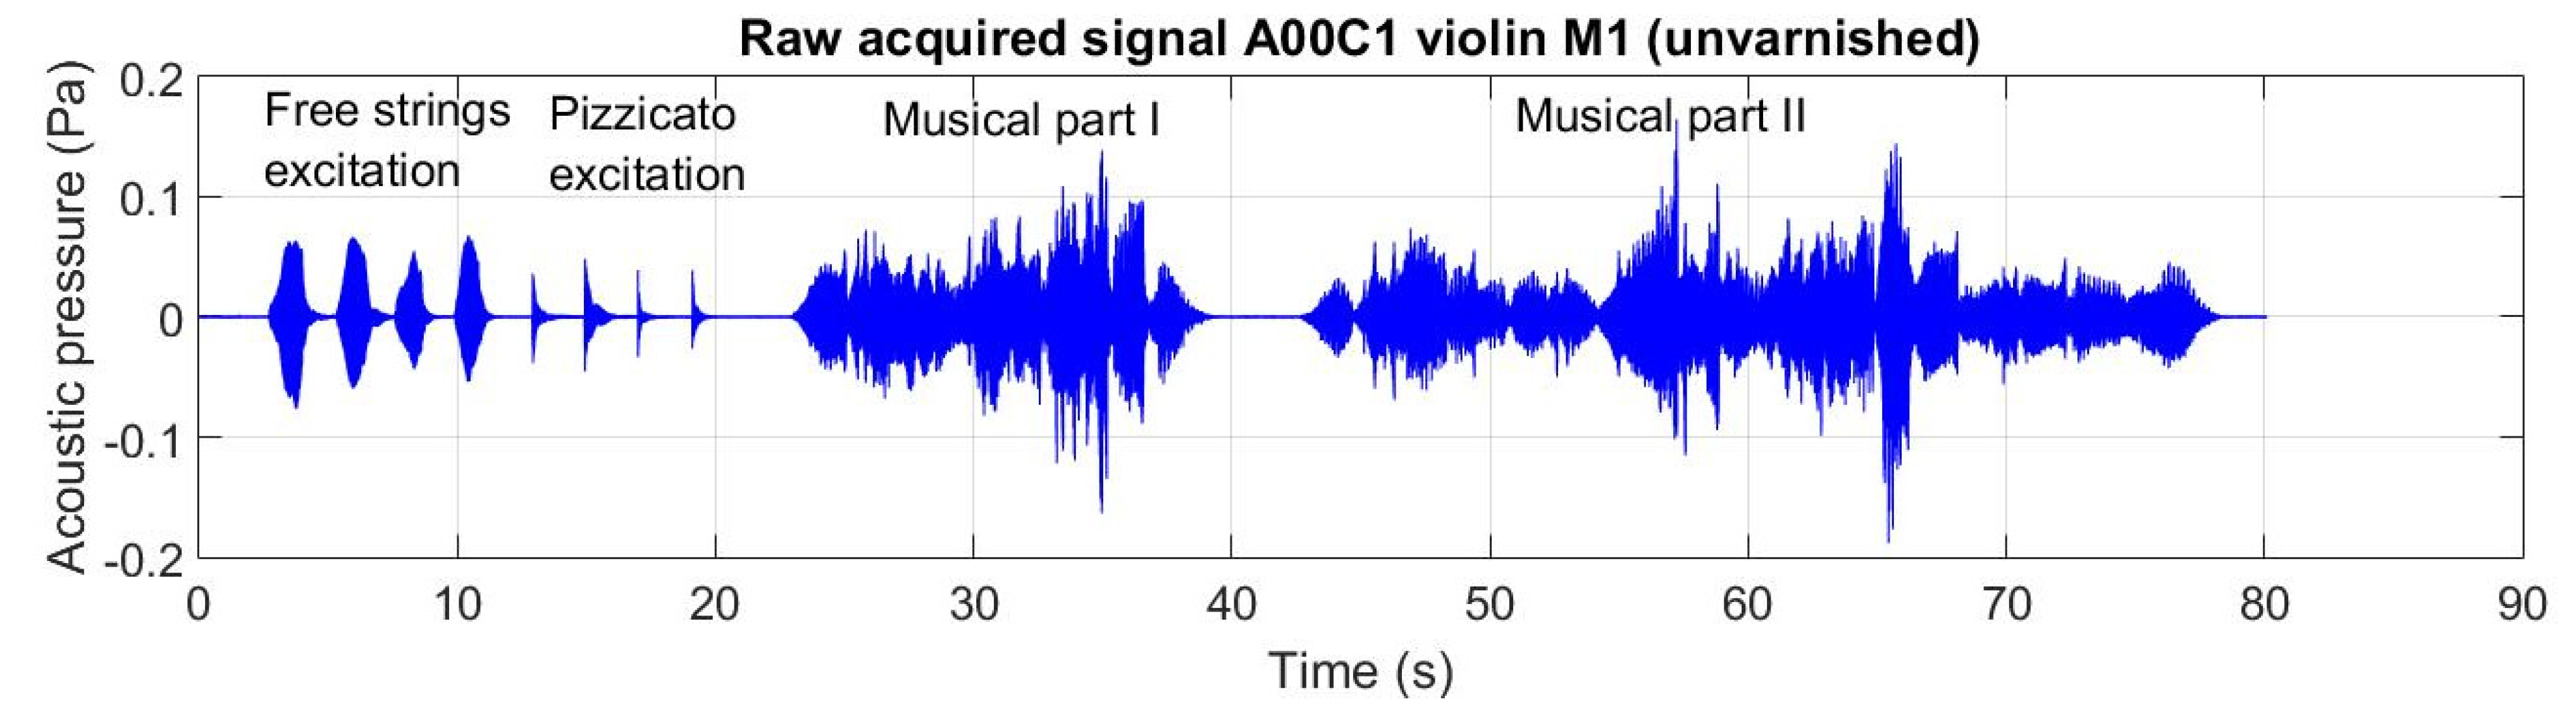
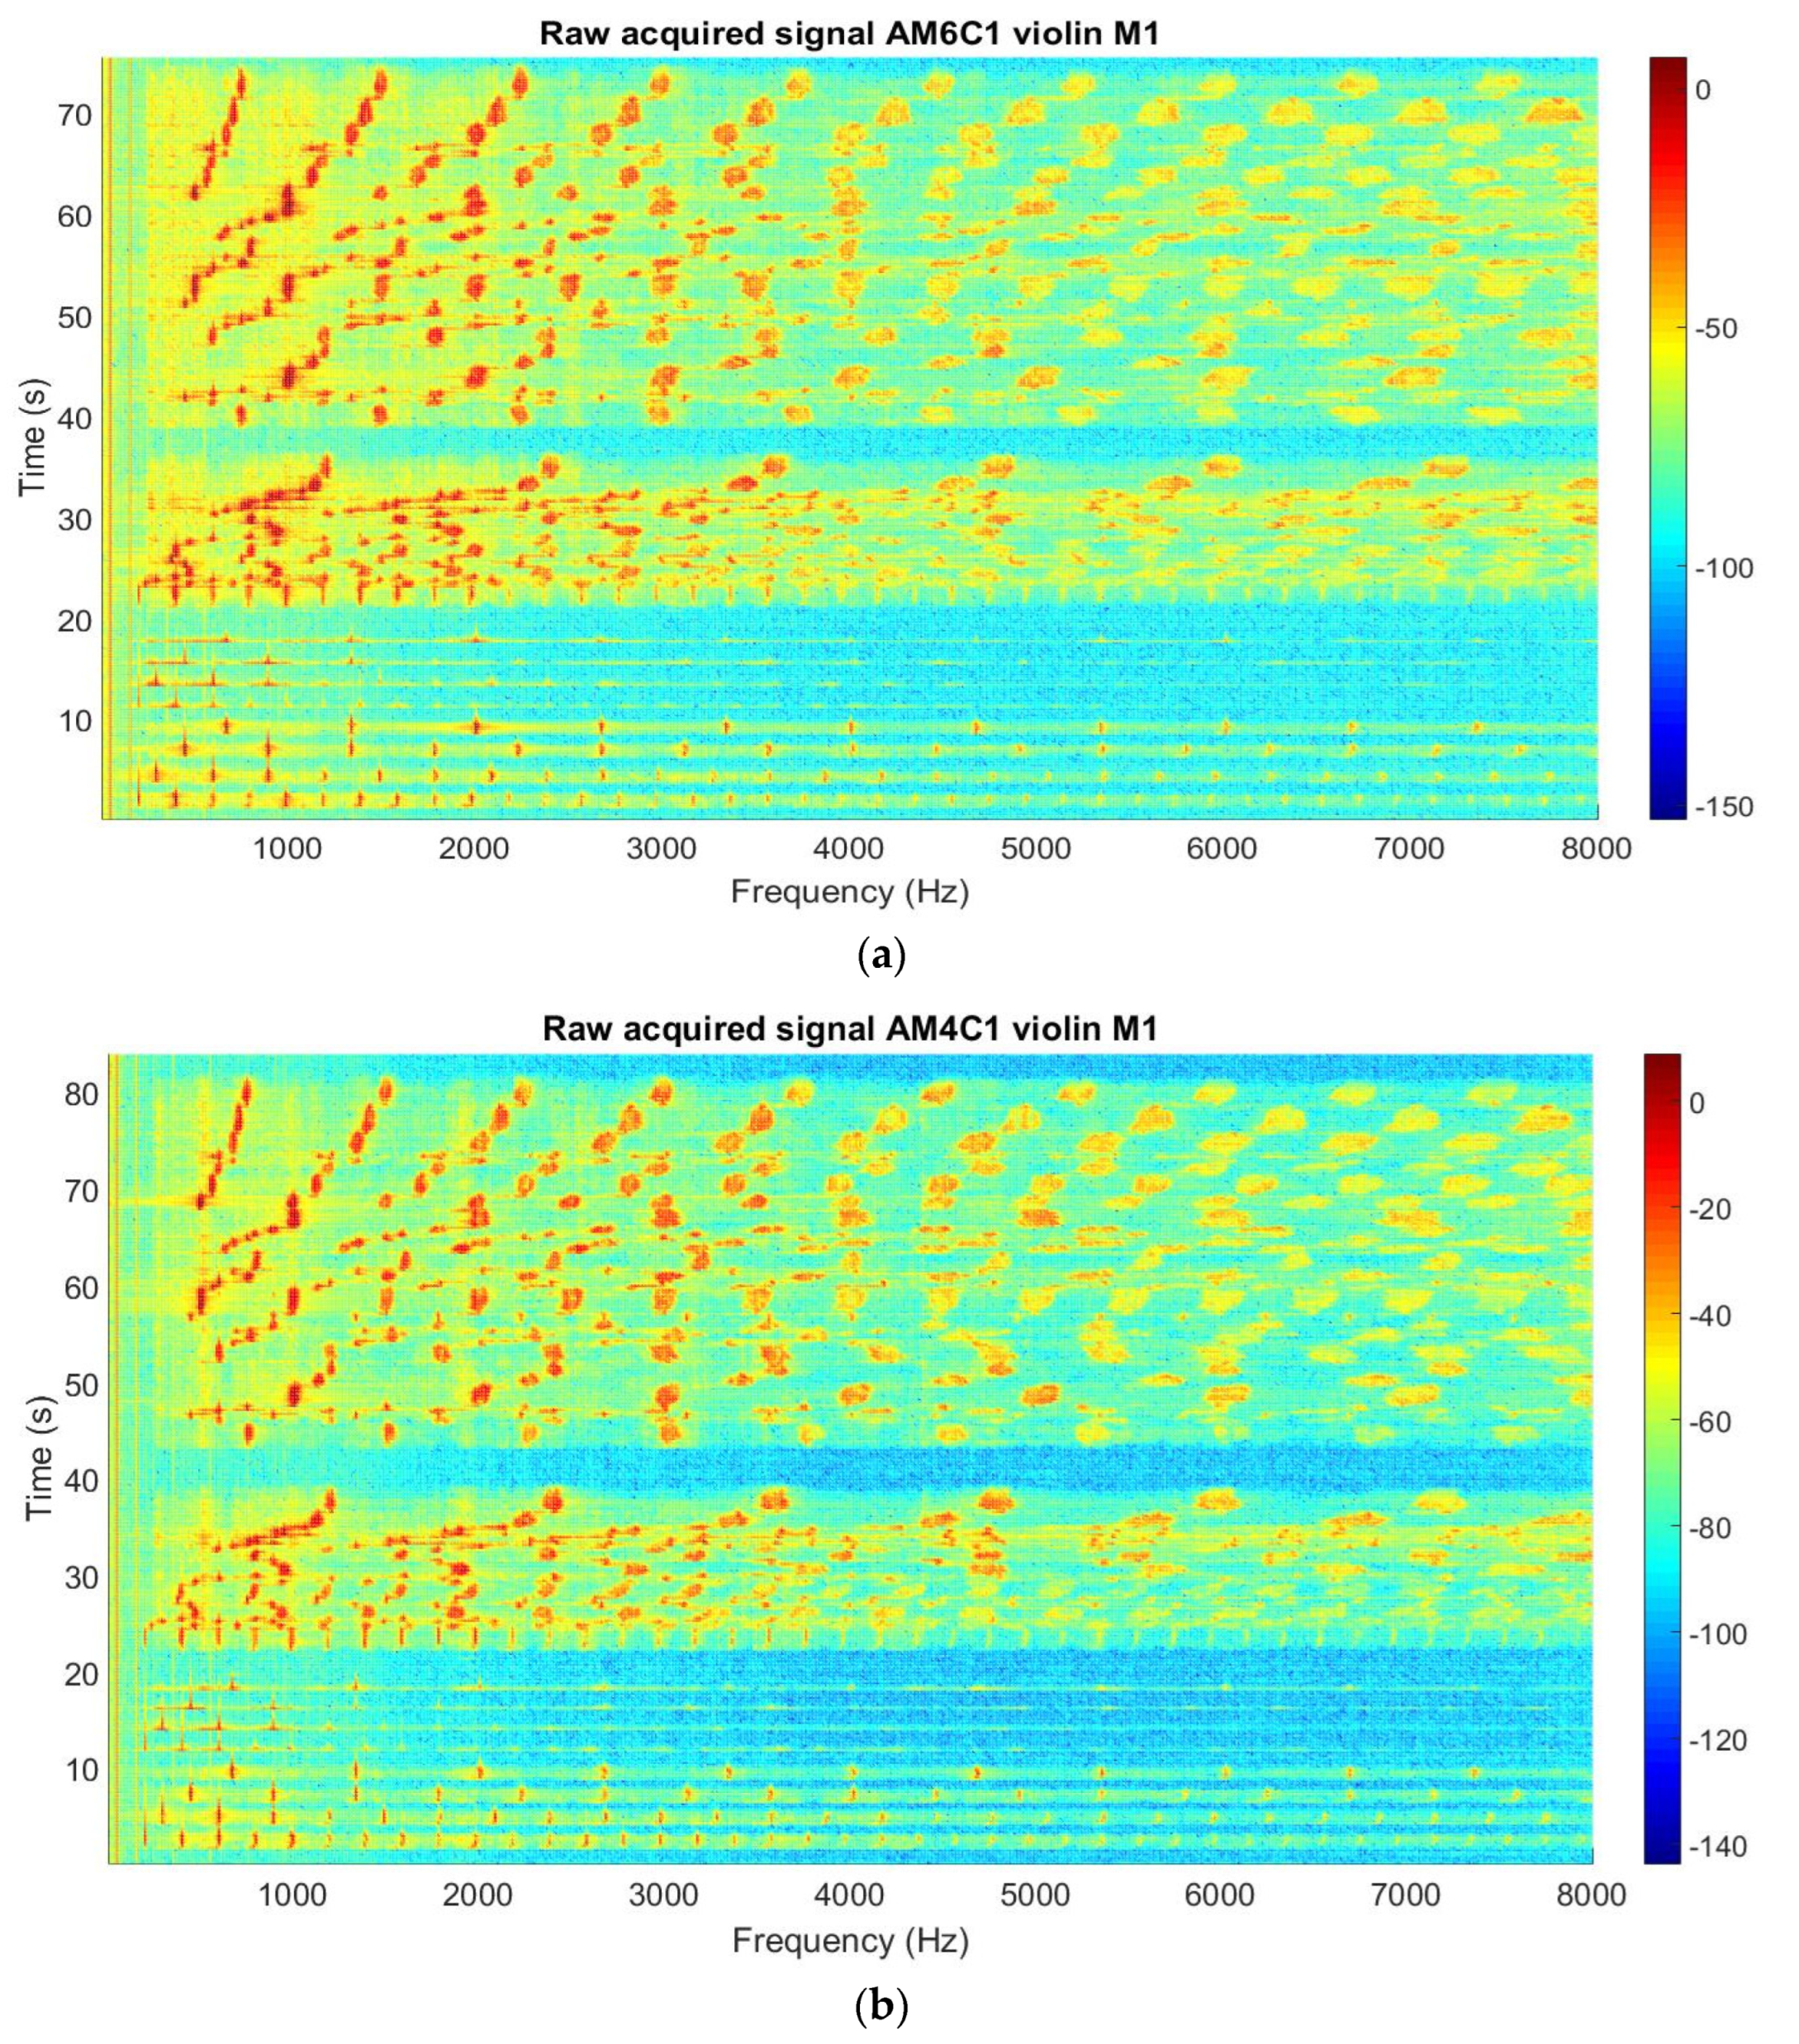
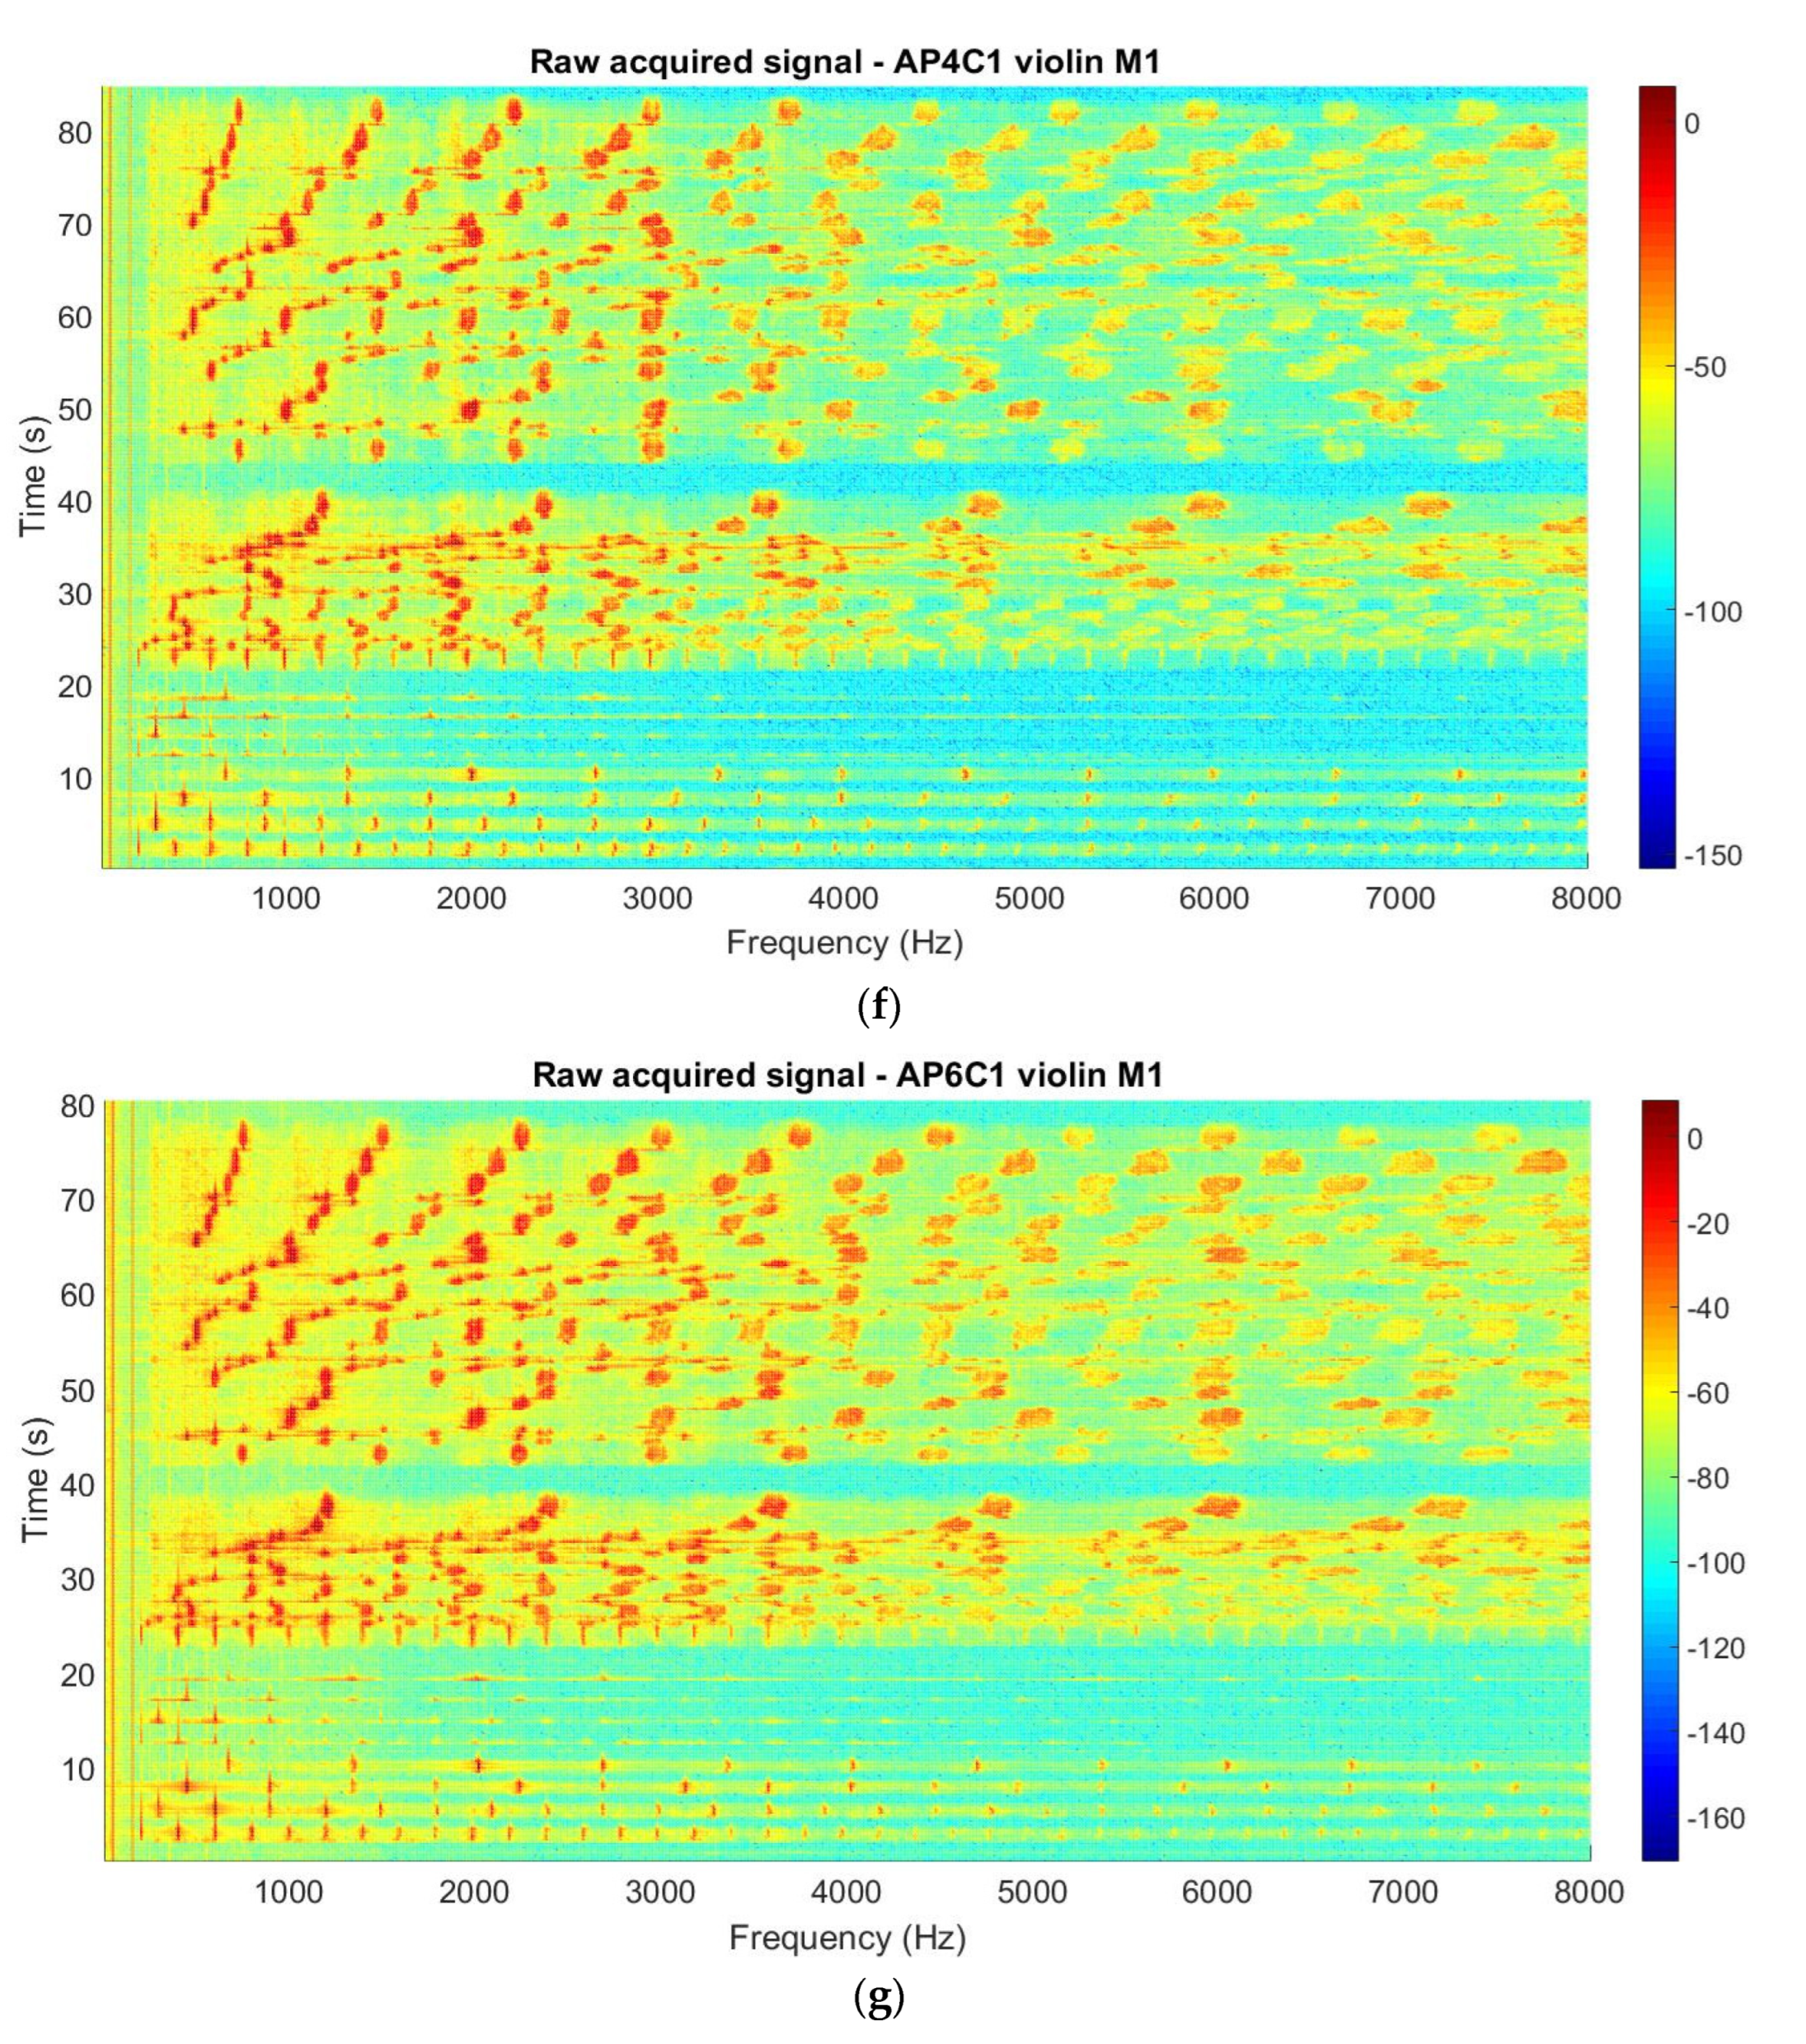
2.2.1. The Acoustic Recording

Given that the music itself represents an acoustic architectural edifice, of which the basic level is the individual notes characterized by frequency, timbre, pitch, and duration, for the acoustic and psycho-acoustic analyses a fragment of the basic musical sounds was chosen, produced by the free strings of the violin, as well as complex but relatively short musical sequences to fit the respondents’ maximum attention threshold [4,5,6,7,8]. Thus, the acoustic passage consisted of four fragments (free strings; Pizzicato-style stringing; a fragment from Concerto No. 1 in G minor op.26, the first cadence of the solo violin, composed by Max Bruch; and an excerpt from Opera Thaïs, Meditation for violin and orchestra, composed by Jules Massenet). It was played in a concert hall by the same professional violinist on all violins studied [25,26]. A sequence during the recordings of the musical samples on the studied violins can be seen in Figure 3. Professional recording equipment (24 bits, 48,000hz) and a special AKG microphone for sounds emitted by the strings were used.

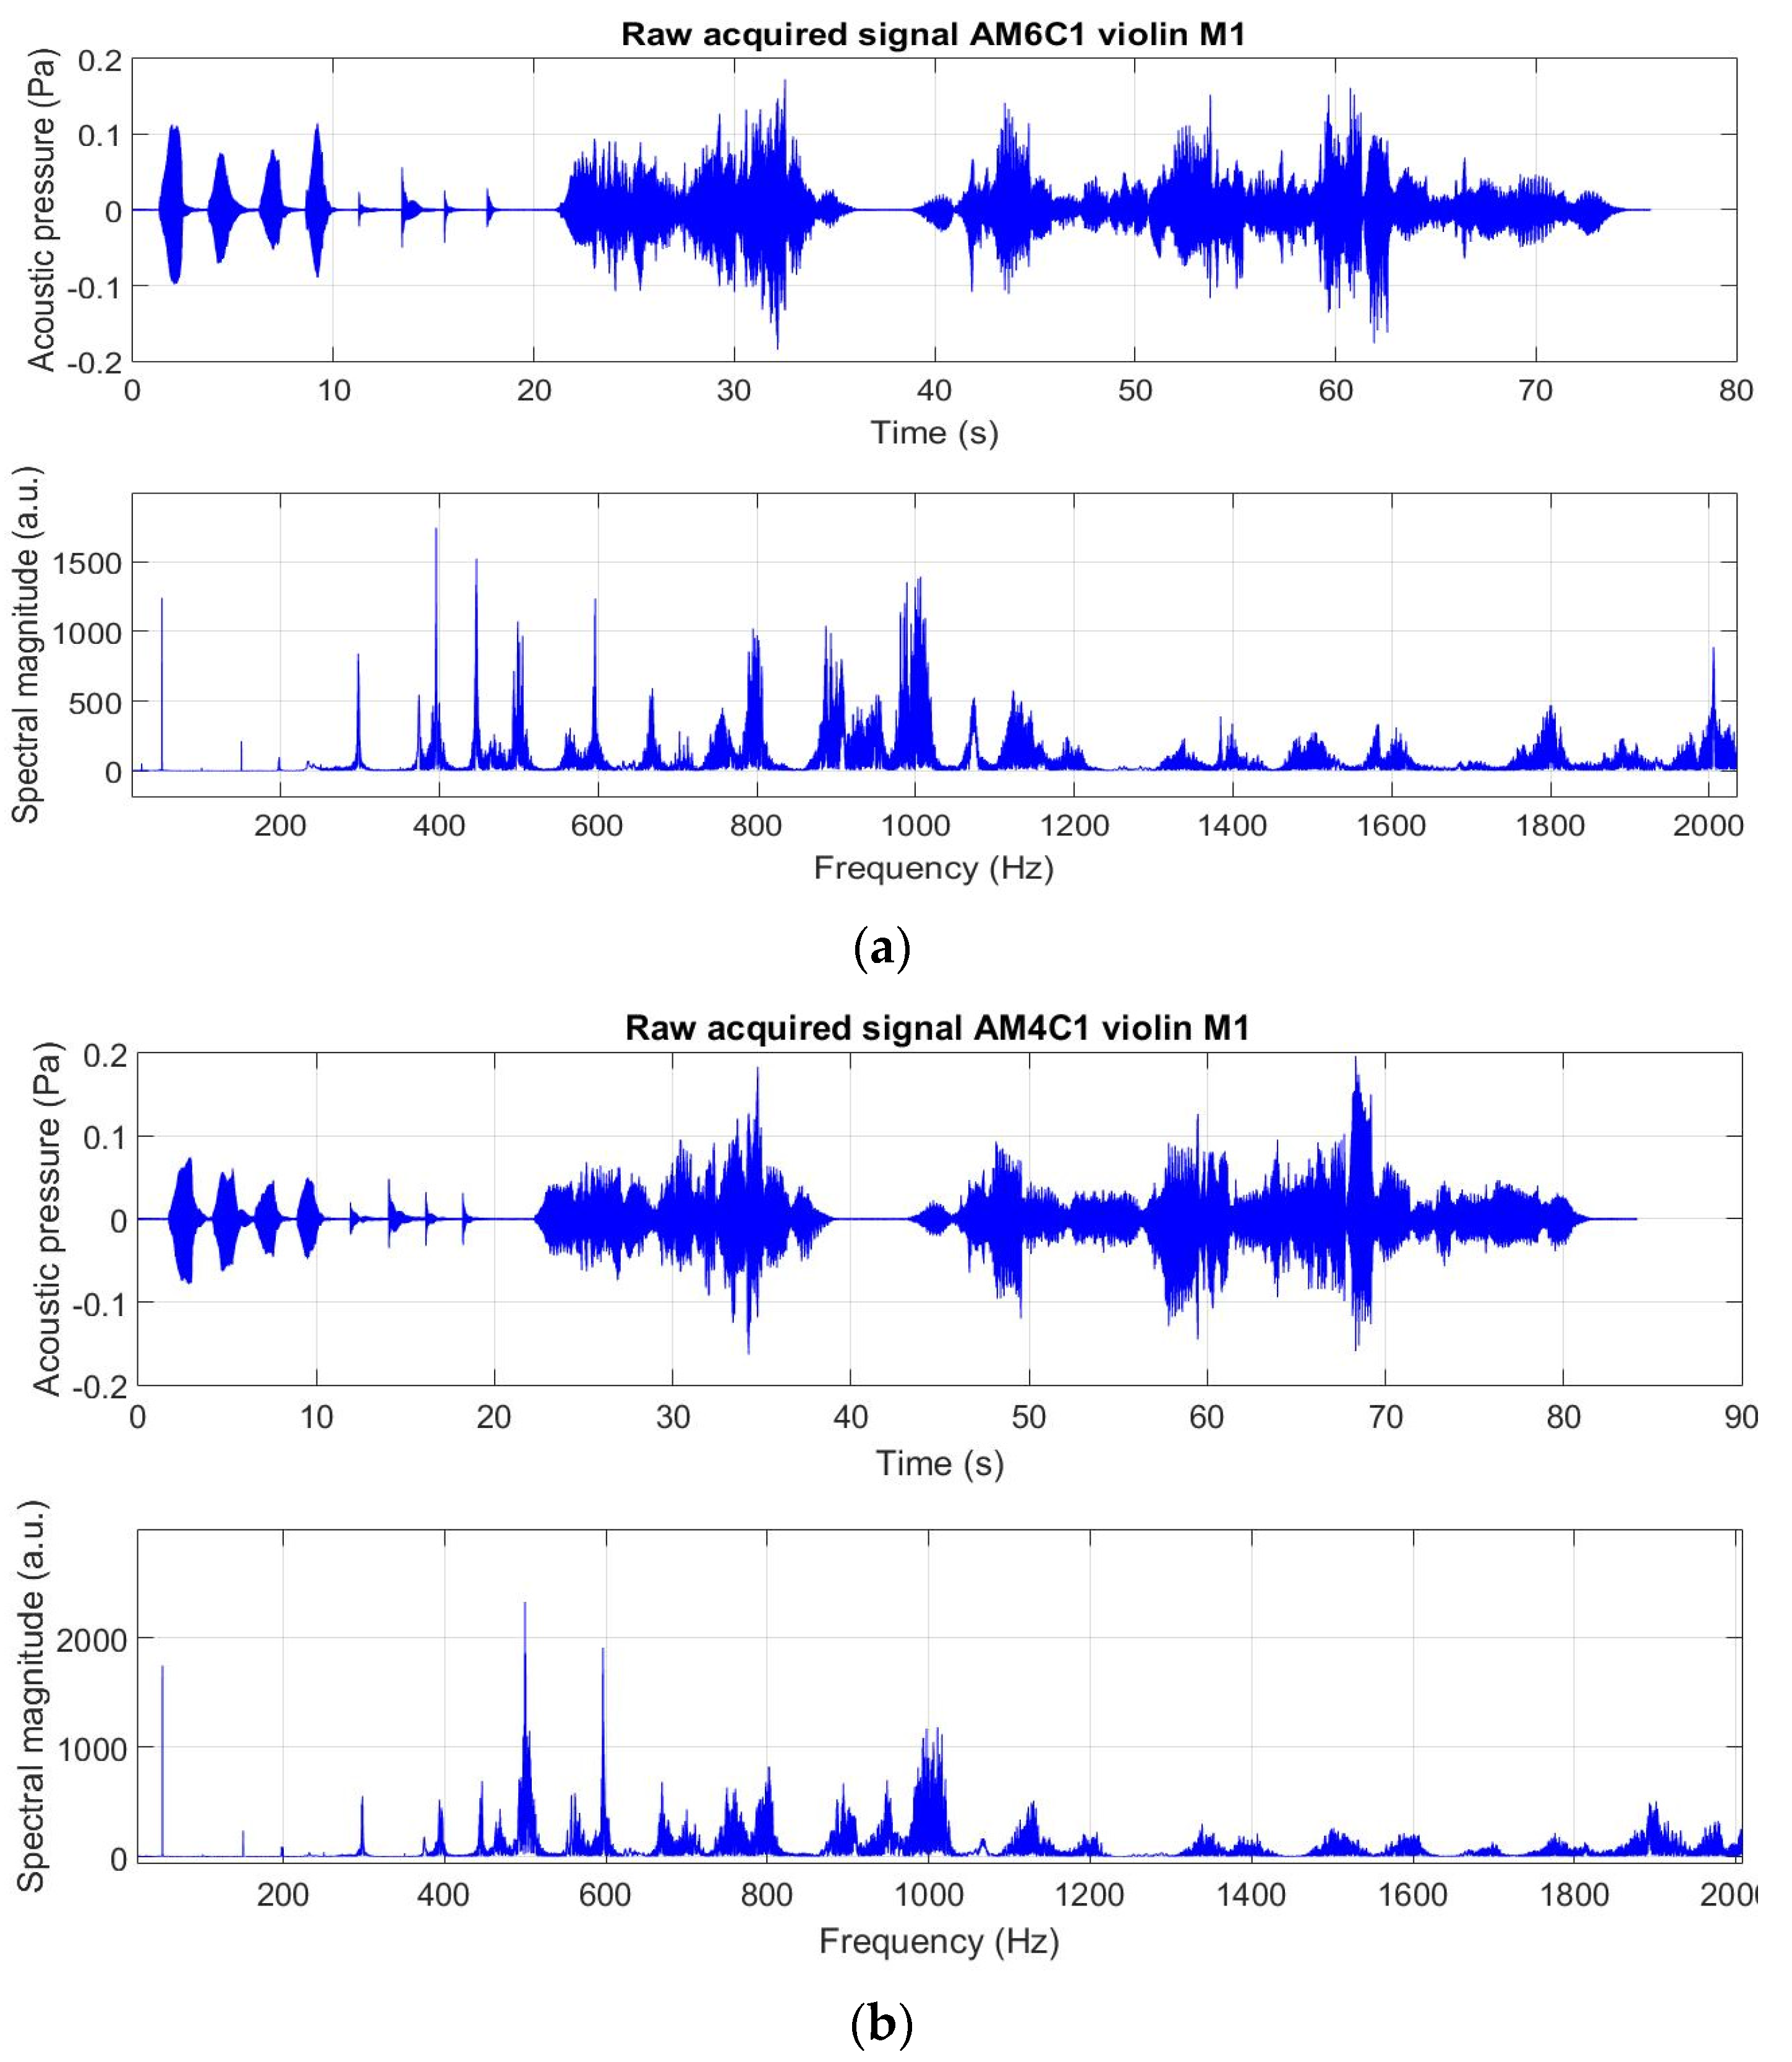
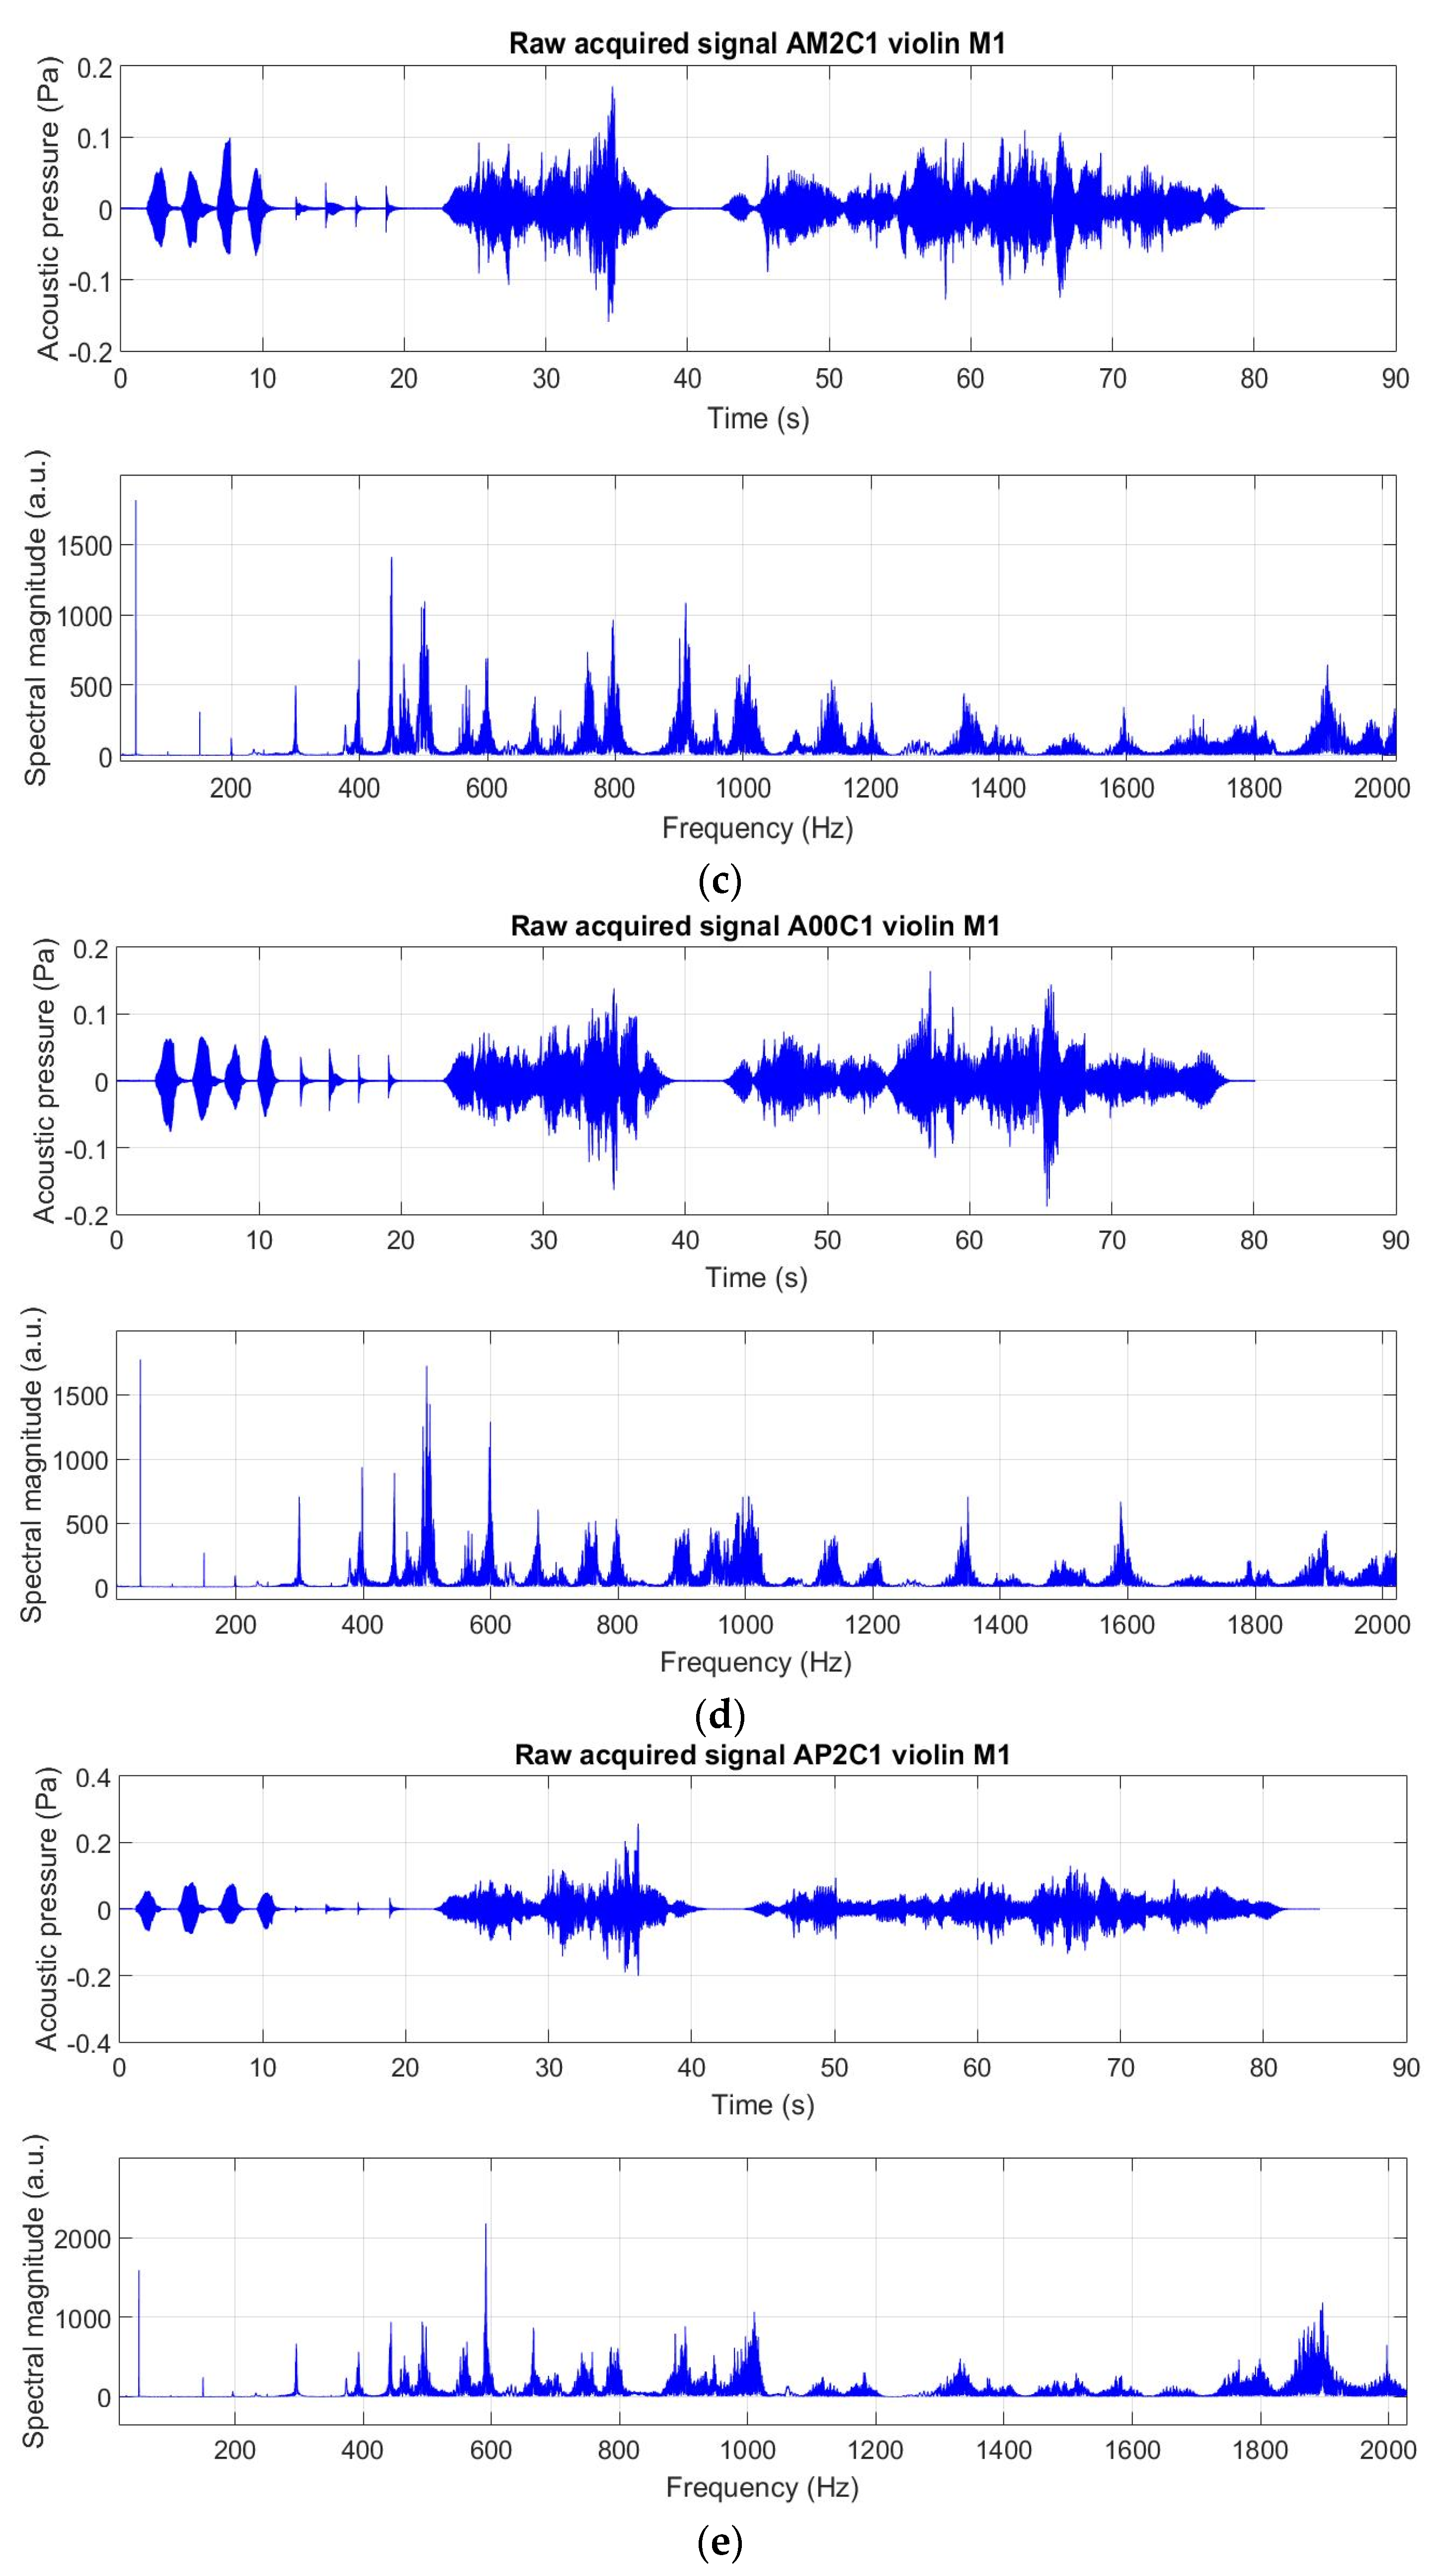
2.2.2. The Signal Processing

After recording the audio signals, the mathematical function of frequency decomposition, known as the fast Fourier transform (FFT), was used. By applying FFT, the fundamental frequencies and, therefore, the heights that were present in the raw signal were determined [5,6,7,8,9]. Thus, the audio signals were analyzed based on time domain and frequency domain. Subsequently, based on the FFT analysis, the short-time Fourier transform (STFT) analysis was performed, which highlighted the representation in the frequency range or spectrum of a short time interval of the input signal [5,6,7,8,9]. In order to chromatically observe the variations of the heights and the ways in which the strings change, the spectrograms were constructed adding the time dimension to the analysis of the discrete Fourier transform (DFT). For this purpose, a program was developed in MATLAB based on which Fourier analyzes were performed, extracting frequency spectra, mode frequencies, spectrograms, and the occurrence frequency of vibration frequencies known in statistics as mode frequency. Figure 4 presents the recorded acoustic signals in time domain.

2.2.3. The Psycho-Acoustical Evaluation

The psycho-acoustical evaluation was based on the recording of three musical sequences [25], with a total duration of 1 min. The evaluation was performed by 31 advised listeners (experienced musicians) based on the playback of the recorded signals. The artistic impressions were quantified in a questionnaire that followed the evaluation on a scale from 1 to 5, where 1 represented the weakest acoustic impression and 5 the best acoustic impression of the following criteria: amplitude of the sounds; clarity of the sounds; brightness and strength of the tone; warmth and silkiness of the sounds; equality of the sounds on all four strings [27]. With the respondents’ agreed consent requested before completing the survey, they were also asked about their gender, age, and artistic experience.

2.2.4. The Statistical Data Processing Method

Statistical data processing and the correlation between the acoustic features of the unfinished instrument (i.e., vibration frequencies) and the respondents’ characteristics (of age, musical experience, and gender) were first verified using discriminant function analysis. For this method, STATISTICA 8.0 (StatSoft 2007) was used, following Zar’s instructions (1974) [28,29]. The individual ability to discriminate the variables was analyzed with the value of Wilks’ lambda and F to enter. To explain the scores resulting from the artistic evaluation of the instruments by the subjects, a mixed spline model was chosen.

3. Results

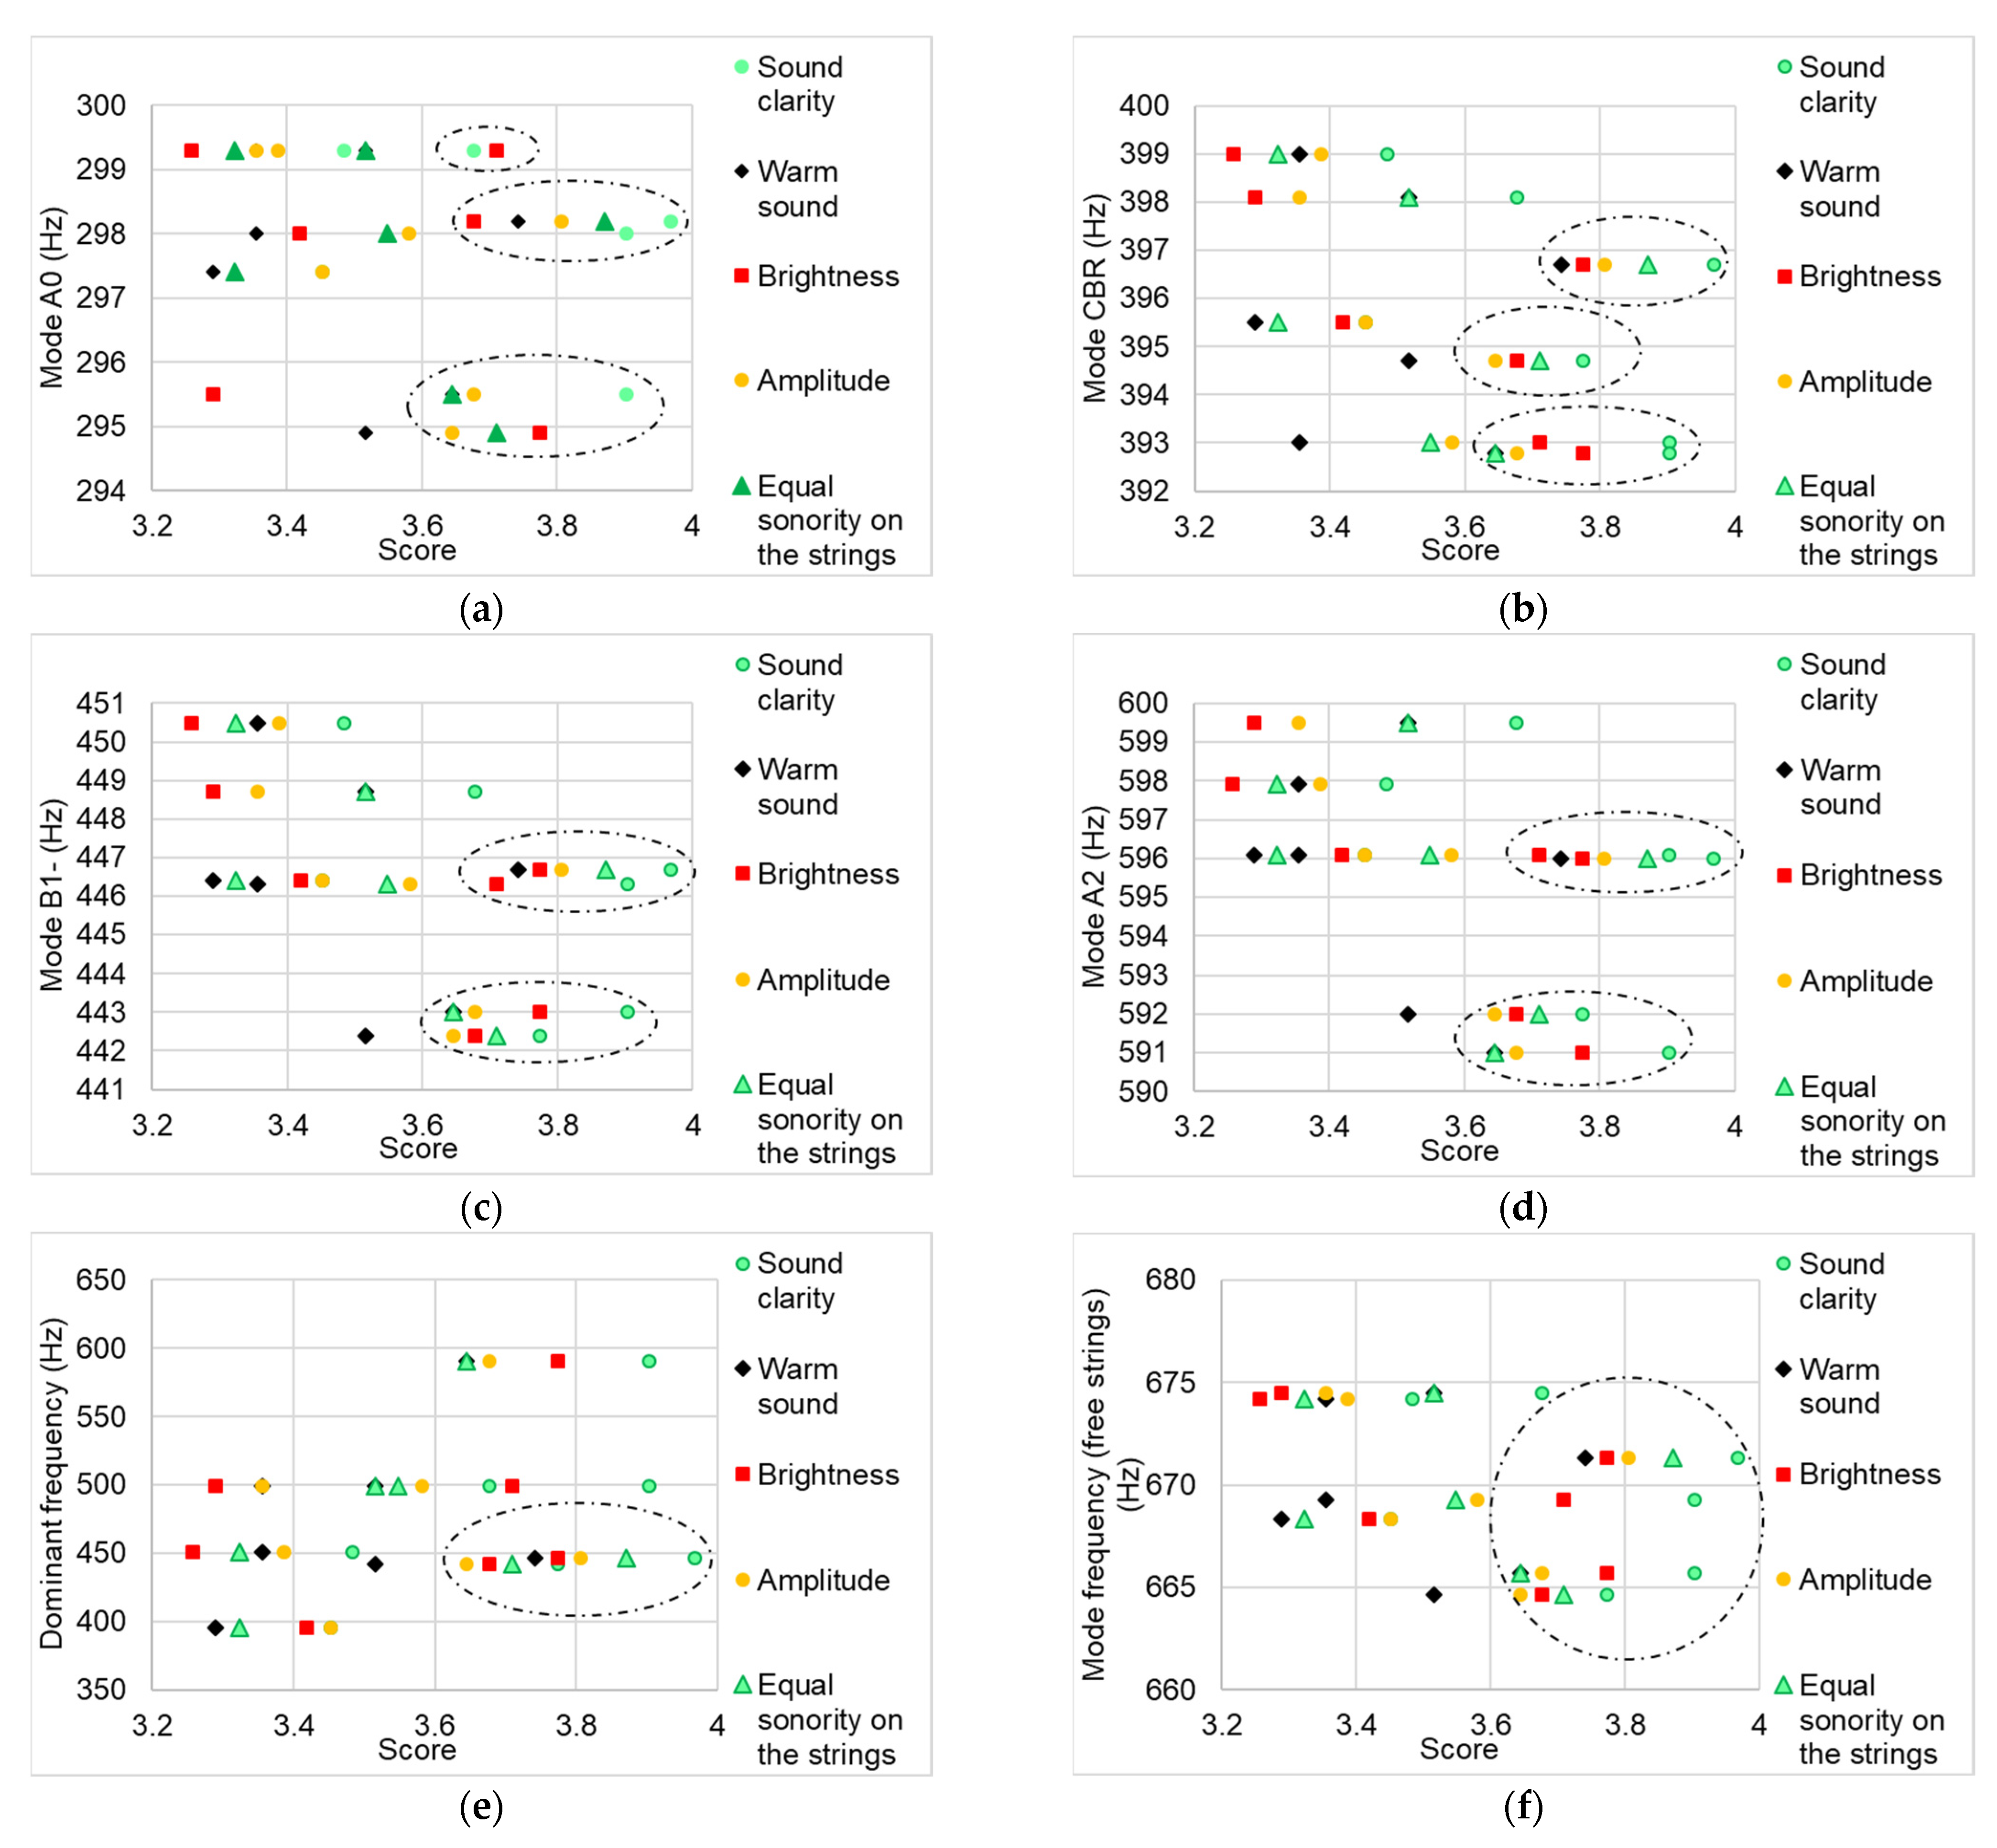
3.1. Results of the Acoustic Analysis

In the first stage of the signal analysis, the time and frequency analyses were obtained for each violin tested (Figure 5). In the time analysis graphs (those at the top of each figure), the signal for each recorded audio sequence (as shown in Figure 4) is distinctly observed. Although the acoustic fragment was performed by the same violinist, there were differences in the duration of the signals and their sound pressures from one violin to another. The graphs presenting the frequency analysis (at the bottom of each figure) show the frequency spectrums and their magnitudes expressed in arbitrary units (noted a.u.). Based on the FFT, the specific modes of each analyzed violin were extracted in the low frequency range (100–700 Hz), these being considered signature modes, providing the specificity of each violin and always being found in the spectral analysis of that violin, regardless of the musical sample performed [5,15,24].
The values regarding the signature modes and the dominant frequencies were extracted and centralized in Table 1. It is observed that for violins AM2 and AP4 the dominant frequency with the highest amplitude in the frequency spectrum is identical with the frequency of the B1- mode. For the AM6 violin, the dominant frequency also corresponds to the CBR mode, and for the AP2 violin this corresponds to the B1+ mode frequency. For violin AP6, two dominant frequencies were identified, corresponding to the bending mode B1- and air cavity mode A2, respectively, while for violins A00 and AM4 the values are different. For all violins, the frequency of the B1− is in the immediate vicinity of the fundamental pitch (frequency = 440 Hz). From the statistical analysis of the signals processed with STFT, regarding the frequency of occurrence of certain frequencies, the values of the mode frequency were extracted with the highest frequency of occurrence (Table 1). The frequency mode for the free string and Pizzicato-style excitation corresponds to corpus mode C4, according to [13,14,15,16,17]. Figure 6 shows the spectrograms for the seven violins analyzed.
Figure 7 presents the comparison between the mode frequencies for the different acoustic sequences. In the case of free string and Pizzicato-style excitation, it is observed that the value of the mode frequency differs between the two styles of string excitation, regardless of the type of violin. On the other hand, there is a gradual increase in the values of the mode frequency from the violin with the thinnest plates (AM6C1) to the reference violin (A00C1). In the case of violins with thickened plates, the anisotropy of the anatomical structure of the material and the density of the resonant wood influences the frequency response of the violins (Figure 7a). The mode frequencies extracted from the musical part vary between 1800 and 2800 Hz, resulting from the musical construction of the performed sequences. The violins with the highest mode frequencies are AM4C1 and AP2C1.
According to [30], violins with high acoustic qualities are characterized by high amplitude peaks around the frequencies of 275 Hz, 450 Hz, 550 Hz, and 2500 Hz, and smaller ones around the frequency of 1000 Hz. Thus, the specific values of the A0 mode obtained in this study vary between 294.3 and 299.3 Hz. For the corpus mode (CBR), the frequency values vary between 392.8 and 399 Hz. The first bending mode B1-, which generally appears around the frequency of 450 Hz according to [14,15], presents the following values in the case of the analyzed violins: minimum 442.4 Hz and maximum 450.5 Hz. Mode B1+ according to [14,15], or corpus mode C3 according to [31], is formed around the frequencies of 530–550 Hz, and the second cavity mode A2 is around 590 Hz [32]. In the current acoustic analysis, it is found that the values of A2 are slightly higher, varying between 591 and 599 Hz. Following the statistical analysis regarding the frequency of occurrence of frequencies (mode frequency), it is found that the excitation of free strings with the bow presents the most frequent frequency in the acoustic spectrum around the value of 664–674.5 Hz, corresponding to corpus mode C4. The only violins that show the same mode frequency values for both the free string and Pizzicato style are the AP4 and AP6 violins (Table 2). In terms of the mode frequency recorded for the musical part, the reference violin A00 is the only one that records the value of 2500 Hz according to [30].

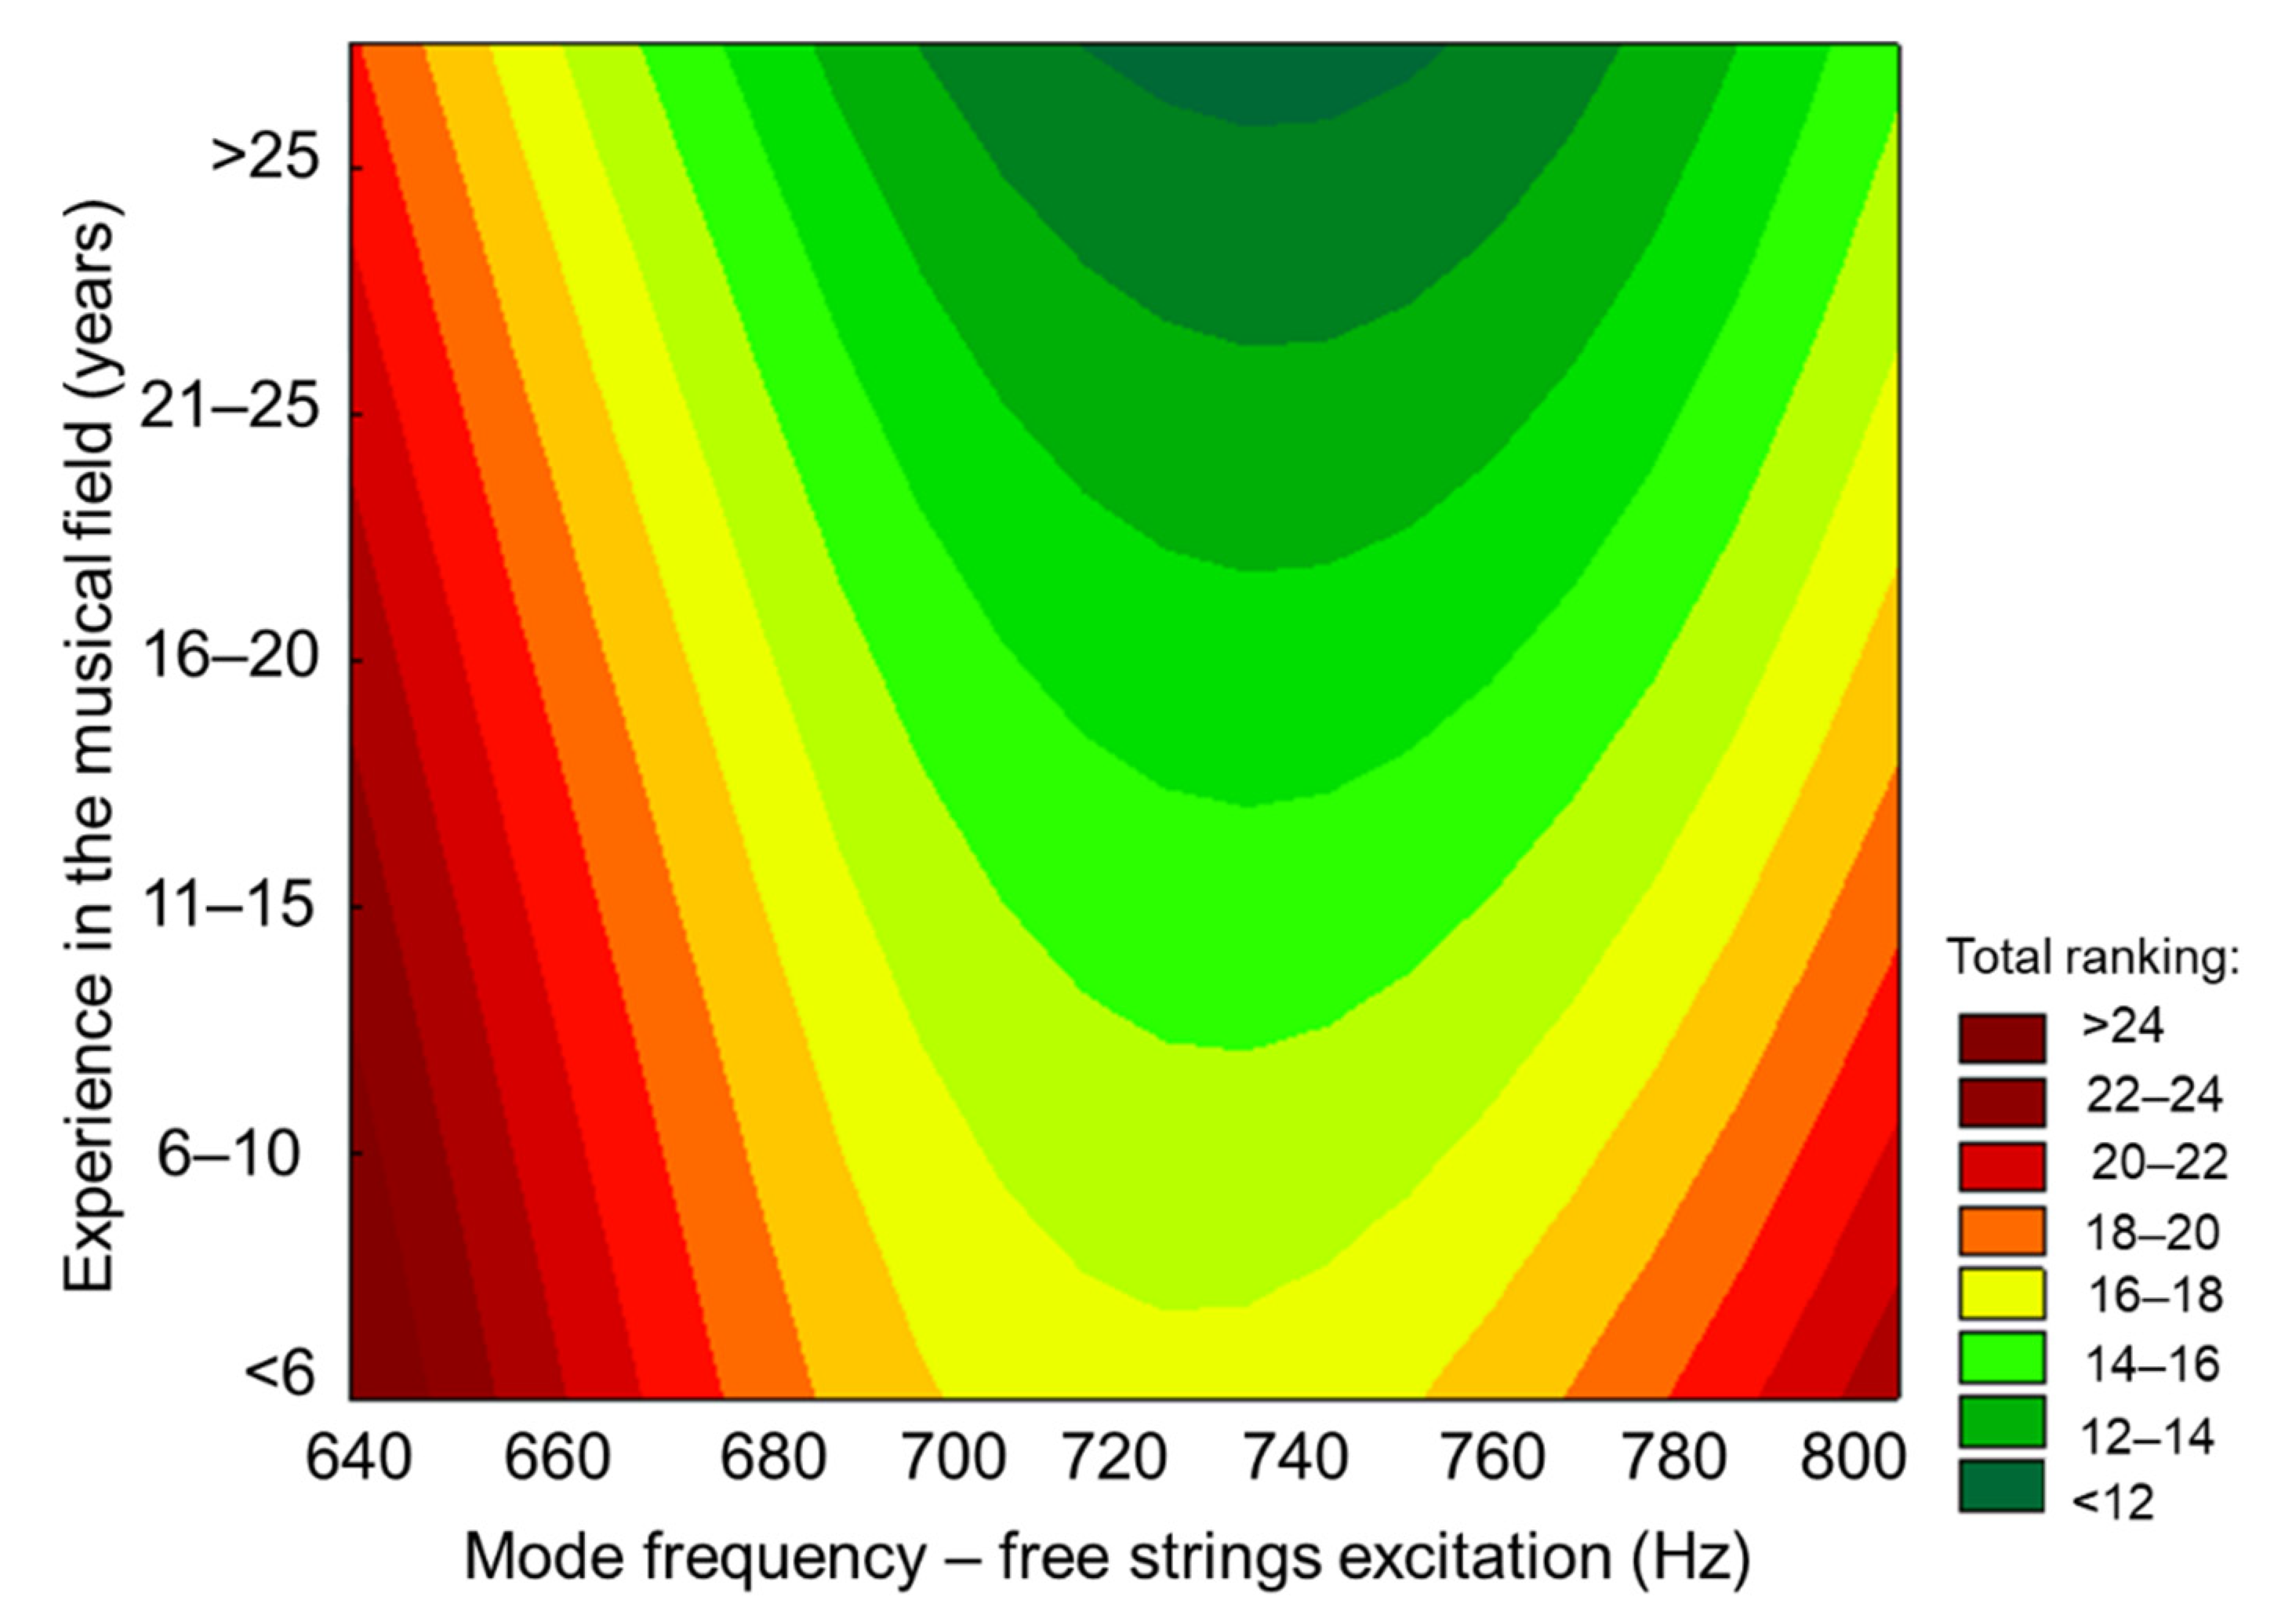
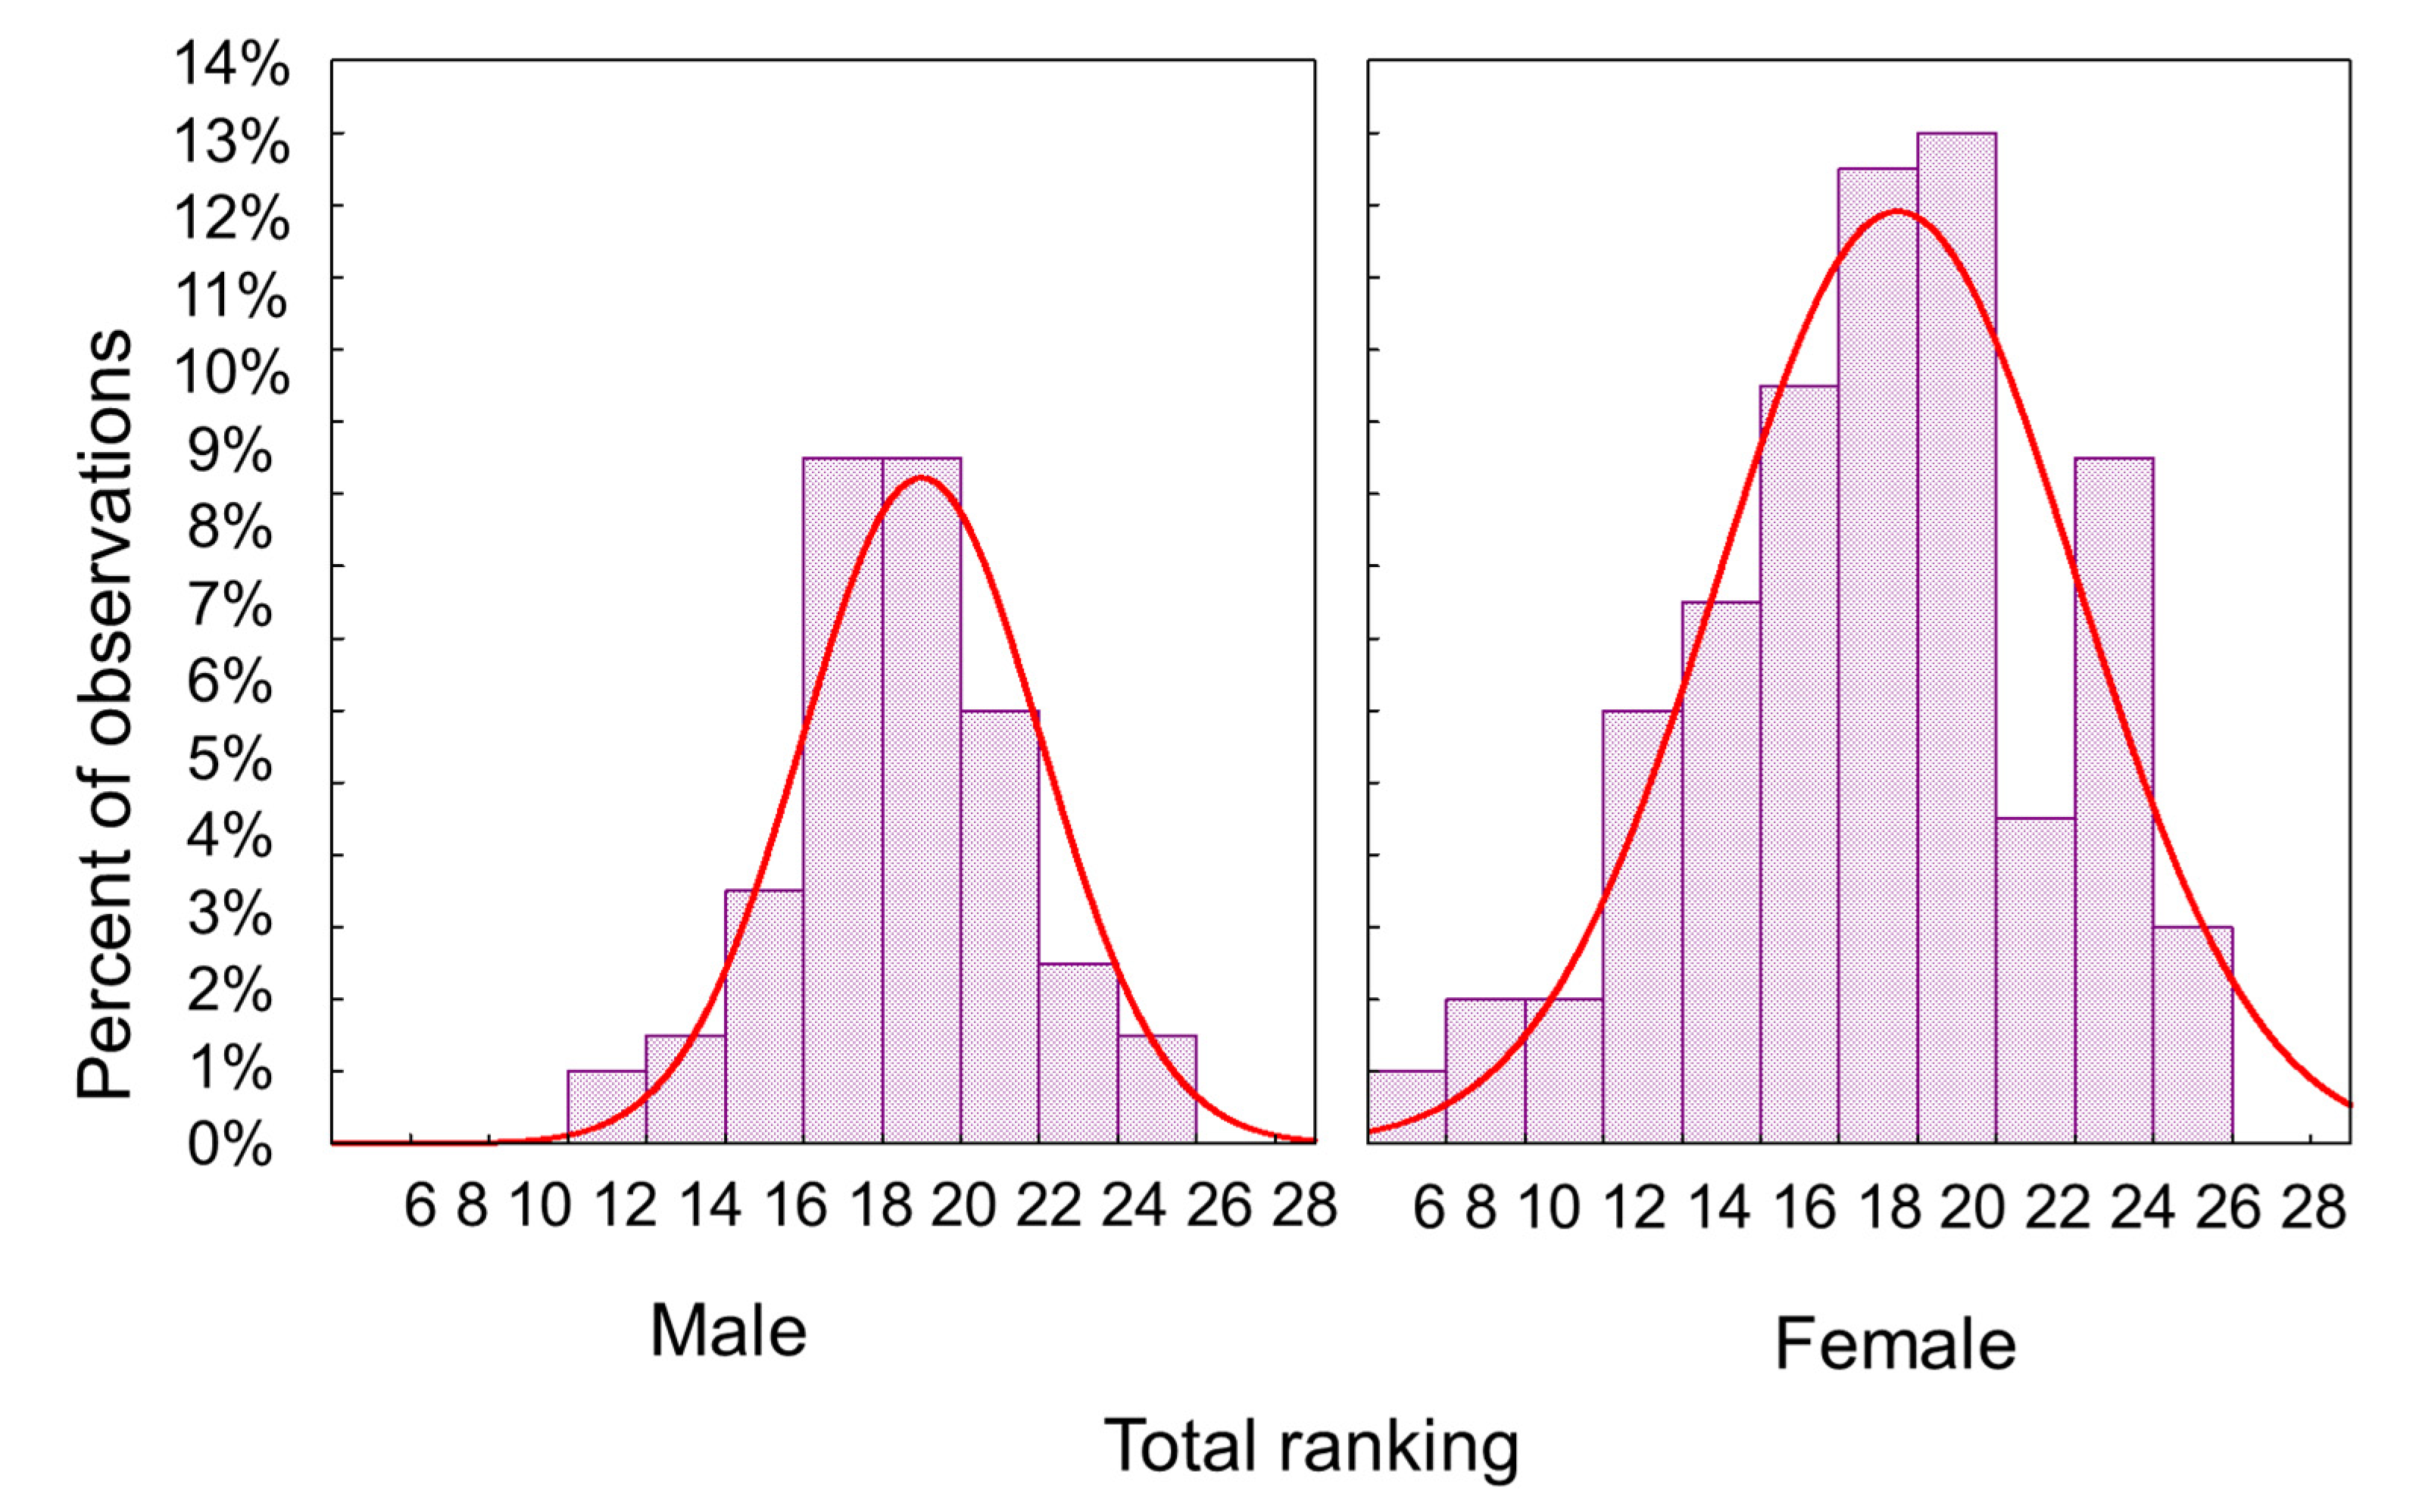
3.2. Results of the Psycho-Acoustic Analysis

The results obtained after processing the answers given by the 31 listeners (experienced musicians) who were volunteer responders to a questionnaire with five criteria, are presented in Table 2.
A detailed description of this survey was given by [27]. With an average total score between 16 and 19 (out of a maximum of 25), it is confirmed again that the differences between the seven violins are only slight. The best results according to the opinion of the listeners belong again to the violins with thickened profiles, while the thinned violins obtained lower scores.
The highest scores obtained from the survey are for AP2C1 and AP6C1 (Table 2). It is observed that there is a close correlation between these scores and the values of the dominant frequency that coincides with the most prominent mode in the low-frequency range, the A2 mode (Table 1). In Figure 8, a comparison ranking the violins is presented. It is worth mentioning that the chronological order in which the violins were heard in the survey was: A00C1; AM2C1; AM4C1; AM6C1; AP4C1; AP2C1; AP6C1. The rankings for all the analyzed criteria gave the following order: AM2C1; AM6C1; A00C1; AM4C1; AP4C1; AP2C1; AP6C1. In analyzing the scores obtained by the violins at the end of the questionnaire, it was found that they are higher than those in the first part of the questionnaire.

4. Discussion

For luthiers, it is important to correlate the artistic impressions of the violinists with the geometrical and material parameters of the produced violins. In this study, we investigated the statistical links between the results of the acoustic analysis of the signals and the artistic impressions quantified in the scores given by the respondents to the musical samples played on the studied violins. It was found that there are a number of factors that influence the assessment of the acoustic quality of violins (age, experience, gender, and the position of the musical sample in the questionnaire).
The variables that significantly influenced (p ≤ 0.05) the respondents’ scores given to the clarity of the sound are only their gender and experience (Table 3). Respondents with more musical experience (especially those with over 26 years of experience) were more demanding in assessing the clarity of sound and offered the widest range of scores in assessing this quality. Moreover, female respondents showed a wider and more diverse capacity than men in assessing the clarity of sound, i.e., to distinguish between the steps of the scale of this variable (Table 3).
The musical experience of the respondents influenced to the highest degree the appreciation of the warm sound quality (Table 4). The gender of the respondent also had some importance. Thus, respondents with at least 21 years of music experience gave lower scores to the warm sound feature than respondents with less experience. Men also scored higher on this quality than women.
In the case of the criterion of bright sound, the variables that significantly influenced the scores given are only the type and experience of the respondents (Table 5). The matrix of multiple comparisons between the warm and bright tone appreciation steps, performed using the Kruskal–Wallis nonparametric test, highlights that the most significant differences are between groups two (6–10 years) and six (over 26 years) in experience. Respondents with less experience tend to give higher scores to this tone quality. Moreover, female respondents generally score lower than men in this tone characteristic (the median survey for warm and bright tone is three for women and four for men).
The variables that influence the scores given to the amplitude of the sounds are, in descending order of importance: the experience of the respondents, their gender, and the frequency of vibration in the case of free string excitation (Table 6). Respondents with the longest experience (over 26 years) gave scores with a lower step (median 3 versus 4 for the others) than the other categories of experience. Higher scores given to sound amplitude are explained by lower vibration frequencies in case of free string excitation.
In the case of evaluating the equal sonority on all four strings, the variables that significantly influenced the scores were the type and experience of the respondents (Table 7). The frequency of vibration in the free string mode also had a certain contribution. The tendency to associate low scores for equal sonority on strings with lower free string vibration frequencies was noticed.
The overall contribution of the explanatory variables to the total ranking variations was only 15%. The only determinants of the total ranking are, in descending order of significance: the experience of the respondents, their gender, and the frequency of vibration in the free string mode. Women, as well as respondents with more musical experience, scored lower than the other categories of respondents. The only significant frequency of those extracted from the acoustic analysis that contributed to the total ranking was the low vibration frequency, perceived best in the case of free string excitation. The connection between experience, mode frequency, and total ranking is shown graphically in Figure 9 and Figure 10.
The violins that recorded for the A0 mode a frequency of 295 Hz and 298 Hz were perceived as having a clear sound, with amplitude and equality on all strings (Figure 11a). For the CBR mode, the frequency of 396 Hz was perceived by the respondents, in descending order, as a clear sound and with equality on all strings, amplitude, brightness, and warmth (Figure 11b). Violins whose frequencies for the B1- mode were around 446–447 Hz were also appreciated for their clear sound and with equality on all strings, amplitude, and brightness (Figure 11c). For the second cavity mode A2, the highest scores for acoustic sound quality were assigned to the frequency of 596 Hz (Figure 11d). The dominant frequency evident in the highest scores for most of the criteria assigned by the artists was around 450 Hz (Figure 11e). The most frequent harmonic perceived by respondents with high acoustic qualities was around 670 Hz, followed by 665 Hz (Figure 11f). For the Pizzicato style, the clarity of the sound and the brightness were given by the frequency of 665 Hz emitted by the violins, a value that is also found in the case of exciting the free strings with the bow (Figure 11g). For the musical sequence analyzed, the violins that emitted sounds around the frequency of 1800 Hz were appreciated as having the warmest sound, as well as being bright, ample, and equal on all strings. The frequency of 2800 Hz comes close to the acoustic quality in the respondents’ preferences, but only for the clarity and brilliance of the sounds (Figure 11h).
The authors in [32,33,34] mention a series of objective acoustic parameters (spectral centroid, attack time, spectral flow, spectral irregularity, energetic characteristics of the acoustic signal, and harmonic characteristics) on the basis of which the acoustic quality and timbre of violins can be assessed according to psycho-acoustic perceptions. In this stage of the study, the authors investigated the correlation between the main resonant frequencies extracted from the FFT analysis and the psycho-acoustic perceptions of the respondents.

5. Conclusions

This paper presents the evaluation of the connection between the acoustic characteristics obtained by spectral analysis and the classification of violins analyzed on psycho-acoustic criteria.
The total scores revealed that the best result from all points of view was obtained by the violin with both plates thickened by 0.2 mm compared to the reference profile (AP2), followed, with equal scores, by the violin with both plates thickened by 0.4 mm (AP4) and the violin with a classical profile (A00) The scores for the violins with thinned plates were weaker, especially according to the psycho-acoustic analysis. The highest score was obtained by the violin with the thickest plates, which can be correlated with the two dominant frequencies extracted from the FFT analysis, whose values coincide with the frequencies of the B1- and A2 modes. In terms of sound clarity, the highest scores were obtained by the AM4C1 and AP2C1 violins, which correlate with the mode frequency extracted from the music sequence analysis. These two violins had the highest value of the mode frequency, 2800 Hz.
From the perspective of acoustic signal processing, this study presents a set of acoustic models associated with violins with modified geometric parameters. From the point of view of psycho-acoustic evaluation, the study highlights the variability in acoustic impressions depending on age, gender, musical experience, and the position of the sequence analyzed during the survey.
In future studies, the aim will be to determine the chromatograms in order to obtain high-resolution chroma profiles for the tested violins, as well as to analyze the acoustic differences produced by the application of the varnish on the violins.

Author Contributions

Conceptualization, M.C. and V.G.G.; methodology, M.C., V.G.G., F.D. and S.M.N.; software, M.M., F.D. and S.M.N.; validation, A.M.N., M.C. and V.G.G.; formal analysis, F.D., M.M. and M.C.; investigation, M.C., V.G.G. and A.M.N.; resources, V.G.G.; data curation, F.D. and M.M.; writing—original draft preparation, M.C. and V.G.G.; writing—review and editing, M.M. and S.M.N.; visualization, A.M.N., M.C. and V.G.G.; supervision, M.M. and S.M.N.; funding acquisition, M.C. and S.M.N. All authors have read and agreed to the published version of the manuscript.

Funding

This research was funded by a grant from the Ministry of Research, Innovation and Digitization, CNCS/CCCDI, UEFISCDI, PN-III-P2-2.1-PED-2019-2148, project number: 568PED/2020 MINOVIS, Innovative models of violins acoustically and aesthetically comparable to heritage violins, within PNCDI III.

Institutional Review Board Statement

Not applicable.

Informed Consent Statement

Not applicable.

Data Availability Statement

Not applicable.

Acknowledgments

Thank you A.P. Studio Brasov for signal recording and primary processing, as well as the Brasov Philharmonic for the concert hall provided during the tests. We also thank all the respondents who participated voluntarily in completing the survey, giving time to evaluate the violins studied.

Conflicts of Interest

The authors declare no conflict of interest.

References

  1. Saitis, C.; Fritz, C.; Scavone, G.P.; Guastavino, C.; Dubois, D. Perceptual evaluation of violins: A psycholinguistic analysis of preference verbal descriptions by experienced musicians. J. Acoust. Soc. Am. 2017, 141, 2746–2757. [Google Scholar] [CrossRef] [PubMed]
  2. Saitis, C.; Fritz, C.; Scavone, G.P. Sounds like melted chocolate. How musicians conceptualize violin sound richness. In Proceedings of ISMA 2019, International Symposium on Music Acoustics, Detmold, Germania, 13–17 September 2019; pp. 50–57. [Google Scholar]
  3. Fritz, C.; Curtin, J.; Poitevineau, J.; Tao, F.-C. Listener evaluations of new and Old Italian violins. Proc. Natl. Acad. Sci. USA 2017, 114, 5395–5400. [Google Scholar] [CrossRef] [PubMed]
  4. Giraldo, S.; Waddell, G.; Nou, I.; Ortega, A.; Mayor, O.; Perez, A.; Williamon, A.; Ramirez, R. Automatic Assessment of Tone Quality in Violin Music Performance. Front. Psychol. 2019, 10, 334. Available online: https://www.frontiersin.org/articles/10.3389/fpsyg.2019.00334 (accessed on 15 February 2022).
  5. Lenssen, N.; Needell, D. An Introduction to Fourier Analysis with Applications to Music. J. Humanist. Math. 2014, 4, 72–91. Available online: http://scholarship.claremont.edu/jhm/vol4/iss1/5 (accessed on 15 February 2022). [CrossRef]
  6. Dünnwald, H. Deductions of objective quality parameters on old and new violins. Catgut Acoust. Soc. J. 1991, 1, 1–5. [Google Scholar]
  7. Campbell, M. Objective evaluation of musical instrument quality: A grand challenge in musical acoustics. In Proceedings of the Meetings on Acoustics, Montreal, QC, Canada, 2–7 June 2013. [Google Scholar]
  8. Letowski, T. Sound quality assessment: Concepts and criteria. In Proceedings of the 87th Convention of the Audio Engineering Society (AES), New York, NY, USA, 18–21 October 1989. [Google Scholar]
  9. Woodhouse, J. The acoustics of “A0-B0 mode matching” in the violin. Acust. Acta. Acust. 1998, 84, 947–956. [Google Scholar]
  10. Woodhouse, J. On the playability of violins. Part I Reflect. Funct. Acust. 1993, 78, 125–136. [Google Scholar]
  11. Gliga, V.G.; Stanciu, M.D.; Nastac, S.M.; Campean, M. Modal analysis of violin bodies with back plates made of different wood species. BioResources 2020, 15, 7687–7713. [Google Scholar] [CrossRef]
  12. Stanciu, M.D.; Cosereanu, C.; Dinulică, F.; Bucur, V. Effect of wood species on vibration modes of violins plates. Eur. J. Wood Prod. 2020, 78, 785–799. [Google Scholar]
  13. Marshall, K.D. Modal analysis of a violin. J. Acoust. Soc. Am. 1985, 77, 695–709. [Google Scholar]
  14. Bissinger, G. Some mechanical and acoustical consequences of the violin soundpost. J. Acoust. Soc. Am. 1995, 97, 3154. [Google Scholar] [CrossRef]
  15. Bissinger, G. Structural acoustics of good and bad violins. J. Acoust. Soc. Am. 2008, 124, 1764. [Google Scholar] [CrossRef] [PubMed]
  16. Nadarajah, M.C. The Mechanics of the Soundpost in the Violin. Ph.D. Thesis, University of Cambridge, Cambridge, UK, 2018. [Google Scholar]
  17. Gough, C. Acoustic characterization of string instruments by internal cavity measurements. J. Acoust. Soc. Am. 2021, 150, 1922. [Google Scholar] [CrossRef] [PubMed]
  18. Dinulică, F.; Albu, C.T.; Vasilescu, M.M.; Stanciu, M.D. Bark features for identifying resonance spruce standing timber. Forests 2019, 10, 799. [Google Scholar] [CrossRef]
  19. Mania, P.; Fabisiak, E.; Skrodzka, E. Differences in the modal and structural parameters of resonance and non-resonance wood of spruce (Picea abies). Acta Phys. Pol. A 2015, 127, 110–113. [Google Scholar]
  20. Stanciu, M.D.; Mihălcică, M.; Dinulică, F.; Nauncef, A.M.; Purdoiu, R.; Lăcătuș, R.; Gliga, G.V. X-ray Imaging and Computed Tomography for the Identification of Geometry and Construction Elements in the Structure of Old Violins. Materials 2021, 14, 5926. [Google Scholar] [CrossRef]
  21. Bucur, V. Chapter 3—Mechanical characterization of materials for string instruments. In Handbook of Materials for String Musical Instruments; Springer: Berlin, Germany, 2016; pp. 93–132. [Google Scholar]
  22. Hutchins, C.M. The acoustics of violin plates. Sci. Am. 1981, 245, 170–187. [Google Scholar]
  23. Mihălcică, M.; Stanciu, M.D.; Nastac, S.M.; Dinulică, F.; Nauncef, A.M.; Roșca, I.C.; Savin, A. Signature Modes of Old and New Violins with Symmetric Anatomical Wood Structure. Appl. Sci. 2021, 11, 11297. [Google Scholar] [CrossRef]
  24. Stanciu, M.D.; Dinulica, F.; Bucur, V.; Gliga, G.V.; Nastac, S.M.; Campean, M. Changing the vibrational behavior of the wooden thin arched plates—the maestro violins experimental study case. Thin-Walled Struct. 2022, 174, 109042. [Google Scholar] [CrossRef]
  25. Nauncef, A.M.; Mihălcică, M.; Roșca, I.C.; Gliga, G.V.; Marc, R. Interdisciplinary approach to assessing the acoustic quality of violins. Rev. Artist. Educ. 2022, 24, 330–338. [Google Scholar]
  26. Zacharakis, A.; Pastiadis, K.; Reiss, J.D. An interlanguage unification of musical timbre: Bridging semantic, perceptual, and acoustic dimensions. Music Percept. Interdisc. J. 2015, 32, 394–412. [Google Scholar] [CrossRef]
  27. Mihalcica, M.; Nauncef, A.M.; Gliga, V.G.; Nastac, S.M.; Campean, M. Correlation between dynamic features of unvarnished and varnished new violins and them acoustic perceptual evaluation. In Proceedings of the International Conference on Wave Mechanics and Vibrations (10th WMVC), Lisbon, Portugal, 4–6 July 2022. [Google Scholar]
  28. Shapiro, S.S.; Wilk, M.P. An analysis of variance test for normality (complete samples). Biometrika 1965, 52, 591–611. [Google Scholar] [CrossRef]
  29. Zar, J.H. Biostatistical Analysis; Prentice-Hall Inc.: Englewood Cliffs, UK, 1974. [Google Scholar]
  30. Hansen, U.J.; Rossing, T.D. Normal modes of vibration in a violin. In Proceedings of the ASA/EAA/DAGA99 Meeting, Lay Language Papers, Berlin, Germany, 16 March 1999; Volume 635. [Google Scholar]
  31. Pyrkosz, M.; Van Karsen, C. Comparative Modal Tests of a Violin. Exp. Tech. 2013, 37, 47–62. [Google Scholar] [CrossRef]
  32. Stepanek, J.; Otcenasek, Z. Acoustical correlates of the main features of violin timbre perception. In Proceedings of the Conference on Interdisciplinary Musicology, Montreal, QC, Canada, 10–12 March 2005; pp. 1–9. [Google Scholar]
  33. Jiang, W.; Liu, J.; Zhang, X.; Wang, S.; Jiang, Y. Analysis and Modeling of Timbre Perception Features in Musical Sounds. Appl. Sci. 2020, 10, 789. [Google Scholar] [CrossRef]
  34. Wei, Y.; Gan, L.; Huang, X. A Review of Research on the Neurocognition for Timbre Perception. Front. Psychol. 2022, 13, 869475. [Google Scholar] [CrossRef] [PubMed]
Figure 1. The tested violins.
Applsci 12 08620 g001
Figure 2. The block diagram of the research.
Applsci 12 08620 g002
Figure 3. A sequence during the recordings of the professional violinist playing the first violin in the Brasov Philharmonic Orchestra.
Applsci 12 08620 g003
Figure 4. The acoustic signals in time domain, played on the violins.
Applsci 12 08620 g004
Figure 5. The acoustic signals played on the violins: (a) AM6C1; (b) AM4C1; (c) AM2C1; (d) A00C1; (e) AP2C1; (f) AP4C1; (g) AP6C1. (Legend: a.u. represents the notation for arbitrary units.).
Applsci 12 08620 g005aApplsci 12 08620 g005bApplsci 12 08620 g005c
Figure 6. The acoustic spectrograms of musical sequences for each studied violin: (a) AM6C1; (b) AM4C1; (c) AM2C1; (d) A00C1; (e) AP2C1; (f) AP4C1; (g) AP6C1.
Applsci 12 08620 g006aApplsci 12 08620 g006bApplsci 12 08620 g006c
Figure 7. The mode frequency in the case of: (a) free string and Pizzicato excitation; (b) musical part.
Applsci 12 08620 g007
Figure 8. Variation of psycho-acoustic perception in the form of scores for the five investigated acoustic criteria.
Applsci 12 08620 g008
Figure 9. Contour plot, spline smoothed, of total ranking against mode frequency—free string excitation and the musical experience.
Applsci 12 08620 g009
Figure 10. Histogram of total ranking categorized by gender (normal fitted).
Applsci 12 08620 g010
Figure 11. The correlation between the scores obtained for each criterion and signature modes: (a) mode A0; (b) mode CBR; (c) mode B1-; (d) mode A2; (e) dominant frequency; (f) mode frequency–free strings; (g) mode frequency–Pizzicato; (h) mode frequency–musical part.
Applsci 12 08620 g011aApplsci 12 08620 g011b
Table 1. The main frequencies extracted from frequency domain analysis. The bold values correspond to higher amplitudes from all frequency spectrums.
Tested Violins
Frequency (Hz)AM6C1AM4C1AM2C1A00C1AP2C1AP4C1AP6C1
Mode A0297.4298299.3299.3295.5294.9298.2
Mode CBR (C2)395.5393399.0398.1392.8394.7396.7
Mode B1-446.4446.3450.5448.7443.0442.4446.7
Mode A2596.1596.1597.9599.5591.0592.0596
Dominant frequency395.5499.4450.5499.4591.0442.4446.7/596
Mode frequency (free strings)668.34669.30674.19674.5665.7664.63671.31
Mode frequency (Pizzicato)665.13665.86670.81673.2664.9664.40671.45
Mode frequency (musical part)1846.202812.302360.102580.32804.21875.801874.30
Table 2. Rating of the tested violins from the viewpoint of the listeners (* 1—the highest score, 7—the lowest score).
Tested Violins
CriterionAM6CAM4CAM2CA00CAP2CAP4CAP6C
Sound clarity3.4523.9033.4843.6773.9033.7743.968
Sound warmth3.2903.3553.3553.5163.6453.5163.742
Brightness3.4193.7103.2583.2903.7743.6773.774
Amplitude3.4523.5813.3873.3553.6773.6453.806
Equal sonority on the strings3.3233.5483.3233.5163.6453.7103.871
Total16.93618.09716.80717.35418.64418.32219.161
The position in the respondents’ preferences *6475231
Chronological position in survey4321657
Table 3. The results of the multifactor discriminant analysis regarding sound clarity.
Independent VariablesWilks’ LambdaPartial LambdaF-Removep-LevelTolerance1-Tolerance
Violin type0.7870.9741.3800.2420.3500.650
Mode frequency—free string excitation0.7710.9940.3360.8540.4690.531
Mode frequency—Pizzicato excitation0.7840.9771.2120.3070.5470.453
Mode frequency—musical part0.7780.9850.7920.5320.3380.662
Age0.7740.9900.5360.7090.4090.591
Experience0.8100.9462.9110.0230.4100.590
Gender0.8140.9413.2090.0140.9780.022
Table 4. The results of the multifactor discriminant analysis regarding warm of sound.
Independent VariablesWilks’ LambdaPartial LambdaF-Removep-LevelTolerance1-Tolerance
Violin type0.8120.9761.2870.2760.3470.653
Mode frequency—free string excitation0.8140.9741.3980.2360.4600.540
Mode frequency—Pizzicato excitation0.8210.9661.8170.1270.5350.465
Mode frequency—musical part0.7990.9930.3790.8230.3400.660
Age0.8180.9691.6510.1630.3840.616
Experience0.8670.9154.8070.0010.3850.615
Gender0.8230.9631.9950.0970.9870.013
Table 5. The results of the multifactor discriminant analysis regarding bright tone.
Independent VariablesWilks’ LambdaPartial LambdaF-Removep-LevelTolerance1-Tolerance
Violin type0.7840.9691.6560.1620.3550.645
Mode frequency—free string excitation0.7740.9810.9870.4150.4550.545
Mode frequency—Pizzicato excitation0.7710.9860.7570.5540.5520.448
Mode frequency—musical part0.7850.9691.6680.1590.3340.666
Age0.7630.9960.2050.9360.4040.596
Experience0.8050.9443.0430.0180.4040.596
Gender0.8160.9323.7740.0060.9740.026
Table 6. The results of the multifactor discriminant analysis regarding sound amplitude.
Independent VariablesWilks’ LambdaPartial LambdaF-Removep-LevelTolerance1-Tolerance
Violin type0.7570.9681.6760.1570.3490.651
Mode frequency—free string excitation0.7720.9492.7440.0300.4480.552
Mode frequency—Pizzicato excitation0.7550.9721.4980.2040.5460.454
Mode frequency—musical part0.7580.9671.7730.1360.3330.667
Age0.7370.9950.2680.8980.4020.598
Experience0.7870.9313.8110.0050.4030.597
Gender0.7840.9363.5440.0080.9770.023
Table 7. The results of the multifactor discriminant analysis regarding the equal sonority on all four strings.
Independent VariablesWilks’ LambdaPartial LambdaF-Removep-LevelTolerance1-Tolerance
Violin type0.7210.9721.4840.2080.3500.650
Mode frequency—free string excitation0.7300.9602.1510.0760.4550.545
Mode frequency—Pizzicato excitation0.7070.9910.4730.7550.5450.455
Mode frequency—musical part0.7240.9691.6730.1580.3330.667
Age0.7150.9801.0280.3940.4110.589
Experience0.7840.8946.0850.0000.4110.589
Gender0.7450.9403.2670.0130.9770.023
Publisher’s Note: MDPI stays neutral with regard to jurisdictional claims in published maps and institutional affiliations.

