
FCNN-SE: An Intrusion Detection Model Based on a Fusion CNN and Stacked Ensemble

 , ,
, ,
Abstract
:1. Introduction
2. Related Work
3. Materials and Methods
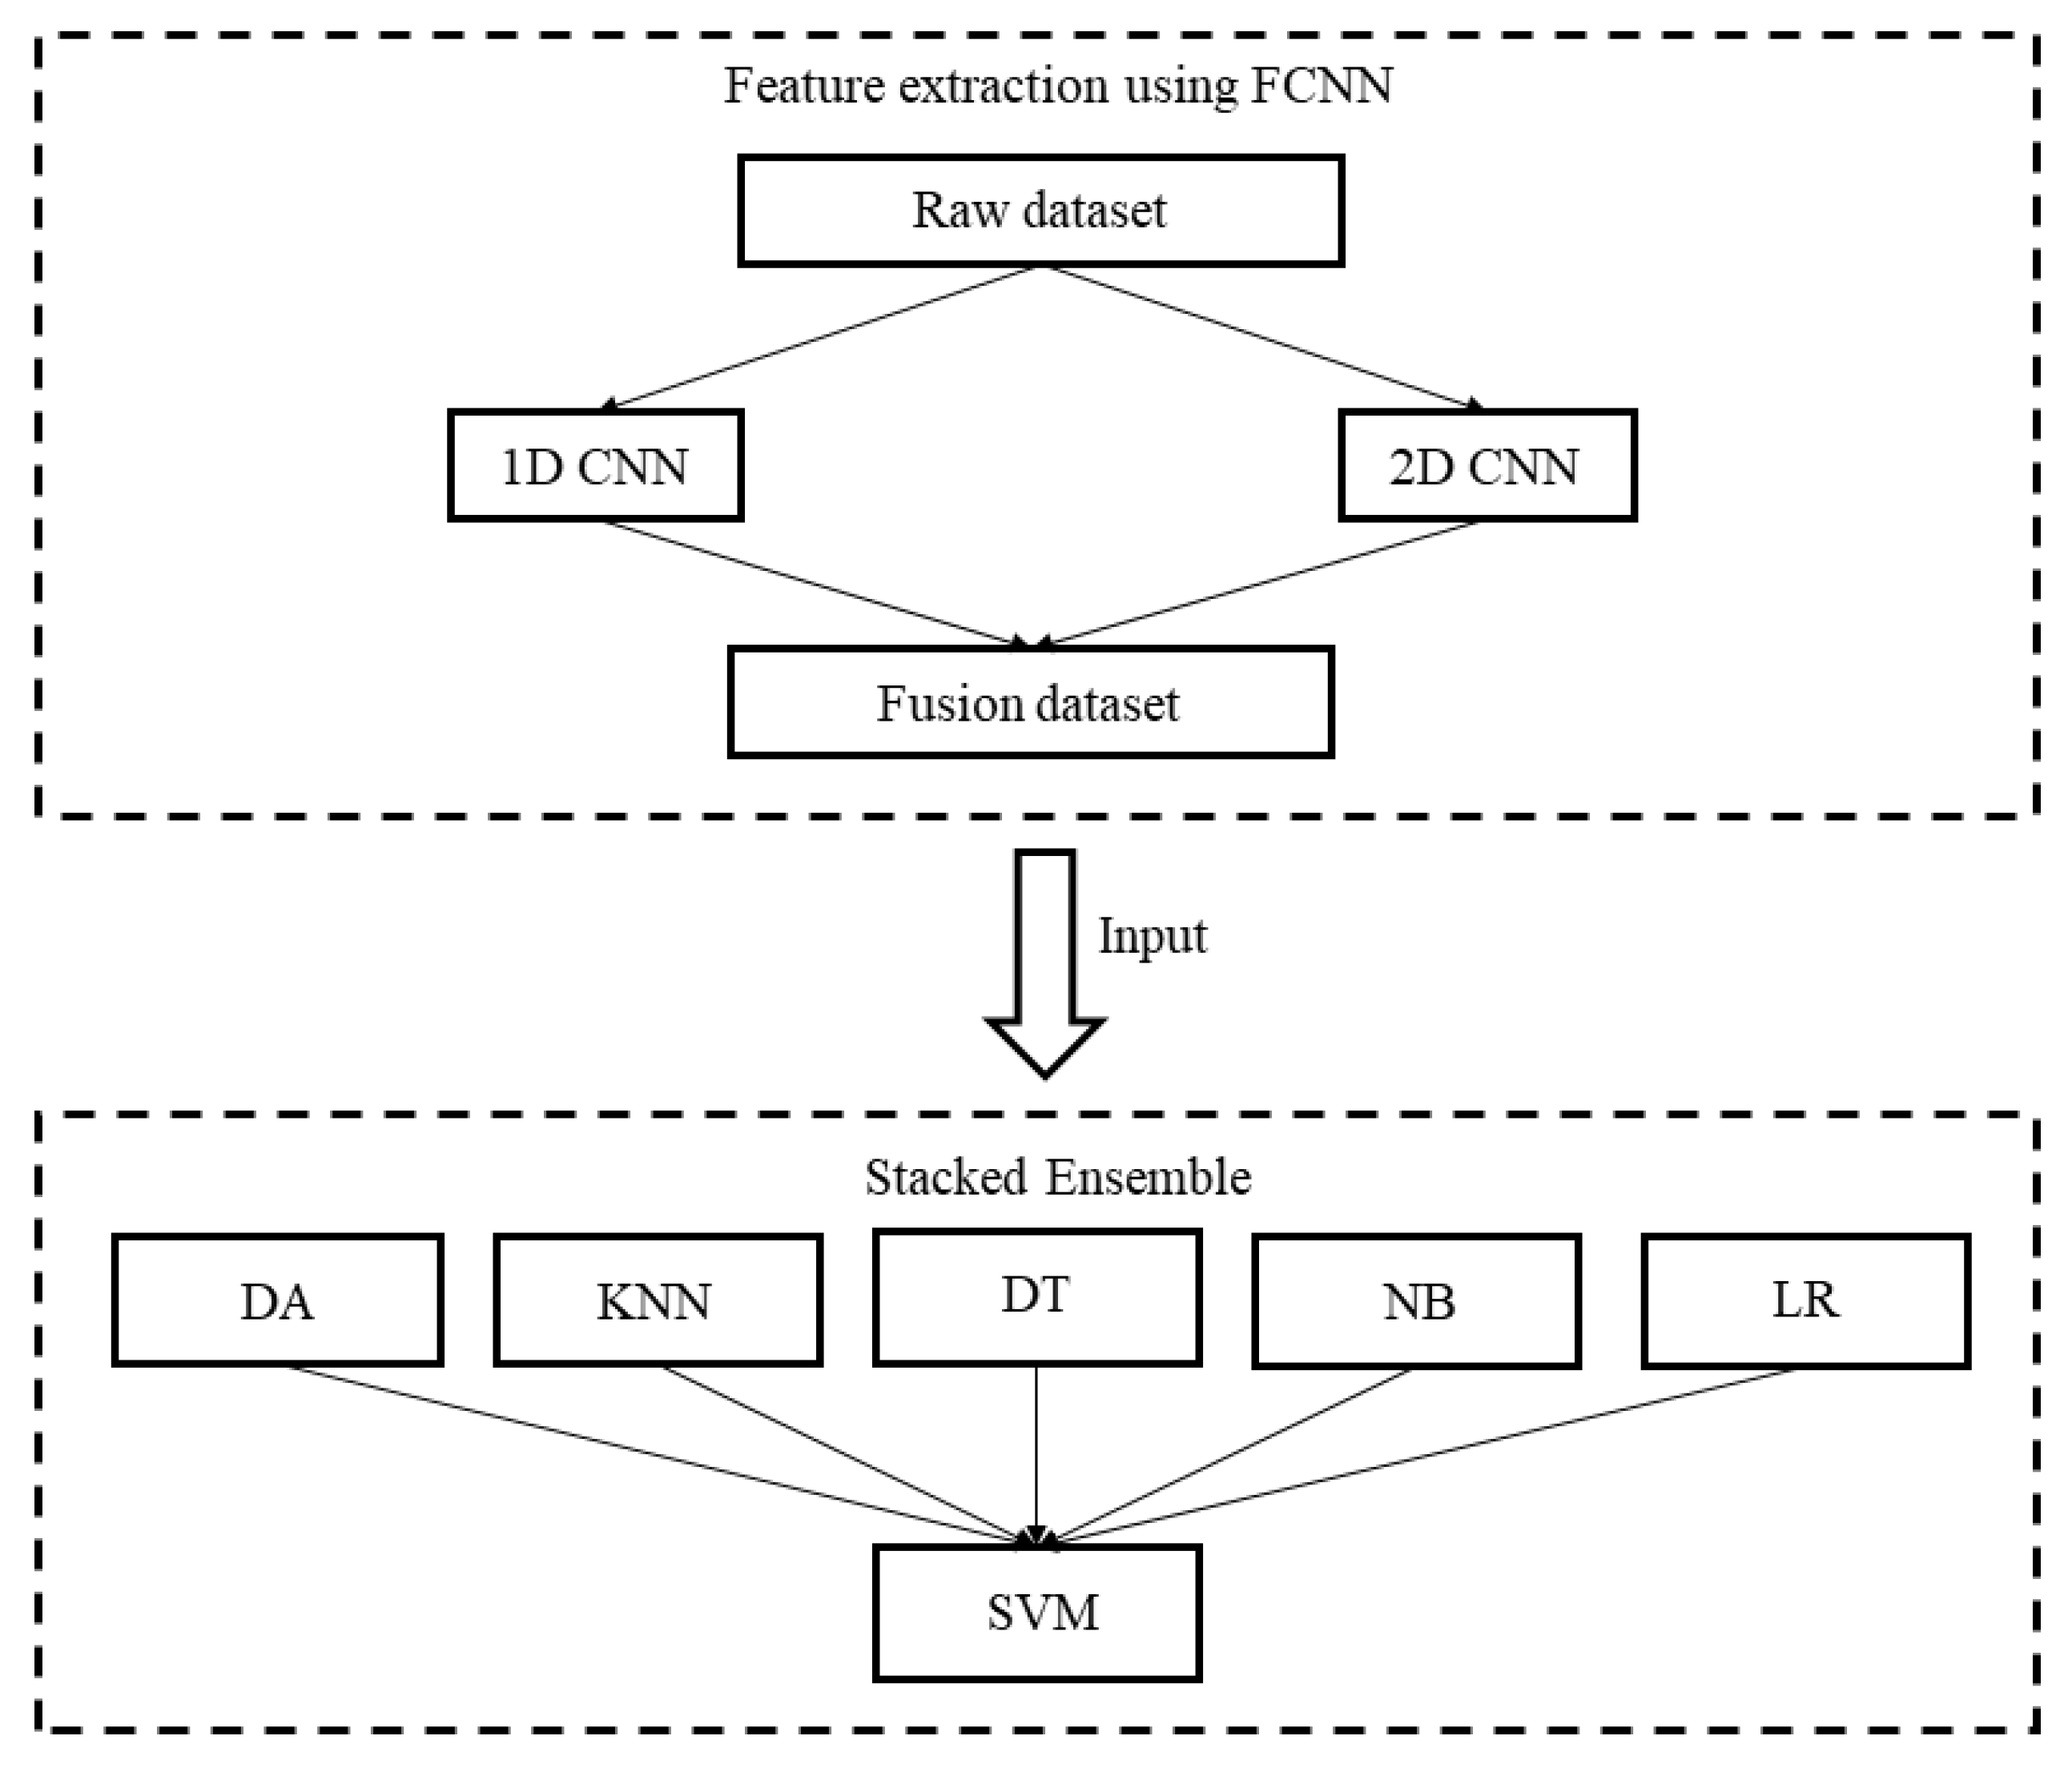
3.1. FCNN
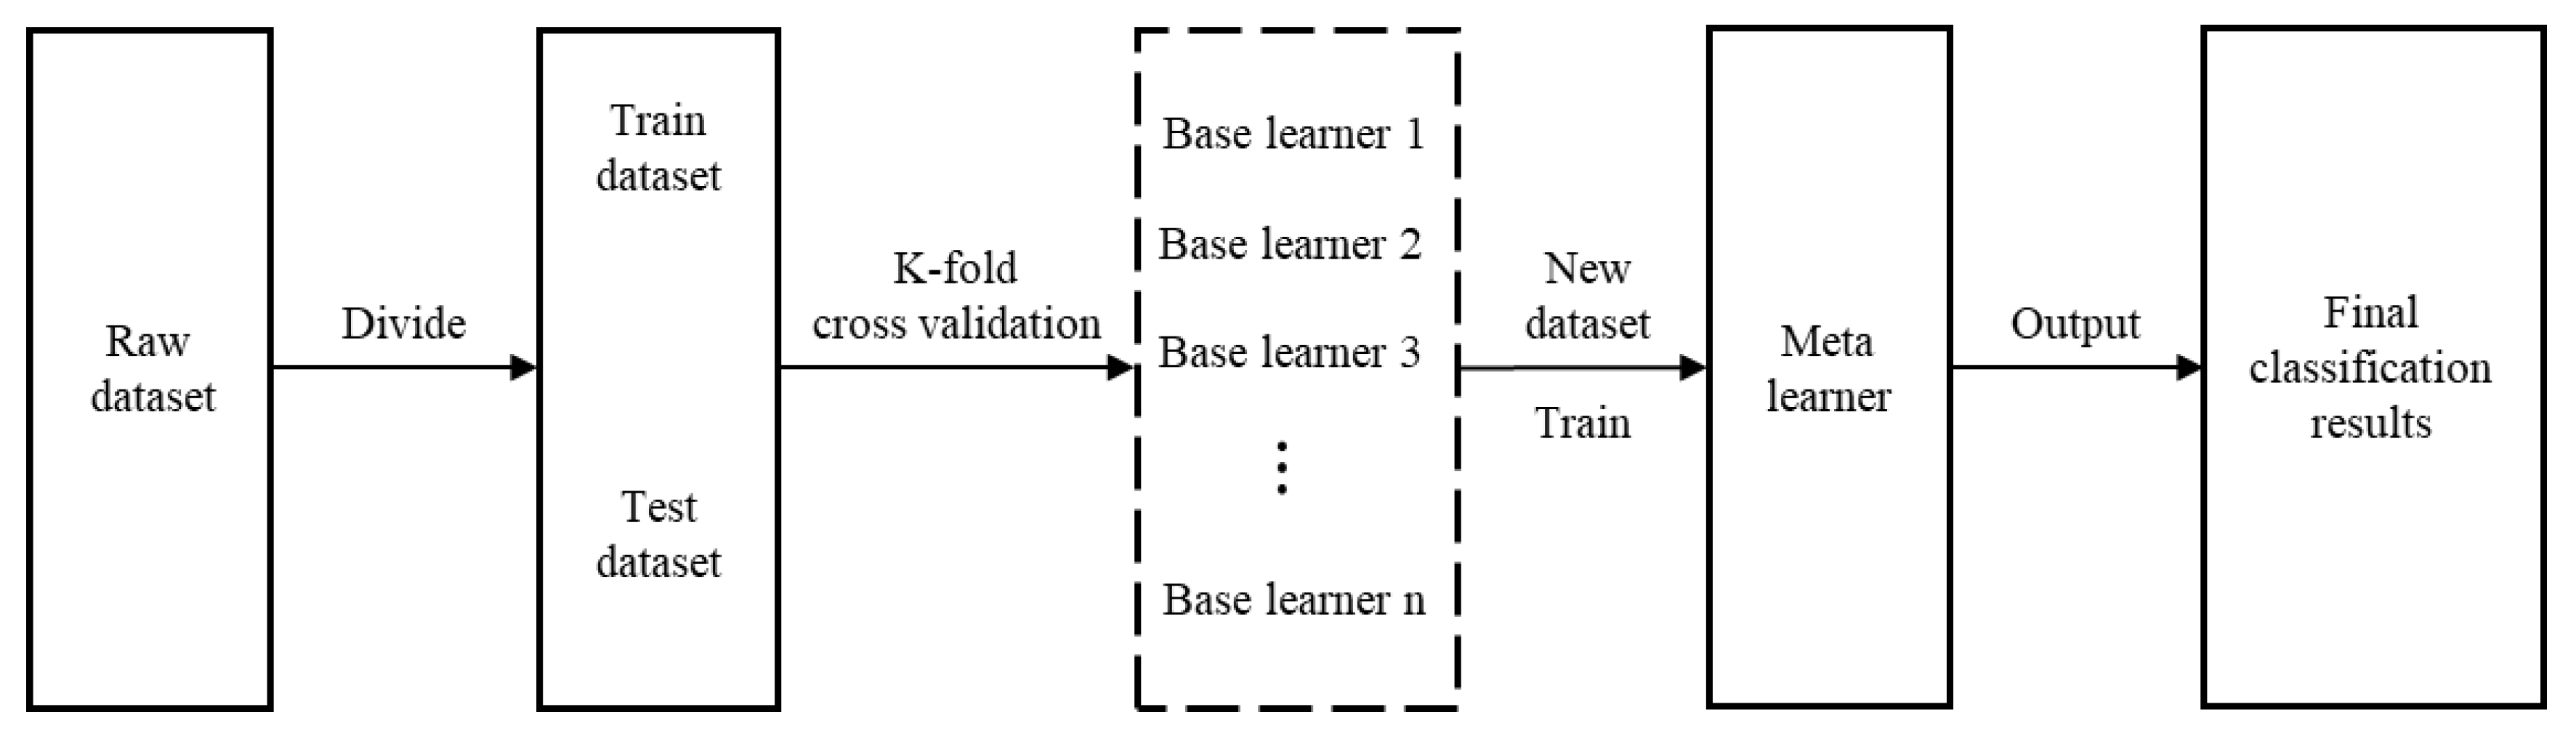
3.2. SE Method
- Divide the original dataset into two parts: training set , and test set .
- Perform the K-fold cross-validation of the base learners; randomly divide the original training set into K equal parts , where each base learner uses one of the parts as the K-fold test set and the remaining (K − 1) parts as the K-fold training set. Each base learner is trained using the K-fold training set, and the K-fold test set is used for classification. The posterior probabilities obtained by each base learner are combined and used as a training set for the meta-learner.
- Each base learner classifies the original test set and uses the posterior probabilities as the test set of the meta-learner.
- The meta-learner uses the new dataset obtained from the base learners, incusing the training set and test set , and performs learning and training, respectively, to output the final classification results.
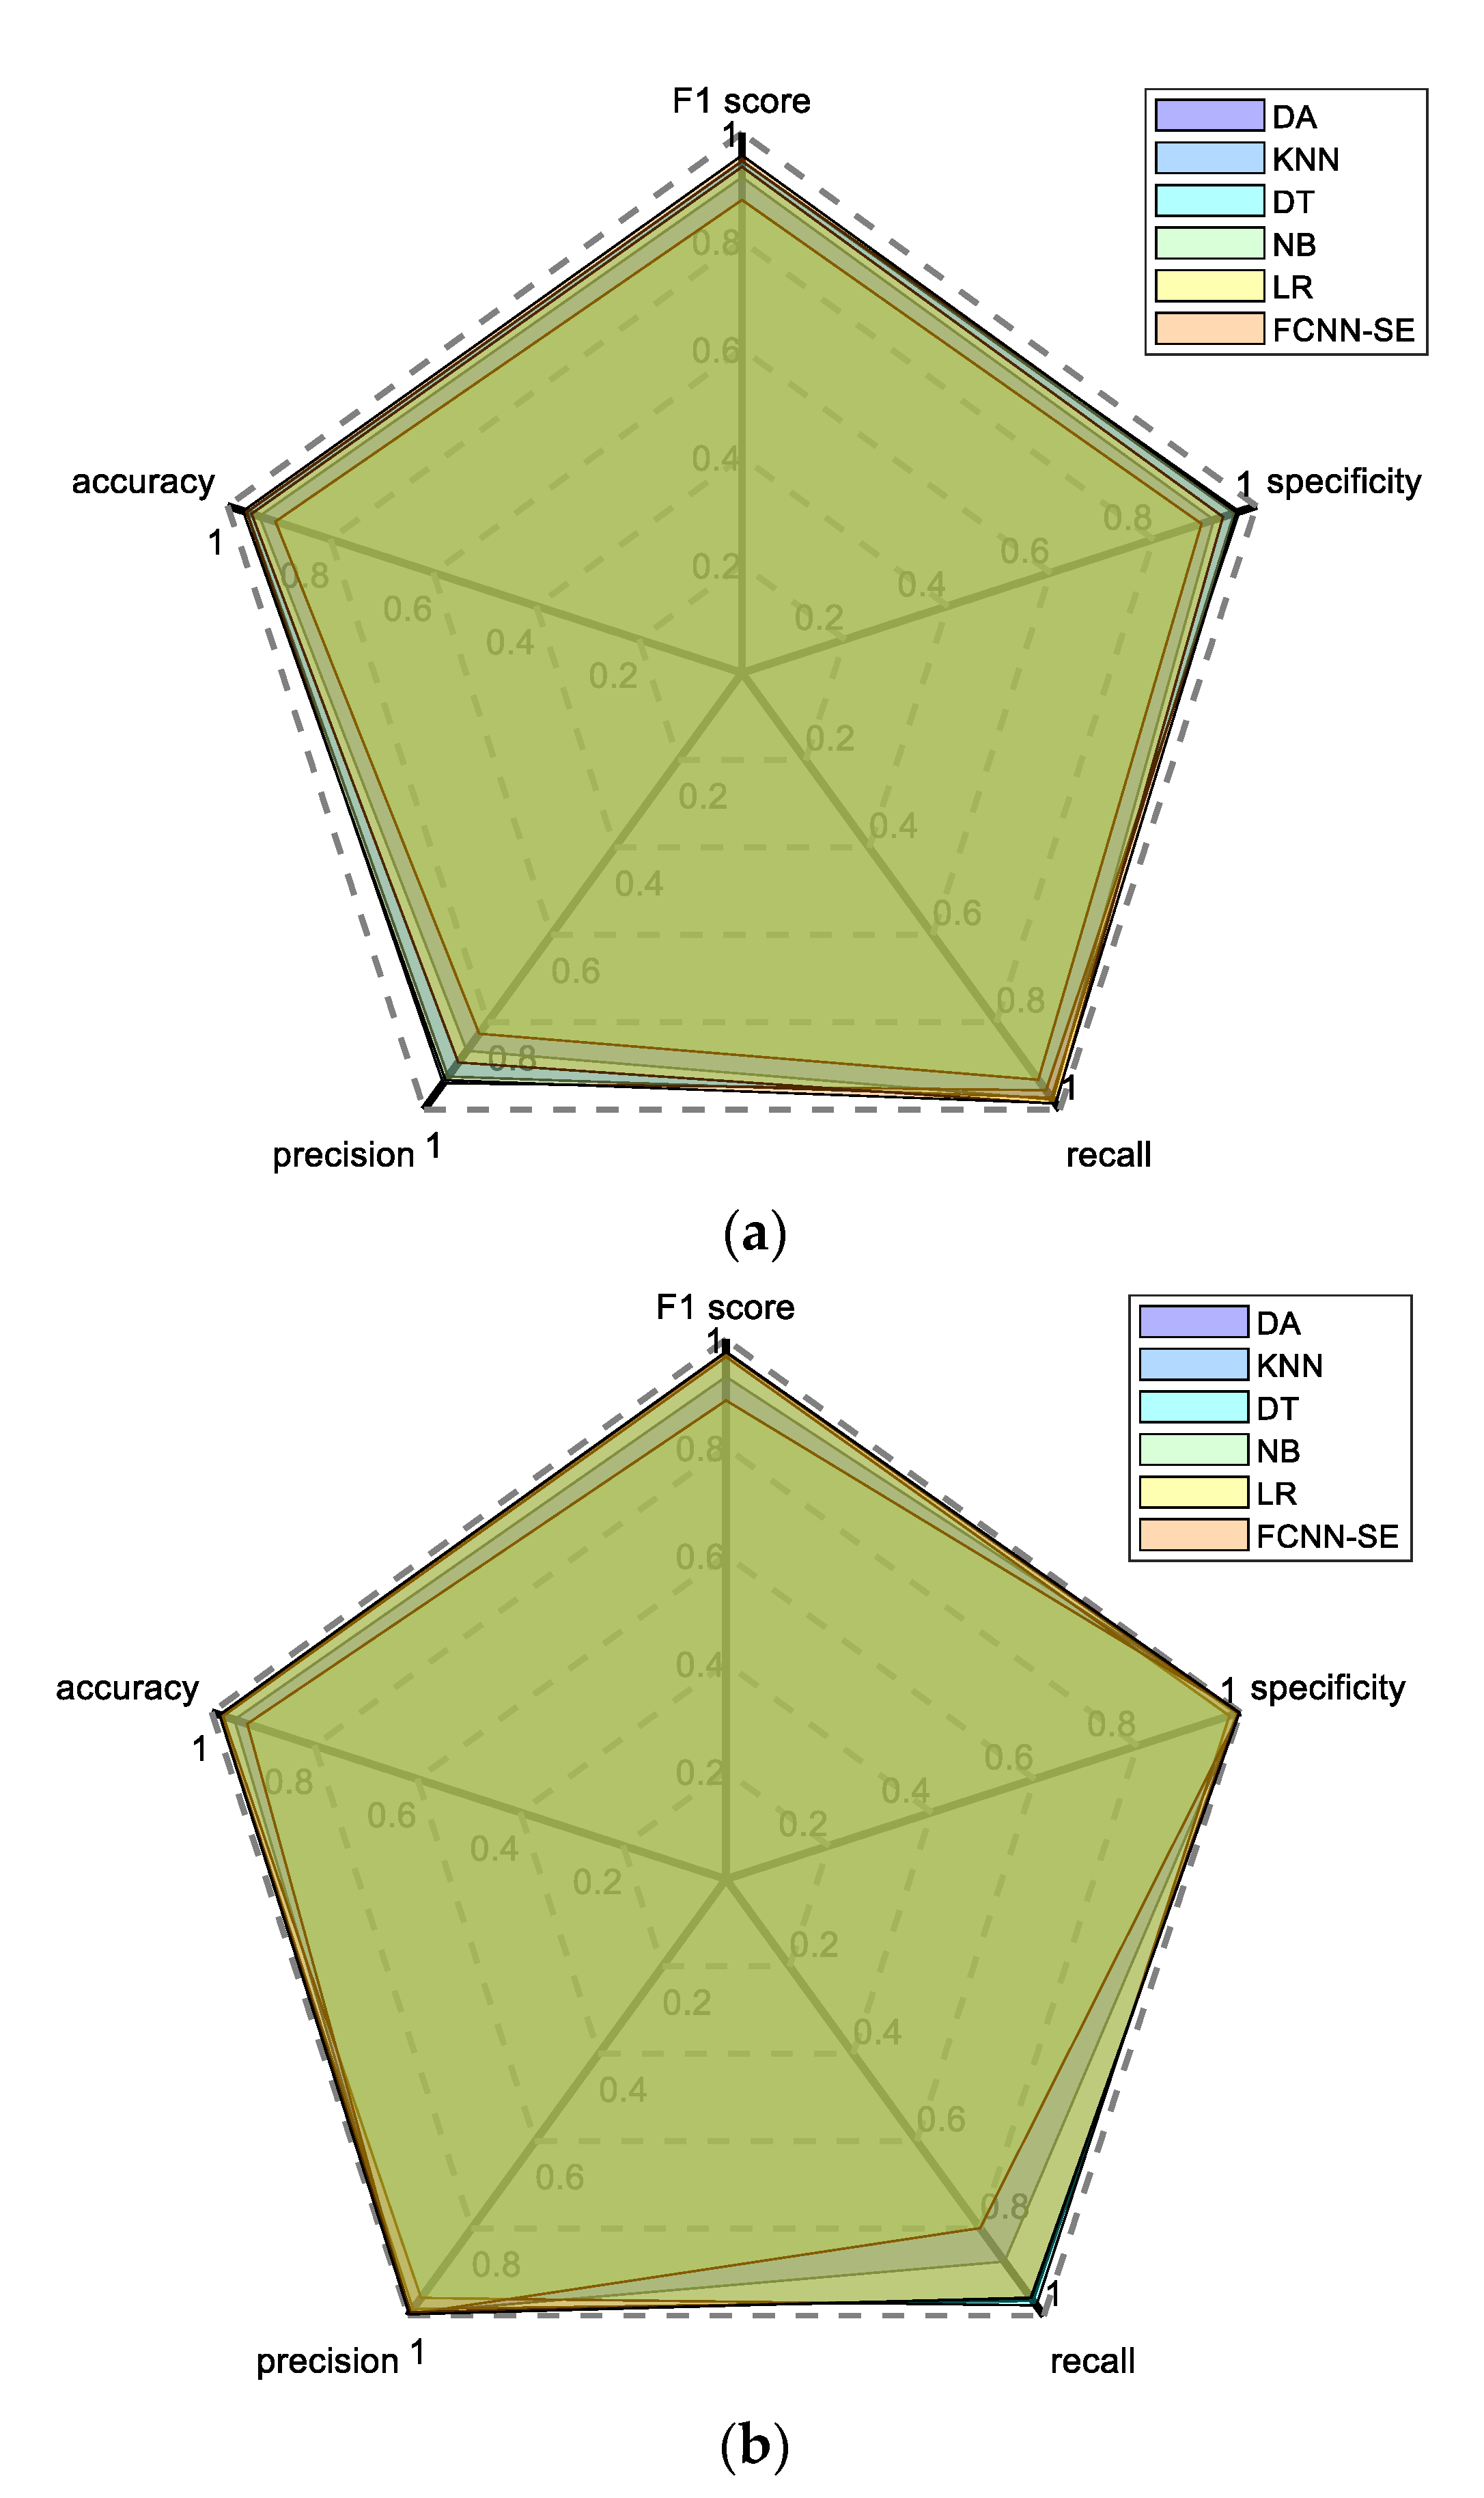
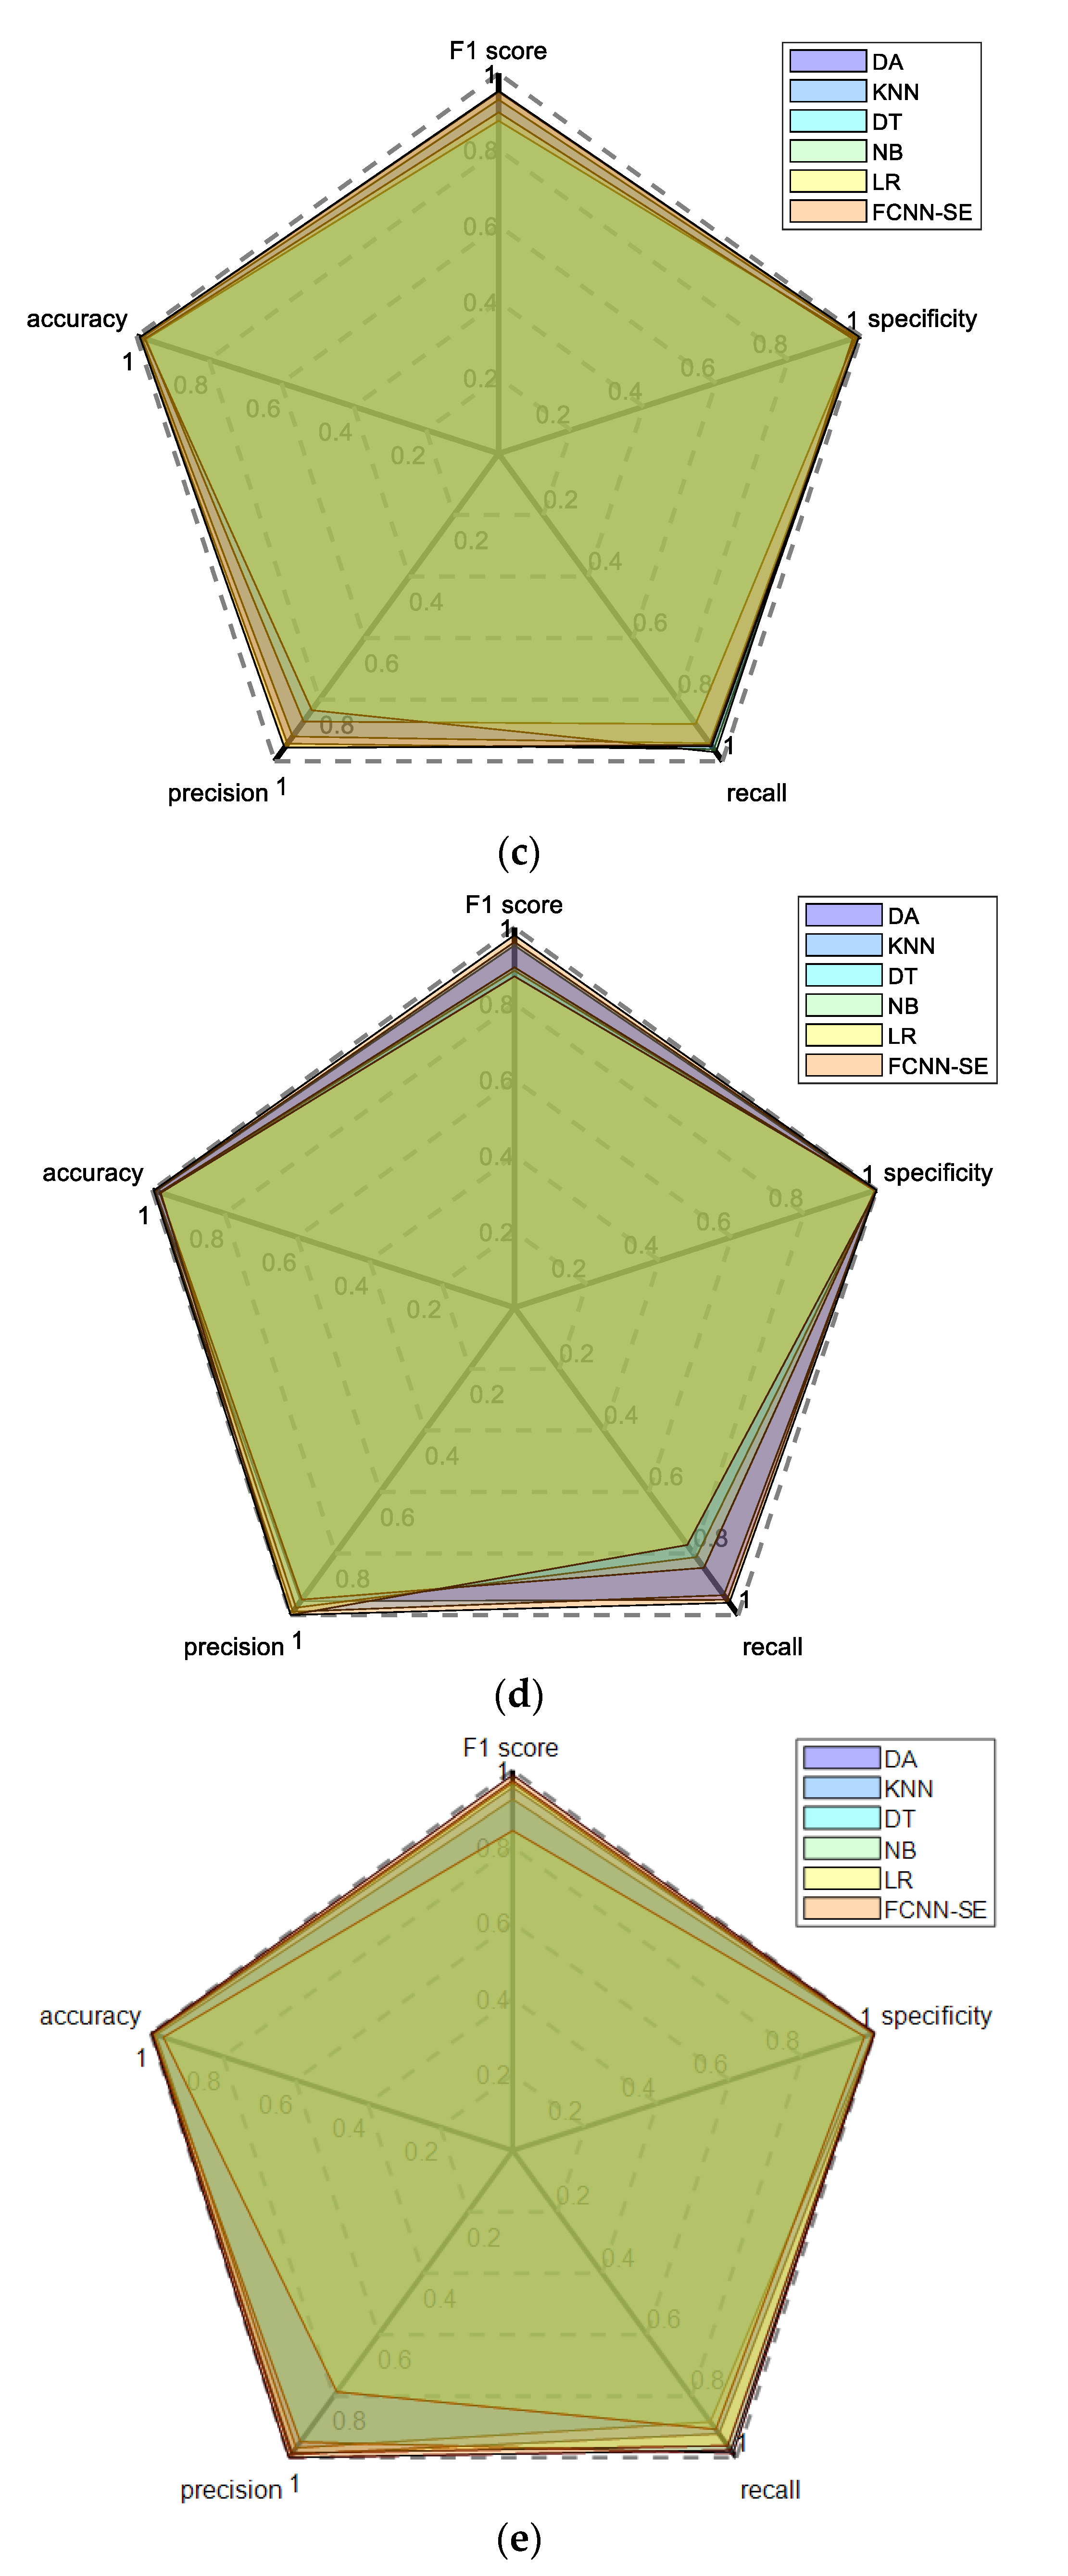
3.3. Radar Chart Method
3.4. Basic Evaluation Indicators
4. Results and Discussion
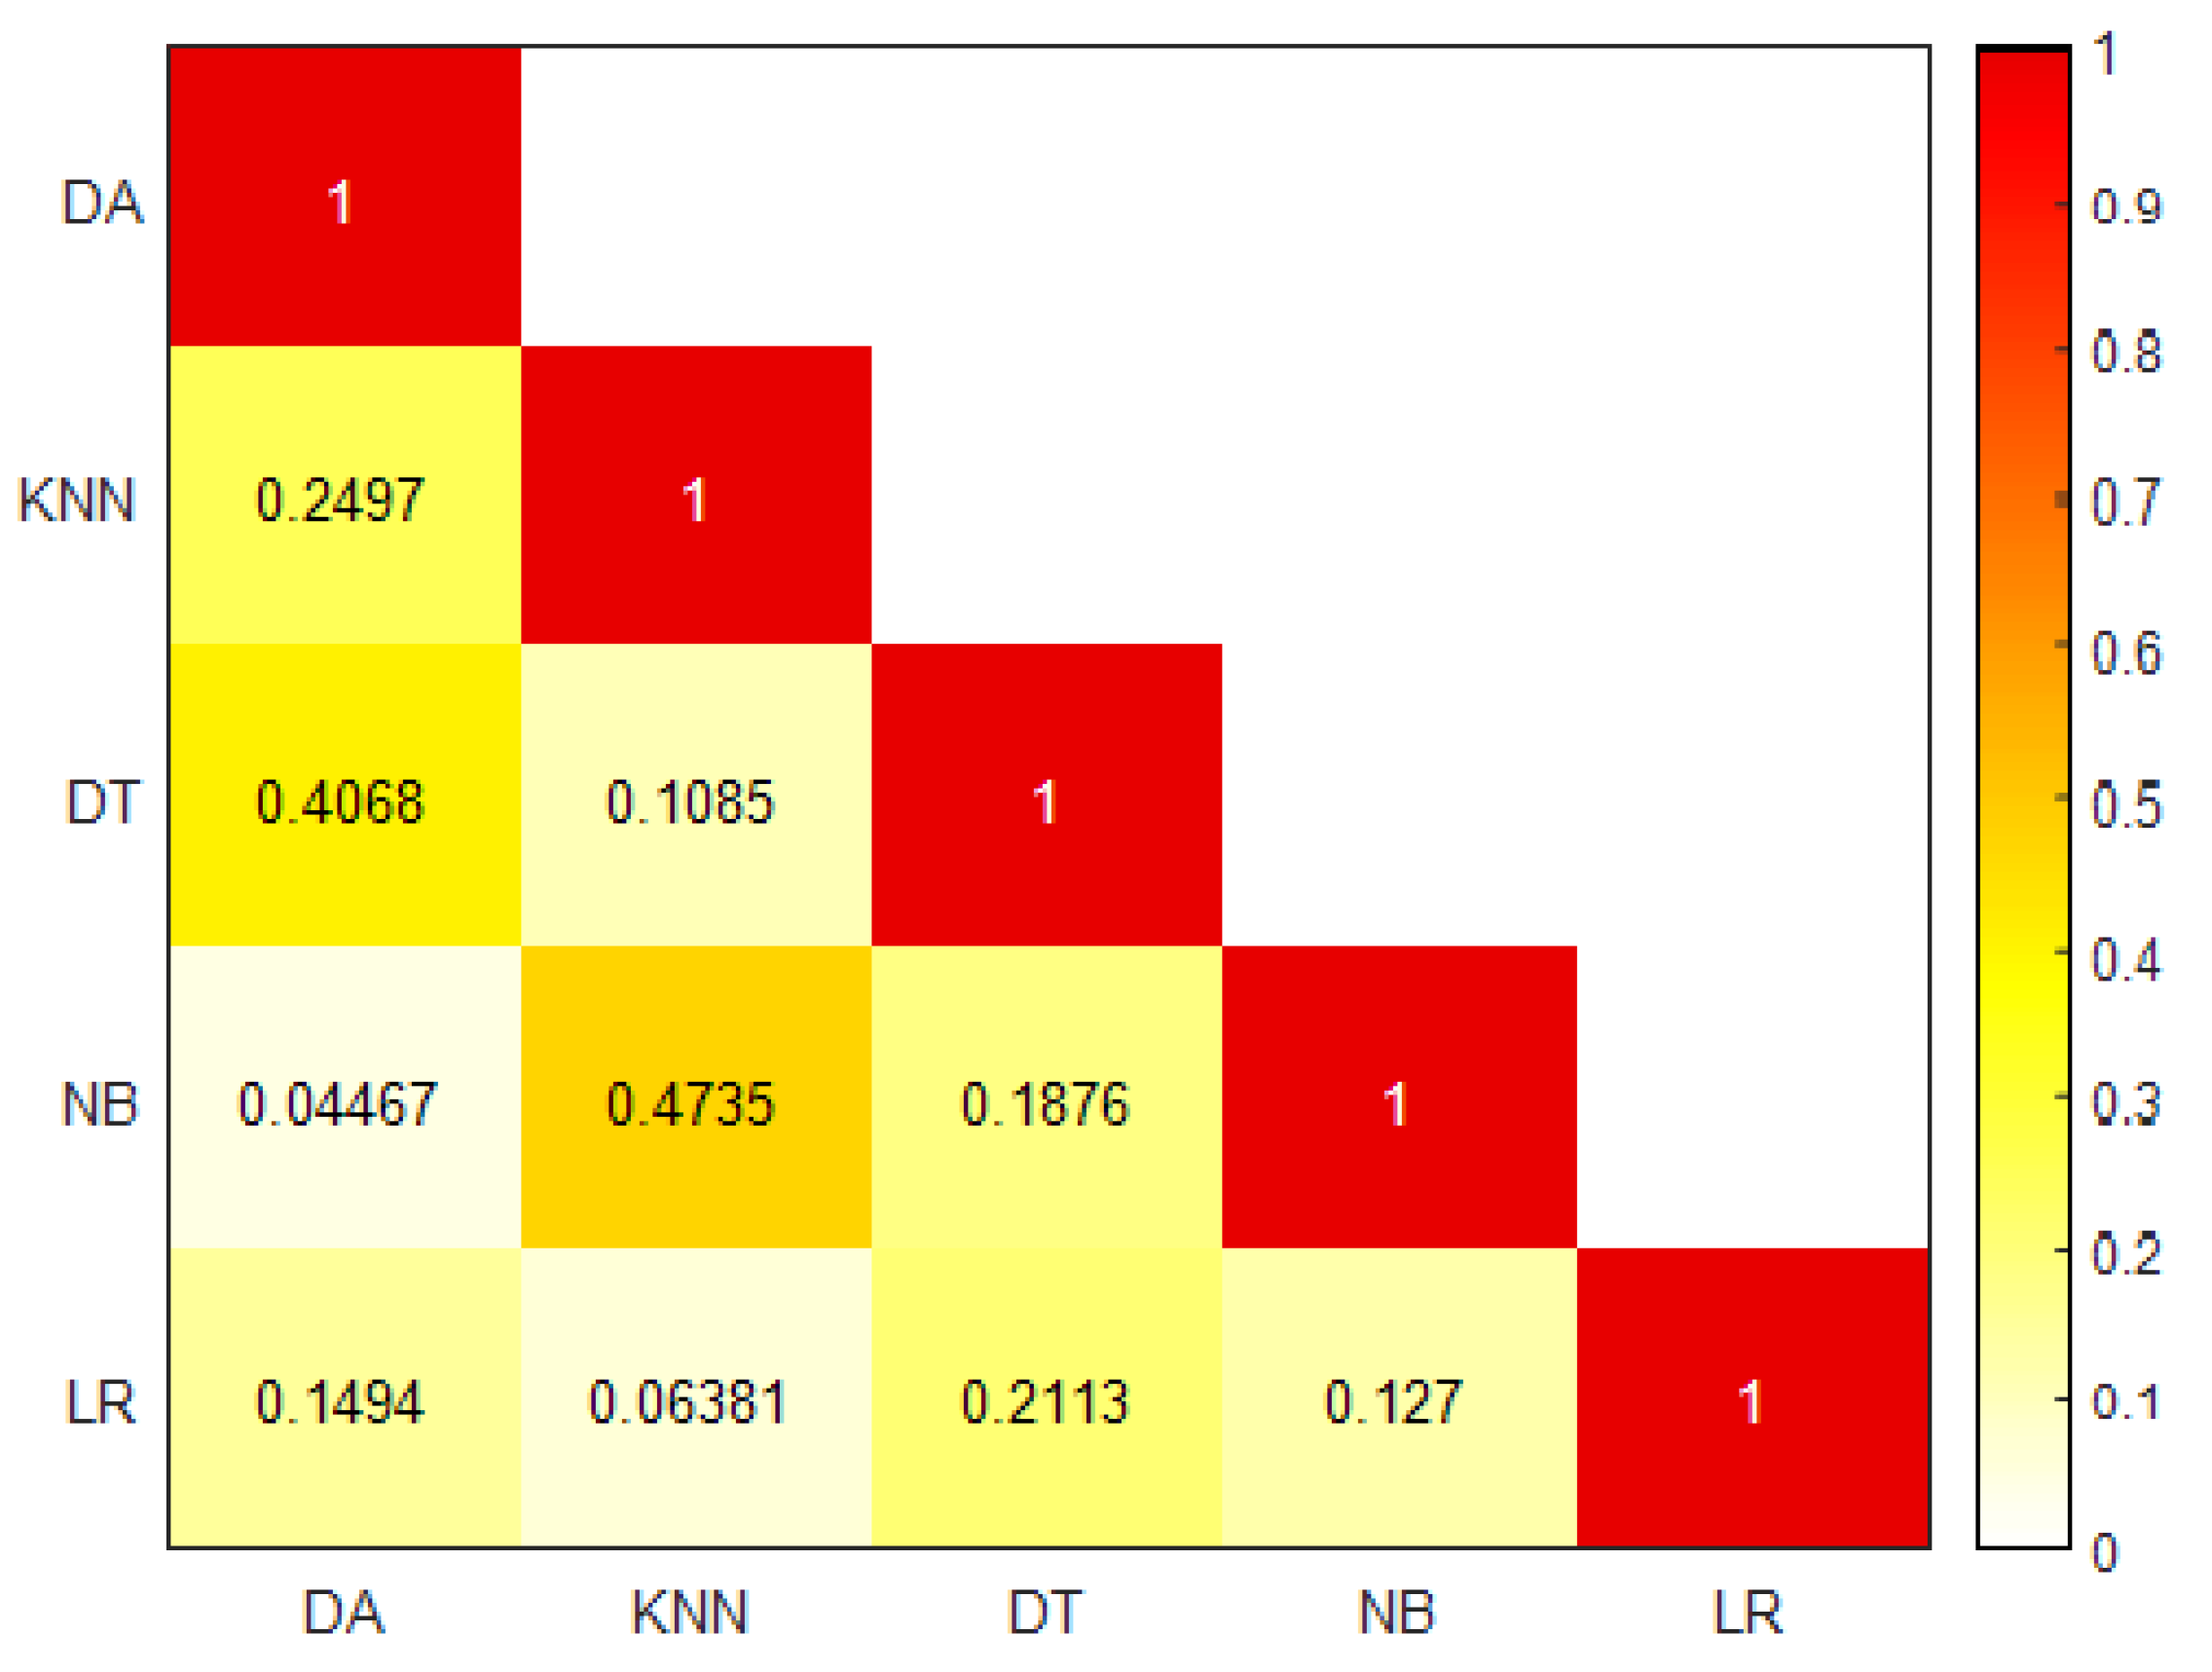
4.1. Spearman Correlation Analysis
4.2. Comprehensive Performance Evaluation based on Radar Chart Method
4.3. McNemar Hypothesis Test Results
4.4. Ablation Experiment
5. Conclusions
- (1)
- Only used machine learning-based methods are used as base learners, while the neural network-based methods are ignored. Because the structure of the neural network itself is very complex, and multiple complex neural networks are integrated to work together at the same time, the structure of the model will be too large, which will greatly increase the training time of the model.
- (2)
- The CNN is adopted as a base extractor without considering other feature extraction techniques. This paper has proved that CNN has good performance as a feature extractor, but the CNN designed in this paper is still very simple compared with mature neural networks such as GoogLeNet and ResNet, and cannot give full play to the powerful feature extraction ability of CNN.
Author Contributions
Funding
Institutional Review Board Statement
Informed Consent Statement
Data Availability Statement
Conflicts of Interest
Nomenclature
| CNN | convolutional neural network |
| SE | stacked ensemble |
| FCNN | fusion CNN |
| 1DCNN | one-dimensional CNN |
| 2DCNN | two-dimensional CNN |
| NSL-KDD | a revised version of the KDD’99 dataset |
| DA | discriminant analysis |
| KNN | K-nearest neighbor |
| DT | decision tree |
| NB | naive Bayes |
| LR | logistic regression |
| SVM | support vector machine |
| TP | true positive |
| TN | true negative |
| FP | false positive |
| FN | false negative |
Appendix A. An Overview of the Features in the NSL-KDD Dataset

| No. | Feature Name | Description | Type | Value Type | Ranges |
|---|---|---|---|---|---|
| 1 | Duration | Length of time duration of the connection | Continuous | Integers | 0–54, 451 |
| 2 | Protocol Type | Protocol used in the connection | Categorical | Strings | |
| 3 | Service | Destination network service used | Categorical | Strings | |
| 4 | Flag | Status of the connection—Normal or Error | Categorical | Strings | |
| 5 | Src Bytes | Number of data bytes transferred from source to destination in single connection | Continuous | Integers | 0–1, 379, 963, 888 |
| 6 | Dst Bytes | Number of data bytes transferred from destination to source in single connection | Continuous | Integers | 0–30, 993, 7401 |
| 7 | Land | If source and destination IP addresses and port numbers are equal then, this variable takes value 1 else 0 | Binary | Integers | {0, 1} |
| 8 | Wrong Fragment | Total number of wrong fragments in this connection | Discrete | Integers | {0, 1, 3} |
| 9 | Urgent | Number of urgent packets in this connection. Urgent packets are packets with the urgent bit activated | Discrete | Integers | 0–3 |
| 10 | Hot | Number of “hot‟ indicators in the content such as: entering a system directory, creating programs and executing programs | Continuous | Integers | 0–101 |
| 11 | Num Failed Logins | Count of failed login attempts | Continuous | Integers | 0–4 |
| 12 | Logged In | Login Status: 1 if successfully logged in; 0 otherwise | Binary | Integers | {0, 1} |
| 13 | Num Compromised | Number of “compromised” conditions | Continuous | Integers | 0–7479 |
| 14 | Root Shell | 1 if root shell is obtained; 0 otherwise | Binary | Integers | {0, 1} |
| 15 | Su Attempted | 1 if “su root’’ command attempted or used; 0 otherwise | Discrete (Dataset contains ‘2’ value) | Integers | 0–2 |
| 16 | Num Root | Number of “root’’ accesses or number of operations performed as a root in the connection | Continuous | Integers | 0–7468 |
| 17 | Num File Creations | Number of file creation operations in the connection | Continuous | Integers | 0–100 |
| 18 | Num Shells | Number of shell prompts | Continuous | Integers | 0–2 |
| 19 | Num Access Files | Number of operations on access control files | Continuous | Integers | 0–9 |
| 20 | Num Outbound Cmds | Number of outbound commands in an ftp session | Continuous | Integers | {0} |
| 21 | Is Hot Logins | 1 if the login belongs to the “hot’’ lis, i.e., root or admin; else 0 | Binary | Integers | {0, 1} |
| 22 | Is Guest Login | 1 if the login is a “guest’’ login; 0 otherwise | Binary | Integers | {0, 1} |
| 23 | Count | Number of connections to the same destination host as the current connection in the past two seconds | Discrete | Integers | 0–511 |
| 24 | Srv Count | Number of connections to the same service (port number) as the current connection in the past two seconds | Discrete | Integers | 0–511 |
| 25 | Serror Rate | The percentage of connections that have activated the flag (4) s0, s1, s2 or s3, among the connections aggregated in count (23) | Discrete | Floats (hundredths of a decimal) | 0–1 |
| 26 | Srv Serror Rate | The percentage of connections that have activated the flag (4) s0, s1, s2 or s3, among the connections aggregated in srv_count (24) | Discrete | Floats (hundredths of a decimal) | 0–1 |
| 27 | Rerror Rate | The percentage of connections that have activated the flag (4) REJ, among the connections aggregated in count (23) | Discrete | Floats (hundredths of a decimal) | 0–1 |
| 28 | Srv Rerror Rate | The percentage of connections that have activated the flag (4) REJ, among the connections aggregated in srv_count (24) | Discrete | Floats (hundredths of a decimal) | 0–1 |
| 29 | Same Srv Rate | The percentage of connections that were to the same service, among the connections aggregated in count (23) | Discrete | Floats (hundredths of a decimal) | 0–1 |
| 30 | Diff Srv Rate | The percentage of connections that were to different services, among the connections aggregated in count (23) | Discrete | Floats (hundredths of a decimal) | 0–1 |
| 31 | Srv Diff Host Rate | The percentage of connections that were to different destination machines among the connections aggregated in srv_count (24) | Discrete | Floats (hundredths of a decimal) | 0–1 |
| 32 | Dst Host Count | Number of connections having the same destination host IP address | Discrete | Integers | 0–255 |
| 33 | Dst Host Srv Count | Number of connections having the same port number | Discrete | Integers | 0–255 |
| 34 | Dst Host Same Srv Rate | The percentage of connections that were to different services, among the connections aggregated in dst_host_count (32) | Discrete | Floats (hundredths of a decimal) | 0–1 |
| 35 | Dst Host Diff Srv Rate | The percentage of connections that were to different services, among the connections aggregated in dst_host_count (32) | Discrete | Floats (hundredths of a decimal) | 0–1 |
| 36 | Dst Host Same Src Port Rate | The percentage of connections that were to the same source port, among the connections aggregated in dst_host_srv_count (33) | Discrete | Floats (hundredths of a decimal) | 0–1 |
| 37 | Dst Host Srv Diff Host Rate | The percentage of connections that were to different destination machines, among the connections aggregated in dst_host_srv_count (33) | Discrete | Floats (hundredths of a decimal) | 0–1 |
| 38 | Dst Host Serror Rate | The percentage of connections that have activated the flag (4) s0, s1, s2 or s3, among the connections aggregated in dst_host_count (32) | Discrete | Floats (hundredths of a decimal) | 0–1 |
| 39 | Dst Host Srv Serror Rate | The percent of connections that have activated the flag (4) s0, s1, s2 or s3, among the connections aggregated in dst_host_srv_count (33) | Discrete | Floats (hundredths of a decimal) | 0–1 |
| 40 | Dst Host Rerror Rate | The percentage of connections that have activated the flag (4) REJ, among the connections aggregated in dst_host_count (32) | Discrete | Floats (hundredths of a decimal) | 0–1 |
| 41 | Dst Host Srv Rerror Rate | The percentage of connections that have activated the flag (4) REJ, among the connections aggregated in dst_host_srv_count (33) | Discrete | Floats (hundredths of a decimal) | 0–1 |
Appendix B. Performance Comparison of Different Models
| Indicator | Model | Class 1 | Class 2 | Class 3 | Class 4 | Class 5 |
|---|---|---|---|---|---|---|
| Accuracy | DA | 0.9385 | 0.9560 | 0.9900 | 0.9905 | 0.9910 |
| KNN | 0.9625 | 0.9835 | 0.9855 | 0.9925 | 0.9850 | |
| DT | 0.9630 | 0.9780 | 0.9740 | 0.9790 | 0.9930 | |
| NB | 0.9070 | 0.9310 | 0.9770 | 0.9800 | 0.9650 | |
| LR | 0.9535 | 0.9840 | 0.9900 | 0.9770 | 0.9945 | |
| FCNN-SE | 0.9700 | 0.9850 | 0.9905 | 0.9960 | 0.9975 | |
| Precision | DA | 0.8657 | 0.9933 | 0.9434 | 0.9552 | 0.9896 |
| KNN | 0.9246 | 0.9850 | 0.9202 | 0.9895 | 0.9681 | |
| DT | 0.9401 | 0.9594 | 0.8714 | 0.9762 | 0.9486 | |
| NB | 0.8266 | 0.9963 | 0.8347 | 0.9500 | 0.7857 | |
| LR | 0.8924 | 0.9924 | 0.9563 | 1.0000 | 0.9851 | |
| FCNN-SE | 0.9330 | 0.9969 | 0.9565 | 1.0000 | 1.0000 | |
| Recall | DA | 0.9773 | 0.8761 | 0.9615 | 0.9505 | 0.9223 |
| KNN | 0.9731 | 0.9661 | 0.9423 | 0.9356 | 0.8835 | |
| DT | 0.9561 | 0.9764 | 0.8798 | 0.8119 | 0.9854 | |
| NB | 0.9320 | 0.7994 | 0.9712 | 0.8465 | 0.9078 | |
| LR | 0.9873 | 0.9602 | 0.9471 | 0.7723 | 0.9612 | |
| FCNN-SE | 0.9858 | 0.9587 | 0.9519 | 0.9604 | 0.9757 | |
| Specificity | DA | 0.9173 | 0.9970 | 0.9933 | 0.9950 | 0.9989 |
| KNN | 0.9567 | 0.9924 | 0.9905 | 0.9989 | 0.9967 | |
| DT | 0.9668 | 0.9788 | 0.9849 | 0.9978 | 0.9939 | |
| NB | 0.8934 | 0.9985 | 0.9777 | 0.9950 | 0.9716 | |
| LR | 0.9351 | 0.9962 | 0.9950 | 1.0000 | 0.9983 | |
| FCNN-SE | 0.9614 | 0.9985 | 0.9950 | 1.0000 | 1.0000 | |
| F1 score | DA | 0.9182 | 0.9310 | 0.9524 | 0.9529 | 0.9548 |
| KNN | 0.9482 | 0.9754 | 0.9311 | 0.9618 | 0.9239 | |
| DT | 0.9480 | 0.9678 | 0.8756 | 0.8865 | 0.9667 | |
| NB | 0.8762 | 0.8871 | 0.8978 | 0.8953 | 0.8423 | |
| LR | 0.9375 | 0.9760 | 0.9517 | 0.8715 | 0.9730 | |
| FCNN-SE | 0.9587 | 0.9774 | 0.9542 | 0.9798 | 0.9877 | |
| Comprehensive performance evaluation value | DA | 0.8910 | 0.8960 | 0.9281 | 0.9121 | 0.9093 |
| KNN | 0.9212 | 0.9272 | 0.9138 | 0.9184 | 0.8892 | |
| DT | 0.9232 | 0.9193 | 0.8758 | 0.8691 | 0.9158 | |
| NB | 0.8559 | 0.8635 | 0.8891 | 0.8748 | 0.8310 | |
| LR | 0.9087 | 0.9283 | 0.9279 | 0.8589 | 0.9205 | |
| FCNN-SE | 0.9296 | 0.9297 | 0.9296 | 0.9297 | 0.9299 |
References
- Samriya, J.K.; Tiwari, R.; Cheng, X.; Singh, R.K.; Shankar, A.; Kumar, M. Network intrusion detection using ACO-DNN model with DVFS based energy optimization in cloud framework. Sustain. Comput. Inform. Syst. 2022, 35, 100746. [Google Scholar] [CrossRef]
- Imran, M.; Khan, S.; Hlavacs, H.; Alam Khan, F.; Anwar, S. Intrusion detection in networks using cuckoo search optimization. Soft Comput. 2022. [Google Scholar] [CrossRef]
- You, L.; Wang, Z. A Cloud Based Network Intrusion Detection System. Teh. Vjesn. 2022, 29, 987–992. [Google Scholar]
- Tsimenidis, S.; Lagkas, T.; Rantos, K. Deep learning in iot intrusion detection. J. Netw. Syst. Manag. 2022, 30, 8. [Google Scholar] [CrossRef]
- Mills, R.; Marnerides, A.K.; Broadbent, M.; Race, N. Practical Intrusion Detection of Emerging Threats. IEEE Trans. Netw. Serv. Manag. 2021, 19, 582–600. [Google Scholar] [CrossRef]
- Wang, Z.; Shao, L.; Cheng, K.; Liu, Y.; Jiang, J.; Nie, Y.; Li, X.; Kuang, X. ICDF: Intrusion collaborative detection framework based on confidence. Int. J. Intell. Syst. 2022. [Google Scholar] [CrossRef]
- Deolindo, V.M.; Dalmazo, B.L.; da Silva, M.V.; de Oliveira, L.R.; Silva, A.D.B.; Granville, L.Z.; Gaspary, L.P.; Nobre, J.C. Using Quadratic Discriminant Analysis by Intrusion Detection Systems for Port Scan and Slowloris Attack Classification. In Proceedings of the International Conference on Computational Science and Its Applications, Cagliari, Italy, 13–16 September 2021; Springer: Cham, Switzerland, 2021. [Google Scholar]
- Liu, G.; Zhao, H.; Fan, F.; Liu, G.; Xu, Q.; Nazir, S. An Enhanced Intrusion Detection Model Based on Improved kNN in WSNs. Sensors 2022, 22, 1407. [Google Scholar] [CrossRef]
- Das, A.; Sunitha, B.S. An Efficient Feature Selection Approach for Intrusion Detection System using Decision Tree. Int. J. Adv. Comput. Sci. Appl. 2022, 13. [Google Scholar] [CrossRef]
- Singh, S. Poly Logarithmic Naive Bayes Intrusion Detection System Using Linear Stable PCA Feature Extraction. Wirel. Pers. Commun. 2022, 12, 3117–3132. [Google Scholar] [CrossRef]
- Kanimozhi, P.; Victoire, T.A.A. Oppositional tunicate fuzzy C-means algorithm and logistic regression for intrusion detection on cloud. Concurr. Comput. Pract. Exp. 2021, 34, e6624. [Google Scholar] [CrossRef]
- Chen, C.; Liu, S.; Wang, Y.; Zhu, Y. A Network Intrusion Detection Method Based on PSOGWO-SVM. J. Air Force Eng. Univ. Nat. Sci. Ed. 2022, 23, 97–105. [Google Scholar]
- Li, Y.; Xu, W.; Li, W.; Li, A.; Liu, Z. Research on hybrid intrusion detection method based on the ADASYN and ID3 algorithms. Math. Biosci. Eng. 2021, 19, 2030–2042. [Google Scholar] [CrossRef] [PubMed]
- Hassan, M.; Haque, E.; Tozal, M.E.; Raghavan, V.; Agrawal, R. Intrusion Detection Using Payload Embeddings. IEEE Access 2021, 10, 4015–4030. [Google Scholar] [CrossRef]
- Wang, Z.; Schapire, R.E.; Verma, N. Error adaptive classifier boosting (EACB): Leveraging data-driven training towards hardware resilience for signal inference. IEEE Trans. Circuits Syst. I Regul. Pap. 2015, 62, 1136–1145. [Google Scholar] [CrossRef]
- Creamer, G.; Freund, Y. Using boosting for financial analysis and performance prediction: Application to S&P 500 companies, Latin American ADRs and banks. Comput. Econ. 2010, 36, 133–151. [Google Scholar]
- Breiman, L. Using iterated bagging to debias regressions. Machine Learning Mach. Learn. 2001, 45, 261–277. [Google Scholar] [CrossRef]
- Tang, Y.; Gu, L.; Wang, L. Deep Stacking Network for Intrusion Detection. Sensors 2021, 22, 25. [Google Scholar] [CrossRef]
- Basati, A.; Faghih, M.M. DFE: Efficient IoT network intrusion detection using deep feature extraction. Neural Comput. Appl. 2022, 34, 15175–15195. [Google Scholar] [CrossRef]
- Fatani, A.; Dahou, A.; Al-Qaness, M.A.A.; Lu, S.; Elaziz, M.A. Advanced feature extraction and selection approach using deep learning and Aquila optimizer for IoT intrusion detection system. Sensors 2021, 22, 140. [Google Scholar] [CrossRef]
- Cui, J.; Zong, L.; Xie, J.; Tang, M. A novel multi-module integrated intrusion detection system for high-dimensional imbalanced data. Appl. Intell. 2022, 1–17. [Google Scholar] [CrossRef]
- Cao, B.; Li, C.; Song, Y.; Qin, Y.; Chen, C. Network Intrusion Detection Model Based on CNN and GRU. Appl. Sci. 2022, 12, 4184. [Google Scholar] [CrossRef]
- Bhuvansehwari, K.S. Improved Dragonfly Optimizer for Intrusion Detection Using Deep Clustering CNN-PSO Classifier. CMC-Comput. Mater. Contin. 2022, 70, 5949–5965. [Google Scholar] [CrossRef]
- Zhang, H.; Li, J.-L.; Liu, X.-M.; Dong, C. Multi-dimensional feature fusion and stacking ensemble mechanism for network intrusion detection. Futur. Gener. Comput. Syst. 2021, 122, 130–143. [Google Scholar] [CrossRef]
- Qiu, W.; Ma, Y.; Chen, X.; Yu, H.; Chen, L. Hybrid intrusion detection system based on Dempster-Shafer evidence theory. Comput. Secur. 2022, 117, 102709. [Google Scholar] [CrossRef]
- Mehmood, M.; Javed, T.; Nebhen, J.; Abbas, S.; Abid, R.; Bojja, G.R.; Rizwan, M. A Hybrid approach for network intrusion detection. CMC-Comput. Mater. Contin. 2022, 70, 91–107z. [Google Scholar] [CrossRef]
- Kim, T.; Pak, W. Real-time network intrusion detection using deferred decision and hybrid classifier. Futur. Gener. Comput. Syst. 2022, 132, 51–66. [Google Scholar] [CrossRef]
- Qiang, D.; Zhang, L.; Huang, X. Quantitative evaluation of TOD performance based on multi-source data: A case study of Shanghai. Front. Public Health 2022, 10, 820694. [Google Scholar] [CrossRef]
- Yang, M.; Ji, Z.; Zhang, L.; Zhang, A.; Xia, Y. A hybrid comprehensive performance evaluation approach of cutter holder for tunnel boring machine. Adv. Eng. Inform. 2022, 52, 101546. [Google Scholar] [CrossRef]
- Abushark, Y.B.; Khan, A.I.; Alsolami, F.; Almalawi, A.; Alam, M.; Agrawal, A.; Kumar, R.; Khan, R.A. Cyber Security Analysis and Evaluation for Intrusion Detection Systems. CMC-Comput. Mater. Contin. 2022, 72, 1765–1783. [Google Scholar] [CrossRef]
- Zheng, D.; Hong, Z.; Wang, N.; Chen, P. An improved LDA-based ELM classification for intrusion detection algorithm in IoT application. Sensors 2020, 20, 1706. [Google Scholar] [CrossRef]
- Labiod, Y.; Korba, A.A.; Ghoualmi, N. Fog Computing-Based Intrusion Detection Architecture to Protect IoT Networks. Wirel. Pers. Commun. 2022, 125, 231–259. [Google Scholar] [CrossRef]
- Saba, T.; Rehman, A.; Sadad, T.; Kolivand, H.; Bahaj, S.A. Anomaly-based intrusion detection system for IoT networks through deep learning model. Comput. Electr. Eng. 2022, 99, 107810. [Google Scholar] [CrossRef]
- Yu, J.; Ye, X.; Li, H. A high precision intrusion detection system for network security communication based on multi-scale convolutional neural network. Futur. Gener. Comput. Syst. 2022, 129, 399–406. [Google Scholar] [CrossRef]
- Wu, Z.; Gao, P.; Cui, L.; Chen, J. An incremental learning method based on dynamic ensemble RVM for intrusion detection. IEEE Trans. Netw. Serv. Manag. 2021, 19, 671–685. [Google Scholar] [CrossRef]
- Mokbal, F.; Dan, W.; Osman, M.; Ping, Y.; Alsamhi, S. An efficient intrusion detection framework based on embedding feature selection and ensemble learning technique. Int. Arab. J. Inf. Technol. 2022, 19, 237–248. [Google Scholar] [CrossRef]
- Alanazi, M.; Aljuhani, A. Anomaly detection for internet of things cyberattacks. Comput. Mater. Contin. 2022, 72, 261–279. [Google Scholar] [CrossRef]
- Prasad, M.; Gupta, R.K.; Tripathi, S. A Multi-level Correlation-Based Feature Selection for Intrusion Detection. Arab. J. Sci. Eng. 2022, 47, 10719–10729. [Google Scholar] [CrossRef]
- Patil, D.; Pattewar, T. Majority Voting and Feature Selection Based Network Intrusion Detection System. ICST Trans. Scalable Inf. Syst. 2018, e48. [Google Scholar] [CrossRef]
- Quincozes, S.E.; Passos, D.; Albuquerque, C.; Mossé, D.; Ochi, L.S. An extended assessment of metaheuristics-based feature selection for intrusion detection in CPS perception layer. Ann. Telecommun. 2022, 77, 457–471. [Google Scholar] [CrossRef]
- Prakash, P.J.; Lalitha, B. Optimized Ensemble Classifier Based Network Intrusion Detection System for RPL Based Internet of Things. Wirel. Pers. Commun. 2022, 125, 3603–3626. [Google Scholar] [CrossRef]
- Babu, R.A.; Kannan, S. Bat-Inspired Optimization for Intrusion Detection Using an Ensemble Forecasting Method. Intell. Autom. Soft Comput. 2022, 34, 307–323. [Google Scholar] [CrossRef]
- Niu, Y.; Chen, C.; Zhang, X.; Zhou, X.; Liu, H. Application of a New Feature Generation Algorithm in Intrusion Detection System. Wirel. Commun. Mob. Comput. 2022, 2022, 3794579. [Google Scholar] [CrossRef]
- Wang, Y.; Jin, Z. Rolling bearing fault diagnosis based on fusion CNN and PSO-SVM. J. Mech. Strength 2021, 43, 793–797. [Google Scholar]
- Cui, J.; Li, Y.; Lin, Z.; He, C.; Wang, P.; Li, Y.; Liu, X.; Zhang, Z.; Qian, H.; Lin, Z.; et al. Multi-dimensional evaluation of power market based on multiple attribute decision making. Energy Rep. 2022, 8, 59–65. [Google Scholar] [CrossRef]
- Ge, D.; Zhang, Z.; Kong, X.; Wan, Z. Extreme Learning Machine Using Bat Optimization Algorithm for Estimating State of Health of Lithium-Ion Batteries. Appl. Sci. 2022, 12, 1398. [Google Scholar] [CrossRef]
- Du, X.; Teng, G.; Du, X.; Liu, M.L.; Wang, C.Y. Comprehensive evaluation of environmental comfort in layer poultry house using radar graph. Trans. Chin. Soc. Agric. Eng. 2020, 36, 202–209. [Google Scholar]


| No. | Layer | Size | Step | Number |
|---|---|---|---|---|
| 1 | Input layer | 41 | - | - |
| Input layer | 7 × 7 | - | - | |
| 2 | Convolution layer 1-1 | 3 | 1 | 32 |
| Convolution layer 2-1 | 3 × 3 | 1 × 1 | 32 | |
| 3 | MaxPooling layer 1-1 | 2 | 2 | 32 |
| MaxPooling layer 2-1 | 2 × 2 | 2 × 2 | 32 | |
| 4 | Convolution layer 1-2 | 3 | 1 | 64 |
| Convolution layer 2-2 | 3 × 3 | 1 × 1 | 64 | |
| 5 | MaxPooling layer 1-2 | 2 | 2 | 64 |
| MaxPooling layer 2-2 | 2 × 2 | 2 × 2 | 64 | |
| 6 | Convolution layer 1-3 | 3 | 1 | 96 |
| Convolution layer 2-3 | 3 × 3 | 1 × 1 | 96 | |
| 7 | MaxPooling layer 1-3 | 2 | 2 | 96 |
| MaxPooling layer 2-3 | 2 × 2 | 2 × 2 | 96 | |
| 8 | Convolution layer 1-4 | 3 | 1 | 128 |
| Convolution layer 2-4 | 3 × 3 | 1 × 1 | 128 | |
| 9 | GlobalMaxPooling layer 1-1 | - | - | - |
| GlobalMaxPooling layer 2-1 | - | - | - |
| Model | FCNN-SE |
|---|---|
| p-Value | |
| DA | 3.85 × 10⁻⁸ |
| KNN | 3.16 × 10⁻³ |
| DT | 1.70 × 10⁻³ |
| NB | 4.58 × 10⁻⁹ |
| LR | 5.88 × 10⁻⁶ |
| Model | Class 1 | Class 2 | Class 3 | Class 4 | Class 5 |
|---|---|---|---|---|---|
| Raw Dataset | 0.7957 | 0.7490 | 0.6262 | 0.7593 | 0.2679 |
| 1DCNN | 0.9228 | 0.9138 | 0.9111 | 0.9172 | 0.8474 |
| 2DCNN | 0.9264 | 0.9210 | 0.9277 | 0.9272 | 0.8206 |
| FCNN | 0.9296 | 0.9297 | 0.9296 | 0.9297 | 0.9299 |
Publisher’s Note: MDPI stays neutral with regard to jurisdictional claims in published maps and institutional affiliations. |
© 2022 by the authors. Licensee MDPI, Basel, Switzerland. This article is an open access article distributed under the terms and conditions of the Creative Commons Attribution (CC BY) license (https://creativecommons.org/licenses/by/4.0/).
Share and Cite
Chen, C.; Song, Y.; Yue, S.; Xu, X.; Zhou, L.; Lv, Q.; Yang, L. FCNN-SE: An Intrusion Detection Model Based on a Fusion CNN and Stacked Ensemble. Appl. Sci. 2022, 12, 8601. https://doi.org/10.3390/app12178601
Chen C, Song Y, Yue S, Xu X, Zhou L, Lv Q, Yang L. FCNN-SE: An Intrusion Detection Model Based on a Fusion CNN and Stacked Ensemble. Applied Sciences. 2022; 12(17):8601. https://doi.org/10.3390/app12178601
Chicago/Turabian StyleChen, Chen, Yafei Song, Shaohua Yue, Xiaodong Xu, Lihua Zhou, Qibin Lv, and Lintao Yang. 2022. "FCNN-SE: An Intrusion Detection Model Based on a Fusion CNN and Stacked Ensemble" Applied Sciences 12, no. 17: 8601. https://doi.org/10.3390/app12178601
APA StyleChen, C., Song, Y., Yue, S., Xu, X., Zhou, L., Lv, Q., & Yang, L. (2022). FCNN-SE: An Intrusion Detection Model Based on a Fusion CNN and Stacked Ensemble. Applied Sciences, 12(17), 8601. https://doi.org/10.3390/app12178601