Article

A Hybrid Method for Structural Modal Parameter Identification Based on IEMD/ARMA: A Numerical Study and Experimental Model Validation

1
School of Civil Engineering, Liaoning Petrochemical University, Fushun 113001, China
2
College of Civil Engineering, Fuzhou University, Fuzhou 350108, China
*
Author to whom correspondence should be addressed.
Appl. Sci. 2022, 12(17), 8573; https://doi.org/10.3390/app12178573
Submission received: 2 August 2022 / Revised: 23 August 2022 / Accepted: 24 August 2022 / Published: 27 August 2022

Abstract

:
This article presents a hybrid method of structural modal parameter identification, based on improved empirical mode decomposition (EMD) and autoregressive and moving average (ARMA). Special attention is given to some implementation issues, such as the modal mixing, false modes, the judgment of the real intrinsic mode function (IMF) of classical EMD, and the difficulty of fixing the order of ARMA. To resolve the existing defects of EMD, an improved EMD (IEMD) that combines frequency band filtering and cluster analysis is proposed in this paper, where frequency band filtering divides the signal into several narrowband signals before the EMD process, and cluster analysis is used to determine the real IMFs. Euclidean distance is used to cluster the decomposition results, with no need to adjust any indexes or thresholds, and only by means of using the nearest distance to efficiently determine the real IMF. Moreover, IEMD is used as a pre-processing tool for ARMA, to resolve the difficulty of fixing its order. The capabilities of the proposed method were compared and assessed using a numerical simulation and an experimental model. The numerical simulation and experimental results showed that the improved method could resolve the modal mixing and false modal problems in the classical EMD process and could automatically identified the real IMFs, while the proposed IEMD was combined with ARMA to successfully identify the frequency and mode shape of the structure. Additionally, since each IMF is a single component signal, it is easy to determine the order of the ARMA model.

1. Introduction

It is of great practical significance to carry out research on the health monitoring and damage identification of engineering structures based on structural vibration response [1,2,3,4], especially the modal analysis of large structures using vibration response data under environmental excitation, which has become a hot issue in current research [5,6,7].
In recent years, the time-domain method, frequency-domain method, and time-frequency domain method have been commonly used to analyze vibration response, such as the ITD (Ibrahim time domain), stochastic subspace identification (SSI) [8], natural excitation technique (NExT) [9], variational mode decomposition (VMD) [10], and time series analysis method, etc. Among the existing time series analysis methods, ARMA has attracted much attention and been widely used, because of its superior performance [11]. However, in the process of practical application, the ARMA model method often requires that the time series is a series of zero mean stationary random process, which is not consistent with the measured signals of actual engineering [12,13]. Furthermore, it is hard to select the order of an AR/ARMA model according to these limited measurements [14,15].
Aiming at analysis and processing for nonlinear and non-stationary signals, the Hilbert–Huang transform (HHT) [16,17] was proposed, the core of which is the EMD method. After HHT was proposed, it was widely applied in many fields of engineering. In the actual application of HHT, the scholars found that the HHT method for structural modal parameter identification often encounters problems, such as mode mixing, false mode, and endpoint effects; therefore, many scholars are trying to improve the classic EMD [18,19]. At present, scholars have proposed relevant improvement methods based on independent component analysis (ICA) [20], singular value decomposition (SVD) [21], and empirical mode decomposition (EEMD) [22]. Among them, the most widely-accepted improvement is the EEMD proposed by Huang. Unfortunately, the problems of mode mixing and endpoint effects in EMD have not been fundamentally solved. Many scholars are committed to solving the problem of the endpoint effect of EMD, but the results are often not satisfactory, and many methods have problems of poor adaptivity, a large amount of computation, and long operation time. On the other hand, mode mixing and false modal are other bottleneck problems that hinder the application of EMD. Huang proposed the method of interrupt detection, to solve the phenomenon of mode mixing; namely, the results are directly observed and re-decomposed if modal mixing occurs. This method required human posterior judgment, and the decomposition efficiency was greatly reduced. Therefore, it is still necessary to efficiently solve the mode mixing of EMD. Inspired by recent auto-ID (automatic identification) technology [23,24,25], this paper tries to use cluster analysis to automatically identify the real IMFs.
In summary, in order to improve the above mentioned shortcomings of ARMA and EMD and to also further expand the application of these methods, this paper proposes a new hybrid automatic method for structural modal parameter identification based on IEMD and ARMA, and the effect of the proposed method was verified using a seven-story steel frame test apparatus in the laboratory. This paper is organized as follows: in Section 2, the algorithms of ARMA and EMD are introduced. The improved ARMA based on IEMD is discussed in detail in Section 3. A numerical simulation and a seven-story steel test frame in the laboratory to verify its effects are discussed in Section 4 and Section 5. The conclusions are given in the last part.

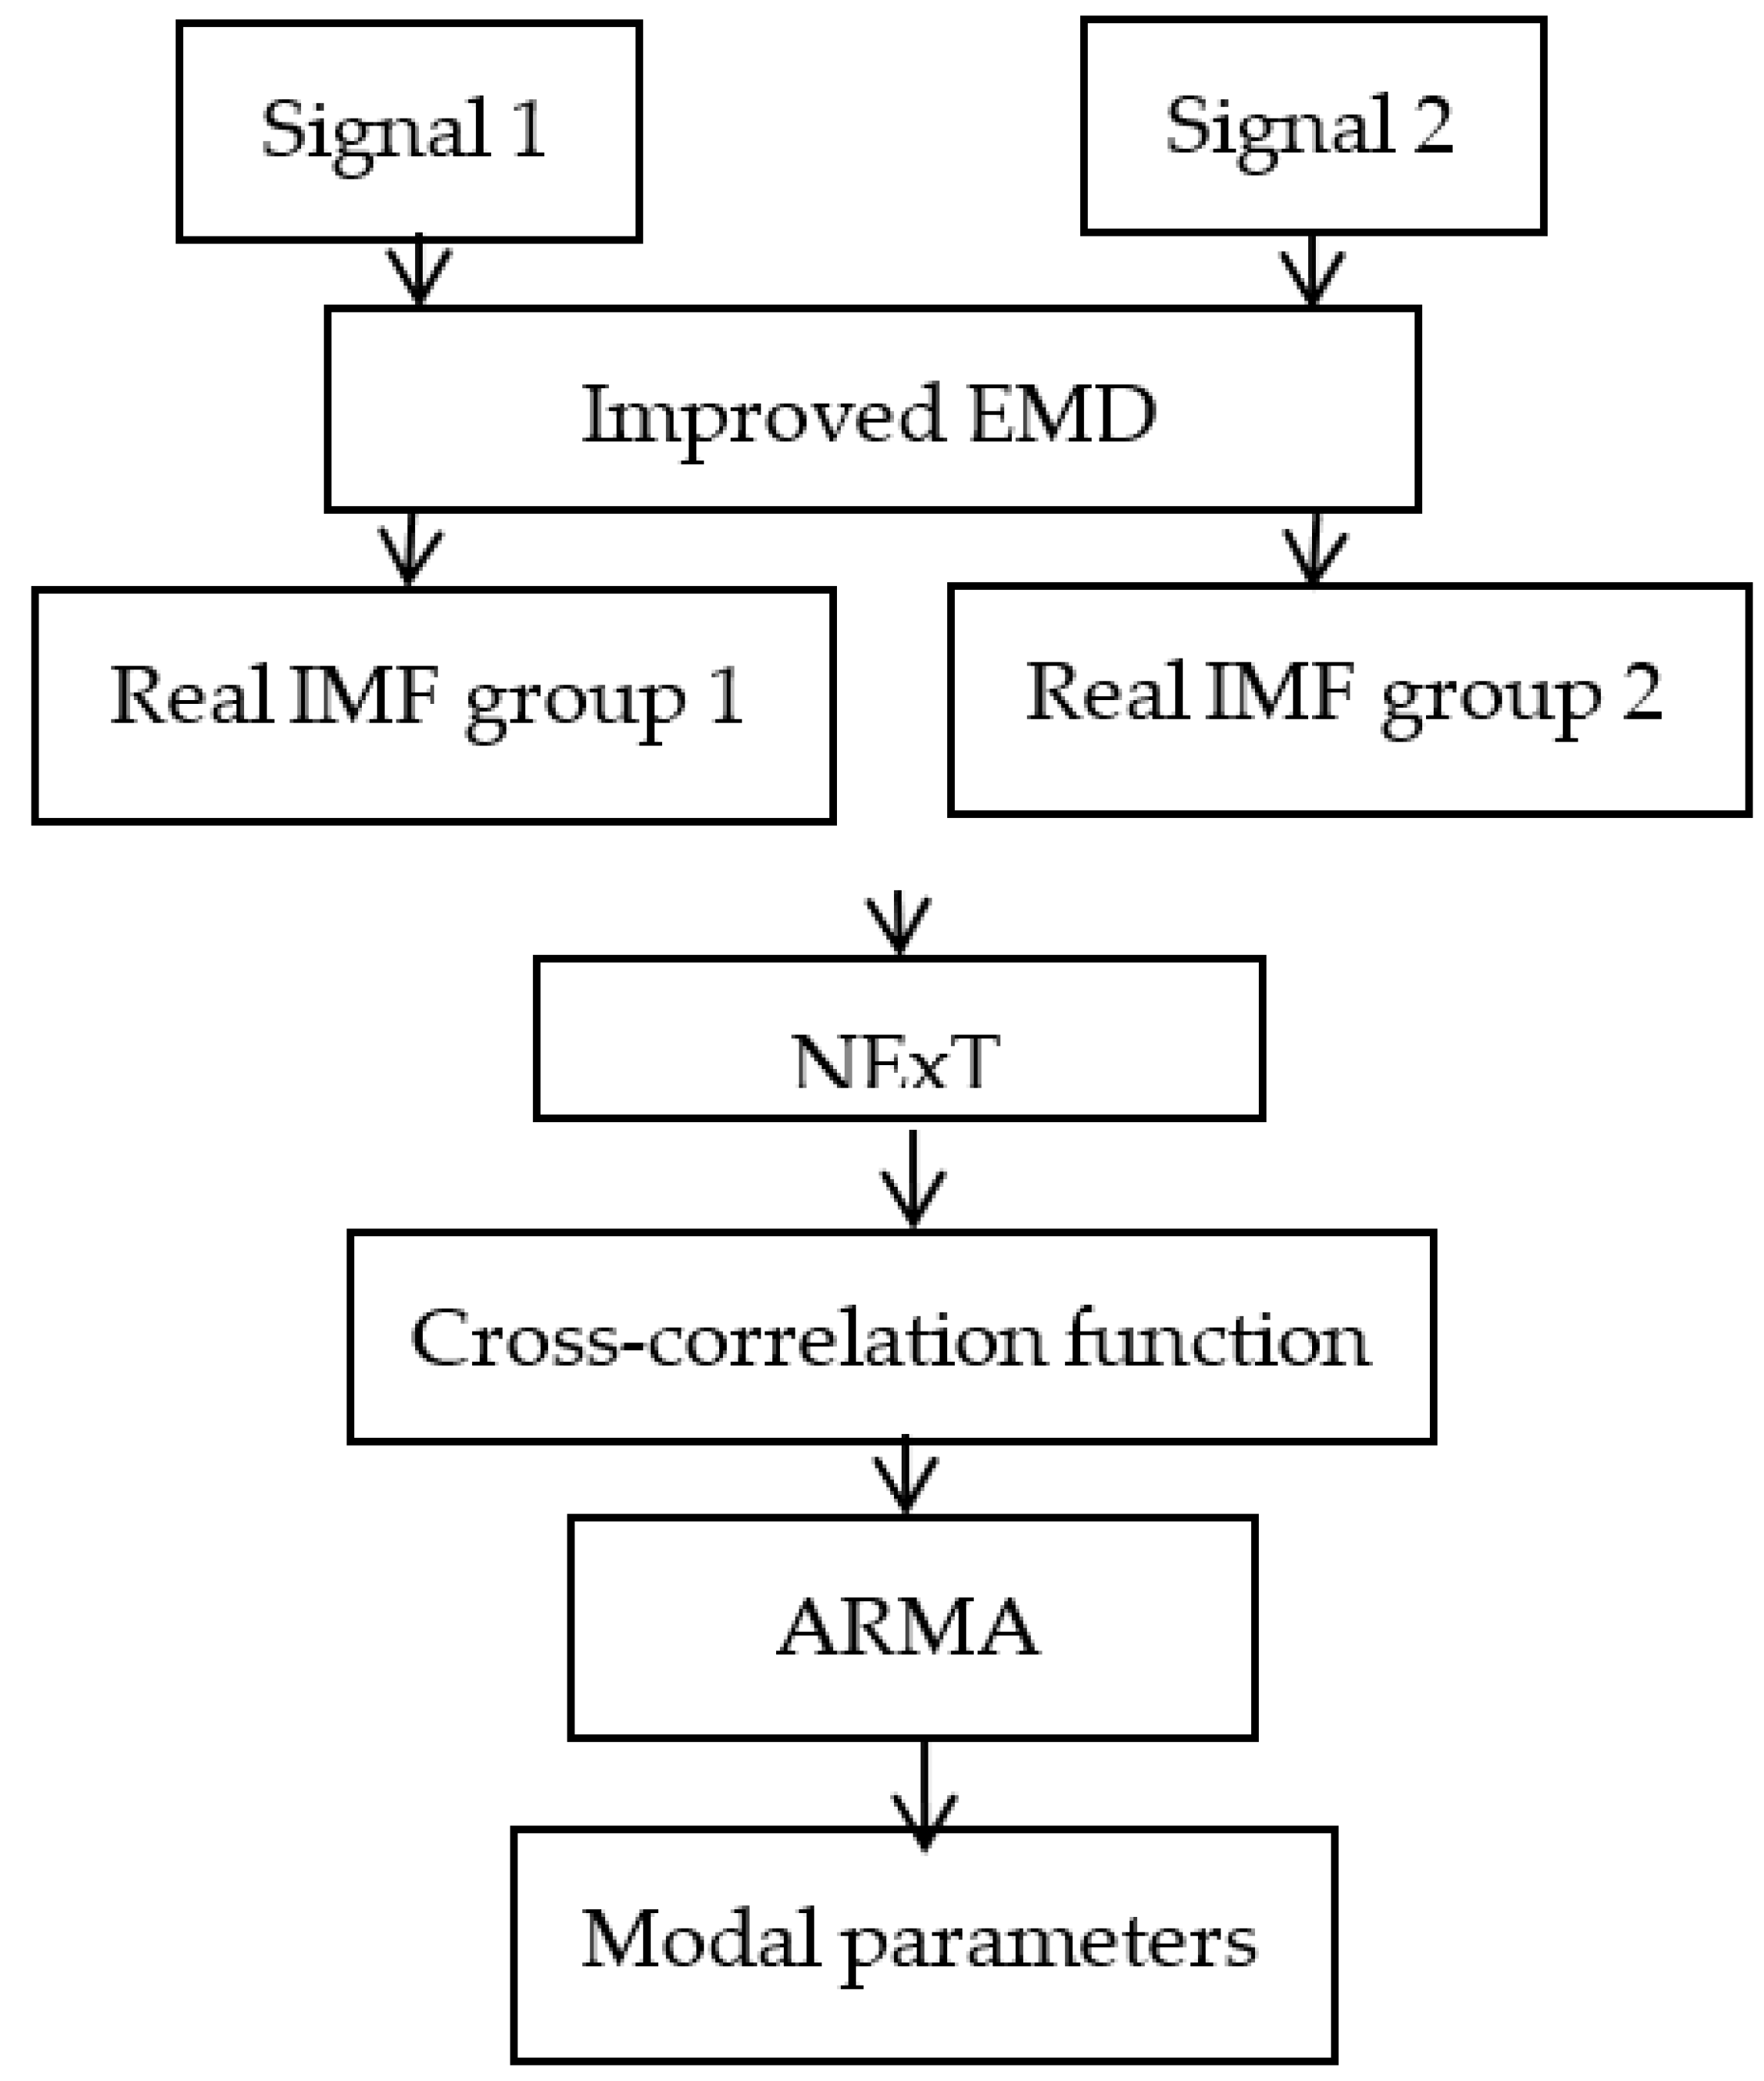
2. Theoretical Background of Proposed Method

2.1. EMD

The EMD was first proposed by Huang et al. [16], in 1998, and uses a sifting process to extract intrinsic mode functions(IMFs) and a final residue, from a complicated multi-component signal x(t), i.e.,
x ( t ) = i = 1 m y i ( t ) + r ( t )
where m is the total number of IMFs, yi(t) (i = 1 to m) is the ith IMF, and r(t) is the final residue. Each IMF represents a different type of frequency in theory, and each IMF satisfies the following two features: (1) The maximum difference between the number of extreme points and the number of zero crossings is one; (2) At any data point, the average value of the local minimum envelope and the local maximum envelope of data are zero. The point is that the decomposition process of EMD is adaptive, which means that it does not need to select a basis function in the decomposition process, and is superior to wavelet transform.
However, there are still some drawbacks to the results of EMD, i.e., the end-point effect, mode mixing, and real IMF determination [18,19,22]. Here, mode mixing is defined as any IMF consisting of oscillations of dramatically disparate scales, or similarly featured time scales that are distributed in different IMFs, resulting in the mixing and mutual influence of two adjacent IMFs, which is difficult to identify. Owing to the phenomenon of mode mixing, the decomposition of EMD loses its meaning, let alone the accurate identification of modal parameters, so mode mixing is a limitation of EMD. Therefore, it is necessary to improve the classical EMD to obtain a greater accuracy of modal parameter identification. To solve the limitations of mode mixing and real IMF determination in classical EMD, an IEMD is proposed in this paper.

2.2. IEMD

The occurrence of mode mixing destroys the physical meaning of the subsequent IMF. In addition, the issue of the judgement of real IMFs is also worth studying. Therefore, in this study, in order to improve the mode mixing problem, frequency band filtering was used to improve the classical EMD, so as to effectively suppress the occurrence of mode mixing in the process of classical EMD. However, many false modes are generated at the same time. For this reason, cluster analysis was used to obtain the real IMFs in this paper. Hence, combining a band-pass filter and cluster analysis, an IEMD (as shown in Figure 1) is proposed.
The specific steps are as follows:
(1)
Use fast Fourier transform (FFT) to obtain the spectrum of the acceleration response signal, seeking each peak frequency as the center frequency of the band-pass filter, and then let the signal go through to the specific frequency-band filter. Namely, using FFT to analyze the acceleration signal x ¨ p ( t ) , utilizing the frequency spectrum of FFT to choose the peak frequency, and then roughly estimate each frequency range, for example, μ j L < μ j < μ j H , then let the signal x ¨ p ( t ) pass the band-pass filter with specific bandwidth μ j L < μ j < μ j H , (here μ j L < μ j L , μ j H < μ j H ) eventually, the signal x ¨ p ( t ) will be differentiated into limited sub-band acceleration signals.
(2)
After filtering, each sub-band signal is processed by EMD, and IMFs component of each sub-signal are obtained successively.
(3)
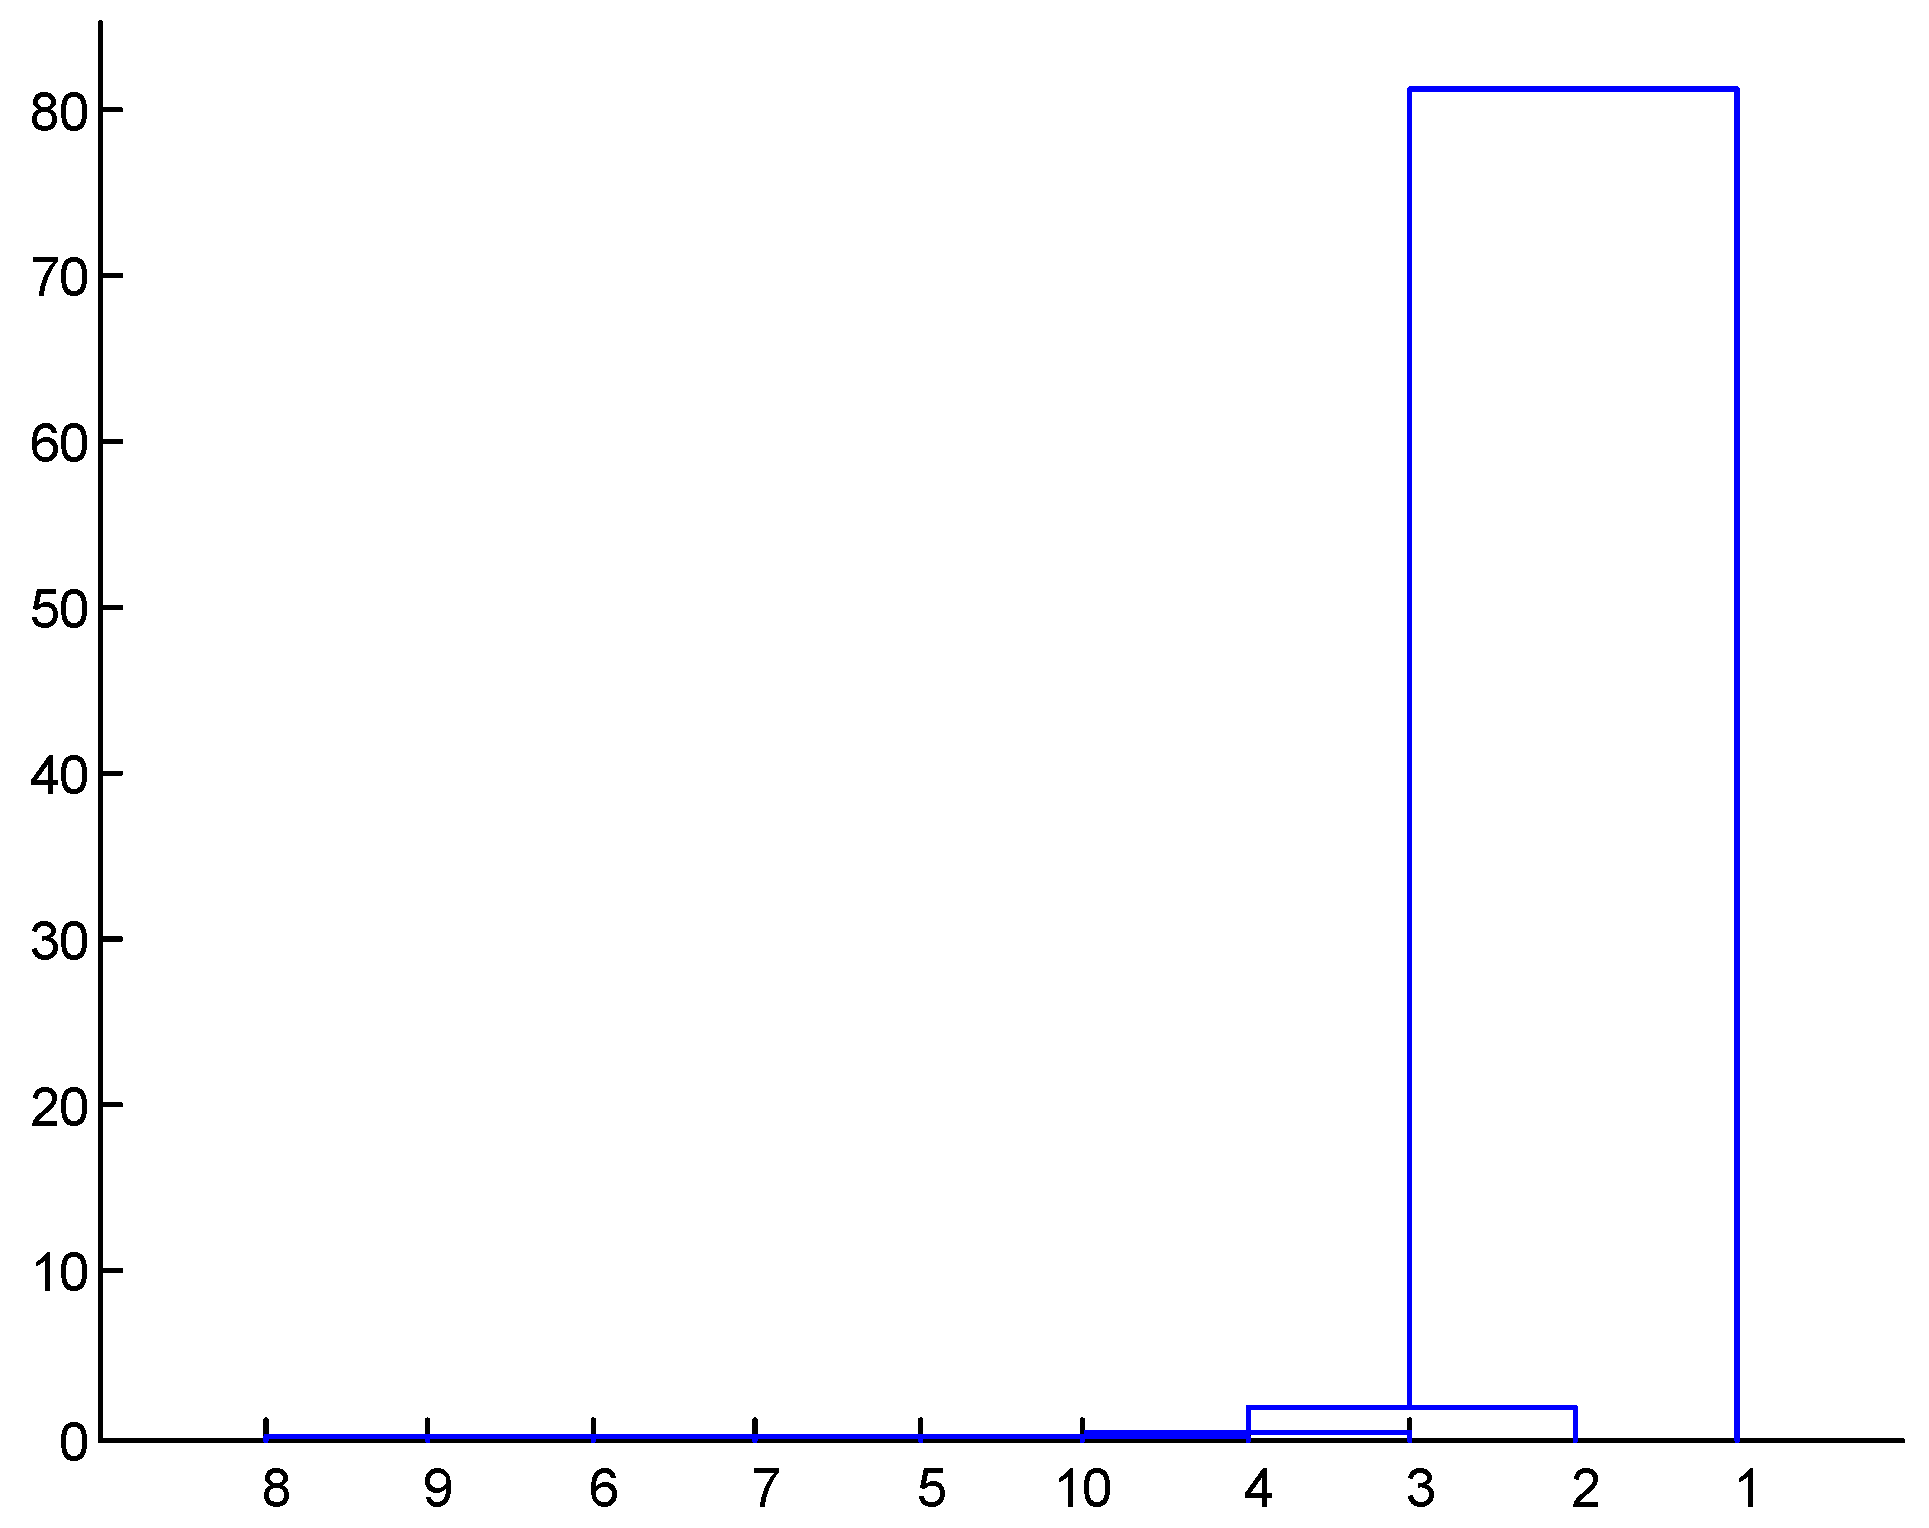
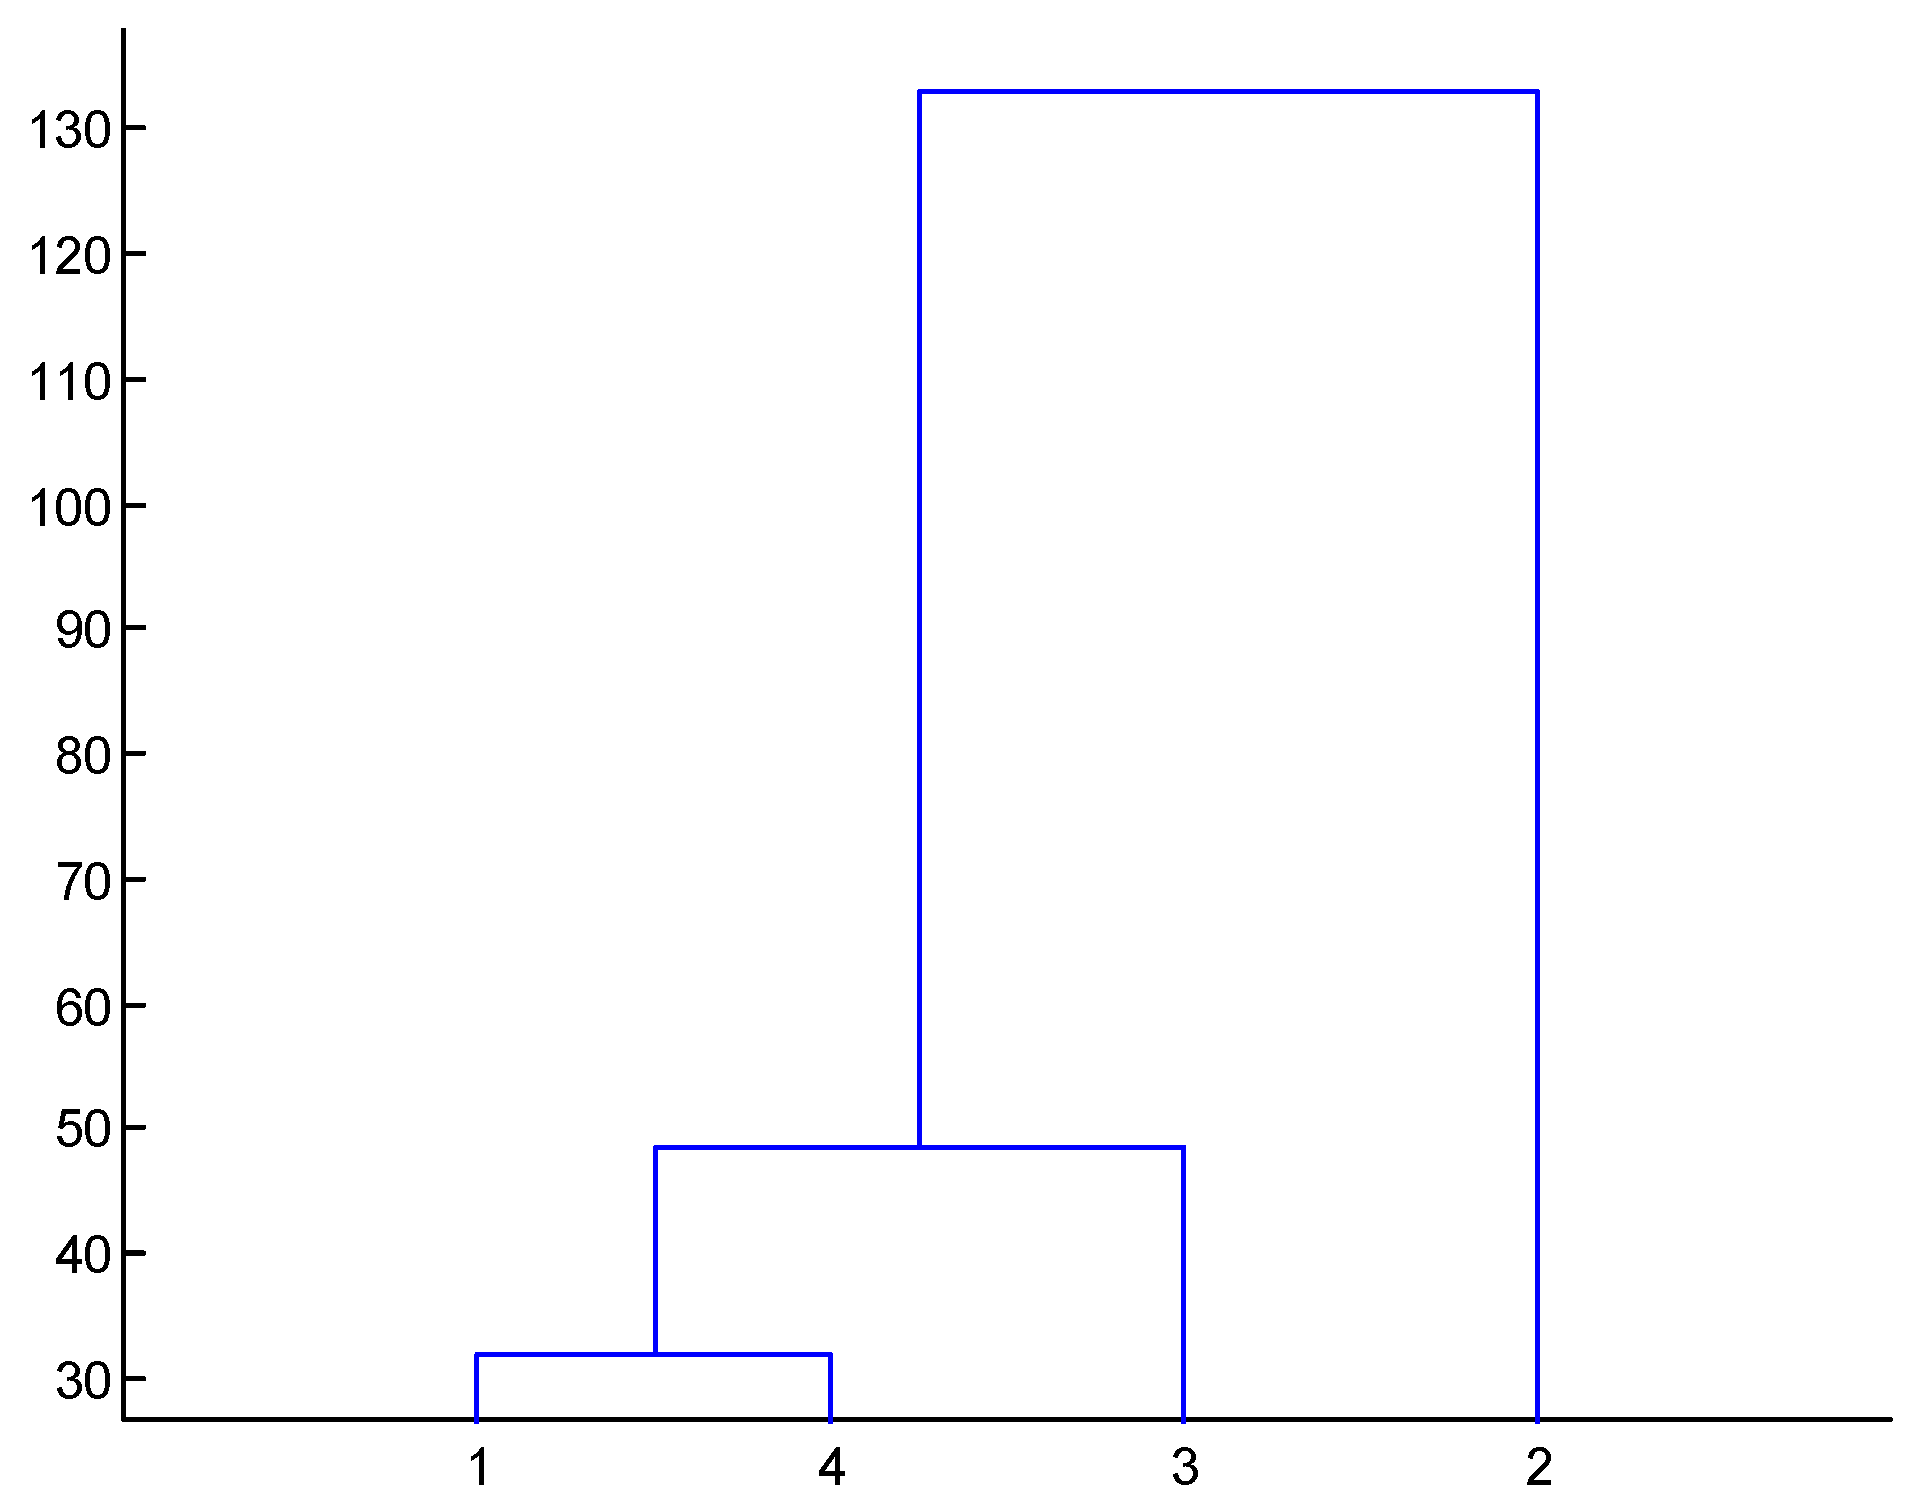
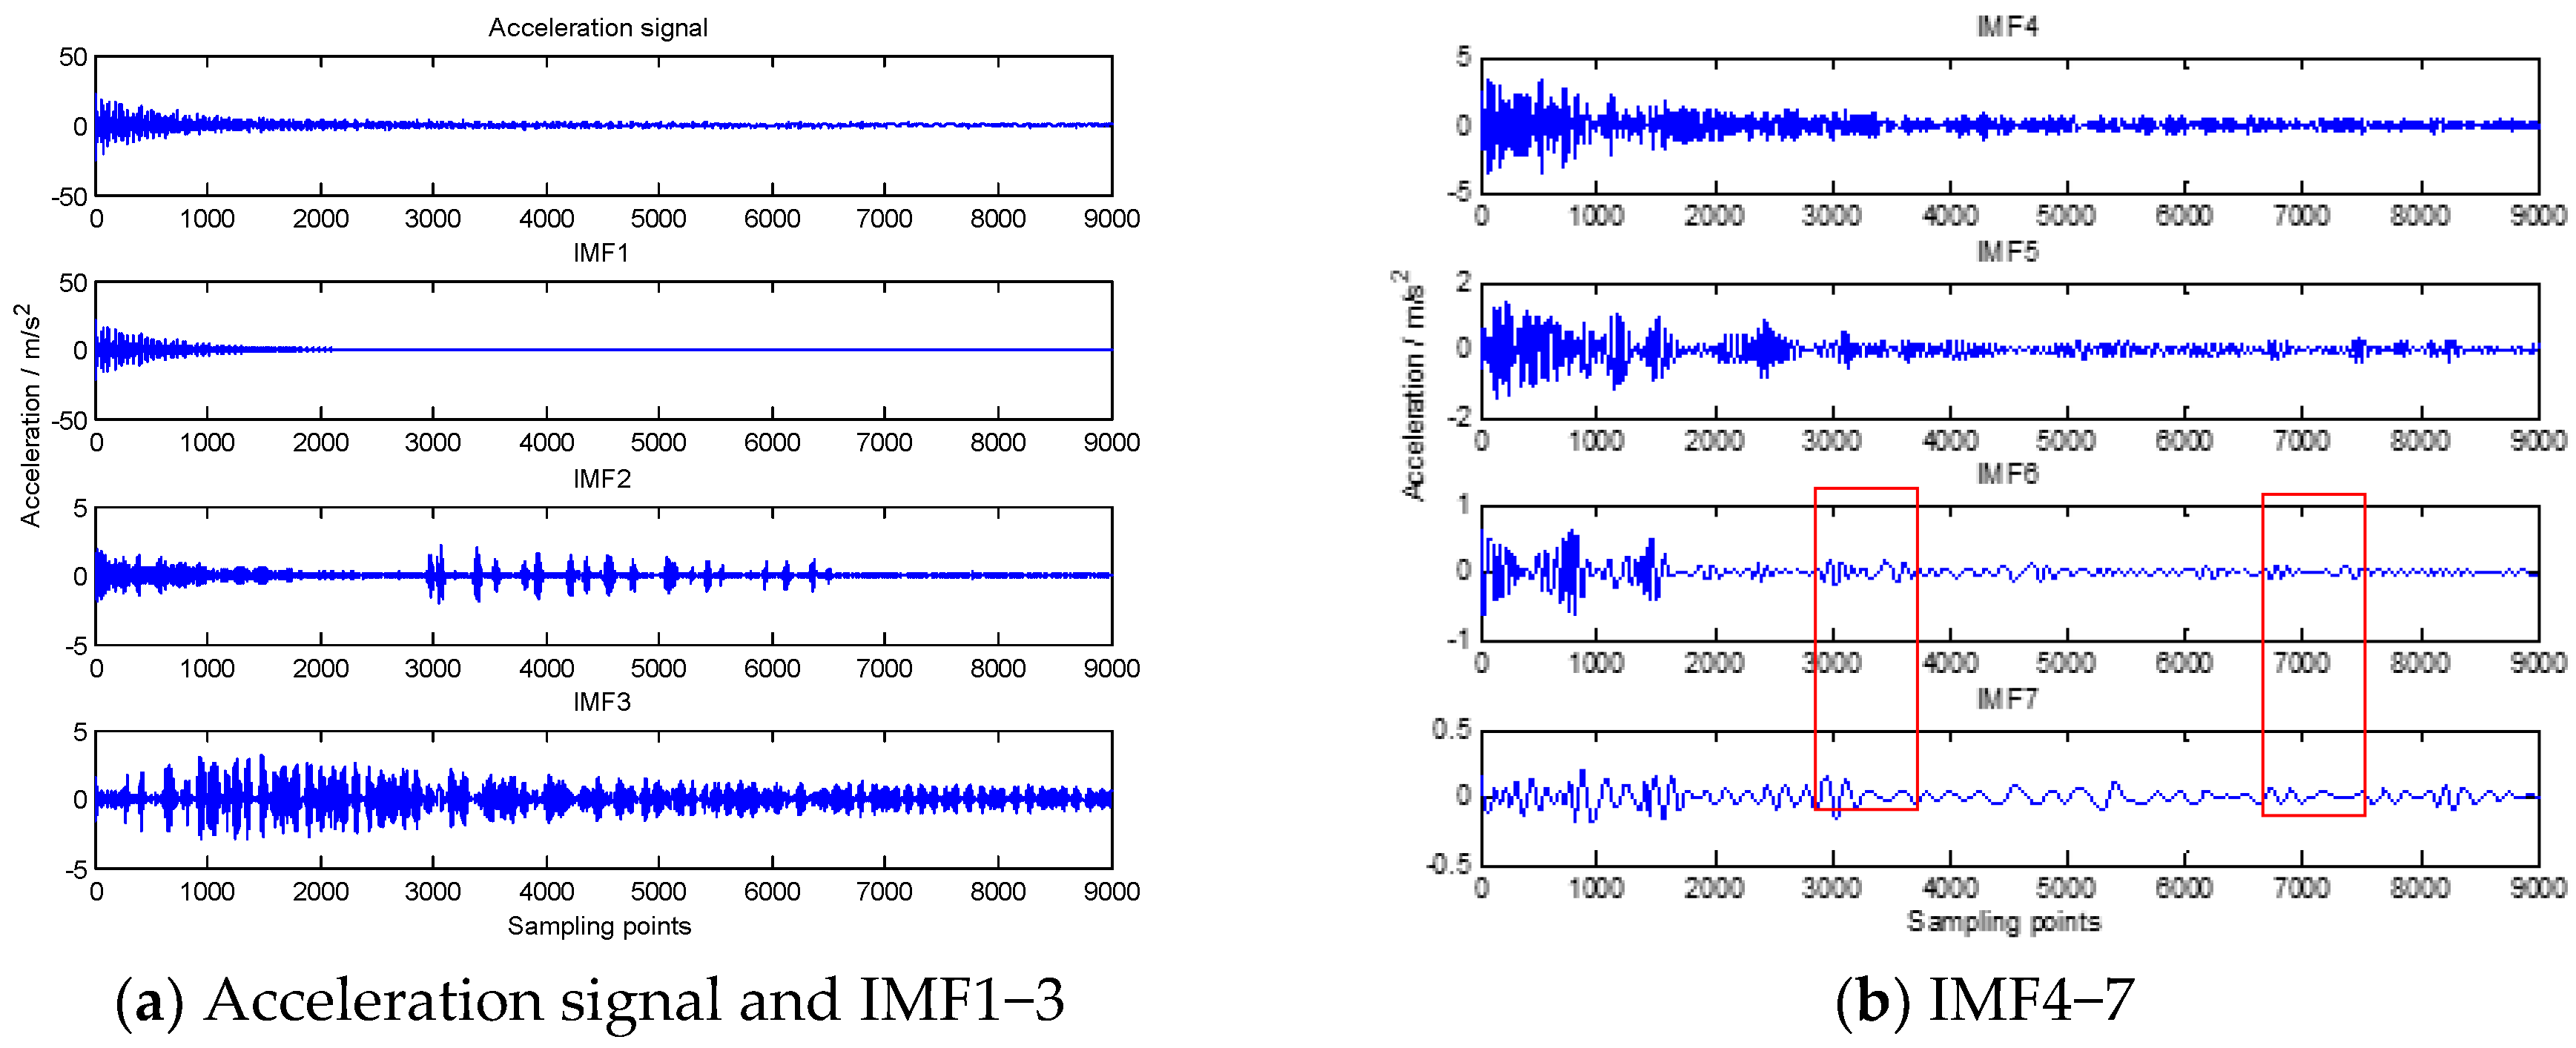
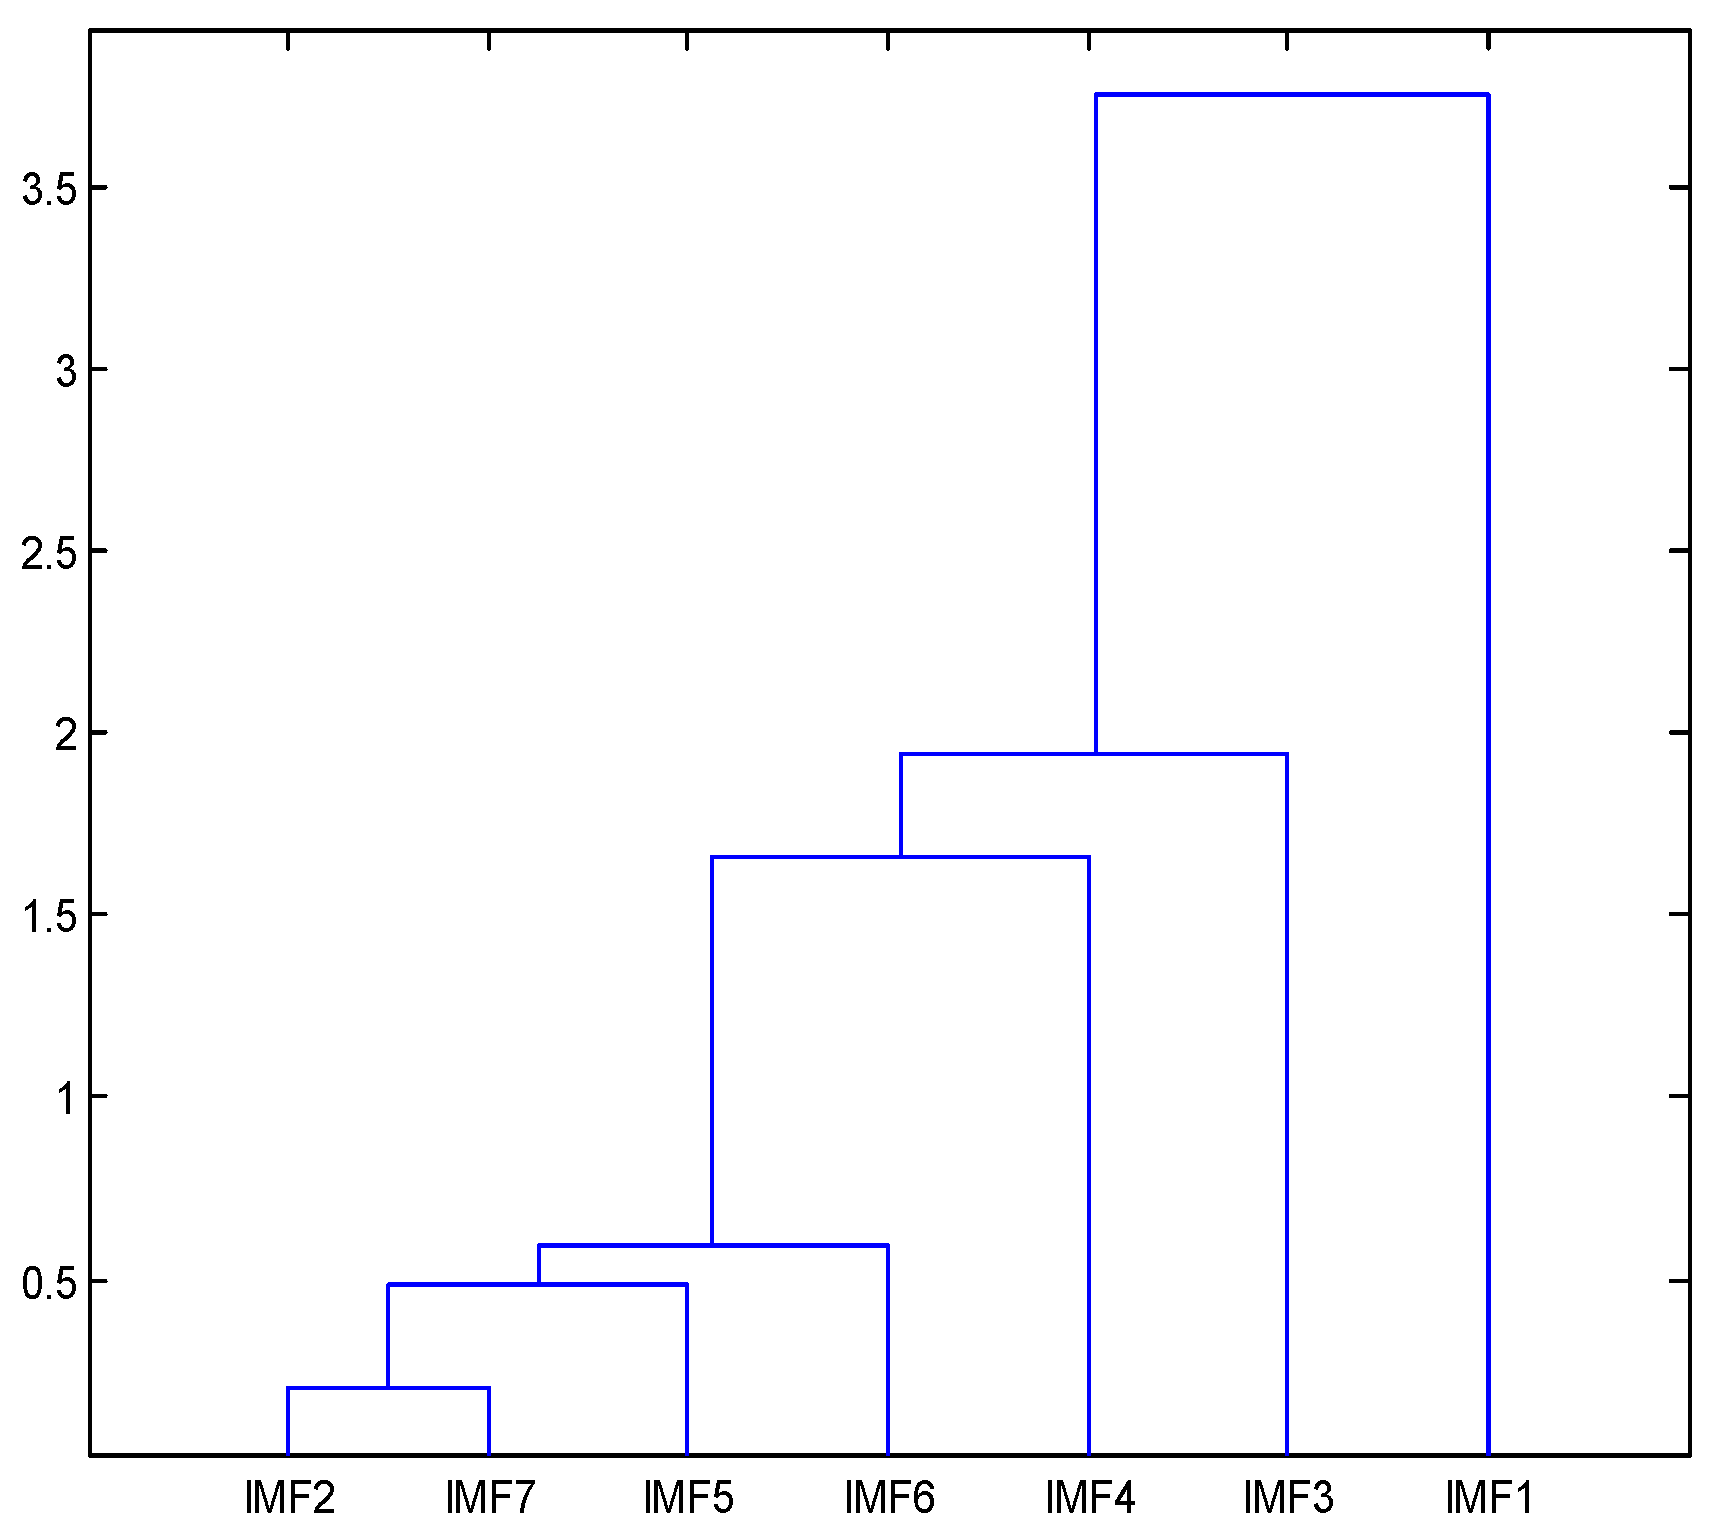
After the signal is processed according to the two steps mentioned above, multiple IMF groups are obtained. The key problem is how to identify the real IMFs from multiple IMF groups. In view of this, cluster analysis [26] using the multivariate data analysis method is introduced in this paper to solve the problem of the determination of the real IMF. Through a two-time cluster analysis, the screened IMF can be guaranteed to be the real IMF, and there is no mode mixing among the IMFs.

2.3. ARMA

The basic principle of ARMA [12] is as follows:
(1)
In a practical application, a high-order differential equation can be used to describe the relationship between an incentive and response for the N degrees of freedom linear system in a discrete time domain, which is composed of a series of time series in different times; namely, the ARMA time-series model in Equation (2), this equation can be used to represent specific relations between xt (response data sequence) and xt−k (history value).
k = 0 2 N a k x t k = k = 0 2 N b k f t k
where the left side of the equation is the AR model; namely, the autoregressive difference polynomial. The right side of the equation is the MA model; namely, the sliding average difference polynomial. 2N is the order of the autoregressive and sliding mean models. ak is the autoregressive coefficient of the system to be identified, bk is the sliding mean coefficient to be identified, and ft is excited by white noise. When k = 0, a0 and b0 are regarded as 1.
(2)
According to the generalized Yule–Walker equation (Equation (3)), the least squares solution (Equation (4)) of the system can be obtained using the pseudo-inverse method, and the autoregressive coefficient ak (k = 1, 2, …, 2N) can be obtained.
[ R ] ( L M ) × M { a } M × 1 = [ R ] ( L M ) × 1
{ a } = ( [ R ] T [ R ] 1 ) ( [ R ] T { R } )
where R is the autocorrelation function of xt.
(3)
The sliding average model coefficient bk (1, 2, …, 2N) can be obtained by using the nonlinear equations (Equation (5)).
{ b 0 2 + b 1 2 + b M 2 = c 0 b 0 b 1 + + b M 1 b M = c 1 b 0 b M = c M
(4)
ak and bk can be obtained from Equations (4) and (5), and the modal parameters of the system can be calculated through the transfer function expression of the ARMA model. The transfer function of the ARMA model is shown in Equation (6):
H z = K = 0 2 N b k z k k = 0 2 N a k z k
Using a high-order algebraic equation to solve the poles of the transfer function, and the relationship between the modal frequency ω k and damping ratio ξ k of the system is shown in Equation (7):
z k = e s k Δ t = e ( ξ k ω k + j ω k 1 ξ k 2 ) Δ t
(5)
Modal frequency ω k and damping ratio ξ k obtained using Equation (7), as shown in Equation (8):
{ ω k = | R k | / Δ t , R z = ln z k = s k Δ t ξ k = 1 1 + [ l m ( R k ) / R e ( R k ) ] 2

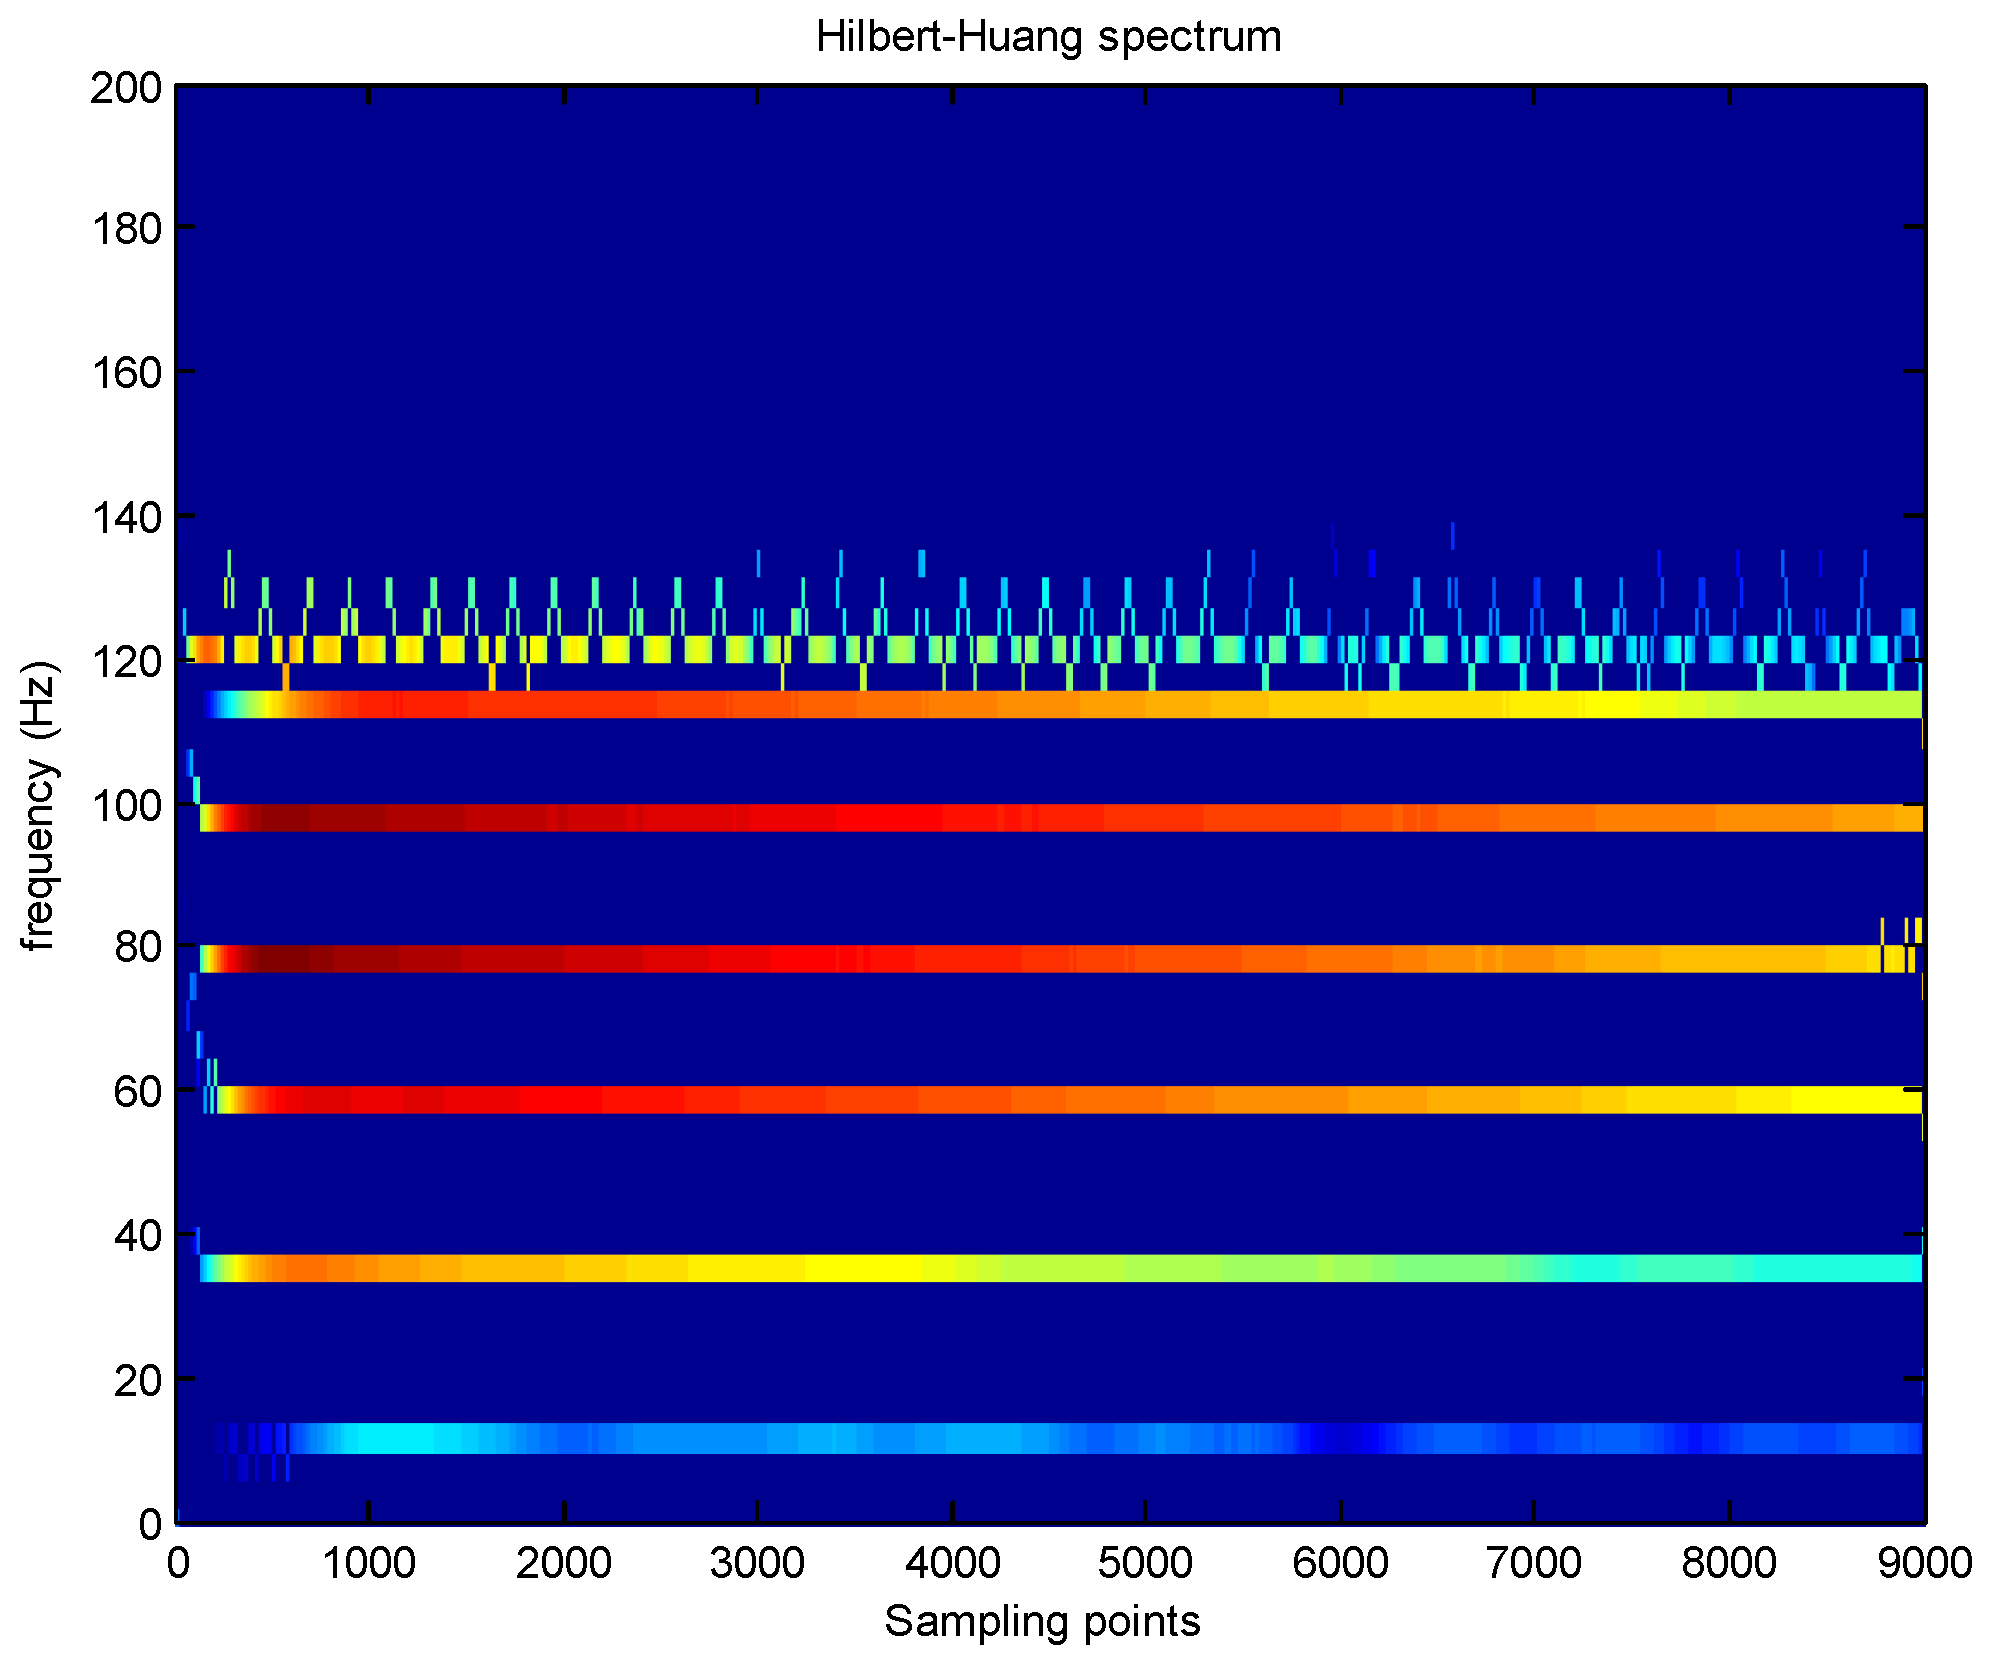
3. The Principle of IEMD and ARMA

Based on the IEMD, a hybrid method for structural modal parameter identification is proposed, its identification process is shown in Figure 2; first, using IEMD to address two groups of acceleration response signals, to obtain two sets of IMFs, with one group as the reference signal and the obtained cross-spectral density function corresponding to every IMF; then, using Fourier inverse transformation to obtain the cross-correlation function, then, using NExT to obtain the free vibration response; finally, ARMA is used to identify the modal parameters of the structure.
ARMA was used to extract the modal parameters of the structure, assuming the cross-correlation function was expressed by Rj, which was obtained using the inverse Fourier transform of the jth cross-spectral density function and taken as the free vibration response of the structure xj.
According to literature [11], the GREEN function of the ARMA model can be used to solve the frequency and damping ratio of the system, while the residue can be used to obtain the structural mode shapes. Assuming the excitation point is at the point q, and the kth residue corresponding to the transfer function Hpj(s) of the response at point p as Akpq, then the residue can be obtained from the following equation:
A k p q = lim z z k H p q ( z ) ( z k ) = k = 0 z N b k z k k = 0 z N a k z k ( z z k ) | z = z k
Thereby, the vibration pattern vector can be obtained by processing the residues obtained from all response measurement points. If a structure contains n response measurement points, it is necessary to determine the corresponding measurement points of the maximum absolute value of the remaining number of n corresponding modes of the same order. If the measurement point is m, the normalized complex mode shape vector corresponding to the kth mode is:
{ ϕ k } = [ A k 1 q   A k 2 q       A knq ] T / A k m q

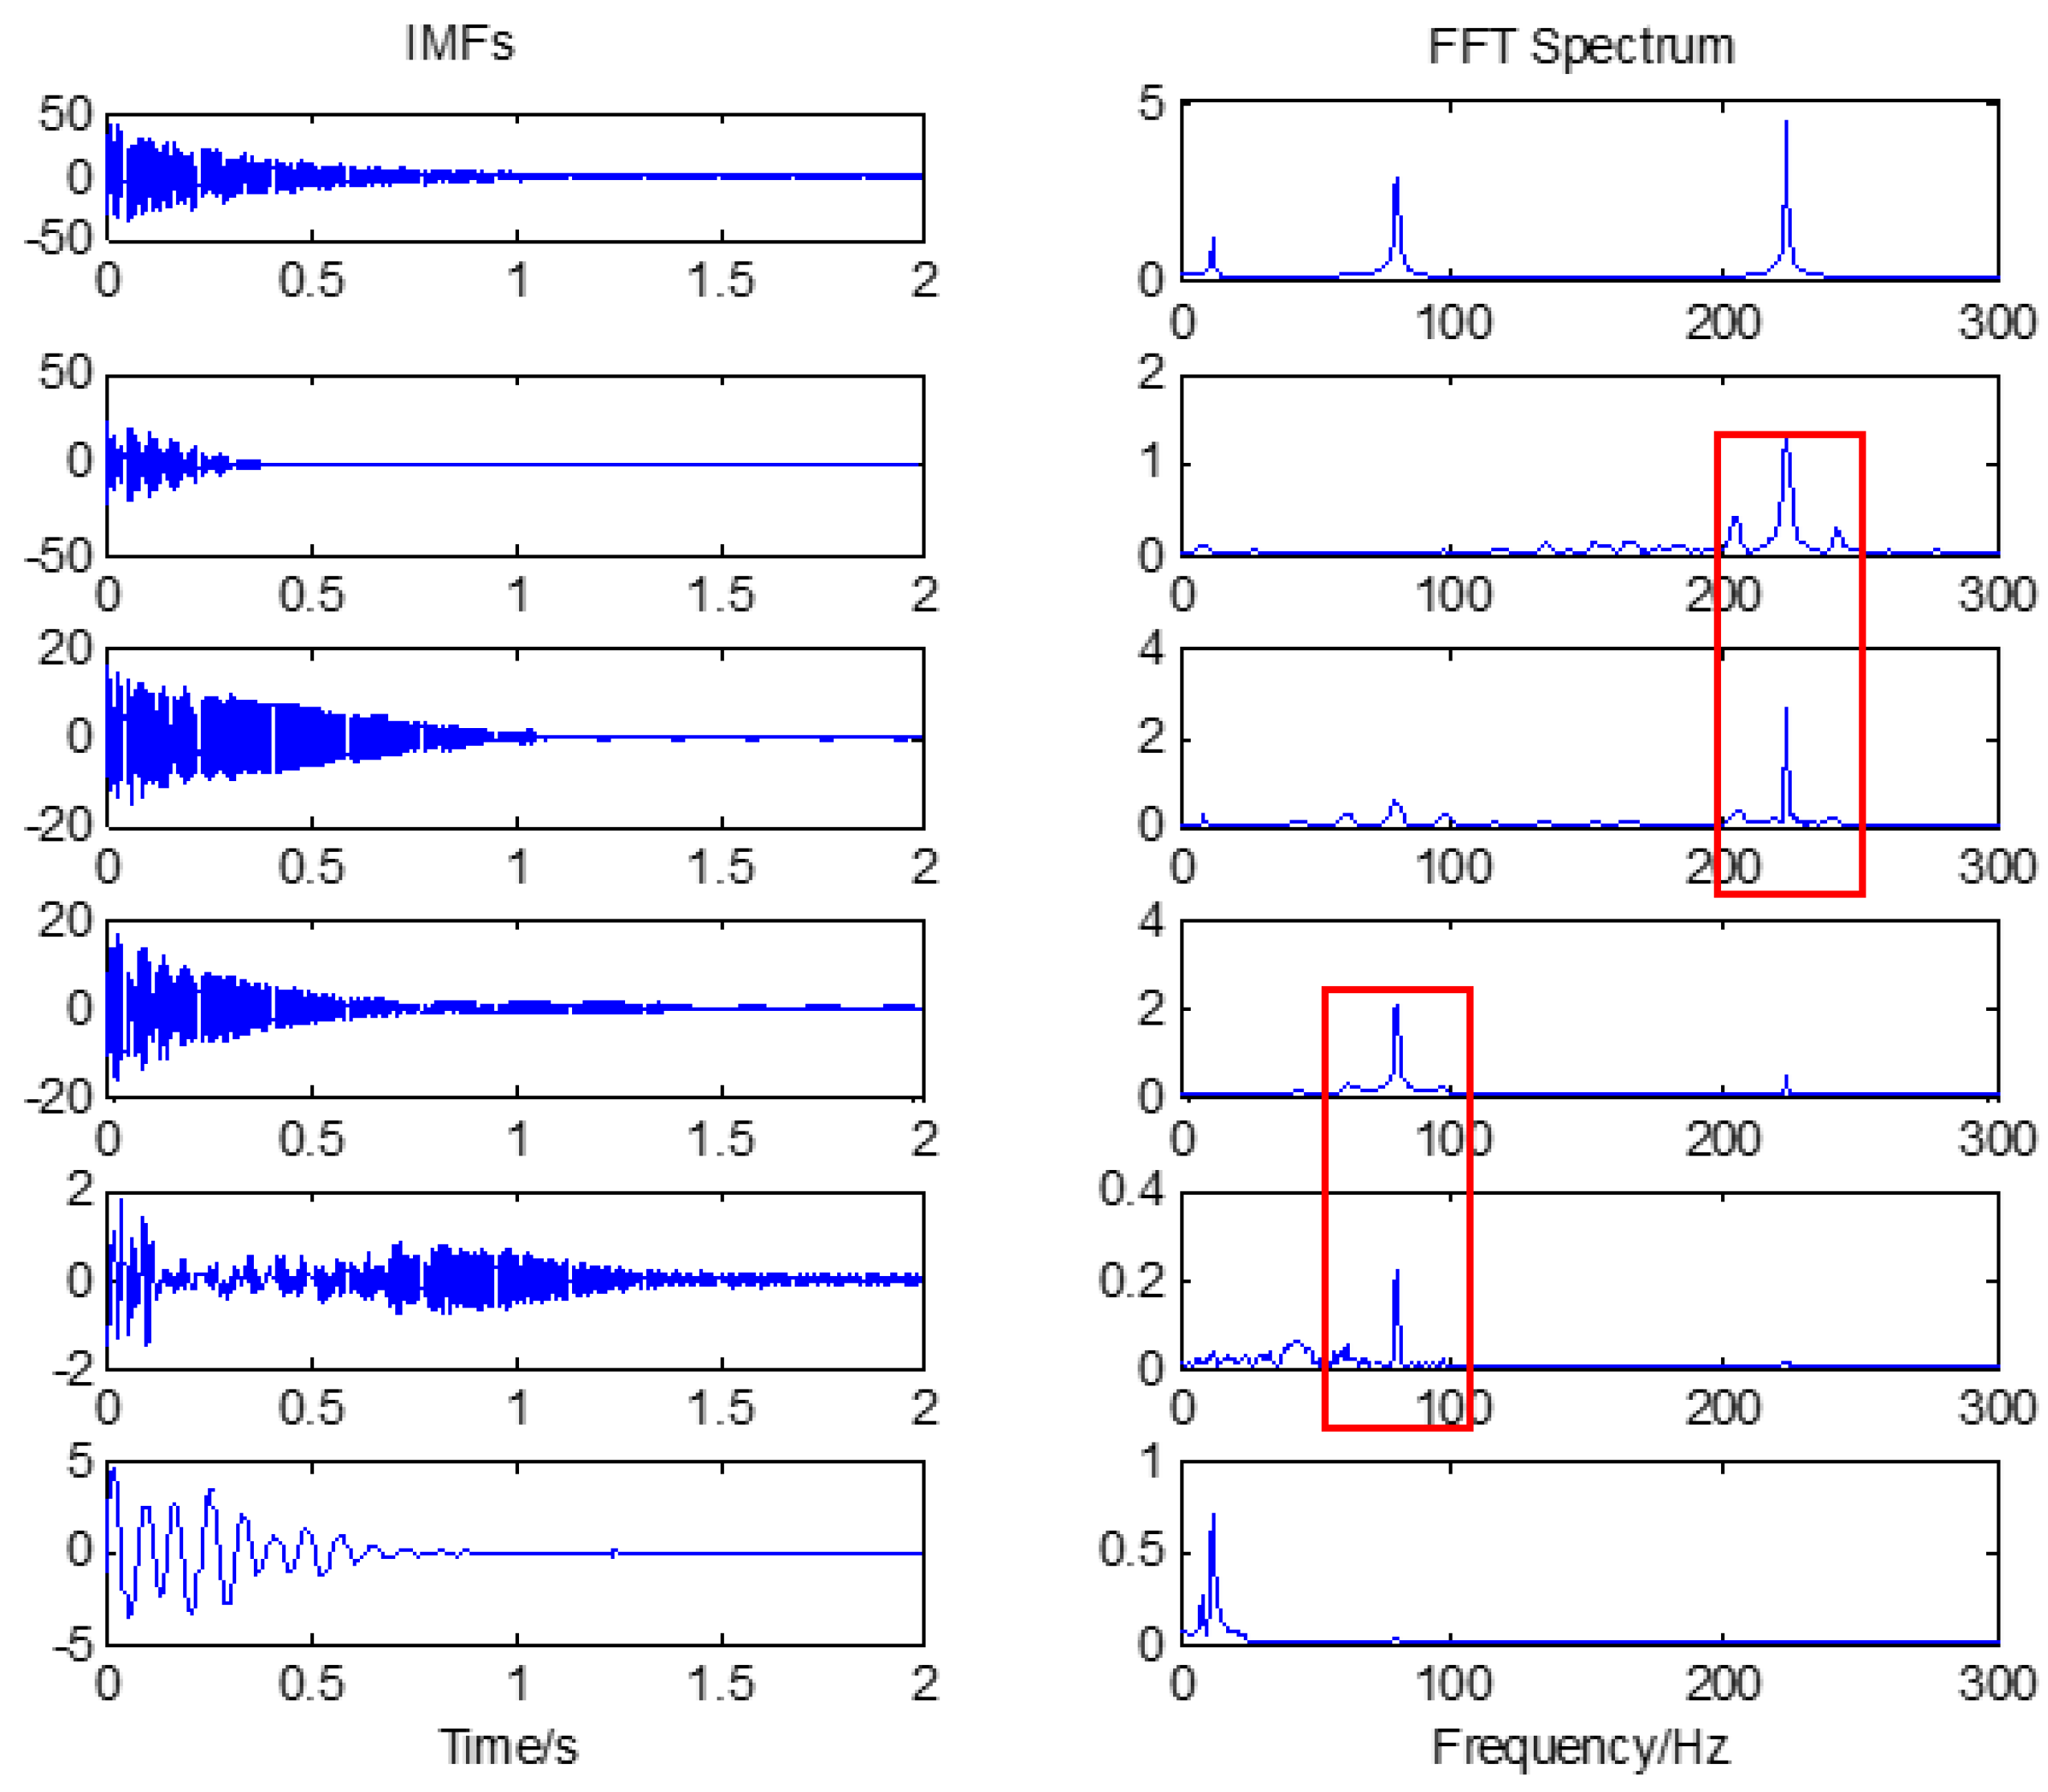
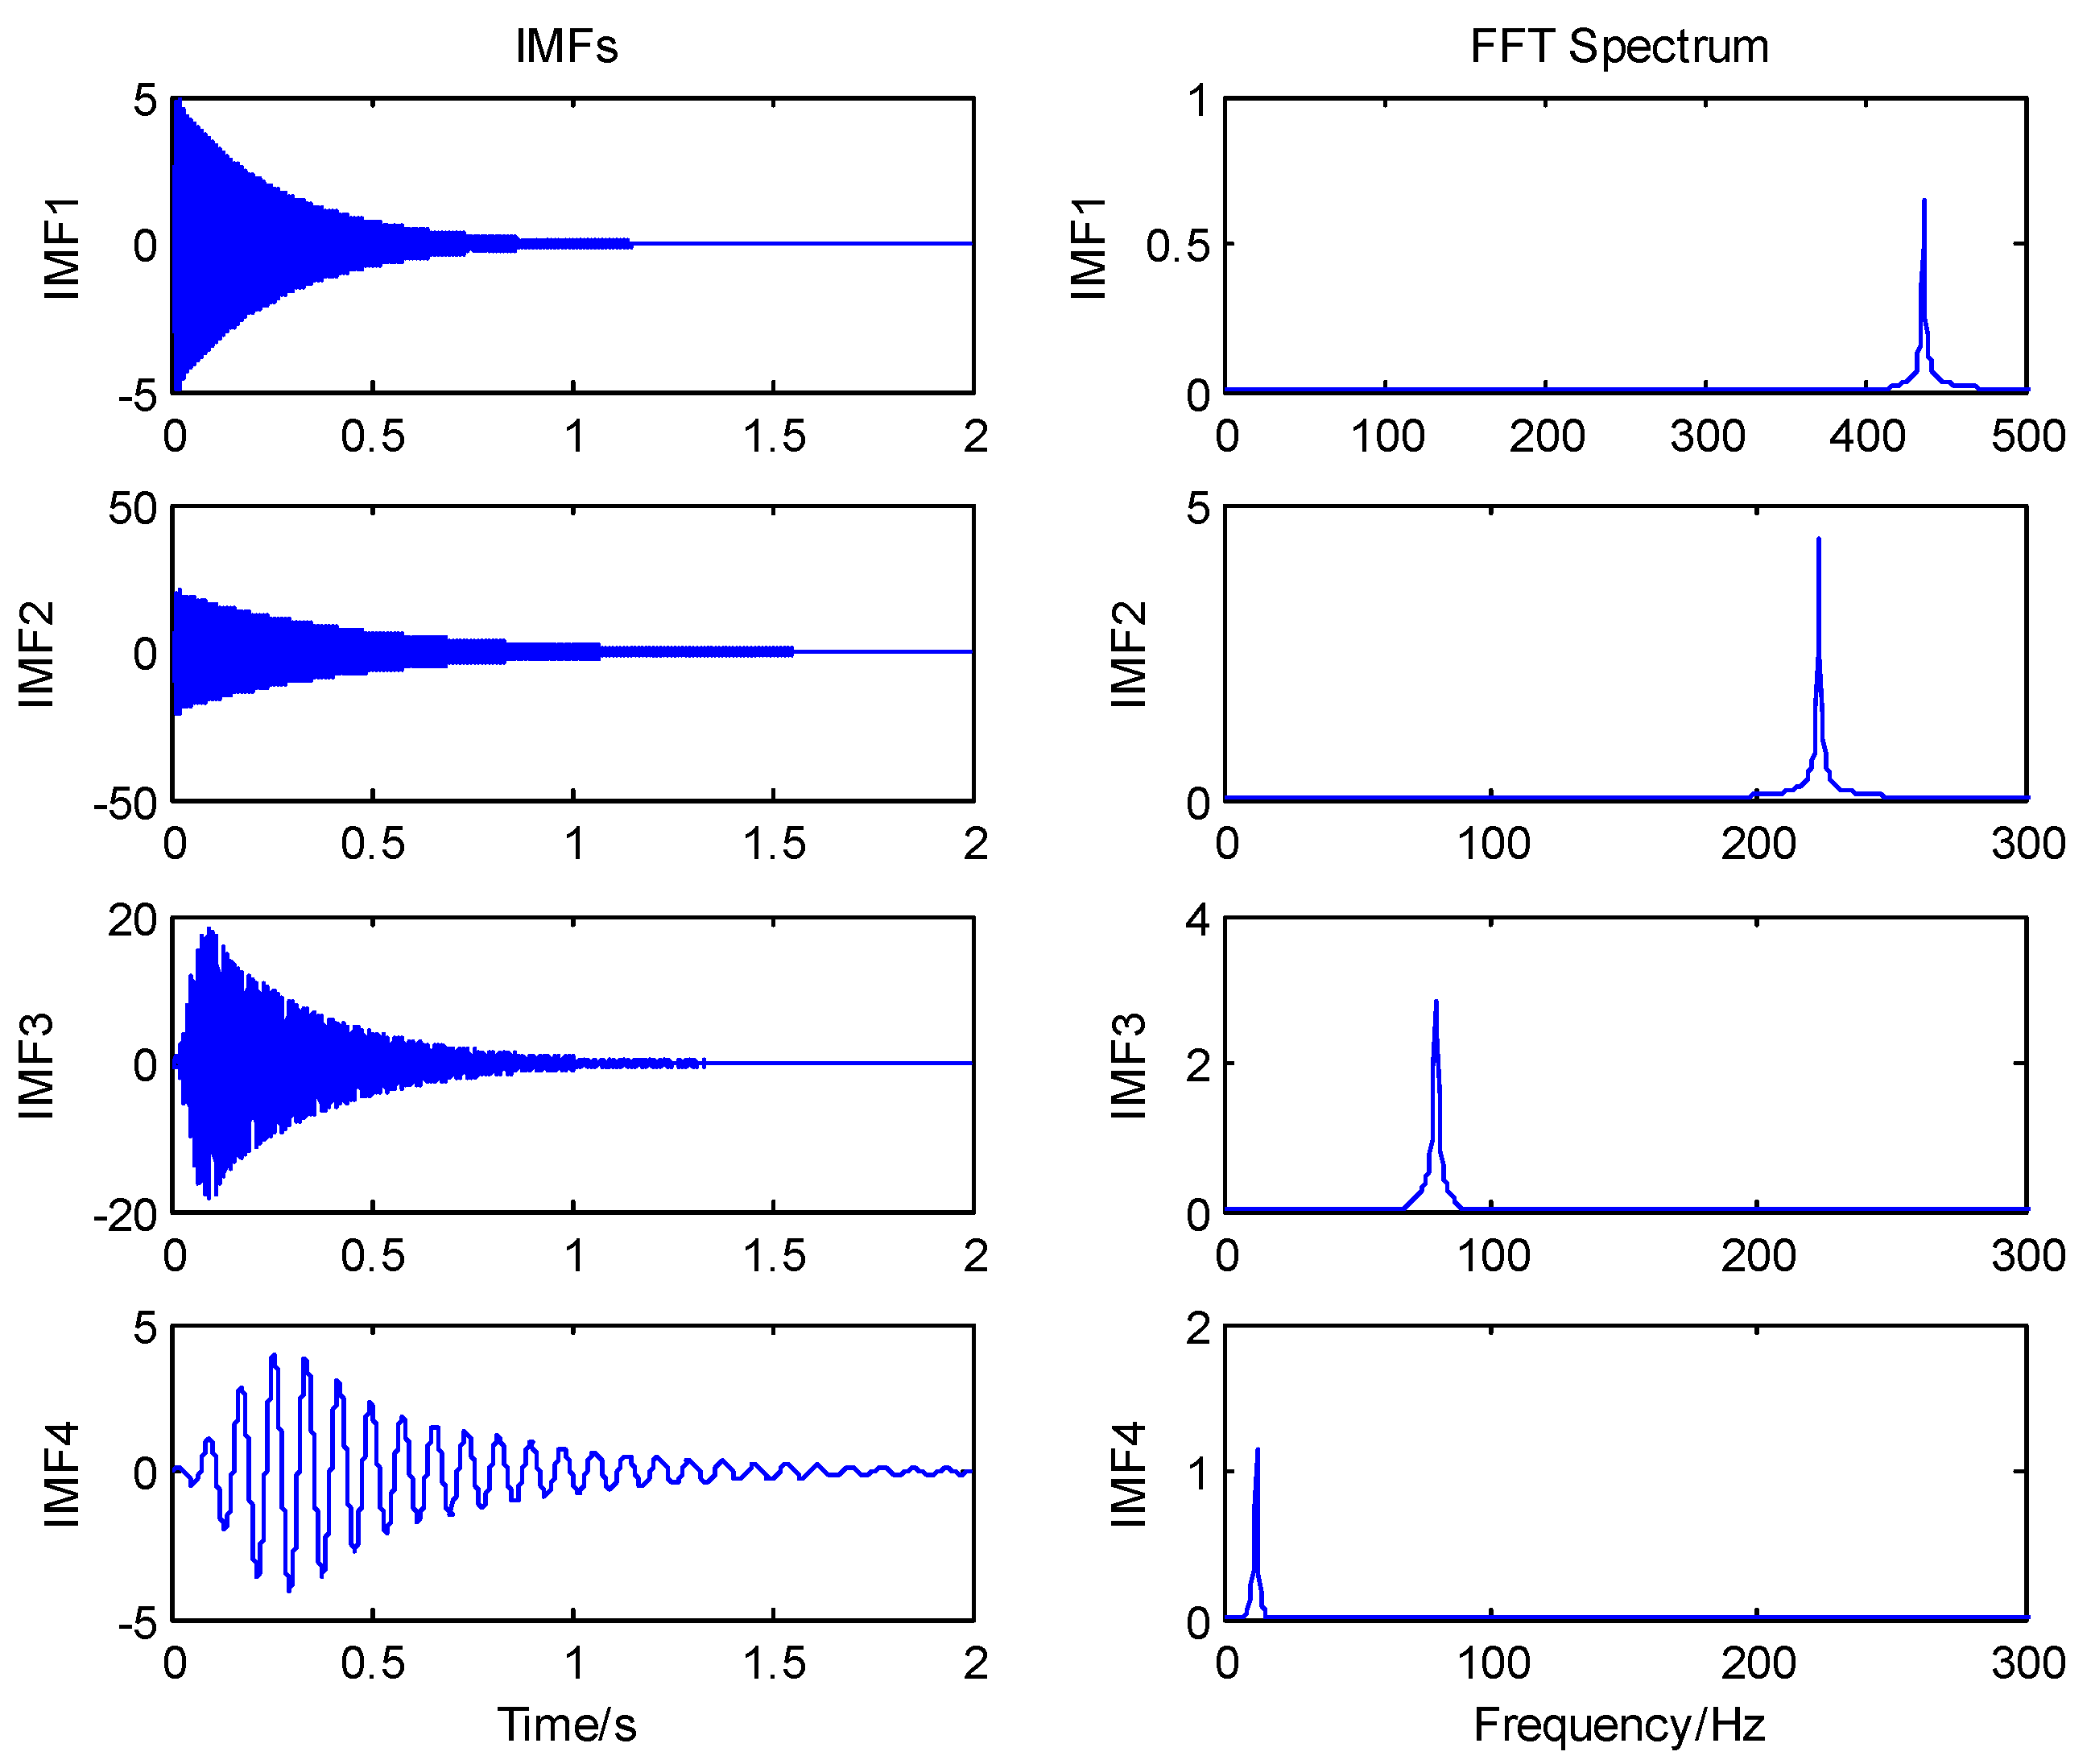
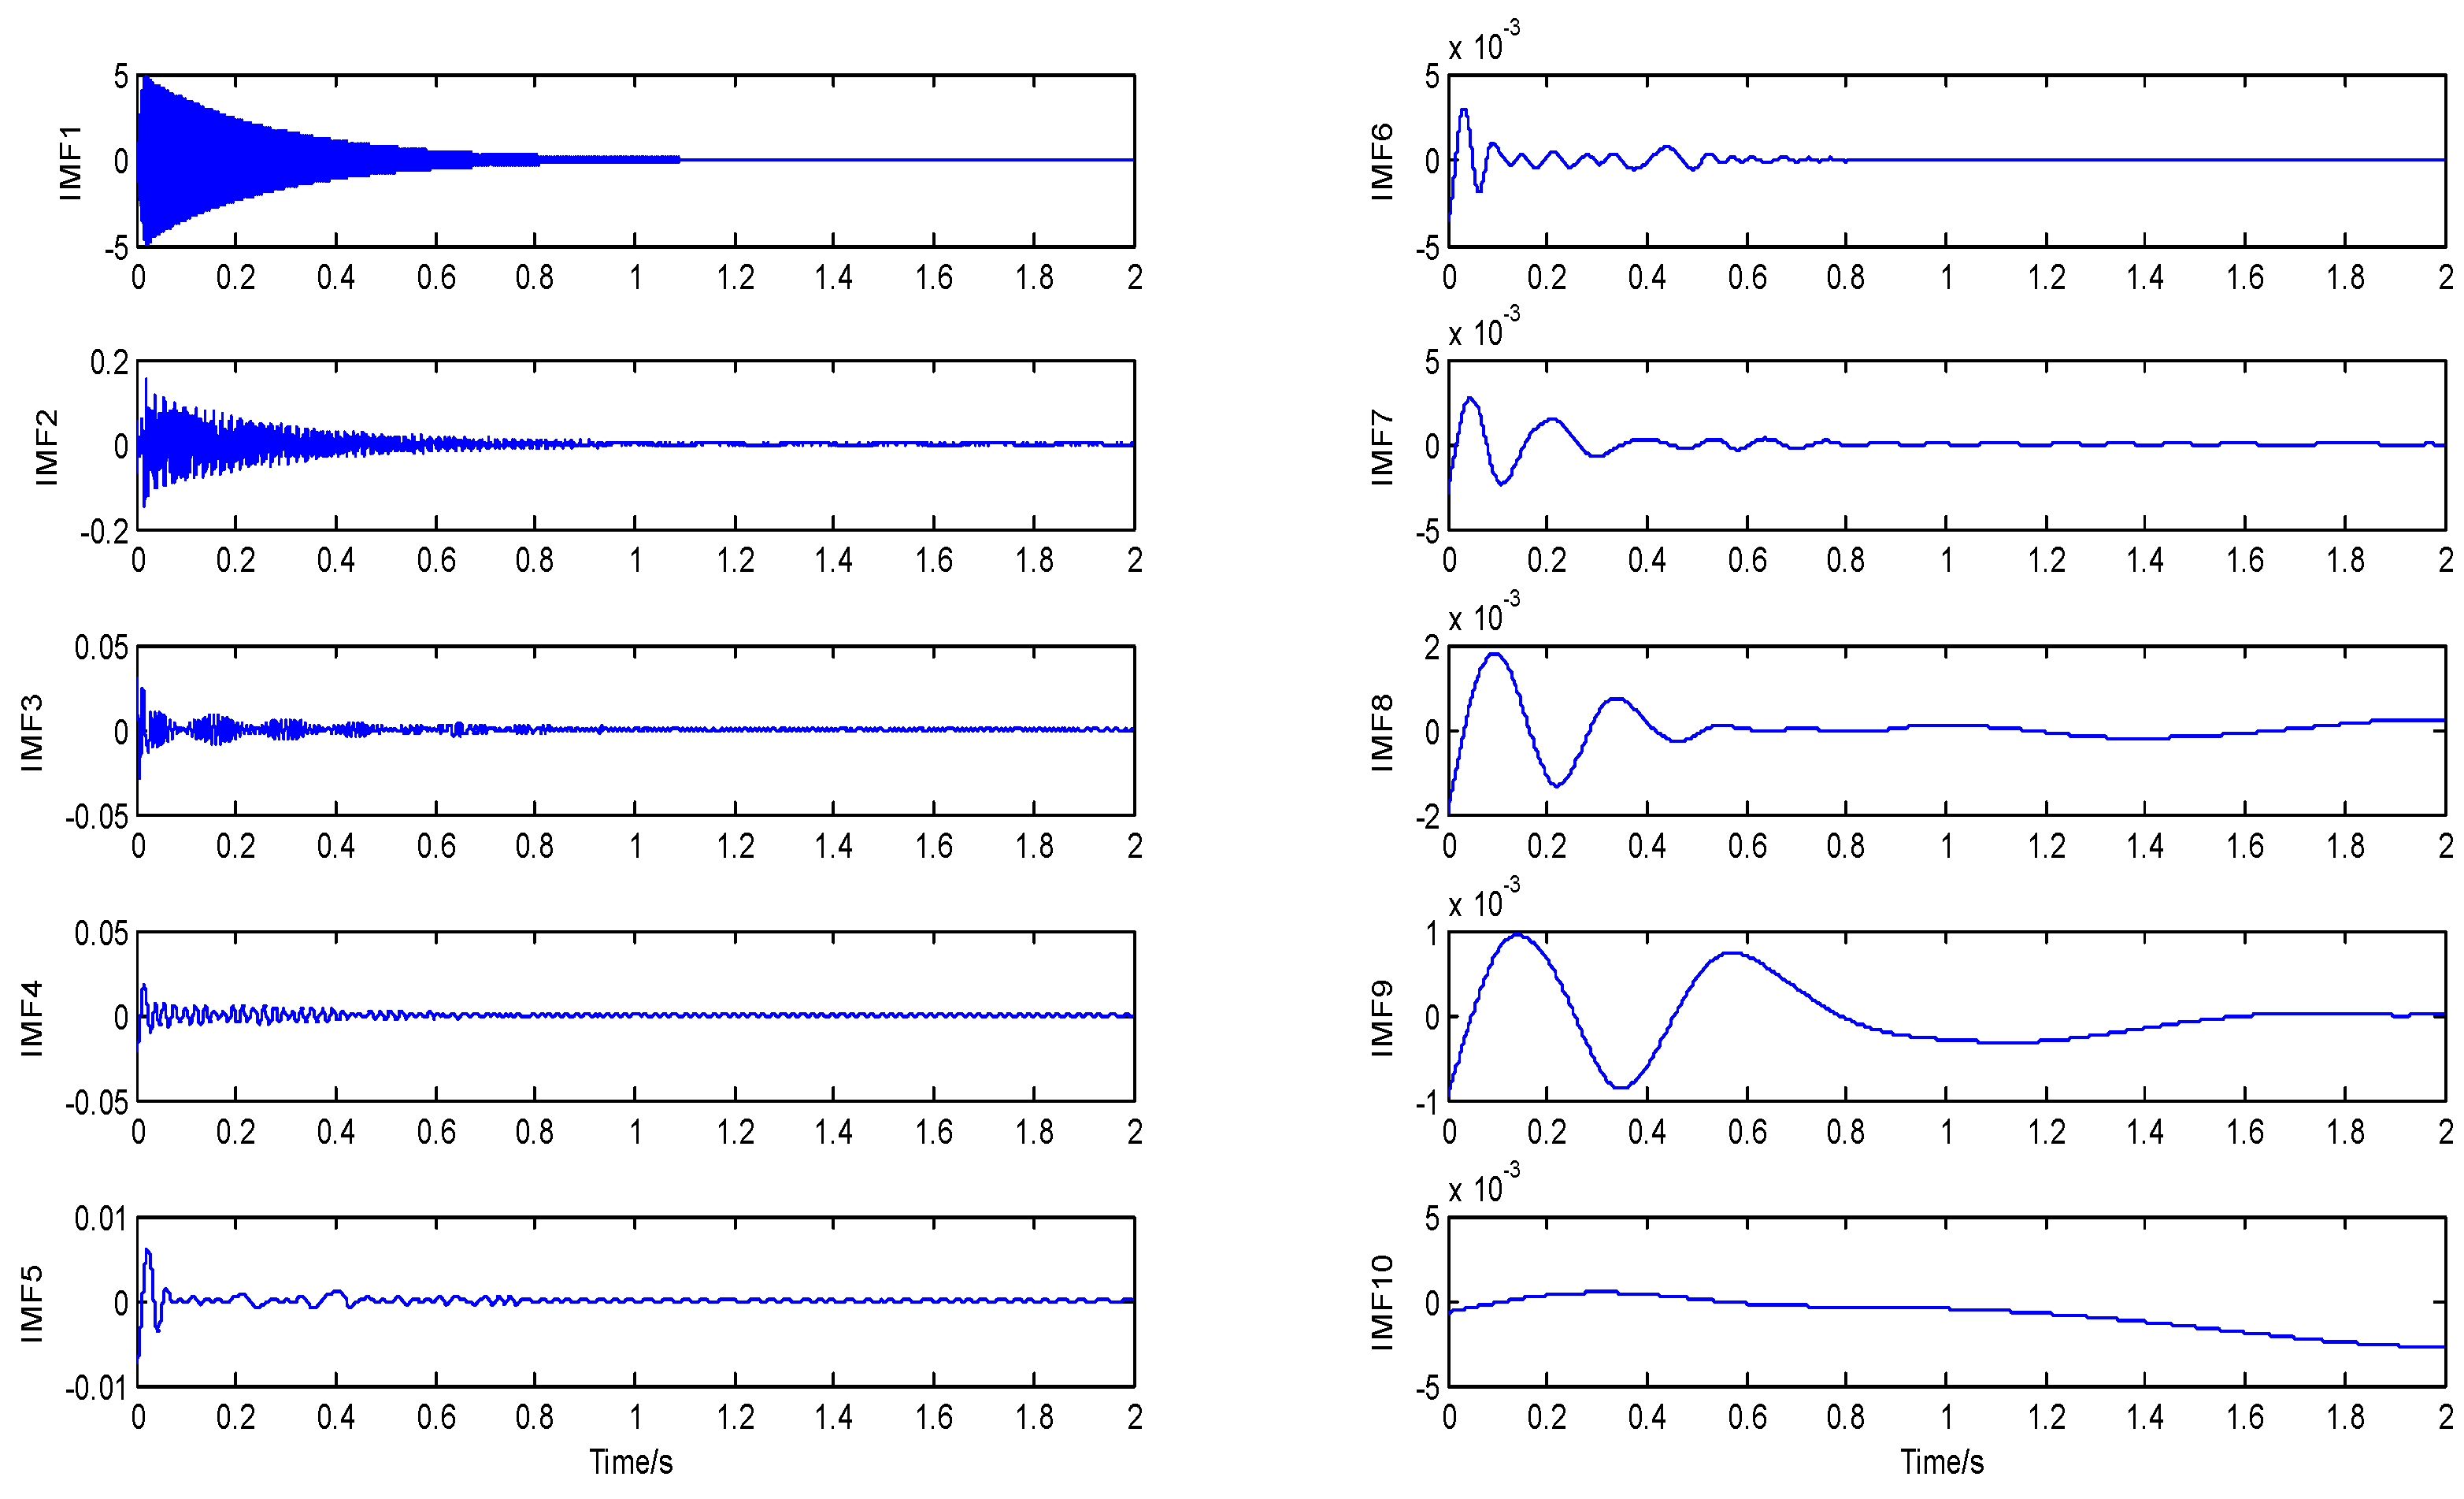
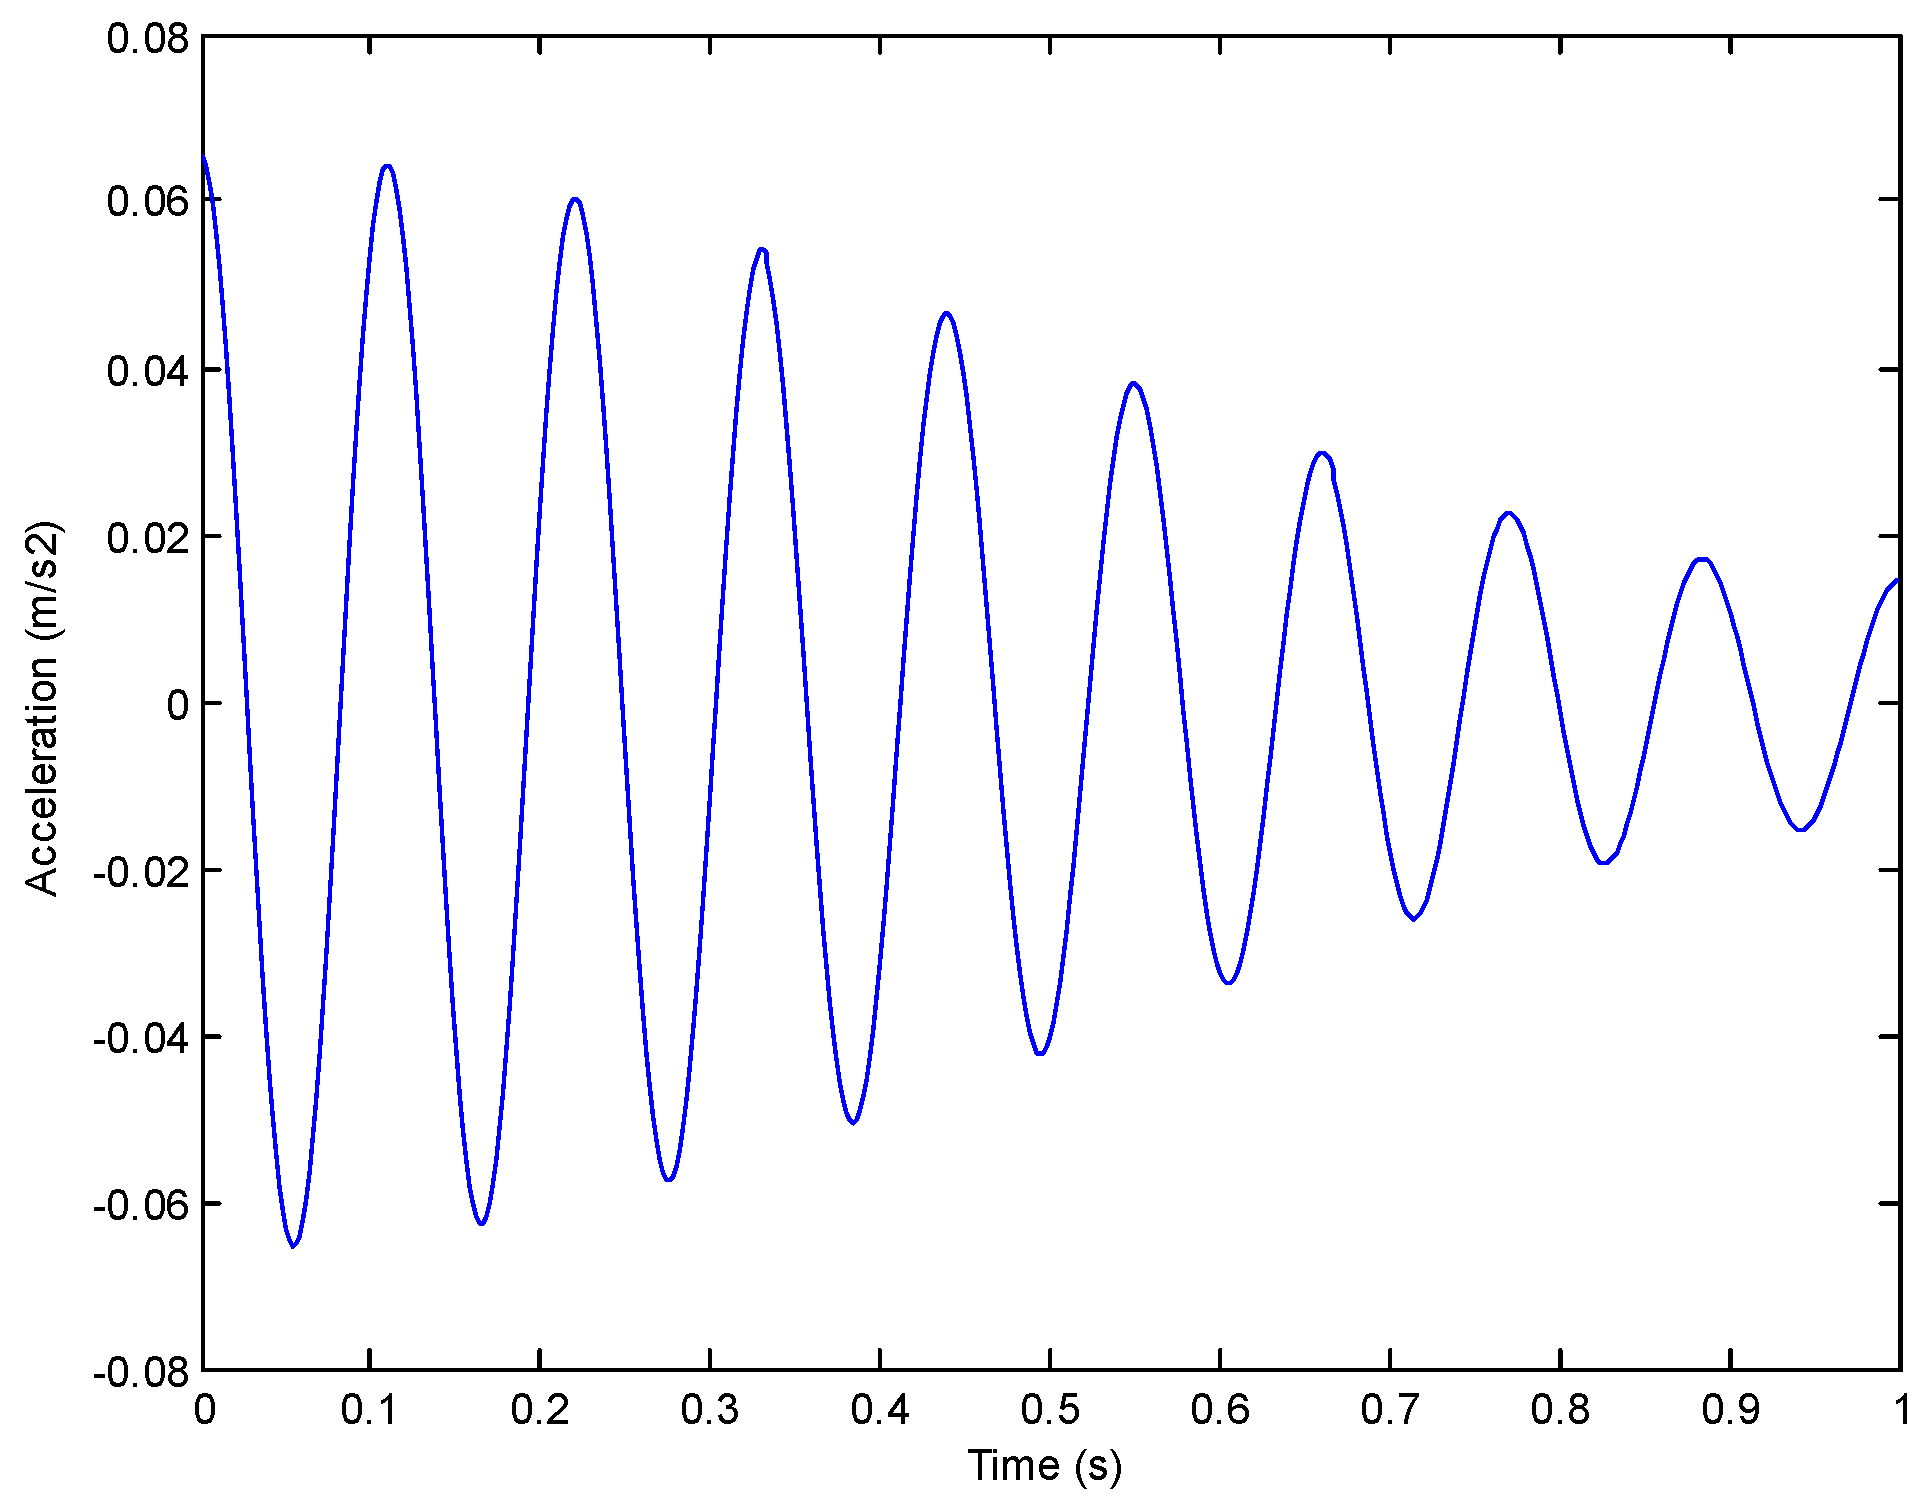
4. Numerical Validation

To study the effectiveness of the proposed method, a simulated signal, denoted by x(t), was applied. The signal is a mathematical model, used to describe the displacement response of a damped system under free vibration [27]. It can be written as follows:
x ( t ) = 5 e 2.2 t sin ( 78.5 t + 0.46 ) + 20 e 3.4 t sin 500.5 t + 20 e 2.24 t sin 1401.1 t + 5 e 3.84 t sin ( 2745.6 t + 0.1 )
where An is the amplitude, ξ n is the damping ratio, f n is the natural frequency, and θ n is the phase angle of the nth mode. N is the total number of modes. Here, the number of modes is 4. The parameters used for generating x(t) are as follows: f 1 = 12.5 Hz, f 2 = 79.7 Hz, f 3 = 223.1 Hz and f 4 = 437.2 Hz, Amplitudes are A 1 = A 4 = 5 , A 2 = A 3 = 20 . Phase angles are θ 1 = 0.46 ,   θ 4 = 0.1 , and θ 2 = θ 3 = 0 , and the correlated damping ratios are ξ 1 = 2.8 % , ξ 2 = 0.68 % , ξ 3 = 0.16 % , and ξ 4 = 0.14 % .
Here, the sampling frequency is 4096 Hz, and the sampling points total 8192. Classical EMD was performed on the simulated signals of the displacement response, and eight IMFs and one residual term were obtained. The first four order IMFs and their corresponding spectrum are shown in Figure 3. It can be seen from Figure 3 that the displacement simulation signal was not decomposed into four single IMF components, but into eight IMFs, and the decomposed low frequency components were not what we had expected and should not have appeared, this was evidence of false modes. In addition, it can also be seen from Figure 3 that the first generated IMFs covered a wide frequency range and obviously contained three frequency components. The second decomposed IMF component was a single frequency component; however, mode mixing appeared again in the third IMF component obtained by EMD; namely, two frequency values appeared in the single component of the third IMF.
The displacement simulation signal of Equation (11) was also analyzed using the EEMD method. The first six orders of IMFs decomposed using the EEMD method are shown in Figure 4. In the process of EEMD, the added white noise level was set to 0.1, and the overall average mean number was 50. As can be seen from Figure 4, EEMD could almost decompose signals into single components, except the first IMF, and there was very obviously two frequency components (around 100 Hz); that is, modal mixing occurred. It can also be seen from Figure 4 that energy leakage existed in the decomposition process of the EEMD method, and it was obvious that the two different IMFs generated in the low-frequency domain contained the same frequency component (labeled by the red dotted rectangle). Meanwhile, one positive aspect was that EEMD successfully identified low order frequency components, which is of great significance for modal analysis and structural damage detection of large structures.
IEMD was also used to analyze the simulated signals of Equation (11), and the obtained four order IMFs are shown in Figure 5. First, the FFT spectrum was used to estimate the frequency range quickly and roughly, four frequency ranges were defined from the four peak frequencies in the Fourier spectrum; here, four band-pass filters with the center of the peak frequency were formed, and each frequency range can be expressed as jL < j < jR. The frequency range is theoretically the difference between two adjacent frequencies of the Fourier spectrum, but the smaller the frequency range is, the better the band-pass filtering effect will be. Therefore, in this paper, the frequency range is no more than 5%. Then, the simulated signal was processed by filtering through the band-pass filters with four specified frequency bands and IMFs, after the processing of each filter were obtained accordingly. For instance, there were 10 IMFs, and a residual could be obtained from the first frequency-band after the processing of EMD, as shown in Figure 6. Finally, the required IMF was automatically identified using clustering analysis shown in Figure 7. Here, Euclidean distance was used to cluster the decomposition results, with no need to adjust any indexes or thresholds, and only the nearest distance default in MATLAB was used to efficiently determine the real IMF.
From Figure 7, it can be seen that the first IMF was required, this process was repeated at each frequency-band, and the required IMF group was formed. Finally, the real IMFs were obtained using a clustering analysis (Euclidean Distance) of the IMFs group again, as shown in Figure 8. It can be seen from Figure 8 that the four IMFs obtained from IEMD were independent of each other, and there was no mode mixing. By comparing Figure 3, Figure 4 and Figure 5, it can be seen that the proposed IEMD can improve the phenomenon of mode mixing and could accurately identify each IMF, as well as make preparations for the subsequent identification of structural modal parameters.

5. Test Verification
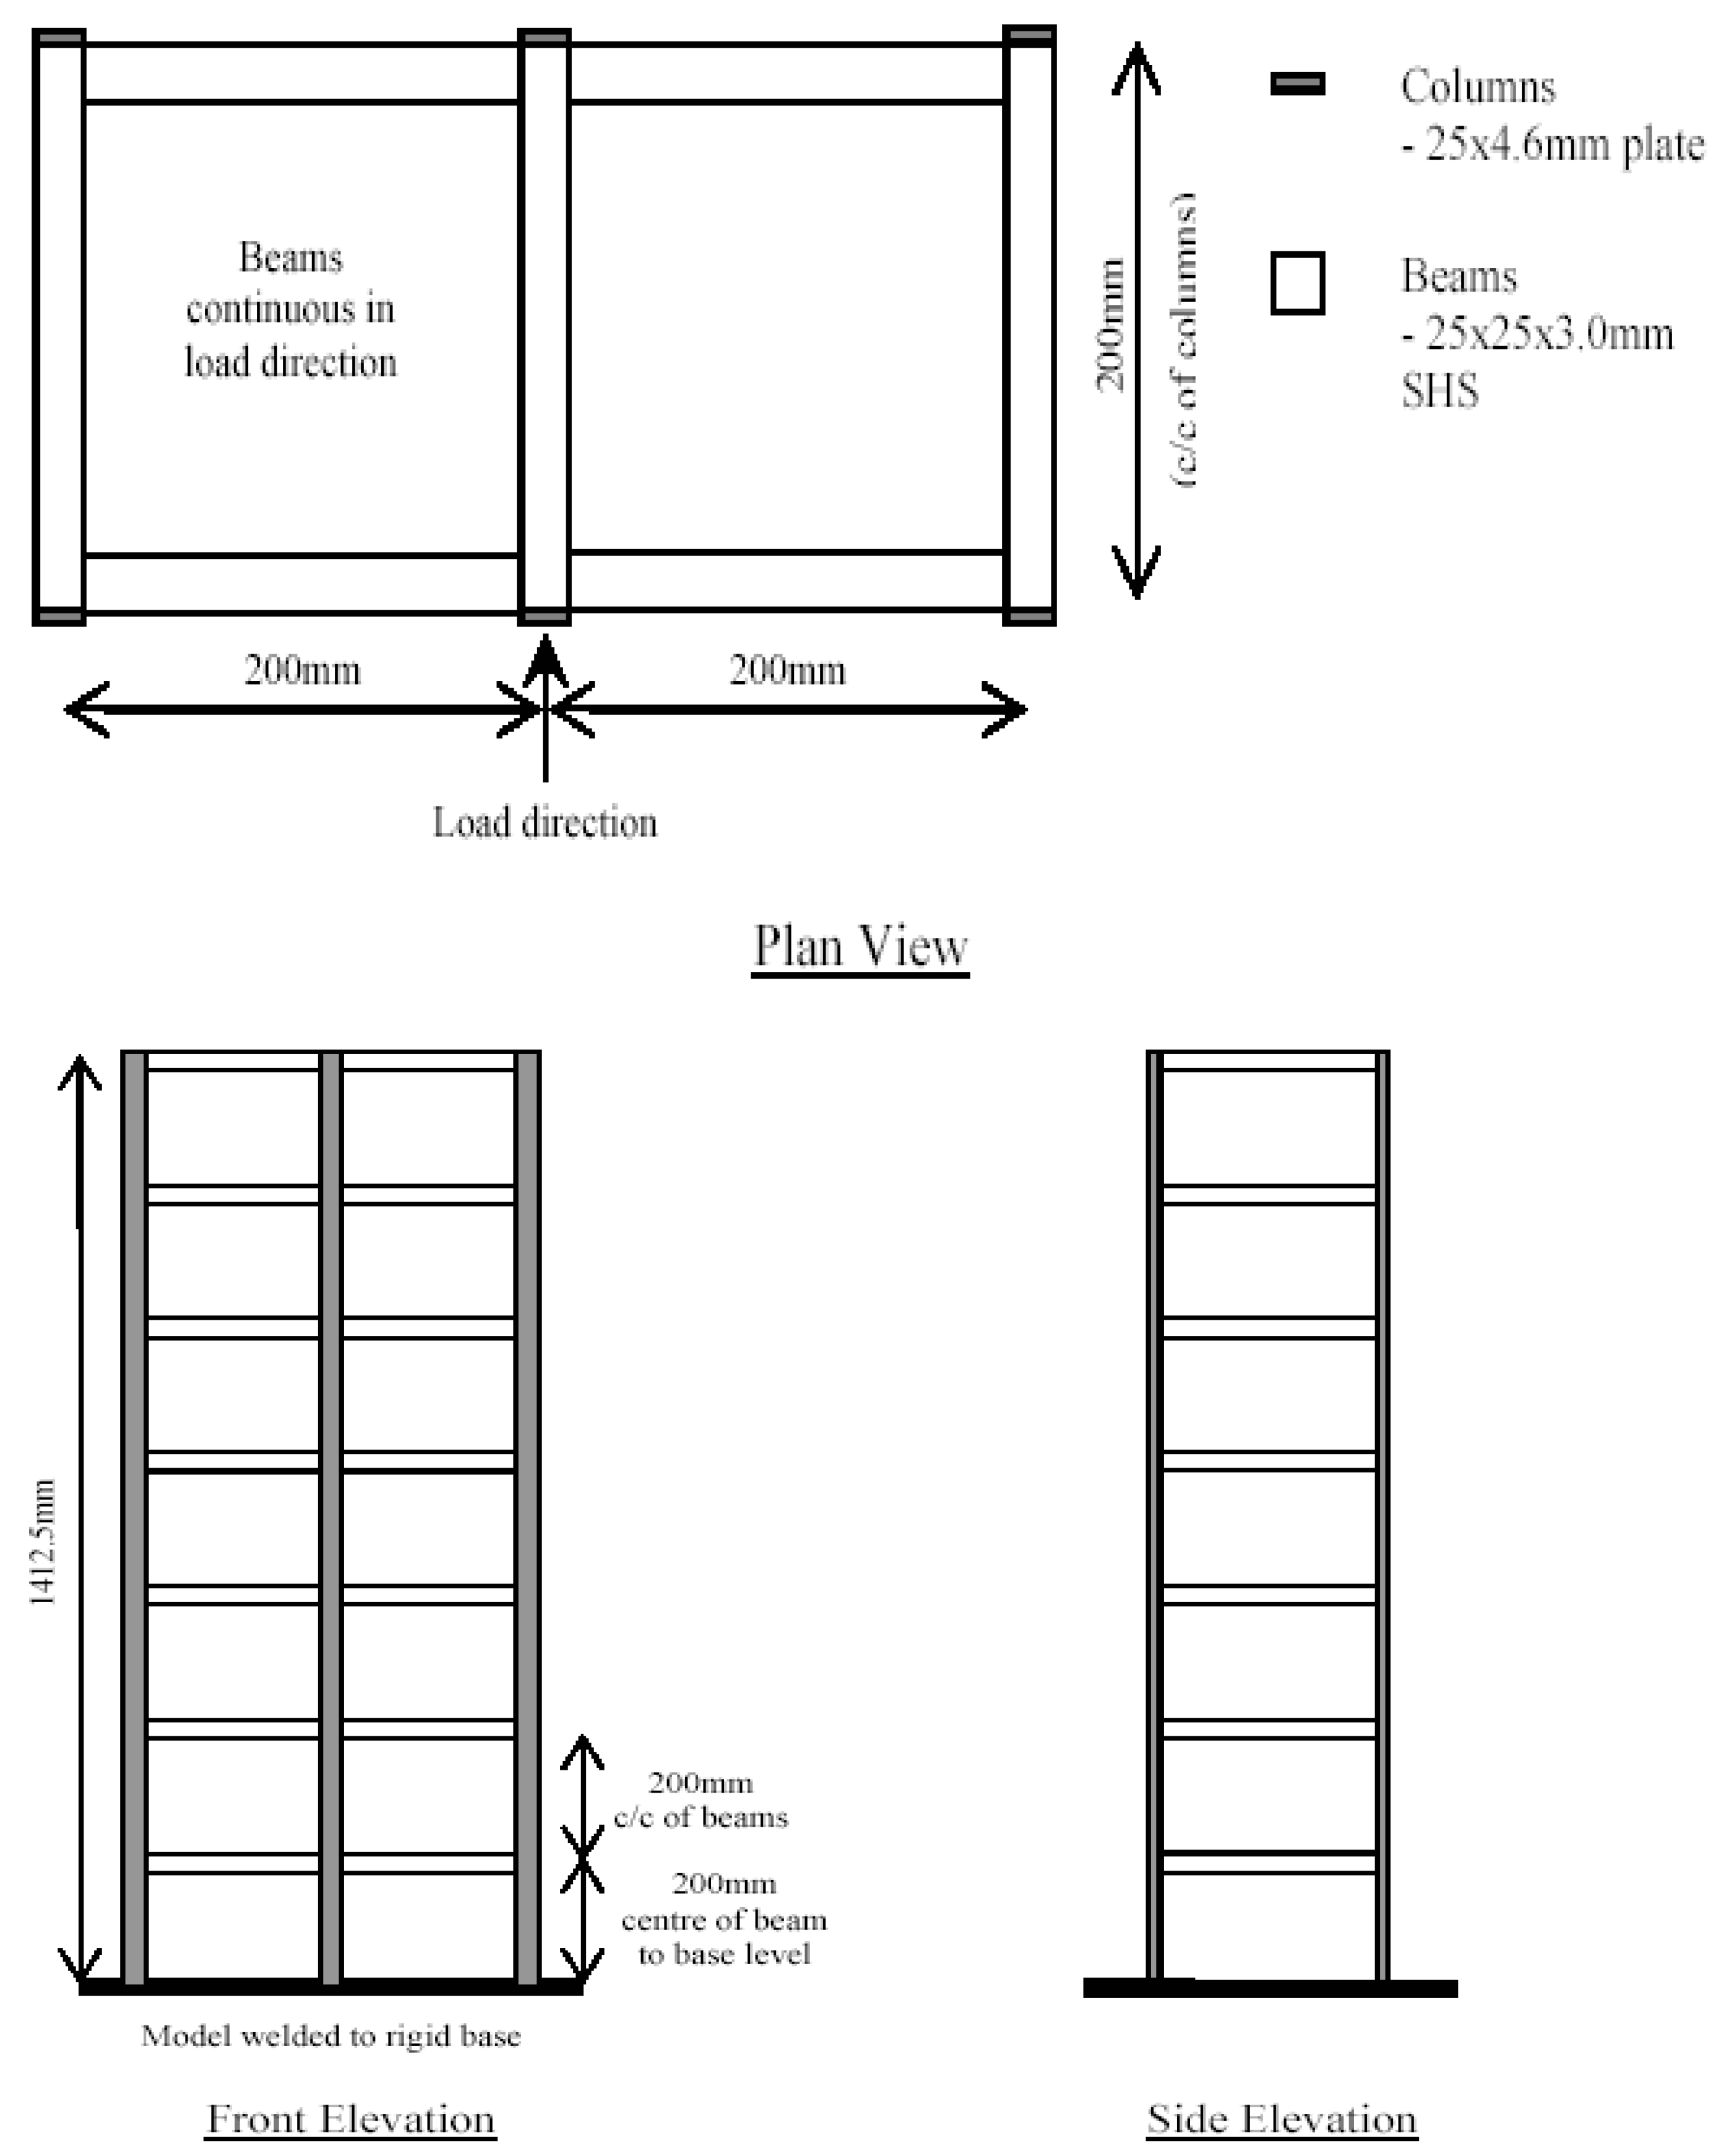
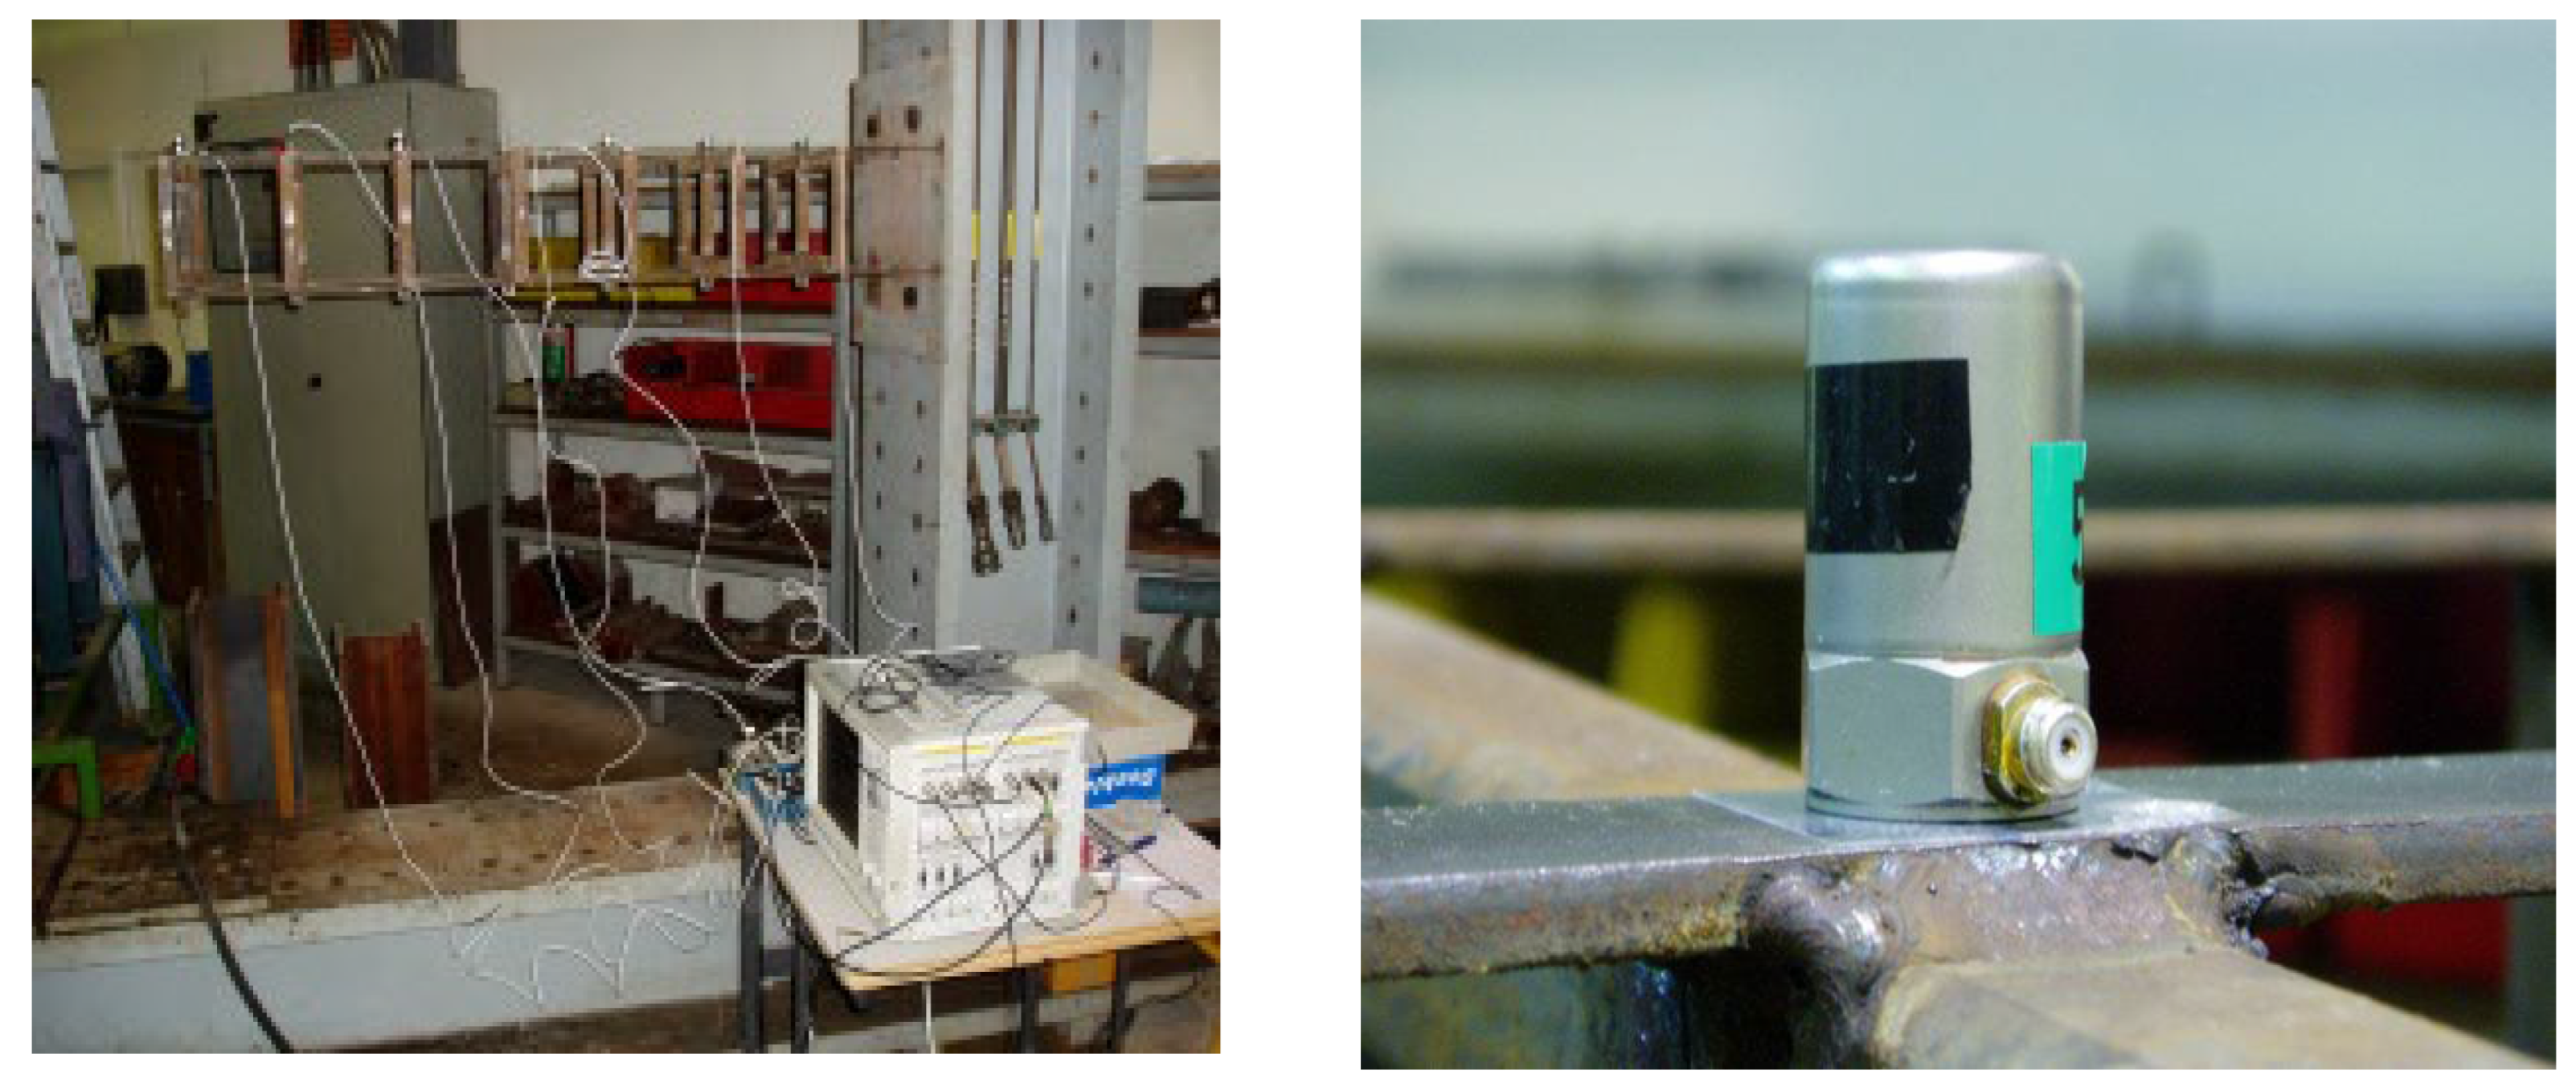
5.1. Experiment

As shown in Figure 9, a seven-story steel-frame structure laboratory scale model [28] was constructed, and the plane size of this model was 0.4 m × 0.2 m, and it was 1.4125 m in height. Using hot-rolled 300 w grade steel (fy = 300 Mpa), the section size of the beam, column, and the characteristics of the cross-section were as shown in Table 1. The beam was continuous in the loading direction. Random excitation (hammering method) was applied in the direction perpendicular to the beam at the rigid joints in the middle span of the top floor of the steel frame structure. An acceleration sensor was arranged at the middle beam end of each layer, parallel to the excitation direction, so that a total of seven sensors were arranged to collect acceleration signals (Figure 10), and the sampling frequency was 2000 Hz.

5.2. Identification Results and Discussion

The measured acceleration response signal of the seven-story frame structure in a healthy state is shown in Figure 11, the proposed hybrid method of IEMD and ARMA was used for modal parameter identification, and the detailed identification process was shown as follows:
First, the acceleration signal was measured by means of IEMD for preprocessing; namely, choosing two groups of the acceleration response in a structural healthy condition. Then, a FFT process was performed, followed by picking up the peak frequency of the Fourier spectrum as the central frequency of the band-pass filter. Two sets of acceleration response signals separately passed through the band-pass filter with a specified frequency band, and frequency range can be expressed as jL < j < jR, in this paper, while the frequency range was no more than 5%. Finally, a two-time cluster analysis was used to determine the real IMFs. Second, the cross-correlation function was obtained using the NExT method. Obviously, two sets of acceleration response signals can obtain two groups of IMFs (The first seven order IMFs are shown in Figure 11). With one set of IMFs as the reference signal, the corresponding cross-spectral density function of each IMF was solved, and the inverse Fourier transform was carried out to obtain the cross-correlation function, as the free vibration response of the structure (as shown in Figure 12).
Finally, by using an ARMA(2, 2) model to simulate the free vibration response (cross-correlation function), the sixth IMF was taken as an example, as shown in Figure 13, for identifying the modal frequency of the structures (as shown in Table 2). As mentioned above, ARMA-based modal identification is one of the most popular methods, since it offers a high accuracy of modal parameters, with the main obstacle in ARMA-based modal identification being the determination of proper system order. This defect has attracted a large number of scholars to complete a lot of related research [13,14,15], but the problem of model order determination is still very difficult. However, in this paper, since the components of the IMFs are all single-order modes after disposing of the IEMD, the order of the model is two, which is twice the order of the mode. In order to identify the mode shape, the vibration response signals of all freedom degrees should be measured. For different measuring points, the coefficients of the vibration mode are obtained using the residue and normalized to obtain the mode shape.
In order to further illustrate the effect of the IEMD method, the IMFs obtained by classical EMD decomposition are shown in Figure 14. From Figure 11 and Figure 14, it can be seen that mode mixing occurred for the six and seventh IMFs obtained by EMD locally, i.e., some data with the same, or nearly the same, frequency are decomposed into more than one IMF (labeled by the red dotted rectangle), while in Figure 11 the modes are well separated from original signal. A Hilbert spectrum analysis and cluster analysis of IMFs obtained using IEMD are shown in Figure 15 and Figure 16, respectively. It can be seen from these two figures that the IEMD resolved the problems of modal mixing, and the identified IMFs were all single independent components. Therefore, the IEMD/ARMA methods could obtain more accurate recognition results (as shown in Table 2). It can also be concluded that EEMD cannot completely improve the mode mixing problem of classical EMD based on the frequency identification results. However, EEMD can obtain more accurate frequency identification results than classic EMD in the low frequency domain. It is worth noting that during the process of EEMD, both the amplitude standard deviation σ of white noise and the number N of adding white noise need to be selected artificially. The selection of this value will affect the decomposition result, and the decomposition of EEMD is very time-consuming. Here, in order to facilitate calculation, σ = 0.1 and N = 50. It should be pointed out that, when NExT/ARMA was directly used for modal parameter identification, the reason why the ideal frequency recognition results could be obtained, excepting that the low-order frequency was not successfully identified, was because this paper used a trial calculation method to determine the order of the ARMA model. However, with the help of IEMD, the order of the ARMA model can be easily determined.
Regarding identifying the mode shapes, it is necessary to obtain the acceleration responses of all degrees of freedom; and repeating the above identification process, the complex mode vectors corresponding to each mode of the measuring points were obtained. The real part of the complex modal vector was the modal shape coefficient. The modal vector can be obtained by normalizing the modal coefficients. The recognition results of the first six order mode shapes are shown in Figure 17. From Figure 17, it is not difficult to see that the identified mode shapes were in good agreement with the theoretical shapes, and the overall shapes were basically consistent with the theoretical shapes.

6. Conclusions

In view of the practical difficulties of the classic EMD and ARMA methods in practical applications, such as mode mixing, and determination of real IMF and the model order, as well as ARMA requiring the time series to be a series of stationary random processes with a zero mean value, this paper proposed a hybrid method to improve the structural modal parameter identification, by means of combining IEMD and ARMA. IEMD was used to preprocess the signal, and a cluster analysis was used to determine the real IMFs. The free vibration response was obtained using the NExT method and used as the input signal for the ARMA method. The modal test of a seven-story steel frame showed that IMFs, which were used as an input signal for ARMA and were obtained by preprocessed of IEMD, which could resolve the mode mixing problem and make the determination of ARMA order easier. Thus, the structure frequency and modal shape were identified successfully, which proved the effectiveness of the proposed method and further expands the application range of ARMA. However, the application of this proposed method will be limited in the case of some dense modal vibration signals, when FFT cannot correctly divide the frequency band. In addition, recognition of time-varying signals was not considered in this paper, and continuous research work will be devoted to this aspect in the future.

Author Contributions

All authors took part in the discussion of the work described in this paper. C.F. wrote the paper, S.-F.J. revised and finalized the paper. All authors have read and agreed to the published version of the manuscript.

Funding

The work was supported by National Thirteenth Five-Year Key Research Projects of China (Grant No. 2020.YFD1100403), Scientific Research Fund of Institute of Engineering Mechanics, China Earthquake Administration (Grant No. 2020EEEVL0402) and Fujian Science and Technology Planning Project (Grant No. 2017Y0412).

Institutional Review Board Statement

Not applicable.

Informed Consent Statement

Not applicable.

Data Availability Statement

The data presented in this study are available on request from the corresponding author.

Conflicts of Interest

The authors declare no conflict of interest.

References

  1. Zhou, Y.; Jiang, X.; Zhang, M.; Zhang, J.; Sun, H.; Li, X. Modal parameters identification of bridge by improved stochastic subspace identification method with Grubbs criterion. Meas. Control 2021, 54, 457–464. [Google Scholar] [CrossRef]
  2. Mao, J.; Yang, C.; Wang, H.; Zhang, Y.; Lu, H. Bayesian Operational Modal Analysis with Genetic Optimization for Structural Health Monitoring of the Long-Span Bridge. Int. J. Struct. Stab. Dyn. 2022, 22, 225001. [Google Scholar] [CrossRef]
  3. Ahmed, B.; Dinu, F.; Marginean, I. Structural health monitoring of steel frame structure by experimental modal parameter identification. Adv. Eng. Forum. 2020, 37, 1–13. [Google Scholar] [CrossRef]
  4. Peeters, B.; De Roeck, G.; Pollet, T.; Schueremans, L. Stochastic subspace techniques applied to parameter identification of civil engineering structures. In New Advances in Modal Synthesis of Large Structures: Nonlinear, Damped and Nondeterministic Cases; Katholieke Universiteit Leuven: Leuven, Belgium, 1995. [Google Scholar]
  5. Clemente, P.; Bongiovanni, G.; Buffarini, G.; Saitta, F. Structural health status assessment of a cable-stayed bridge by means of experimental vibration analysis. J. Civ. Struct. Health Monit. 2019, 9, 655–669. [Google Scholar] [CrossRef]
  6. Nicoletti, V.; Arezzo, D.; Carbonari, S.; Gara, F. Dynamic monitoring of buildings as a diagnostic tool during construction phases. J. Build. Eng. 2022, 46, 103764. [Google Scholar] [CrossRef]
  7. Pereira, S.; Magalhães, F.; Gomes, J.P.; Cunha, Á.; Lemos, J.V. Vibration-based damage detection of a concrete arch dam. Eng. Struct. 2021, 235, 112032. [Google Scholar] [CrossRef]
  8. Peeters, B.; Roeck, G.D. Reference-based stochastic subspace identification in civil engineering. In Proceedings of the Second International Conference on Identification in Engineering System, Swansea, UK, 29–31 March 1999; pp. 639–648. [Google Scholar]
  9. James, G.H.; Carne, T.G.; Lauffer, J.P. The Natural Excitation Technique for Modal Parameter Extraction from Operating Wind Turbines; No. SAND92-1666, UC-261; Sandia National Laboratories: Albuquerque, NM, USA, 1993. [Google Scholar]
  10. Yao, X.J.; Yi, T.H.; Qu, C.X. Autoregressive spectrum-guided variational mode decomposition for time-varying modal identification under nonstationary conditions. Eng. Struct. 2022, 251, 113543. [Google Scholar] [CrossRef]
  11. Yuan, Q.; He, J. Modal parameter identification of large cable-stayed bridge based on IEEMD and ARMA algorithm. J. Chongqing Jiaotong Univ. (Nat. Sci.) 2016, 35, 121. [Google Scholar]
  12. Akaike, H. Power spectrum estimation through autoregressive model fitting. Ann. Inst. Stat. Math. 1969, 21, 407–419. [Google Scholar] [CrossRef]
  13. Xu, S.D.; Wang, F.Q. Mode parameter identification of engineering structure based on ARMA model. Ind. Archit. 2007, 37, 20–22. [Google Scholar]
  14. Neto, A.C.; Faria, T. Boostrap for order identification ARMA(p,q) structures. Indep. J. Manag. Prod. 2015, 6, 169–181. [Google Scholar]
  15. Abo-Hammour, Z.S.; Alsmadi, M.K.; Al-Smadi, A.M. A Novel Technique for ARMA Modelling with Order and Parameter Estimation Using Genetic Algorithms. In Proceedings of the NDT 2010—Second International Conference, Prague, Czech Republic, 7–9 July 2010. [Google Scholar]
  16. Huang, N.E.; Shen, Z.; Long, S.R.; Wu, M.C.; Shih, H.H.; Zheng, Q.; Yen, N.-C.; Tung, C.C.; Liu, H.H. The empirical mode decomposition and the Hilbert spectrum for nonlinear and non-stationary time series analysis. Proc. R. Soc. Lond. Ser. A Math. Phys. Eng. Sci. 1998, 454, 903–995. [Google Scholar] [CrossRef]
  17. Yang, J.N.; Lei, Y.; Lin, S.; Huang, N. Hilbert-Huang Based Approach for Structural Damage Detection. J. Eng. Mech. 2004, 130, 85–95. [Google Scholar] [CrossRef]
  18. Zheng, J.; Pan, H. Mean-optimized mode decomposition: An improved EMD approach for non-stationary signal processing. ISA Trans. 2020, 106, 392–401. [Google Scholar] [CrossRef]
  19. Abedinia, O.; Lotfi, M.; Bagheri, M.; Sobhani, B.; Shafie-Khah, M.; Catalao, J.P.S. Improved EMD-Based Complex Prediction Model for Wind Power Forecasting. IEEE Trans. Sustain. Energy 2020, 11, 2790–2802. [Google Scholar] [CrossRef]
  20. Cai, J.H.; Hu, W.W.; Wang, X.C. Fault diagnosis of rolling bearing based on EMD-ICA de-noising. J. Mach. Des. 2015, 32, 17–23. [Google Scholar]
  21. Yuan, Y.; Li, B.; Yao, S. Improved Empirical Mode Decomposition Denoised by Singular Value Decomposition. J. Vib. Meas. Diag. 2010, 30, 325–338. [Google Scholar]
  22. Wu, Z.H.; Huang, N.E. Ensemble Empirical mode decomposition-a noise assisted data analysis method. Adv. Adap. Data Anal. 2009, 1, 1–41. [Google Scholar] [CrossRef]
  23. Charbonnel, P. Fuzzy-driven strategy for fully automated modal analysis: Application to the SMART2013 shaking-table test campaign. Mech. Syst. Signal Process. 2020, 152, 107388. [Google Scholar] [CrossRef]
  24. Tronci, E.; de Angelis, M.; Betti, R.; Altomare, V. Multi-stage semi-automated methodology for modal parameters estimation adopting parametric system identification algorithms. Mech. Syst. Signal Pract. 2022, 165, 108317. [Google Scholar] [CrossRef]
  25. Yao, X.-J.; Yi, T.-H.; Zhao, S.-W.; Qu, C.-X.; Liu, H. Fully Automated Operational Modal Identification Using Continuously Monitoring Data of Bridge Structures. J. Perform. Constr. Facil. 2021, 35, 04021041. [Google Scholar] [CrossRef]
  26. Zhou, S.; Zhou, X.; Liu, L.; Yang, W. Fuzzy-clustering-based All Factor Automatous Validation Approach of Modal Parameters of Structures. J. Beijing Univ. Aeronaut. Astronaut. 2015, 41, 811–816. [Google Scholar]
  27. Liu, J.L.; Yu, A.H.; Wu, C.; Sheng, Y.; Luo, Y.P. A New Method for Modal Parameter Identification of Civil Engineering Structures under Unknown Excitation. Noise Vib. Control 2019, 39, 6–12. [Google Scholar]
  28. Fu, C.; Jiang, S. A Hybrid Data-Fusion System by Integrating CFD and PNN for Structural Damage Identification. Appl. Sci. 2021, 11, 8272. [Google Scholar] [CrossRef]
Figure 1. The proposed IEMD method.
Applsci 12 08573 g001
Figure 2. Diagram of using IEMD and ARMA to identify structural parameters.
Applsci 12 08573 g002
Figure 3. Partial IMFs obtained using EMD and the corresponding FFT frequency−spectrum.
Applsci 12 08573 g003
Figure 4. Partial IMFs obtained using EEMD and the corresponding FFT frequency−spectrum.
Applsci 12 08573 g004
Figure 5. IMFs obtained by IEMD and the corresponding FFT frequency−spectrum.
Applsci 12 08573 g005
Figure 6. IMFs obtained by the first band−filtering.
Applsci 12 08573 g006
Figure 7. Cluster analysis results of IMFs in Figure 6.
Applsci 12 08573 g007
Figure 8. Cluster analysis results of IMFs of IEMD.
Applsci 12 08573 g008
Figure 9. Seven−story steel frame model.
Applsci 12 08573 g009
Figure 10. Testing of a seven−story steel frame structure.
Applsci 12 08573 g010
Figure 11. Acceleration signal and IMF1−7 using IEMD.
Applsci 12 08573 g011
Figure 12. Free vibration curves of IMF6 obtained using the NExT method.
Applsci 12 08573 g012
Figure 13. Corresponding to Figure 11, the fitting curve used in the ARMA model.
Applsci 12 08573 g013
Figure 14. Acceleration signal and IMF1−7 using EMD.
Applsci 12 08573 g014
Figure 15. Hilbert spectrum using IEMD + Hibert.
Applsci 12 08573 g015
Figure 16. Cluster analysis results of IMF.
Applsci 12 08573 g016
Figure 17. The first six vibration modes identified using the IEMD/ARMA method.
Applsci 12 08573 g017
Table 1. Structural member characteristics.
Geometrical FeaturesBeamColumn
Sectional dimension25 mm × 25 mm × 3 mm (SHS)25 mm × 4.6 mm
Sectional area A/m2286 × 10−6115 × 10−6
Inertia moment I/m42.41 × 10−87.78 × 10⁻¹⁰
Young modulus E/Pa206 × 109206 × 109
Volume density ρ [kg/m3]78507850
Table 2. Comparison of the modal frequency identification results (Hz).
ModeTheoretical Value [28]Proposed MethodHHTNExT/ARMA
111.711.8613.35--
235.235.58.9635.6
358.658.5835.5658.54
480.179.9458.3080.75
599.698.7199.4898.76
6113.3113.467.92113.27
7123.0122.84293.22122.94
Publisher’s Note: MDPI stays neutral with regard to jurisdictional claims in published maps and institutional affiliations.

