Article

Deep Learning Model for Classifying Periodontitis Stages on Dental Panoramic Radiography

1
Medical Research Institute, School of Medicine, Chungbuk National University, Cheongju 28644, Korea
2
Department of Big Data, Chungbuk National University, Cheongju 28644, Korea
3
Department of Biomedical Engineering, School of Medicine, Chungbuk National University, Cheongju 28644, Korea
4
Department of Oral & Maxillofacial Surgery, Hankook General Hospital, Cheongju 28713, Korea
5
Department of Oral & Maxillofacial Surgery, College of Medicine and Medical Research Institute, Chungbuk National University, Cheongju 28644, Korea
6
Institute for Trauma Research, College of Medicine, Korea University, Seoul 02841, Korea
*
Authors to whom correspondence should be addressed.
Appl. Sci. 2022, 12(17), 8500; https://doi.org/10.3390/app12178500
Submission received: 22 July 2022 / Revised: 22 August 2022 / Accepted: 24 August 2022 / Published: 25 August 2022
(This article belongs to the Topic Artificial Intelligence in Healthcare - 2nd Volume)

Abstract

:
In this study, an integrated deep learning framework was developed for classifying the periodontitis stages of each individual tooth using dental panoramic radiographs. Based on actual patient panoramic radiographs data, the bone loss by periodontitis and cementoenamel junction boundaries were detected, while the tooth number and tooth length were identified using data from AIHub, an open database platform. The two factors were integrated to classify and to evaluate the periodontitis staging on dental panoramic radiography. Periodontitis is classified into four stages based on the criteria of the radiographic bone level, as suggested at the relevant international conference in 2017. For the integrated deep learning framework developed in this study, the classification performance was evaluated by comparing the results of dental specialists, which indicated that the integrated framework had an accuracy of 0.929, with a recall and precision of 0.807 and 0.724, respectively, in average across all four stages. The novel framework was thus shown to exhibit a relatively high level of performance, and the findings in this study are expected to assist dental specialists with detecting the periodontitis stage and subsequent effective treatment. A systematic application will be developed in the future, to provide ancillary data for diagnosis and basic data for the treatment and prevention of periodontal disease.

1. Introduction

The 2019 statistics of the Healthcare Bigdata Hub of the Health Insurance Review and Assessment Service in Korea reported that among high-frequency outpatient diseases, gingivitis and periodontitis ranked first in both the number of patients and total cost of health insurance payment. Periodontitis is regarded as a commonly occurring chronic disease of the oral cavity without pain in the early stage; hence, the current awareness of the importance of treatment is inadequate. The inadequate awareness results in patients losing the critical treatment timing and consequently experiencing multiple loss of teeth in senescence, which may pose difficulties upon food intake and threaten health during senescence. Early treatment of periodontal disease allows for the maintenance of oral health at little cost and with a simple treatment, although the progression to the loss of the tooth demands expensive dentures or dental implantation. In addition, when an infectious disease occurs due to periodontitis, long-term drug therapy and surgical treatment are required. Gingival disease begins with gingivitis and deteriorates into periodontitis. Regular professional dental cleanings and proper oral care can help treat or even reverse gingivitis. Multiple scaling and root planing sessions are recommended in mild periodontitis. Even mild periodontitis causes significant bone loss. Progressive periodontitis involves loose, shifting teeth and painfully swollen gums, with or without abscess. Flap surgery is often the first surgical intervention to treat extreme bone loss, and a graft may be necessary to regenerate the underlying bone. The prevention and treatment of periodontal disease have thus received increased emphasis. In various epidemiological investigations, periodontal disease was found to be associated with diabetes, cerebrovascular disease, chronic obstructive pulmonary disease, cardiovascular disease, chronic renal failure, and early or premature birth. Thus, the prevention of periodontal disease is crucial not only for the improvement of oral health, but for the treatment of systemic diseases as well.
The problems related to aging and the maintenance of health in senescence are increasingly being emphasized worldwide. Periodontitis is the sixth-most-prevalent disease in the world [1]. A critical symptom of periodontitis is the loss of alveolar bone, which leads to the loss of a tooth, masticatory dysfunction, and an edentulous jaw [2]. The periodontitis stage is classified into four levels according to the severity, complexity, and additional factors based on a new periodontitis criterion suggested by the World Workshop on the Classification of Periodontal and PeriImplant Diseases and Conditions in 2017 [3]. Previously, clinical attachment loss was used in the assessment of periodontal disease, although recently, the assessment has applied the radiographic bone level (RBL) measured on radiographs [4,5]. In the use of dental radiographs for the diagnosis of periodontitis, the parts that pose challenges in the visual examination are interpreted based on the clinical experience of specialists. To resolve such issues, studies have applied deep learning models in the diagnosis of dental caries on dental radiography [6]. A method of deep learning known as the convolutional neural network (CNN) is being used in the classification and detection of various diseases through biomedical image analysis [7]. The field of dentistry has seen vast applications of the CNN in sophisticated clinical diagnosis, from the detection and classification of a tooth to the diagnosis of dental caries [8,9,10,11]. Recent studies on a hybrid deep learning framework were developed to automatically classify the stage of periodontitis of individual teeth, while other studies have used a deep learning DeNTNet technique to detect lesions and to identify the tooth number [12,13,14,15,16]. In light of these studies and for a more systematic and reliable diagnosis of periodontal disease, designing and developing machine learning algorithms based on deep learning are critical to allow automatic classification using dental radiographs and subsequent epidemiological diagnosis.
In this study, two algorithms based on deep learning were applied to dental panoramic radiographs to classify the stages of periodontitis for each tooth of the corresponding patient. The data of dental panoramic radiographs were obtained from Chungbuk National University Hospital (CBNUH) and AIHub, an open platform database. Using the data, the staging of periodontitis was classified using the deep learning algorithm, and the model’s performance was evaluated.

2. Materials and Methods

2.1. Dataset

2.1.1. CBNUH Dataset

The dental panoramic radiographs used in this study were obtained from CBNUH and AIHub, while the study was approved by the Institutional Review Board (CBNUH 2021-11-011) and was conducted according to relevant guidelines and regulations. The panoramic images from patients were produced using a dental panoramic X-ray device, PaX-i3D Smart (Vatech, Seoul, South Korea), and a total of 100 images were obtained, among which, 87 were used in this study with the exclusion of those with missing values and invalid image properties. The 87 images were expanded through various augmentations. From the dataset containing 87 images, two different forms of ground truths were generated by a specialized doctor, which were used for periodontal bone loss (PBL) and cementoenamel junction (CEJ) boundary detection. Figure 1 shows a sample panoramic radiograph along with its corresponding PBL mask and CEJ mask, which were generated by using CBNUH data.

2.1.2. AIHub Dataset

AIHub provides non-identified dental panoramic radiographs as a platform that holds radiographs of various diseases. The obtained dental radiographs are the data of the tooth and its vicinity with annotations to identify the tooth, missing tooth, dental prosthesis, dental caries, and dental implants [17]. Among the open datasets provided by AIHub, 4010 panoramic radiographs were used in this study. All image data are provided with the JSON label containing a list of pixel coordinates (x, y). These pixel coordinates represent and distinguish each tooth that is located in the image. To detect the number of individual teeth from the AIHub data, the YOLOv5 model was used. Each tooth was identified through a combination of a panoramic radiograph and its corresponding JSON label. The teeth were distinguished individually by different colors (Figure 2).

2.2. Methods and Algorithm

2.2.1. Data Augmentation

A dataset is a core component of machine learning, which means having a good and sufficient dataset could help in building an efficient model. To build U-Net models in our research for detecting the PBL and CEJ boundaries, only 87 panoramic radiographs were available. This number of datasets is too small and could lead to an overfit model. To solve this problem, we applied data augmentation on all 87 images to increase the number of data. Two main data augmentation techniques were applied, including “Flipping” and “Rotation”. The final dataset size after data augmentation was 1044 images. The flipping technique allows one to stretch the 87 original images to 348 images (87 × 4). We applied three types of flips (horizontal, vertical, and both horizontal and vertical). The rotation technique was also applied to the original images. This technique allows growing the dataset size from 87 to 783 images (87 × 9). Rotation was applied at eight angles: 30°, 60°, 90°, 120°, 150°, 210°, 240°, and 270°.

2.2.2. Deep Learning Algorithm

In this study, we conducted an experiment with two main deep learning algorithms, which are U-Net and YOLOv5. These two algorithms were used for different purposes, which ended up being integrated together to build the final deep learning framework.
U-Net: a supervised machine learning model that is specifically applied in biomedical image segmentation among the methods to perceive and to classify objects. This model performs the classification through pixel-based segmentation of the image, and its architecture was designed to work well with biomedical images such as dental, brain, or chest X-rays [18]. U-Net was built on a fully convolution network (FCN), and the FCN structure is modified toward more accurate segmentation even in the presence of a small quantity of data. U-Net is a U-shaped architecture that can classify an object per pixel by extracting semantic data from a wide range of image pixels. To ensure the learning leads to a reliable differentiation of proximate objects in terms of their boundary, the weighted loss is provided. The U-Net structure is divided into three parts; contracting path, expanding path, and bottleneck part. Two deep learning models were built using this architecture, which were used to detect the boundary of PBL and CEJ separately. These U-Net models were trained separately for 30 epochs with a batch size of 16 for each model.
YOLOv5: a PyTorch-based implementation as a complex-scale object detection supervised model trained using the original COCO dataset. There are several versions of the YOLO architecture, but we decided to conduct our experiment with the last version in this study. The reason we chose YOLOv5 is that it is 90% lighter than the fourth version. It is also proven to be very fast during training, yielding good results. In this study, we wanted to classify the stages of periodontal disease for each tooth. Therefore, it is a must for our framework to be able to detect and classify the tooth number in the panoramic radiographs. We used YOLOv5 to detect tooth objects and to classify them into different numbers according to the teeth numbering system [19,20,21]. With the detected tooth number, we integrated it with the boundaries that were detected using U-Net to decide the stage of periodontal disease for that tooth.

2.2.3. Model Evaluation Metrics

Our proposed integrated model is the combination of two different deep learning algorithms, including U-Net and YOLOv5. Normally, for each model, different evaluation metrics are used to interpret its performance. Only the accuracy and loss values during training and validating are presented in the results for U-Net models. For the YOLOv5 model, there are different kinds of evaluation metrics, such as average precision (AP), mean average precision (mAP), etc. However, overall, we wanted to focus on the periodontitis stage classification, so we decided to present a few well-known evaluation metrics for the classification model. These evaluation metrics may be easier to interpret and understand for most readers.
For the performance evaluation, the confusion matrix was used, and the accuracy, precision, recall, and F1-score as the common indicators of classification analysis were used. The formula for each indicator is as follows [22]:
Accuracy = (TP + TN)/(TP + FN + TN + FP)
Recall = TP/(FN + TP)
Precision = TP/(FP + TP)
F1-Score = (2 × Precision × Recall)/(Precision + Recall)

3. Experiments and Results

The experiments were conducted using the Python Library 3.9.10 and TensorFlow, PyTorch, Keras, OpenCV, Numpy, Pillow, and Matplotlib libraries. Figure 3 depicts the entire process of the use of deep learning algorithms to classify and to evaluate the periodontal stage. The PBL and CEJ boundaries on the CBNUH image data were detected using U-Net models. The tooth number and tooth length of the AIHub data were identified using the YOLOv5 model. By integrating these model’s results, the stage of periodontal disease on the dental panoramic radiographs was classified and evaluated.

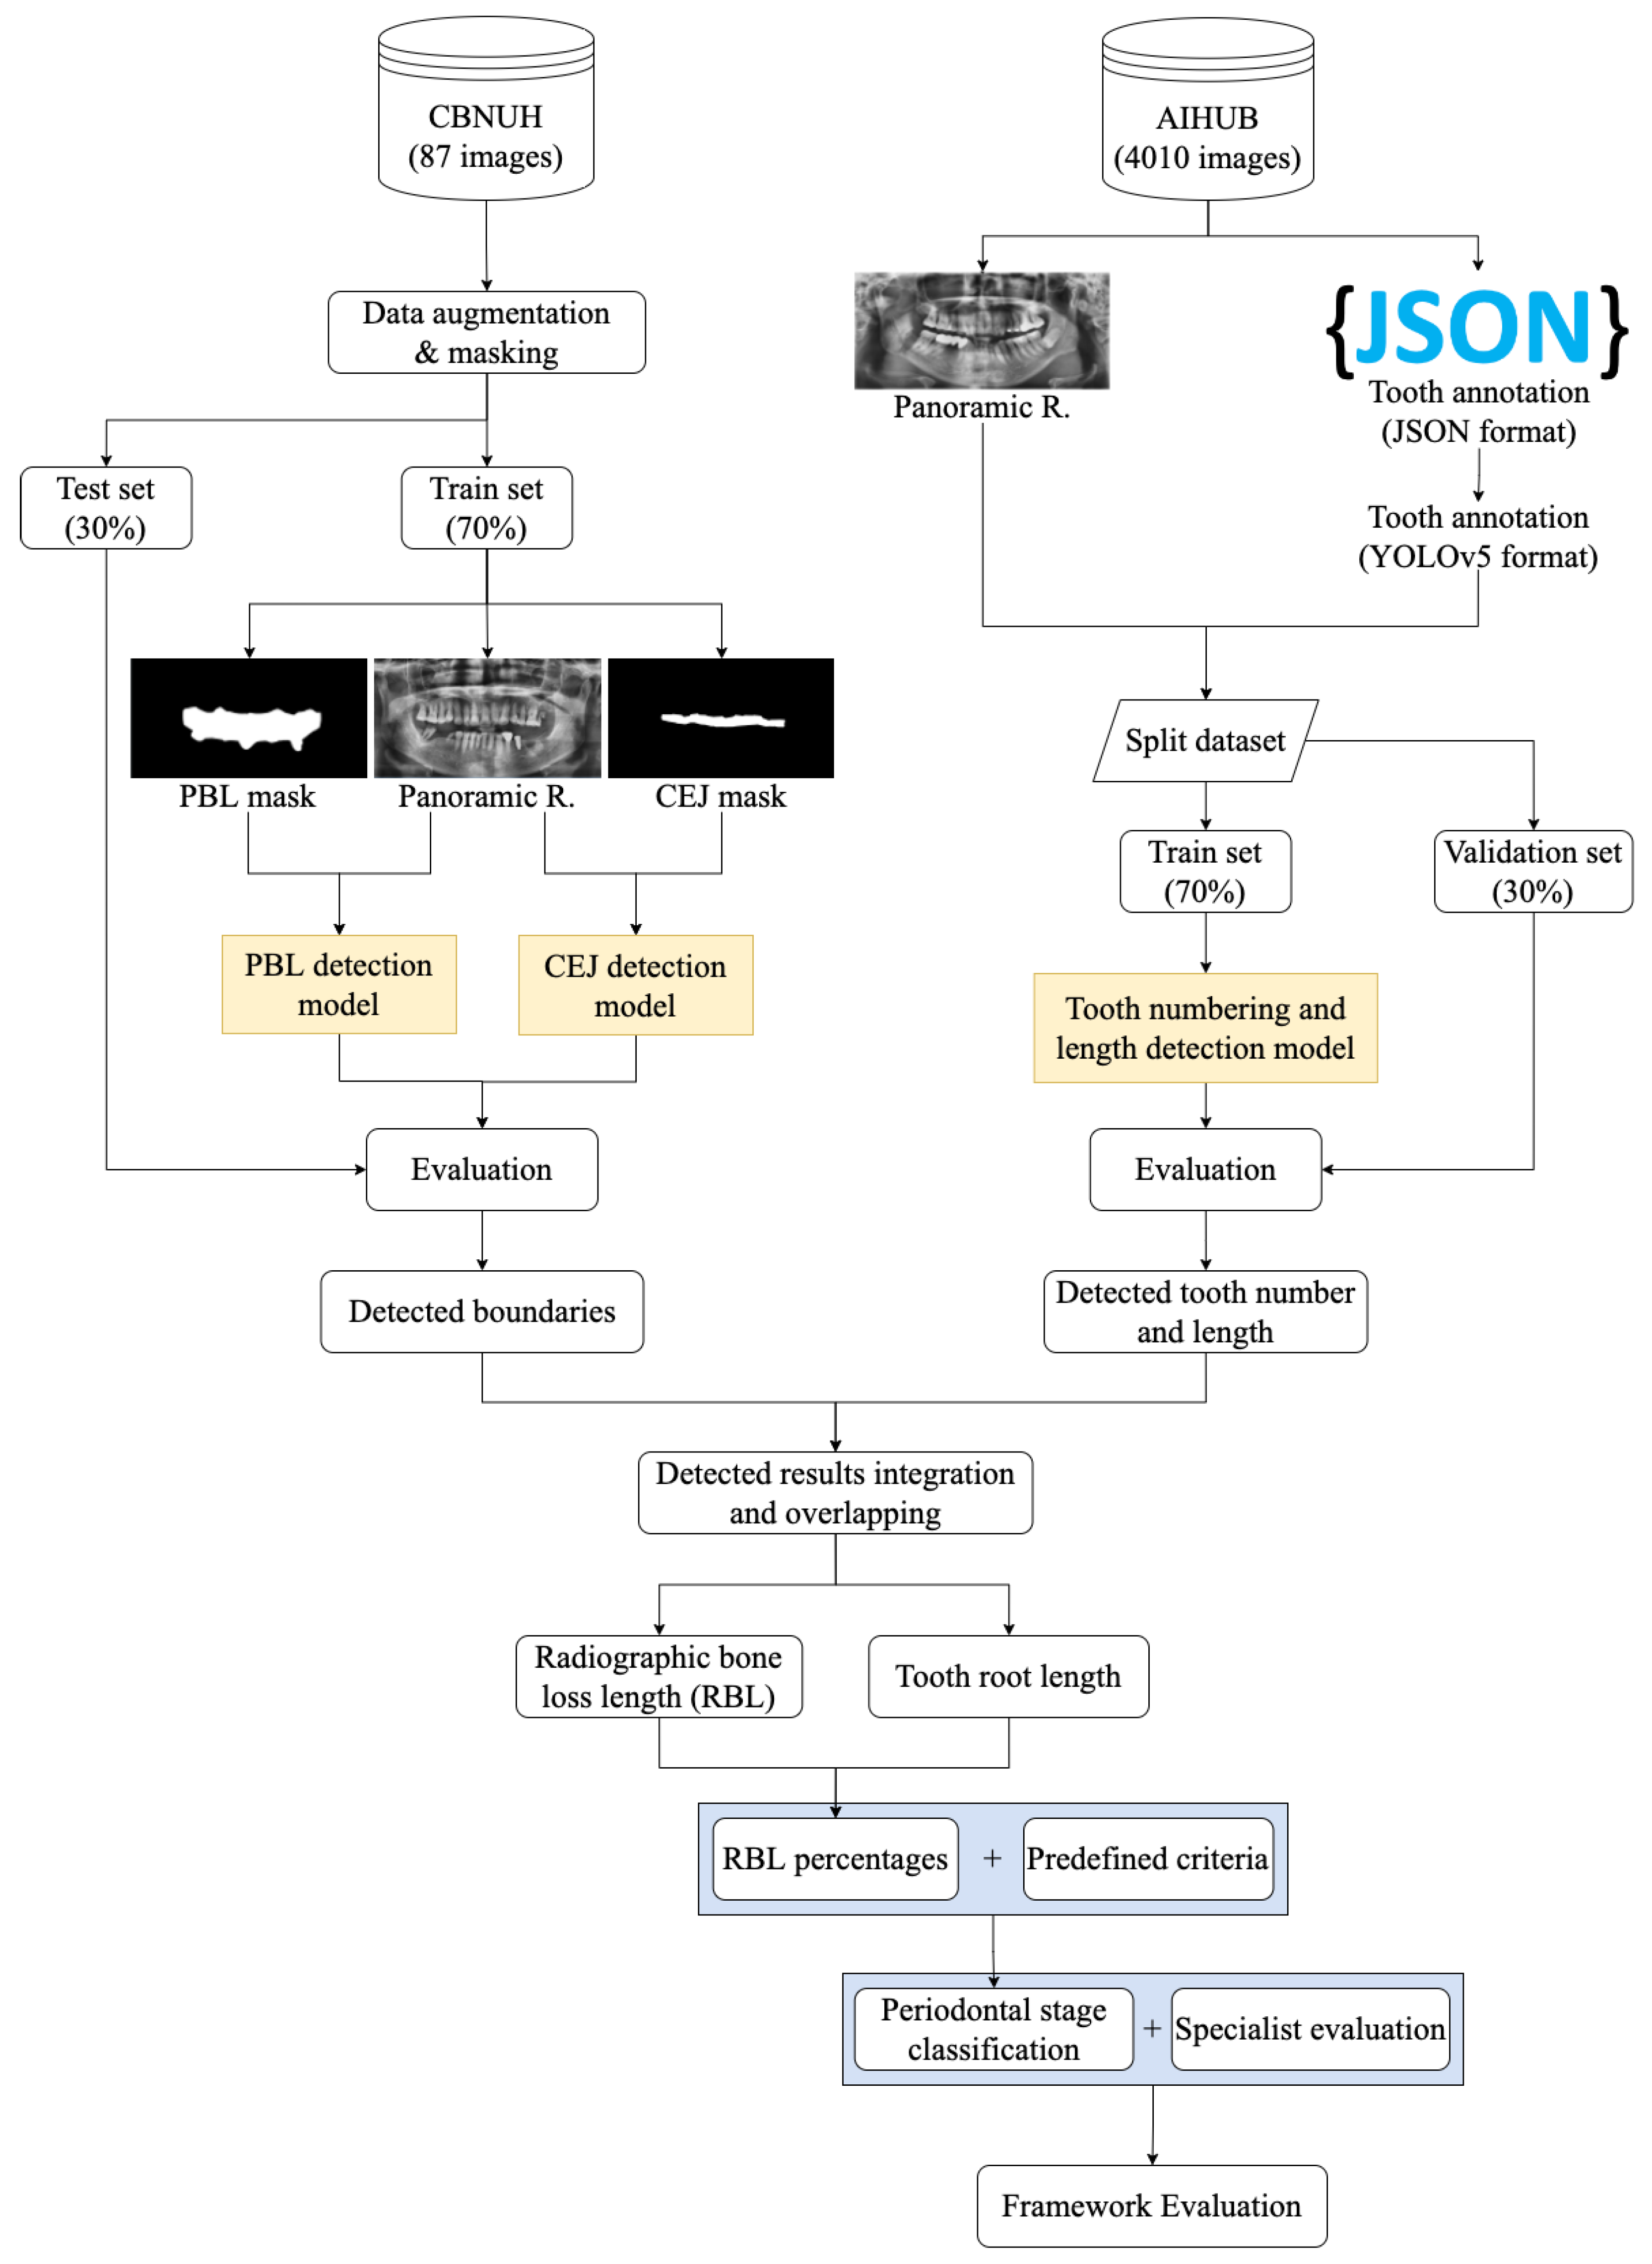
3.1. Experimental Flow

The research started by collecting panoramic radiograph datasets from two main data sources, including CBNUH and AIHub, which contain 87 and 1044 valid images, respectively. Data augmentation was applied to only the CBNUH dataset due to having a small amount of data. Furthermore, this dataset was used to generate two types of masks, which are PBL and CEJ masks, which acted as the training input for the two U-Net models. The purpose of these models is semantic segmentation, which is to detect the boundary of the PBL and CEJ area on the panoramic radiograph. At the same time, the dataset from AIHub was combined with its corresponding JSON label to create a required format for training the YOLOv5 model. The purpose of this YOLOv5 model is to detect and assign a number to each individual tooth that exists in the panoramic radiograph, as well as to calculate the length of that tooth. To this step, we had three models, which were two U-Net models and a YOLOv5 model. From these three models’ results, a periodontal disease stage for each tooth was classified with the following steps:
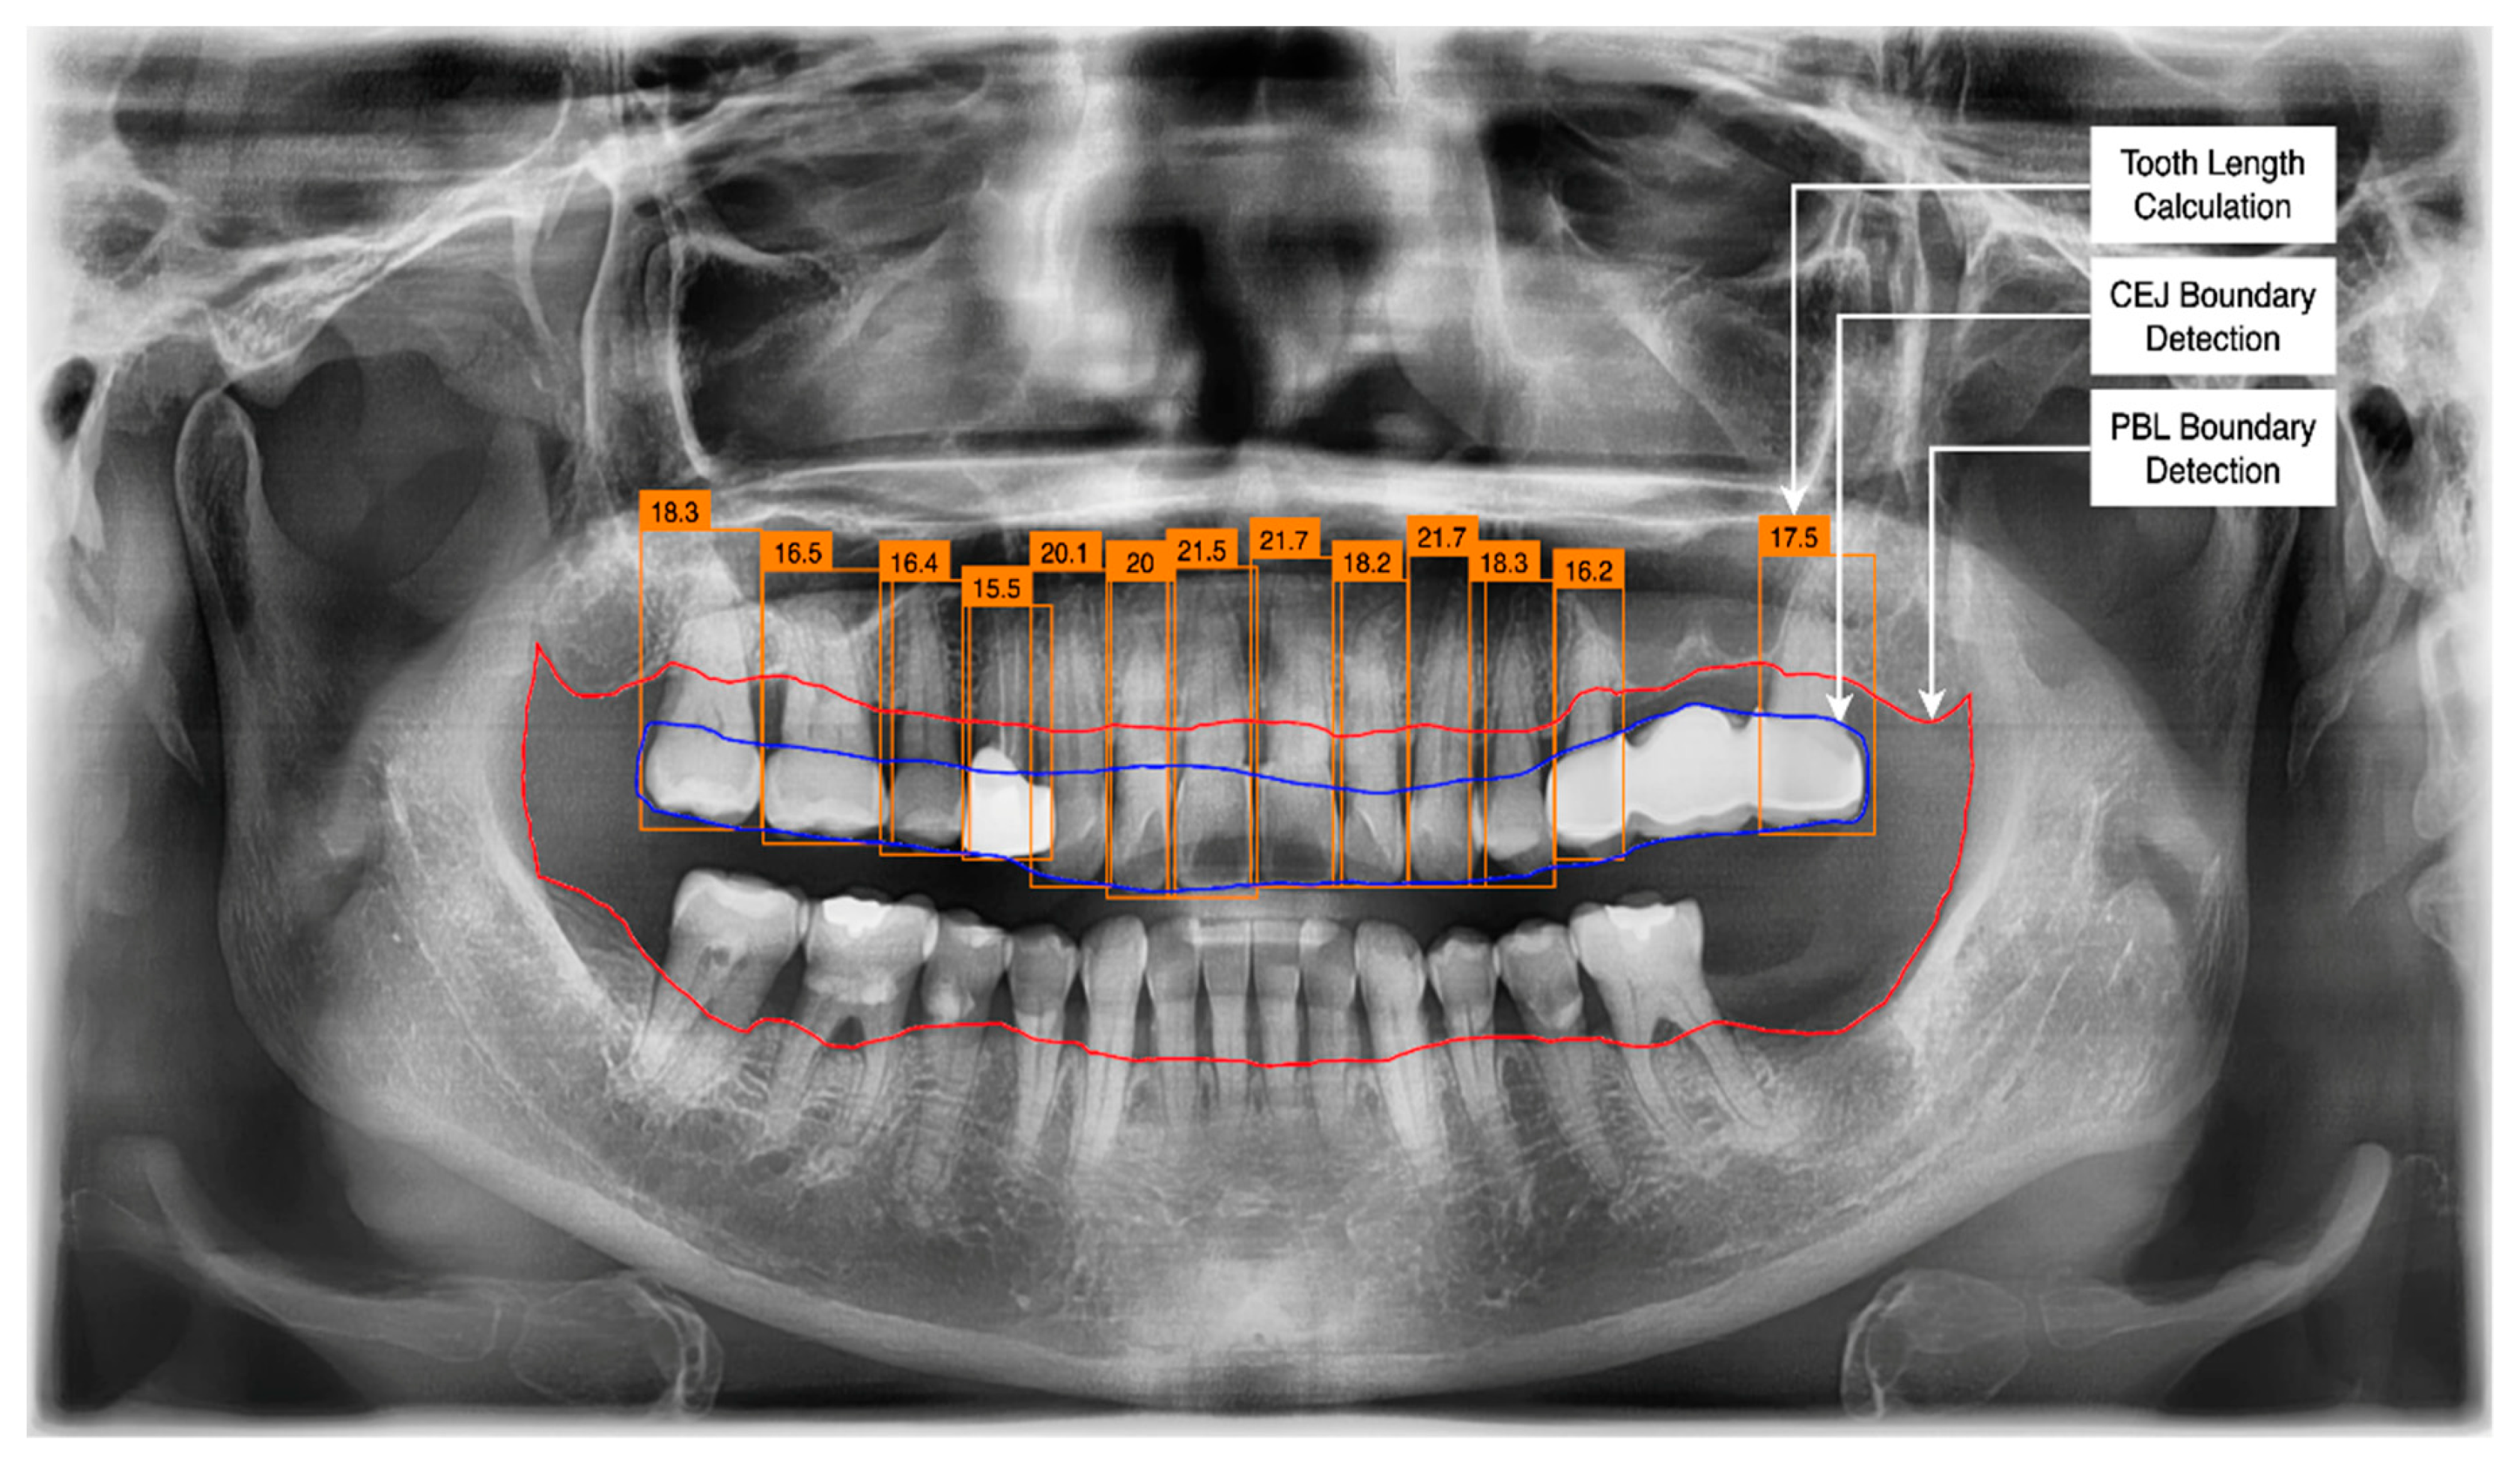
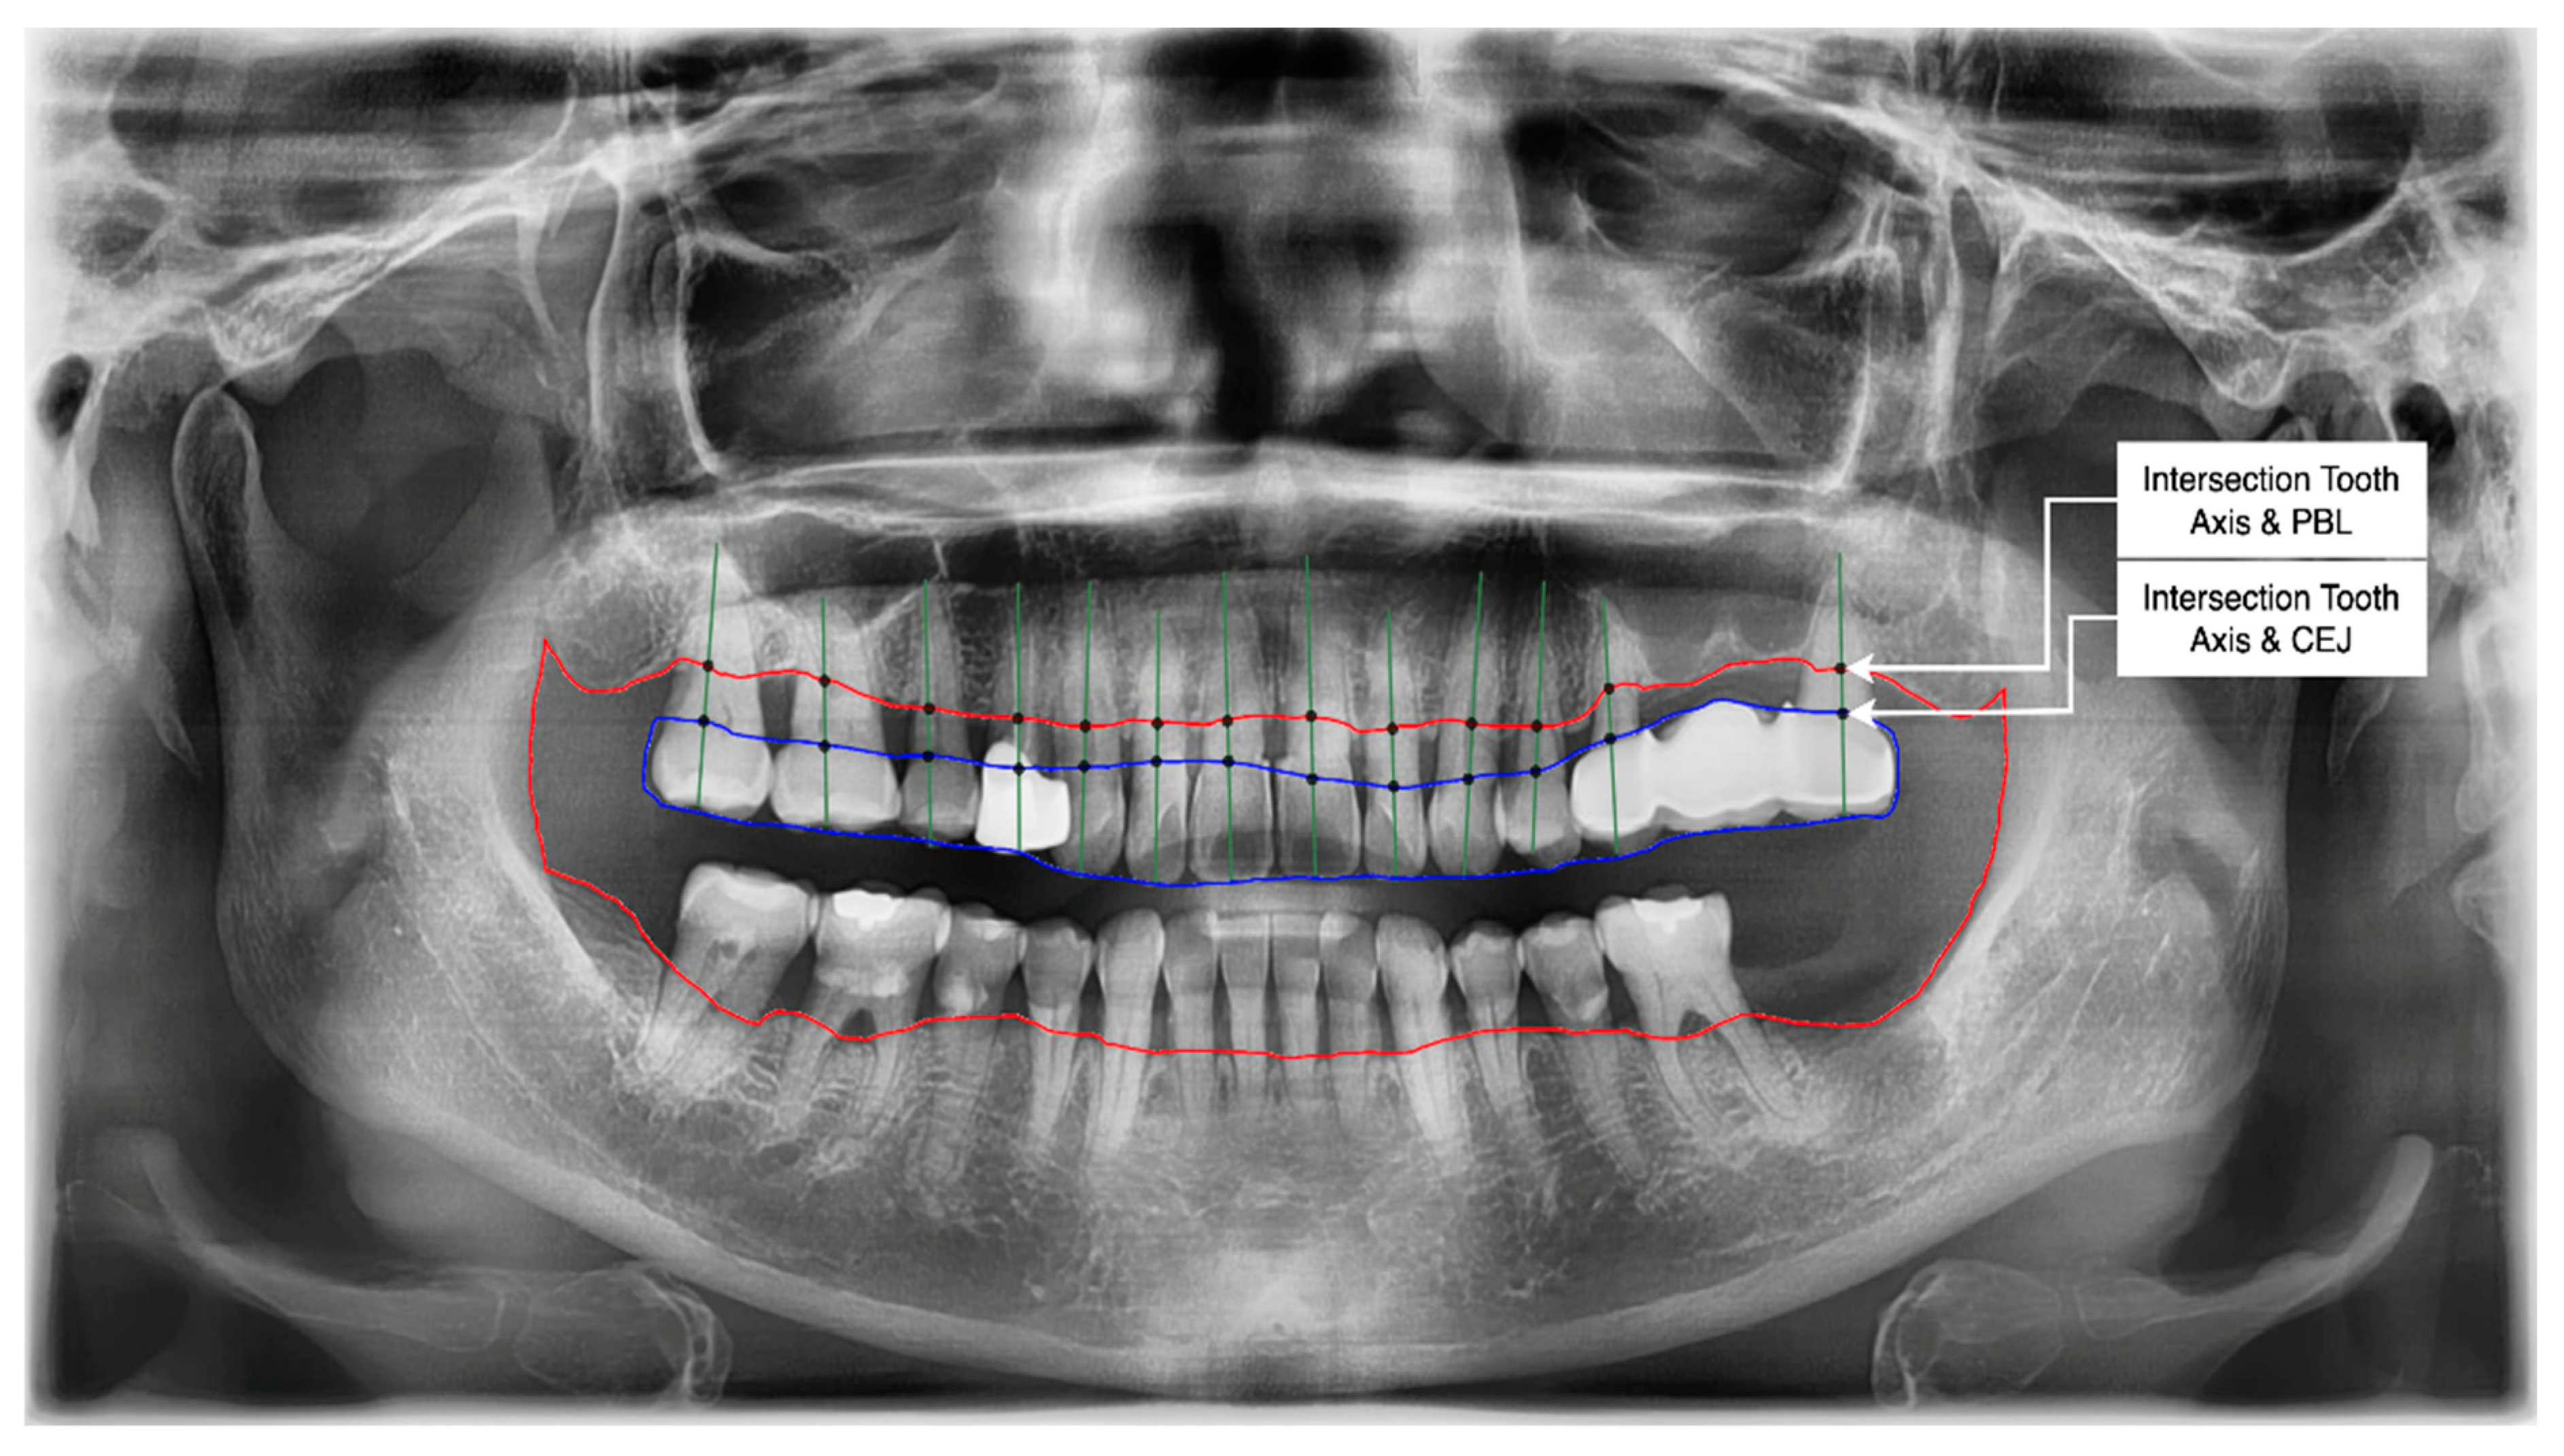
  • Get the intersection of the PBL’s upper side and the tooth’s middle axis.
  • Get the intersection of the CEJ’s upper side and the tooth’s middle axis.
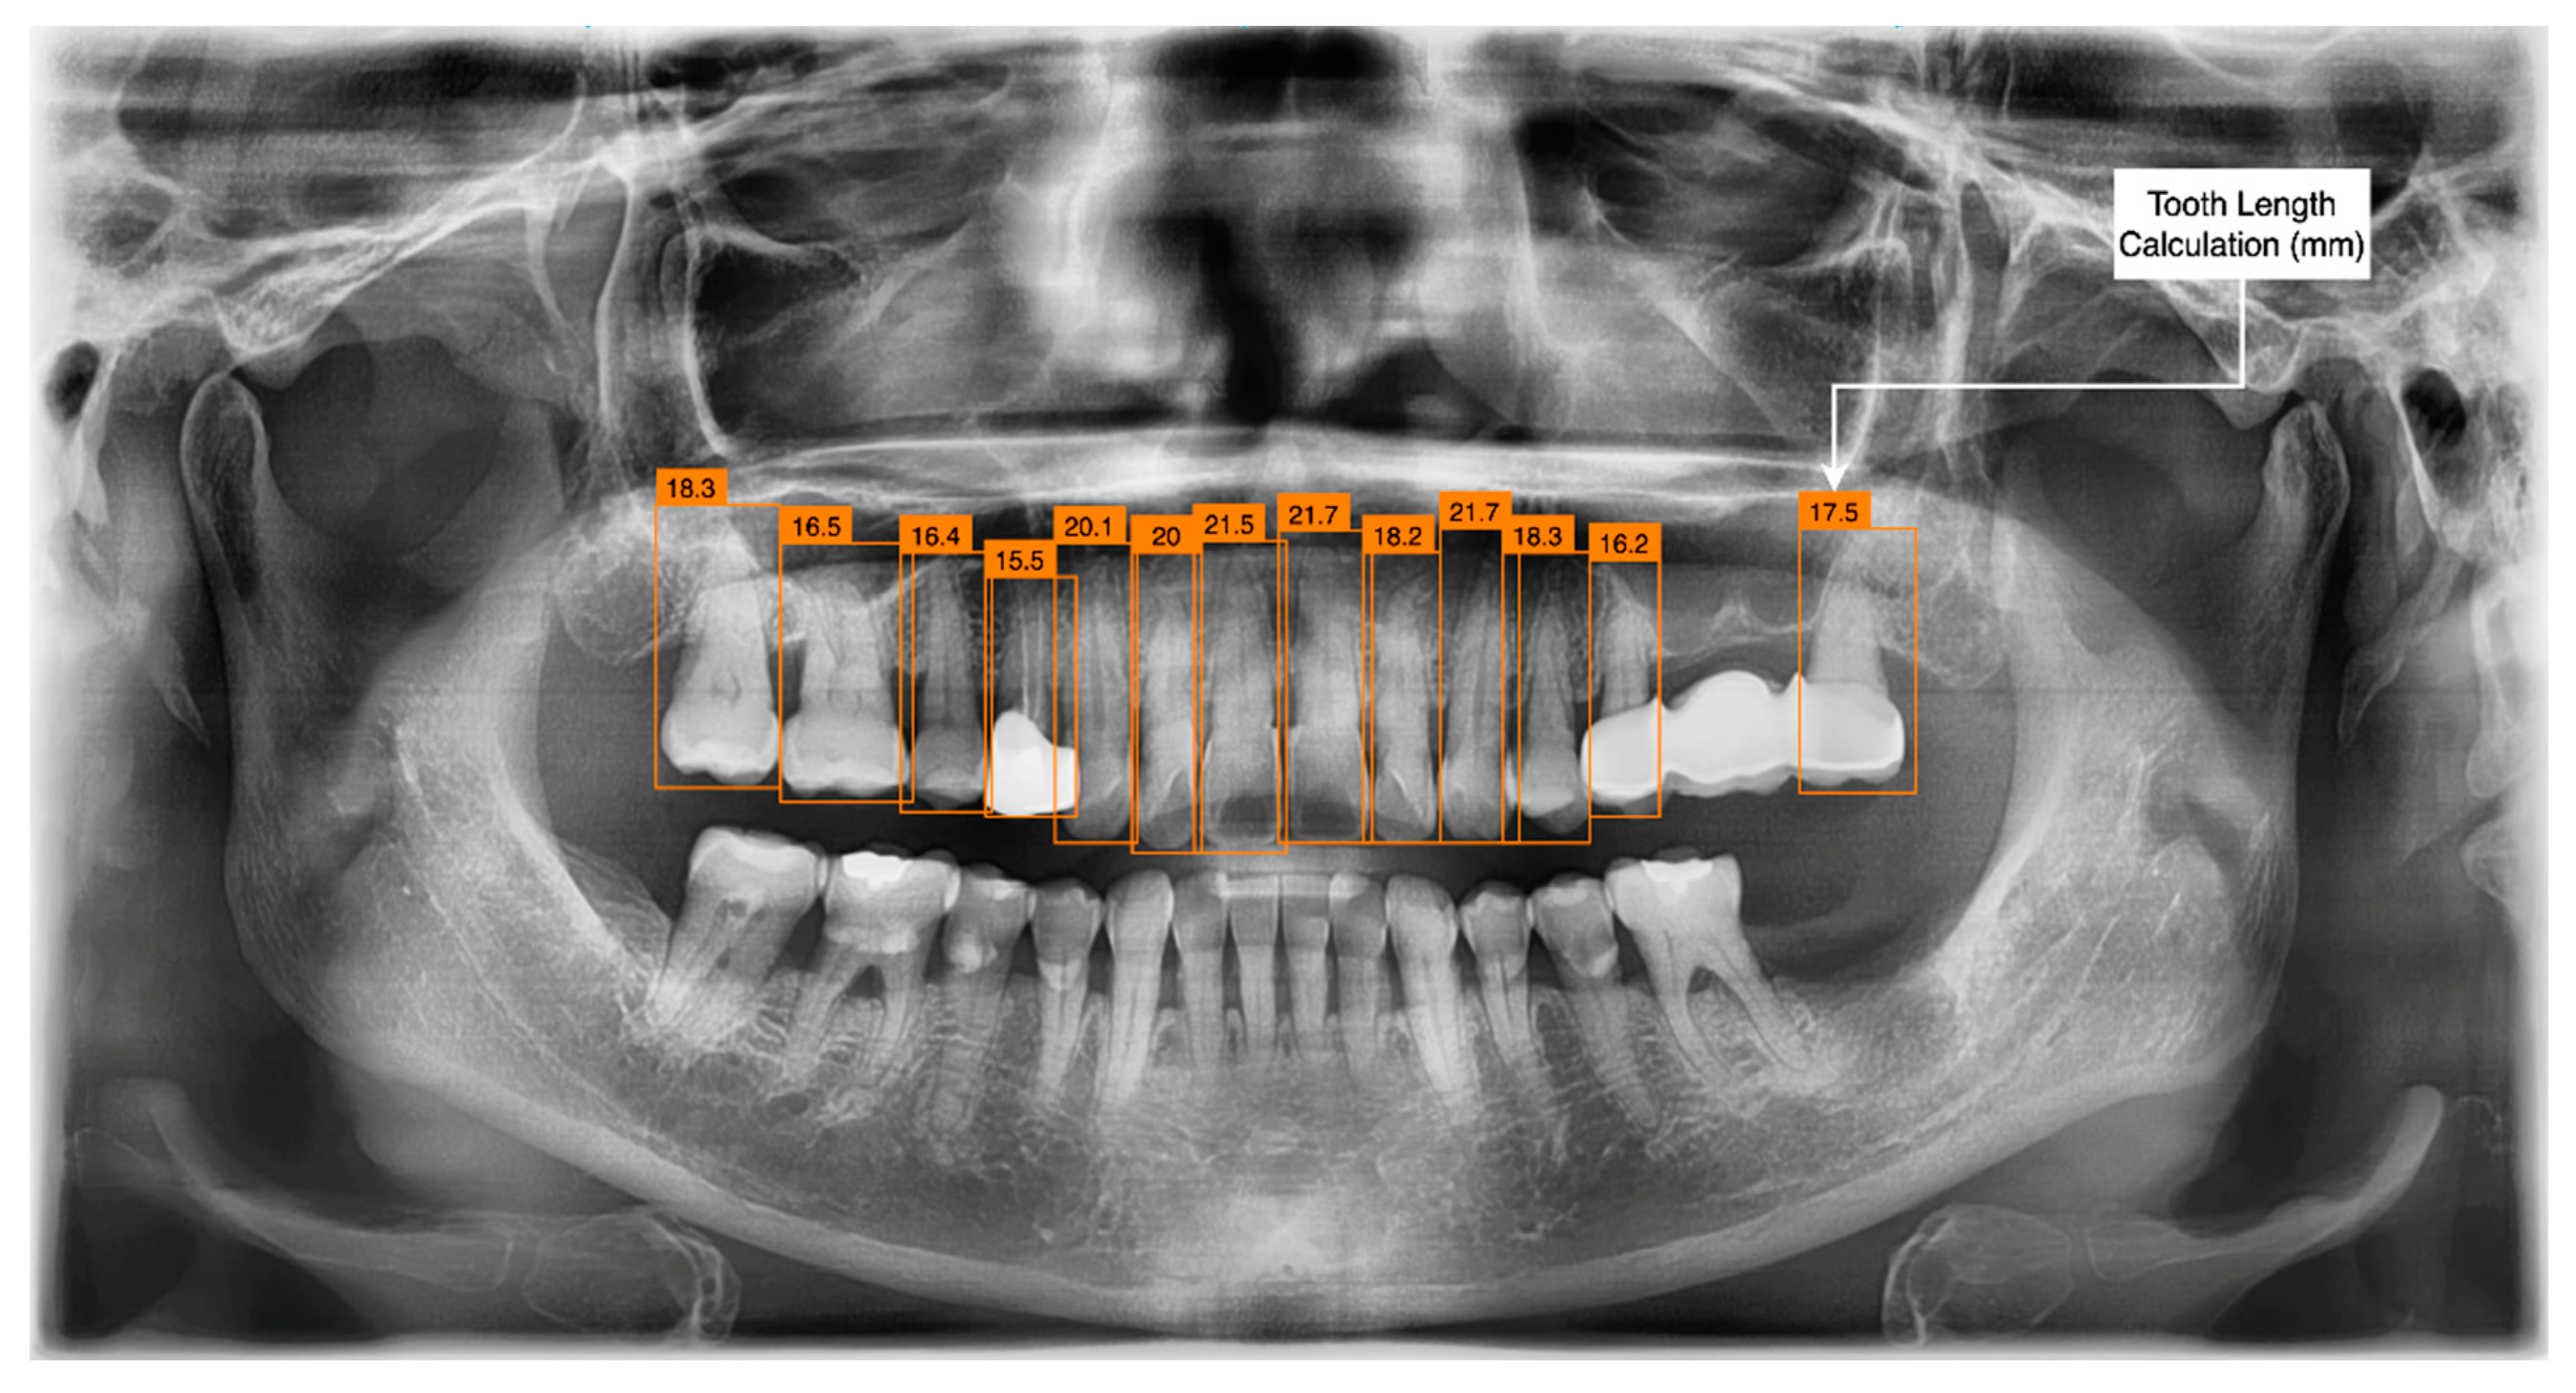
  • Calculate the length from those two intersections (known as the RBL length).
  • Calculate the RBL percentage from the RBL length and tooth root.
With this percentage of RBL, we can classify periodontal stages, which will be detailed in Section 3.3.

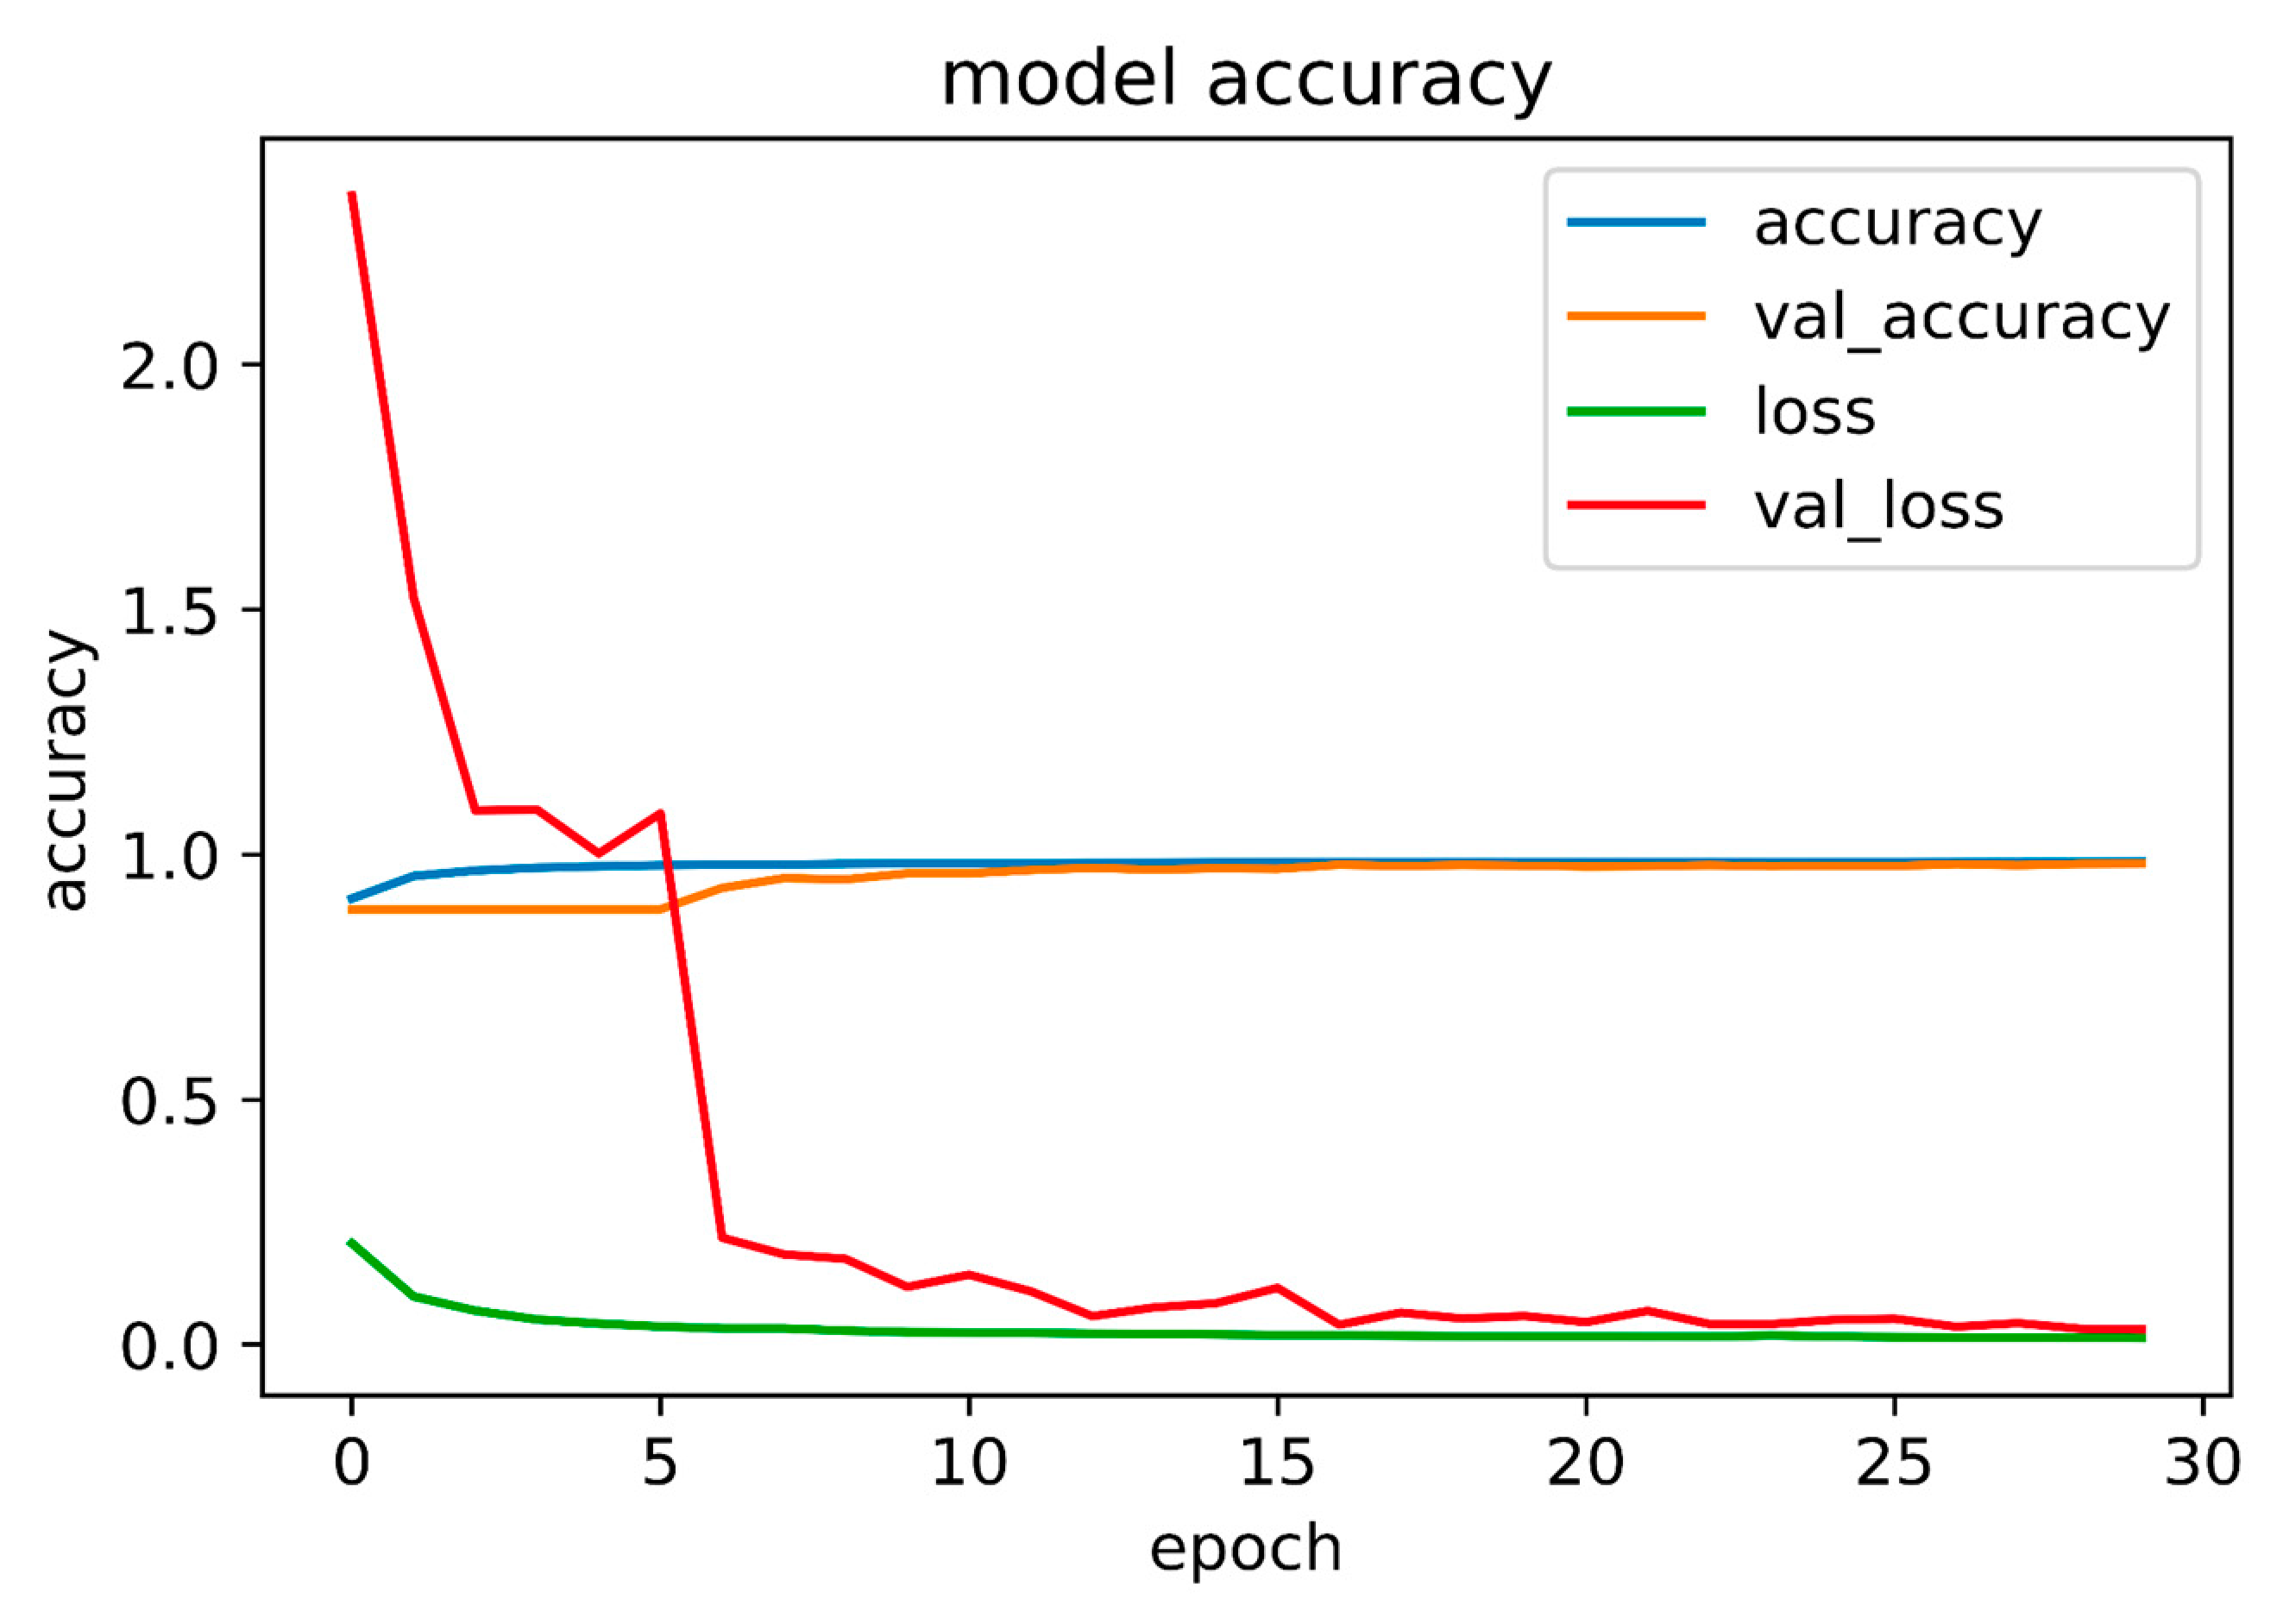
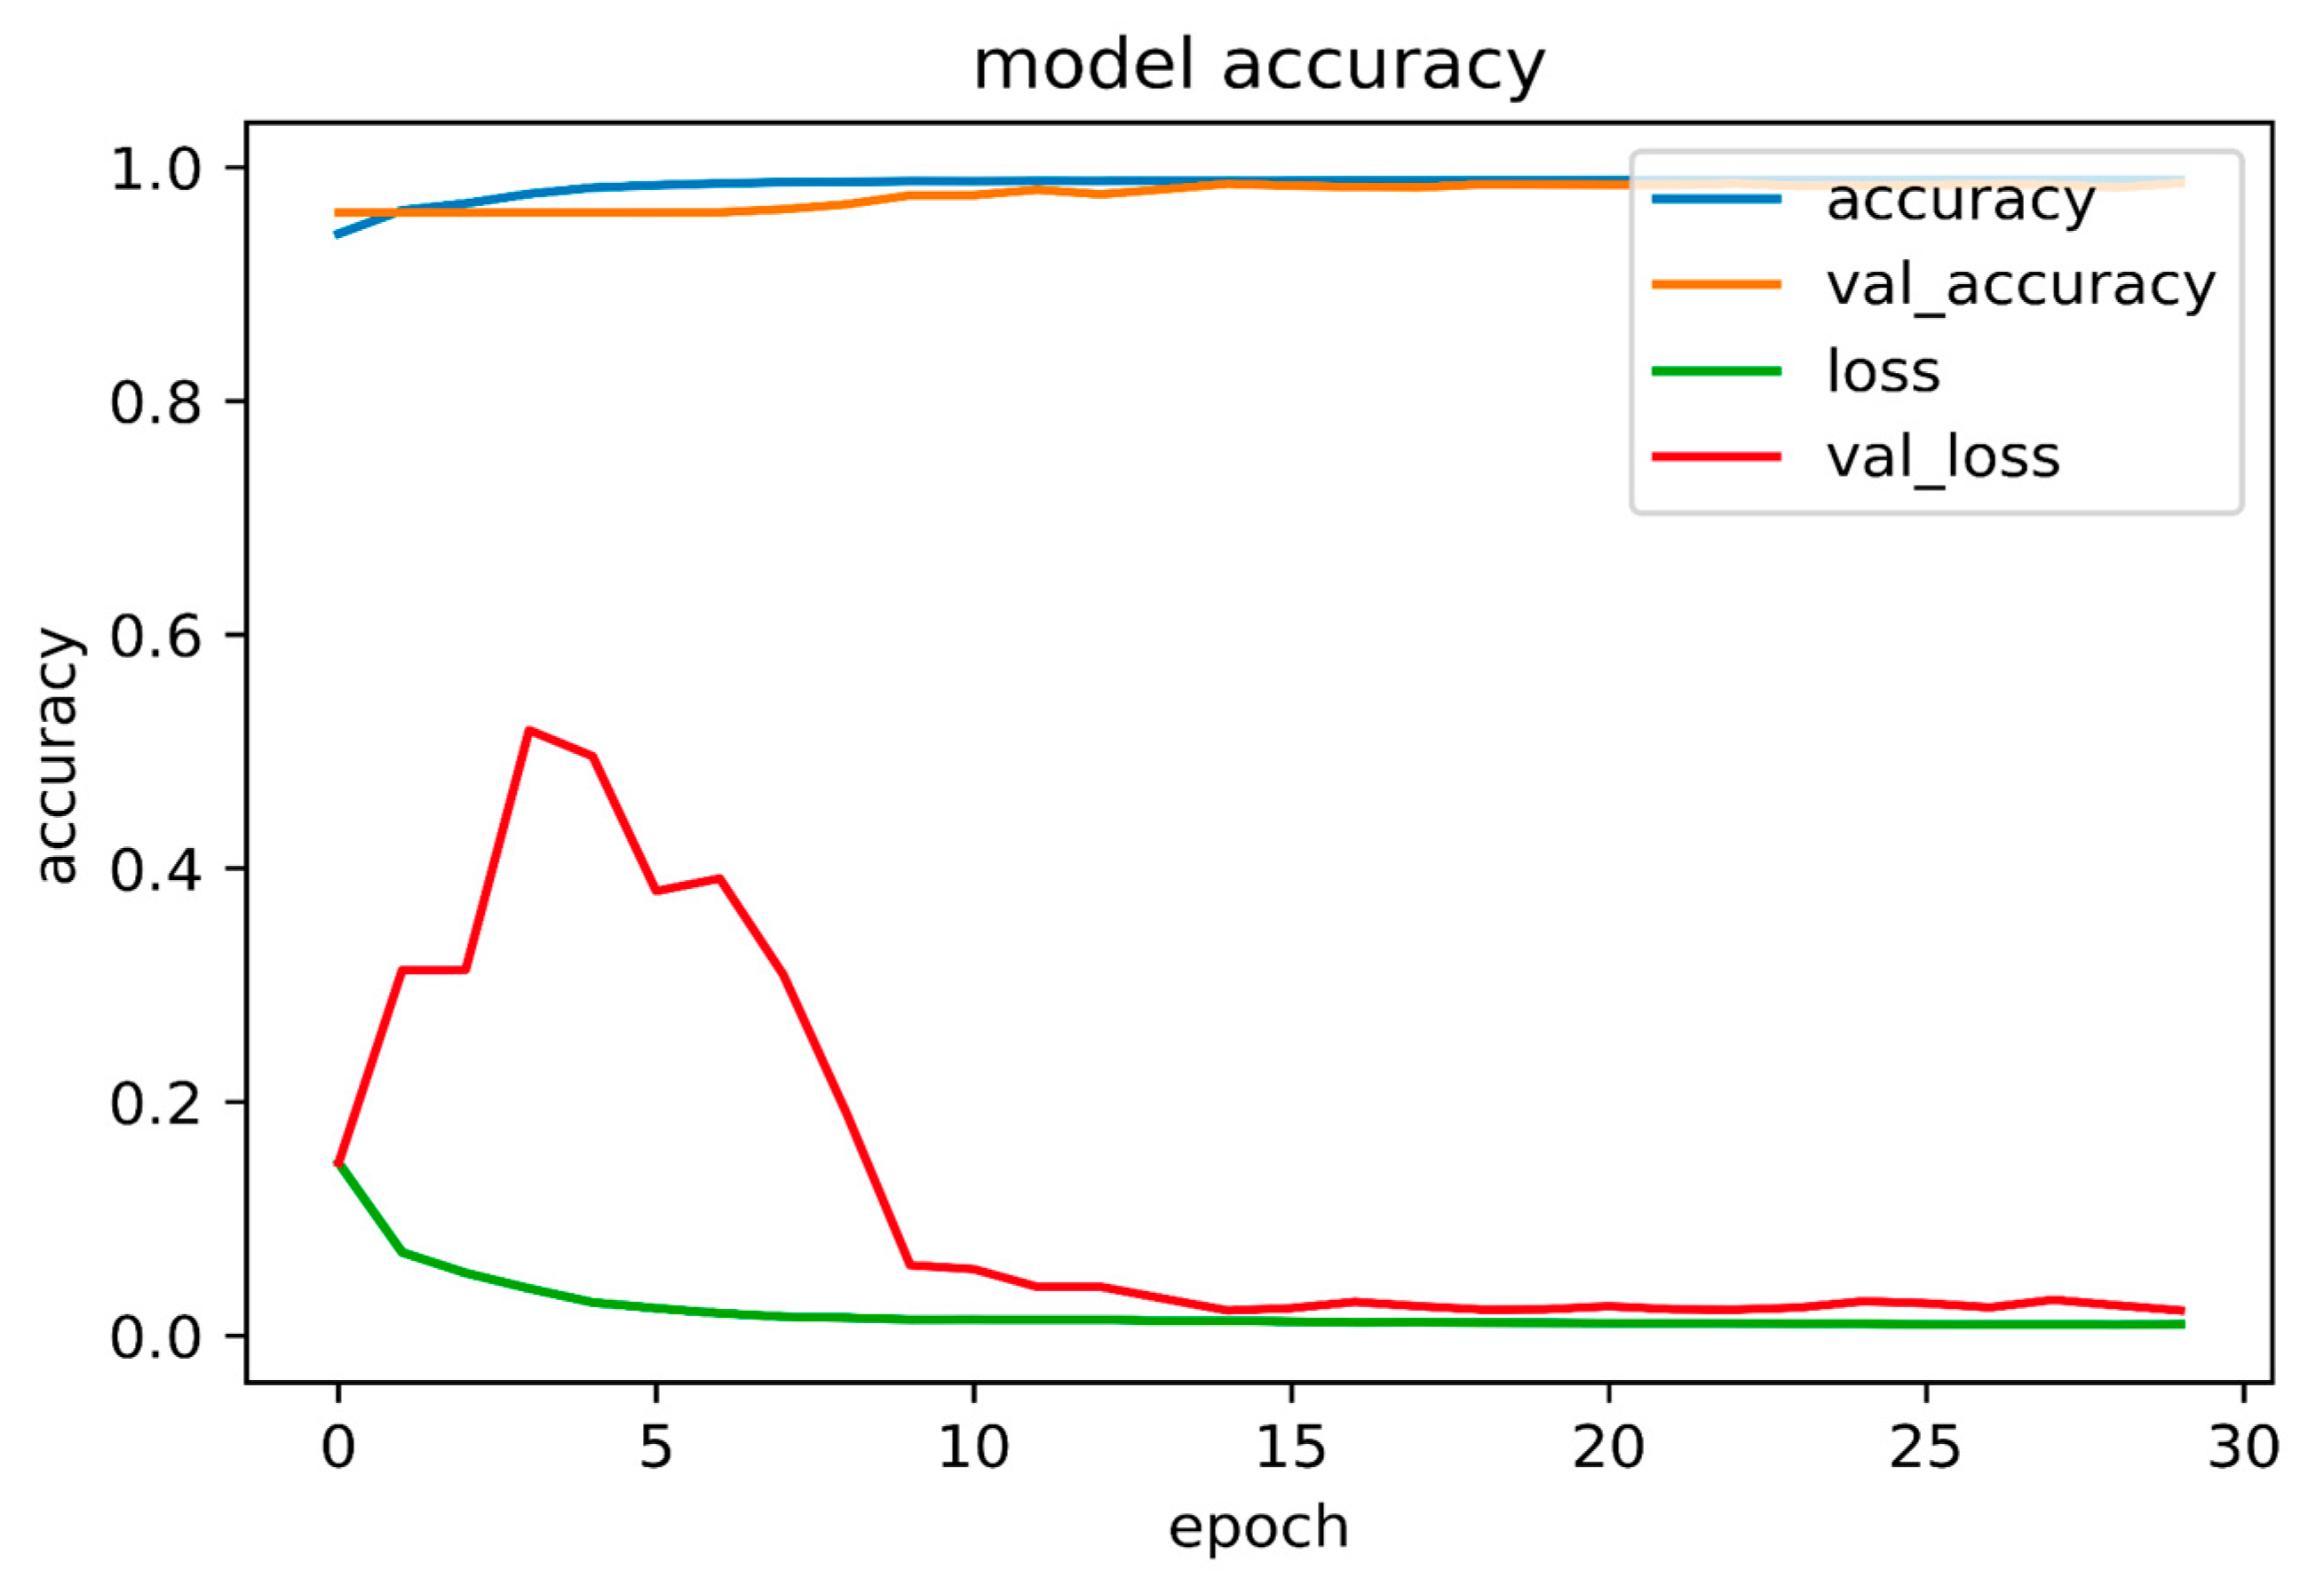
3.2. PBL and CEJ Boundary Detection through U-Net

Figure 4 and Figure 5 show the prediction accuracy of the PBL and CEJ boundaries estimated by U-Net after data augmentation. The PBL and CEJ boundaries were detected using this model architecture, while for both PBL and CEJ, the U-Net model was trained for 30 epochs at a batch size of 16. Table 1 shows the U-Net model accuracy for PBL and CEJ, where the accuracy is slightly higher for CEJ.

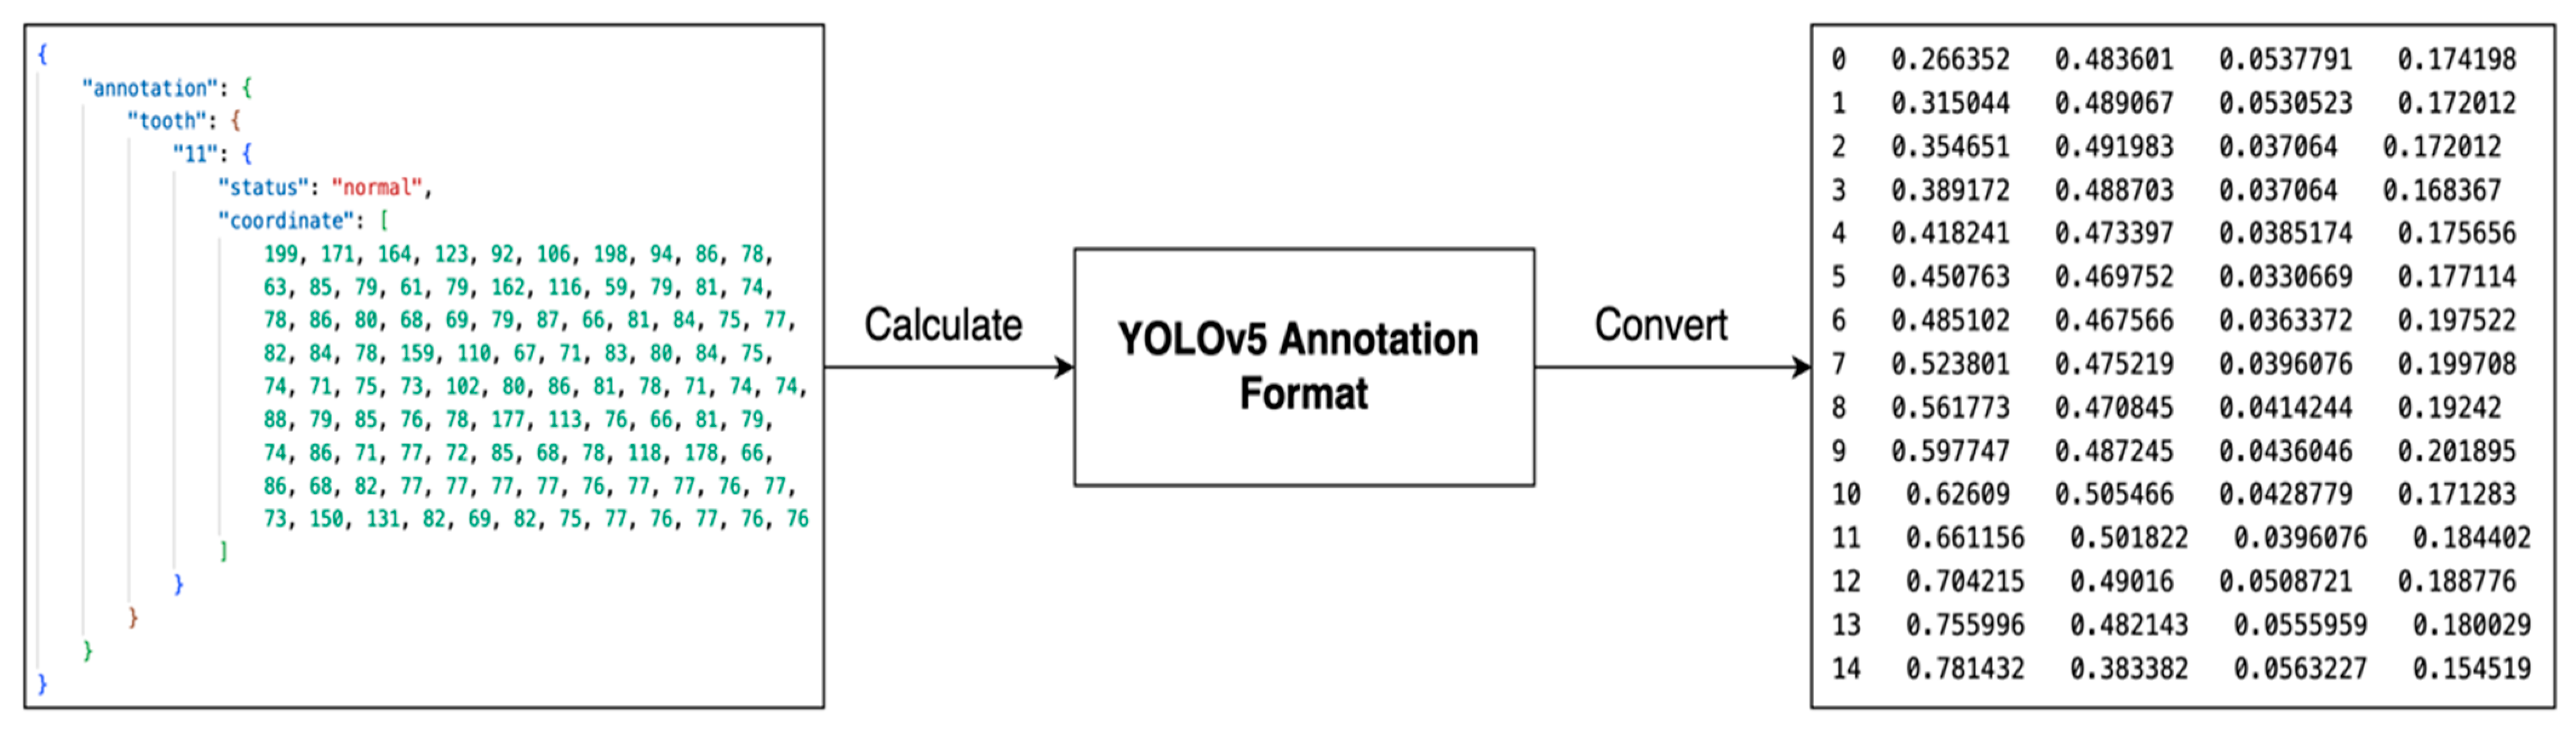
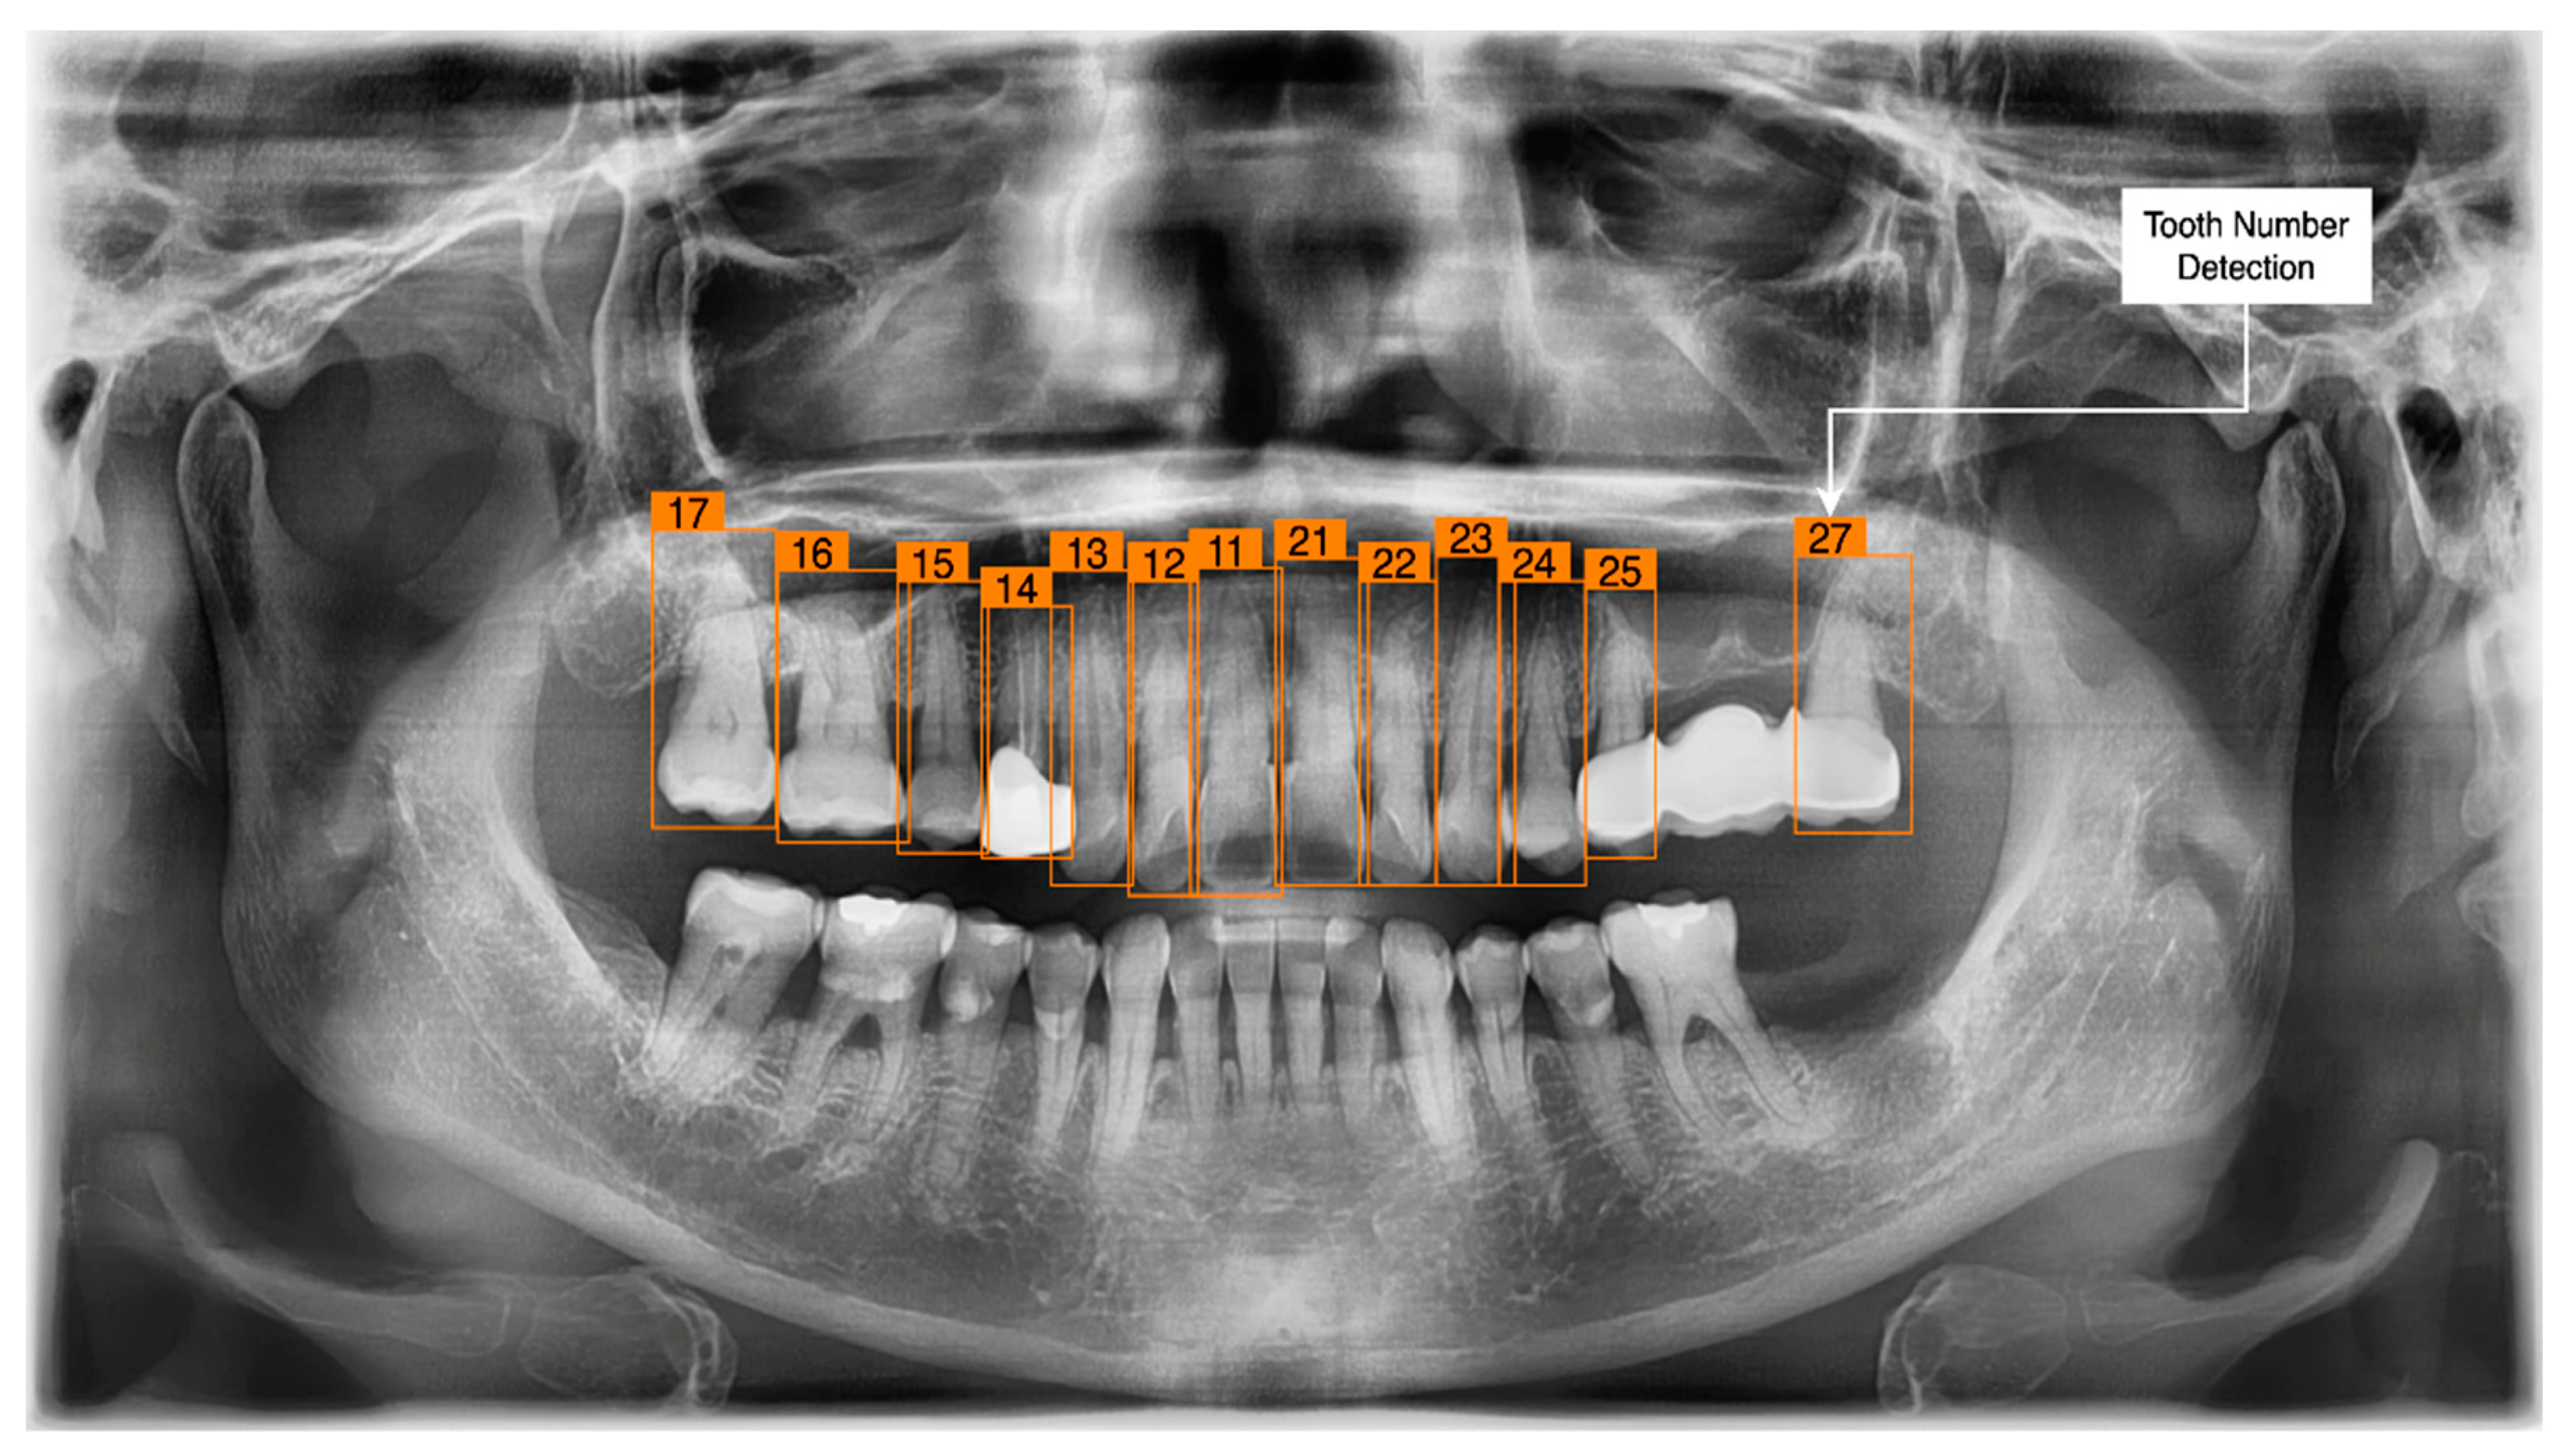
3.3. Tooth Identification through YOLOv5

For integrating the AIHub and CBNUH data, the following procedures were performed: First, the varying image sizes of these data were adjusted to the standard size. As the AIHub data are in the JSON format containing the pixel coordinates (x, y) and the CBNUH data are in the csv format of YOLOv5, the integration required conversion to the YOLOv5 annotation format, the result of which is presented in Figure 6.
To calculate the tooth number and tooth length, the YOLOv5 algorithm was used. As shown in Figure 7, each tooth was numbered, and through the semantic segmentation of each tooth, instance segmentation was performed. Assuming the image height at 100 mm, the tooth length was converted and then calculated as shown in Figure 8.
Using the YOLOv5 algorithm, a model was built for the identification of the tooth number and tooth length for the AIHub data. For the detection of the PBL and CEJ on the CBNUH data through U-Net, the semantic segmentation to define the category of each pixel was performed. After integrating the models, the stage of each tooth was classified based on the lengths of the PBL and CEJ and tooth length.

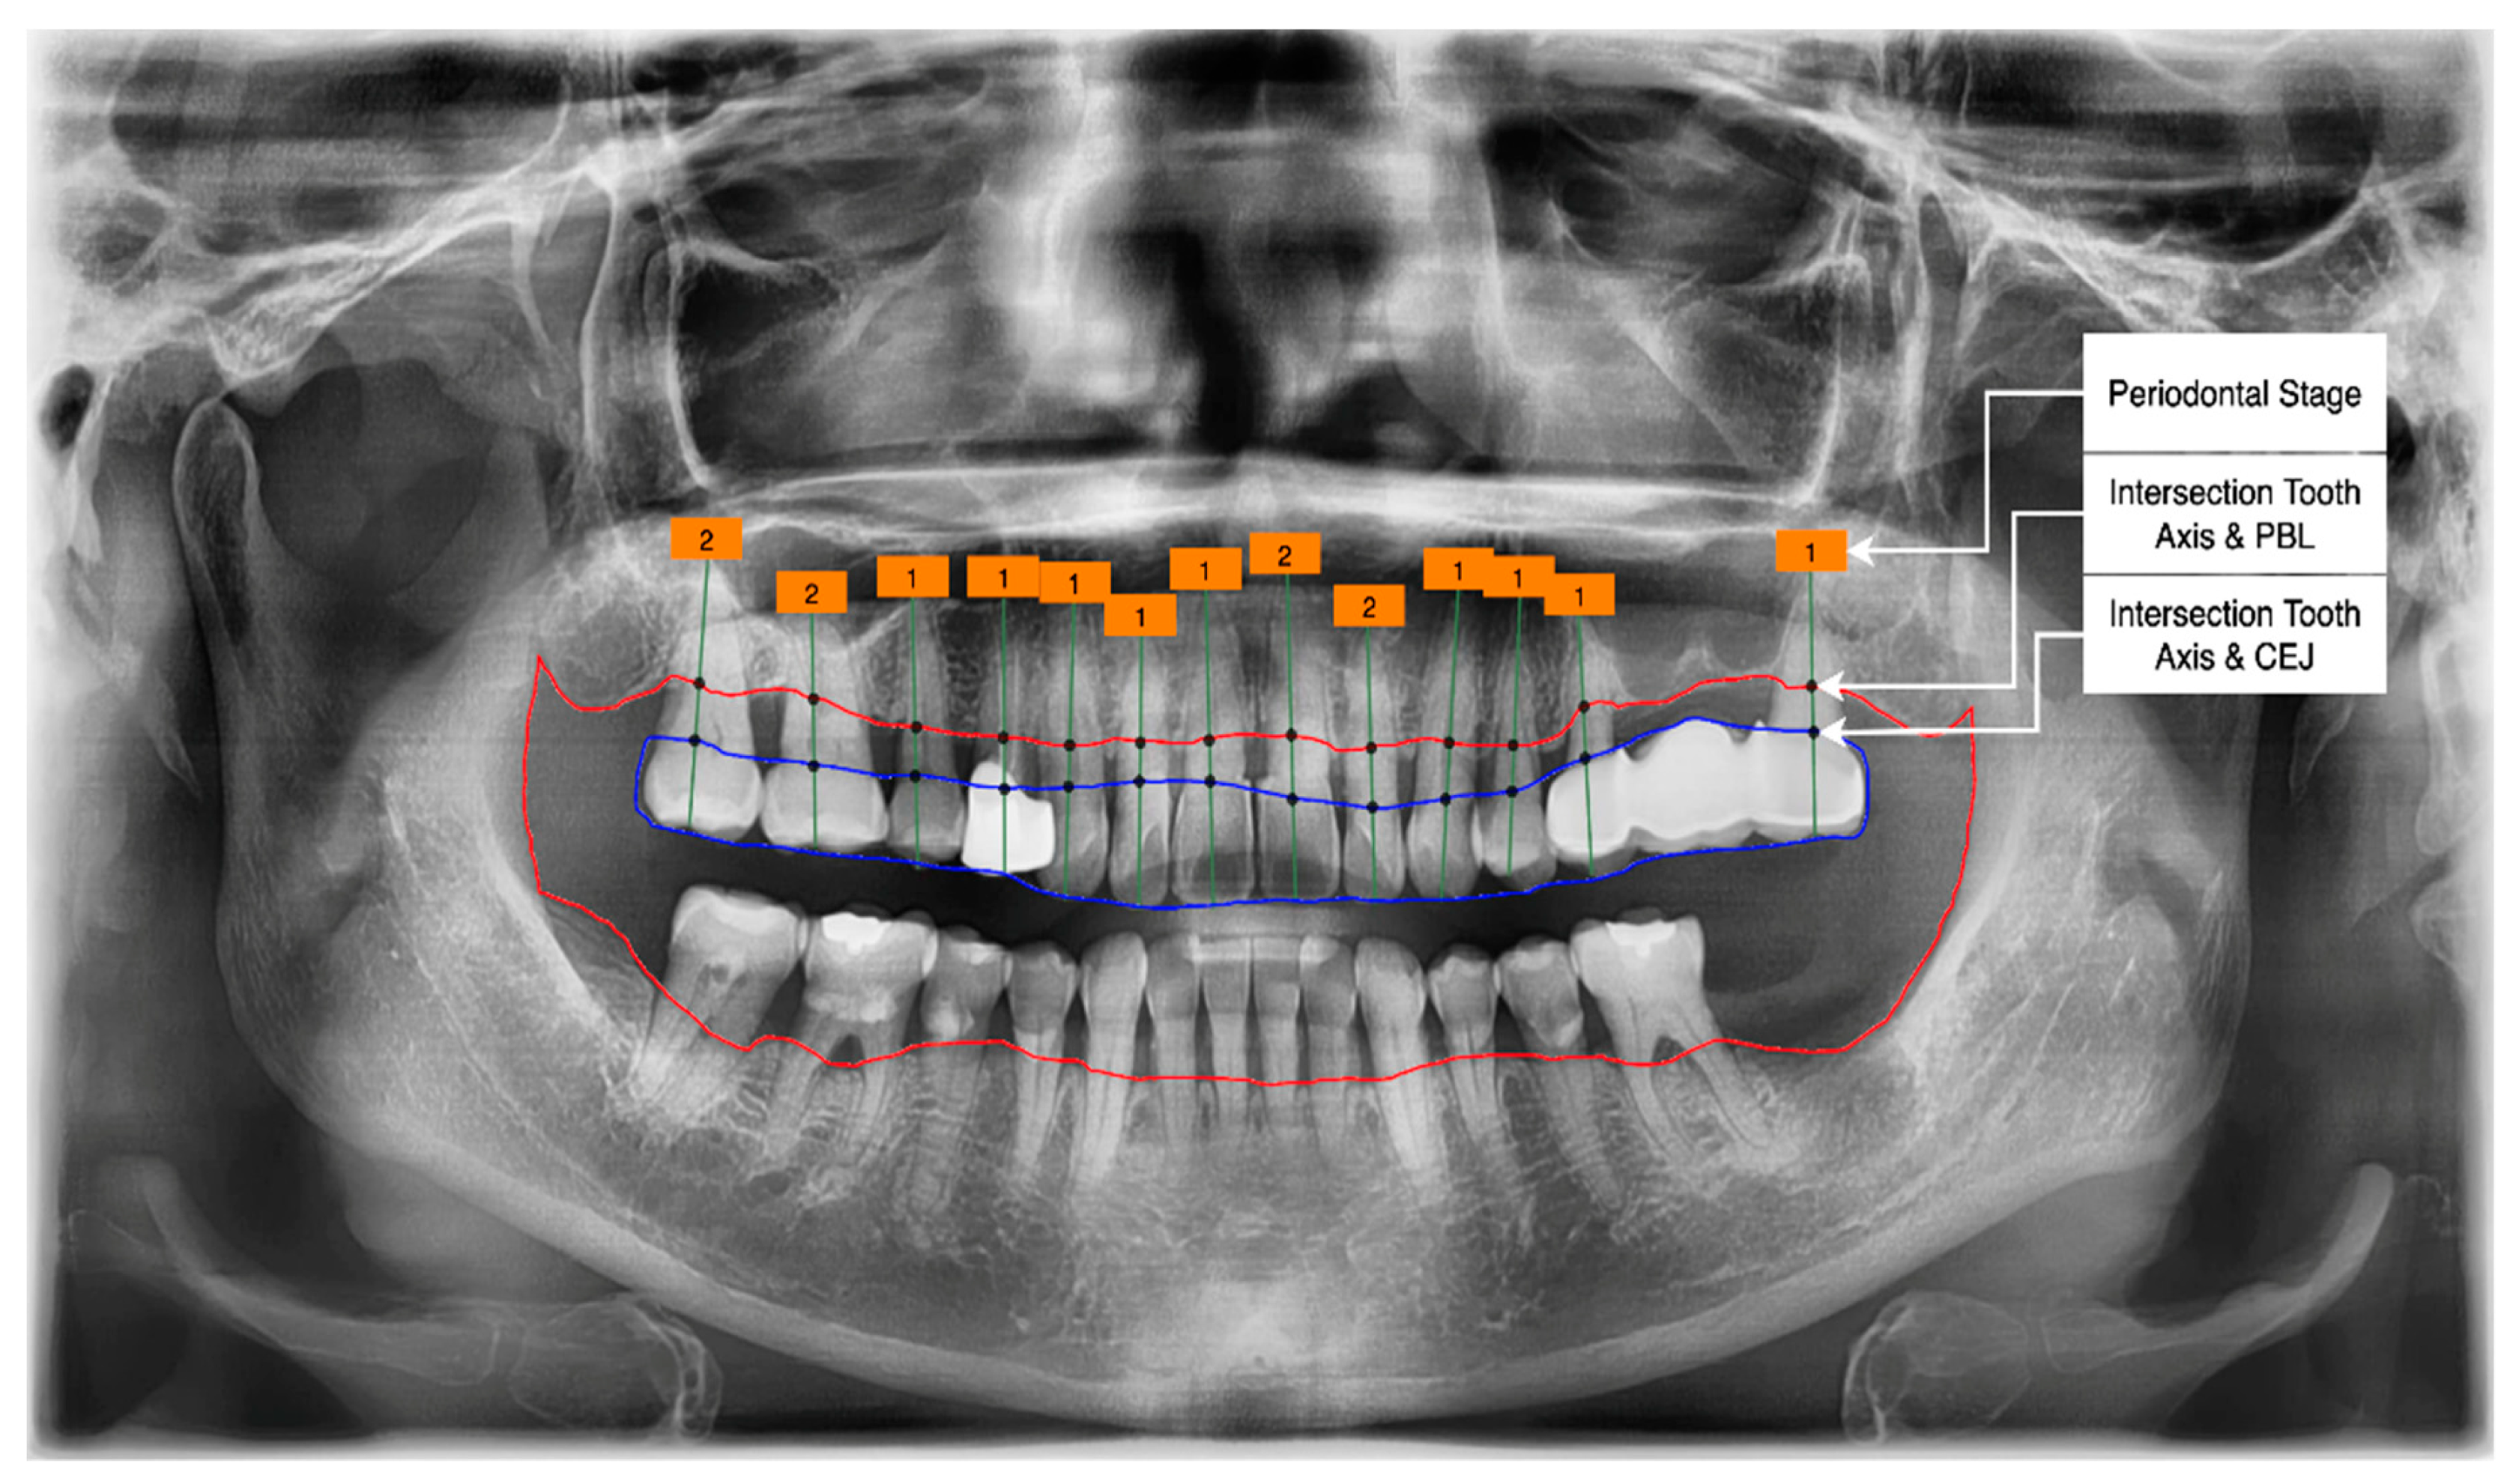
3.4. Determination of Tooth Stage through U-Net and YOLOv5 Integration

Classification of the PBL by Percentage Rate Analysis

To detect the PBL and CEJ boundaries, a model of U-Net was developed, and to detect the individual tooth number, a model of YOLOv5 was used; then, an integrated model was built. To classify the periodontitis stage, the PBL and CEJ boundaries were detected via U-Net, and the two intersections were used to calculate the lengths of the PBL and CEJ and intersections for the tooth (Figure 9 and Figure 10). The ratio of the RBL to the tooth was defined as the ratio of the PBL and CEJ intersection lengths. Based on the criteria of the 2017 World Workshop, the level of alveolar bone loss was automatically classified such that the stage of periodontitis could be identified. For periodontitis staging, an RBL of <15% indicates S1, an RBL of 15%~33% indicates S2, and an RBL of ≥33% indicates S3; S4 corresponds to cases where the sum of tooth loss and implant is ≥4 in identical conditions as S3. Using these criteria, the stage of each tooth was detected, and the result is shown in Figure 11.
The performance of the integrated deep learning model was evaluated upon comparison with the results of dental specialists. The comparative analysis applied the data of stage classification by specialists as 10 test datasets to the integrated model developed in this study based on U-Net and YOLOv5 for the identification of the stage of periodontitis. From these 10 panoramic radiographs, dental specialists extracted 140 tooth objects and evaluated them one by one before comparing them with the predictions of our framework. The distribution of the test dataset is mostly on the maxillary molar side in stage 2, and stage 1 shows the highest frequency in the rest of the test dataset. Specifically, if you look at the distribution of 140 objects in the test dataset, it is as follows. Stage 1 shows 97 objects; stage 2 has 34; stage 3 has 8; stage 4 has 1; so, the data imbalance is very severe. These issues should be addressed through additional data collection in the future. The test dataset was used to evaluate the proposed framework, and the results are presented in Table 2.
The accuracy of the integrated model was 0.928; the recall, precision, and F1-score are presented in Table 3. The result showed that the mean recall, precision, and F1-score were the highest for S1, while the higher values of precision and F1-score indicated the lower stages. In addition, the recall indicated a high level of accuracy for S1 and S4.

4. Discussion

Since the initial treatment of periodontitis is different from the treatment after it has progressed, it is important to accurately understand the progress of periodontitis. Stages can determine the progression of different periodontitis for each tooth in the same patient. Bone loss on radiographs is also fundamental in explaining the exacerbation of the disease [23]. In a recent study, periodontitis was classified based on the criteria proposed by the Periodontal Society. Manually measuring the RBL of all teeth for stage classification of periodontitis is time consuming and reduces the accuracy of the diagnosis. Therefore, an automatic method to evaluate the RBL more quickly and accurately in the panoramic image is an important part in the diagnosis of periodontitis stage. In this study, an overall framework for automatically classifying periodontitis stages in a dental panoramic image was developed according to the criteria proposed by the 2017 World Workshop. Deep learning was used to detect the PBL, CEL, and teeth in panoramic images and classify periodontitis stages. Because the PBL and CEJ are macroscopically different in the study, the degree of progression can be recognized quickly and accurately. Since it is possible to identify each tooth, it is possible to macroscopically check periodontitis that has intensified for each tooth even in the same patient. However, there is a difficulty in preprocessing the raw data. In this work, a person trained by a dentist marked the PBL and CEJ, verified it with a dentist, and used it as target data. The task of displaying the PBL and CEJ data collected through the IRB is difficult and takes much time. To solve this problem, we increased the data through data augmentation, integrated the data using the AIHub dataset, and analyzed it using deep learning technology. Automating data preprocessing tasks will be carried out through future research. In addition, it will help diagnose and treat periodontitis in the future by developing a generalized model for analyzing image data related to periodontitis and making the stage classification of periodontitis easy to use in all dental hospitals through app development.

5. Conclusions

In this study, an integrated model of the deep learning algorithms U-Net and YOLOv5 was developed for the classification of the stage of periodontitis using panoramic dental radiographs. The model was used to identify the stage of periodontitis as the PBL and CEJ boundaries were detected through the U-Net deep learning algorithm and as the tooth number and length were identified through the YOLOv5 algorithm. The model in this study was developed based on the IRB-approved data of patients with periodontitis at CBNUH and the data of an open database, AIHub. The model’s performance was evaluated, and for this, a comparative analysis was performed using the data of assessment by dental specialists. The result indicated that the integrated model had an accuracy of 0.929, suggesting a high level of performance. Based on this, the model is expected to contribute to reducing the assessment errors from dental specialists using the dental radiographs of patients with periodontitis. It is also likely that the model will allow an objective assessment of alveolar bone loss, as well as treatment and prevention based on early diagnosis and the determination of the rate of disease progression. In the future, a more systematic comparison will be performed against a greater variety of models, while a system will be established for an easy and simple application to allow common use, to assist healthcare staff and patients in real clinical settings.

Author Contributions

Conceptualization: H.S.S. and V.K.; methodology: H.S.S. and V.K.; software: V.K.; validation: H.S.S. and E.J.C.; formal analysis: H.S.S. and V.K.; investigation: H.S.S. and J.S.P.; resources: H.S.S., E.-Y.L., S.-Y.K. and W.J.; data curation: H.S.S., S.-Y.K., W.J. and J.S.P.; writing—original draft preparation: H.S.S. and K.A.K.; writing—review and editing: K.A.K. and E.J.C.; visualization: K.A.K. and T.-G.K.; supervision: E.J.C. and K.A.K.; project administration: H.S.S. and E.-Y.L.; funding acquisition: T.-G.K. and K.A.K. All authors have read and agreed to the published version of the manuscript.

Funding

This research was supported by the Basic Science Research Program through the National Research Foundation of Korea (NRF) funded by the Ministry of Education No. 2020R1I1A1A01065199 and No. 2019R1F1A1051569.

Institutional Review Board Statement

The study was conducted according to the guidelines of the Declaration of Helsinki and approved by the Institutional Review Board (or Ethics Committee) of Chungbuk National University Hospital (CBNUH 2021-11-011).

Informed Consent Statement

Informed consent was obtained from all subjects involved in the study.

Data Availability Statement

Not available.

Conflicts of Interest

The authors declare no conflict of interest.

References

  1. Jung, H.; Yang, J.; Park, H.J. Research trend of health life expectancy using oral health indicators (2010–2020). J. Korea Soc. Sch. Community Health Educ. 2021, 22, 75–91. [Google Scholar] [CrossRef]
  2. Tonetti, M.S.; Jepsen, S.; Jin, L.; Otomo-Corgel, J. Impact of the global burden of periodontal diseases on health, nutrition and wellbeing of mankind: A call for global action. J. Clin. Periodontol. 2017, 44, 456–462. [Google Scholar] [CrossRef] [PubMed]
  3. Tonetti, M.S.; Greenwell, H.; Kornman, K.S. Staging and grading of periodontitis: Framework and proposal of a new classification and case definition. J. Clin. Periodontol. 2018, 45, 149–161. [Google Scholar] [CrossRef] [PubMed]
  4. Yamashita, R.; Nishio, M.; Do, R.K.; Togashi, K. Convolutional neural networks: An overview and application in radiology. Insights Imaging 2018, 9, 611–629. [Google Scholar] [CrossRef] [PubMed]
  5. Chang, H.J. Deep learning hybrid method to automatically diagnose periodontal bone loss and stage periodontitis. Sci. Rep. 2020, 10, 7531. [Google Scholar] [CrossRef] [PubMed]
  6. Kwon, O. Automatic diagnosis for cysts and tumors of both jaws on panoramic radiographs using a deep convolution neural network. Dentomaxillofacial Radiol. 2020, 49, 20200185. [Google Scholar] [CrossRef] [PubMed]
  7. Hannun, A.Y. Cardiologist-level arrhythmia detection and classification in ambulatory electrocardiograms using a deep neural network. Nat. Med. 2019, 25, 65–69. [Google Scholar] [CrossRef] [PubMed]
  8. Ronneberger, O.; Fischer, P.; Brox, T. Dental X-ray image segmentation using a U-shaped Deep Convolutional network. In Proceedings of the 2015 IEEE International Symposium on Biomedical Imaging, Bridge, NY, USA, 16–19 April 2015; Volume 1, pp. 1–13. [Google Scholar]
  9. Miki, Y. Classification of teeth in cone-beam CT using deep convolutional neural network. Comput. Biol. Med. 2017, 80, 24–29. [Google Scholar] [CrossRef] [PubMed]
  10. Hiraiwa, T. A deep-learning artificial intelligence system for assessment of root morphology of the mandibular first molar on panoramic radiography. Dentomaxillofacial Radiol. 2019, 48, 20180218. [Google Scholar] [CrossRef] [PubMed]
  11. Murata, M. Deep-learning classification using convolutional neural network for evaluation of maxillary sinusitis on panoramic radiography. Oral Radiol. 2018, 35, 301–307. [Google Scholar] [CrossRef] [PubMed]
  12. Krois, J. Deep learning for the radiographic detection of periodontal bone loss. Sci. Rep. 2019, 9, 8495. [Google Scholar] [CrossRef] [PubMed]
  13. Kim, J. DeNTNet: Deep neural transfer network for the detection of periodontal bone loss using panoramic dental radiographs. Sci. Rep. 2019, 9, 17615. [Google Scholar] [CrossRef] [PubMed]
  14. Lee, J.H.; Kim, D.H.; Jeong, S.N.; Choi, S.H. Detection and diagnosis of dental caries using a deep learning-based convolutional neural network algorithm. J. Dent. 2018, 77, 106–111. [Google Scholar] [CrossRef] [PubMed]
  15. Yoo, J.H.; Yeon, H.G.; Shin, W.S.; Yun, J.P.; Jeong, S.H.; Lim, H.J. Deep learning-based prediction of extraction difficulty for mandibular third molars. Sci. Rep. 2021, 11, 1954. [Google Scholar] [CrossRef]
  16. Farook, T.H.; Jamayet, N.B.; Abdullah, J.Y.; Alam, M.K. Machine learning and intelligent diagnostics in dental and orofacial pain management: A systematic review. Pain Res. Manag. 2021, 2021, 6659133. [Google Scholar] [CrossRef] [PubMed]
  17. Available online: https://www.aihub.or.kr/aihubdata/data/view.do?dataSetSn=203 (accessed on 24 January 2022).
  18. Ronneberger, O.; Fischer, P.; Brox, T. U-Net: Convolutional Networks for Biomedical Image Segmentation. Available online: https://lmb.informatik.uni-freiburg.de/people/ronneber/u-net/ (accessed on 2 February 2022).
  19. Russakovsky, O.; Deng, J.; Su, H.; Krause, J.; Satheesh, S.; Ma, S.; Huang, Z.; Karpathy, A.; Khosla, A.; Bernstein, M.; et al. ImageNet large scale visual recognition challenge. Int. J. Comput. Vis. (IJCV) 2015, 115, 211–252. [Google Scholar] [CrossRef]
  20. Ren, S.; He, K.; Girshick, R.; Sun, J. Faster r-cnn: Towards real-time object detection with region proposal networks. arXiv 2015, arXiv:1506.01497. [Google Scholar] [CrossRef] [PubMed]
  21. Redmon, J.; Divvala, S.; Girshick, R.; Farhadi, A. You Only Look Once: Unified, Real-Time Object Detection. 2016. Available online: https://pjreddie.com/darknet/yolo/ (accessed on 26 January 2022).
  22. Han, J.; Kamber, M.; Pei, J. Data Mining: Concepts and Techniques, 3rd ed.; Morgan Kaufmann: Waltham, MA, USA, 2012; pp. 327–391. ISBN 978-12-391479-1. [Google Scholar]
  23. Jiang, L.; Chen, D.; Cao, Z.; Wu, F.; Zhu, H.; Zhu, F. A two-stage deep learning architecture for radiographic staging of periodontal bone loss. BMC Oral Health 2022, 22, 106. [Google Scholar] [CrossRef] [PubMed]
Figure 1. Original dataset, PBL mask, and CEJ mask.
Applsci 12 08500 g001
Figure 2. Identification of teeth through a combination of raw data and JSON label.
Applsci 12 08500 g002
Figure 3. Integrated model framework using deep learning algorithms for periodontitis stage classification.
Applsci 12 08500 g003
Figure 4. Accuracy of the PBL boundary detection model.
Applsci 12 08500 g004
Figure 5. Accuracy of the CEJ boundary detection model.
Applsci 12 08500 g005
Figure 6. Annotation conversion from JSON to YOLOv5 for AIHub and CBNUH data integration.
Applsci 12 08500 g006
Figure 7. Automatic tooth numbering using a YOLOv5 model.
Applsci 12 08500 g007
Figure 8. Tooth length detection using a YOLOv5 model.
Applsci 12 08500 g008
Figure 9. PBL and CEJ boundaries detection using U-Net models.
Applsci 12 08500 g009
Figure 10. PBL and CEJ intersection with the tooth main axis.
Applsci 12 08500 g010
Figure 11. Periodontal stage classification according to the RBL ratio using the PBL and CEJ length intersection.
Applsci 12 08500 g011
Table 1. Predictive accuracy and loss of PBL and CEJ using U-Net.
AccuracyLossValidation AccuracyValidation Loss
PBL0.98560.01320.98130.0306
CEJ0.98910.00960.98640.0213
Table 2. Summary of test dataset and framework prediction results.
StageStage Count of Test DatasetStage Count of Prediction
197101
23431
384
414
Table 3. Evaluation of the proposed framework for classifying periodontitis stages for each tooth.
StageRecall (95% CI)Precision (95% CI)F1-Score (95% CI)
11.000 (1.000–1.000)0.962 (0.948–0.975)0.979 (0.97–0.989)
20.857 (0.85–0.862)0.941 (0.924–0.957)0.897 (0.886–0.907)
30.374 (0.364–0.384)0.772 (0.753–0.79)0.504 (0.483–0.525)
41.000 (1.000–1.000)0.253 (0.241–0.265)0.404 (0.388–0.419)
Mean0.805 (0.799–0.811)0.732 (0.716–0.745)0.696 (0.681–0.709)
Publisher’s Note: MDPI stays neutral with regard to jurisdictional claims in published maps and institutional affiliations.

