Article

Electromagnetic Force Induced Structural Vibration Analysis and Experiment of Brushless Direct Current Motors for Operating Speed Range

1
Graduate School of Mechanical Design & Production Engineering, Konkuk University, 120 Neungdong-ro, Gwangjin-gu, Seoul 05029, Korea
2
Intelligent Mechatronics Research Center, Korea Electronics Technology Institute, Seongnam-si 13509, Korea
3
School of Mechanical Engineering, Konkuk University, 120 Neungdong-ro, Gwangjin-gu, Seoul 05029, Korea
*
Author to whom correspondence should be addressed.
Appl. Sci. 2022, 12(17), 8497; https://doi.org/10.3390/app12178497
Submission received: 19 July 2022 / Revised: 16 August 2022 / Accepted: 23 August 2022 / Published: 25 August 2022
(This article belongs to the Section Acoustics and Vibrations)

Abstract

:
In this study, an electromagnetic force induced structural vibration for a brushless direct current (BLDC) motor with variable speed is performed using finite element analysis, as well as an experiment for operating speed range. The 3-D entire finite element model was used to predict the vibration characteristics for the operating speed range of a BLDC motor. To validate the finite element (FE) model, the modal analysis was compared with the results of a modal test. Then, for variable speed, electromagnetic force induced vibration characteristics for the range of operating speeds are predicted using the electromagnetic-structural vibration coupled analysis method. The predicted vibration characteristics are compared and validated with vibration experiment under the same operating conditions. Finally, it was found that the vibration characteristics predicted using the 3-D entire FE model can accurately reflect the actual vibration characteristics for variable speed.

1. Introduction

There has been growing interest in new power sources to replace the existing internal combustion engine. Among them, electric motors have been widely used as an alternative power source in industry because of their high-power efficiency and better performance in terms of noise and vibration compared to the internal combustion engine. In industry, electric motors have been mainly used in large plants and robots. Recently, electric motors have also attracted attention in the field of hybrid electric vehicles (HEVs) and electric vehicles (EVs) to overcome the problem of pollutant emission.
In particular, electric motors used in the engines of EVs and HEVs operate in a wide range from low to high speeds. During the design of these electric motors, characteristics have to be evaluated not only at the rated speed but also in the entire operating speed range. The vibration of a motor can causes fatigue failure of not only the motor parts but also the system components around the motor. Since the vibration of the system is directly related to the driver’s comfort, the analysis of motor vibration characteristics over various operating speed ranges is very important in the design process of electric motors.
Electromagnetic force, which causes the rotational motion of the electric motor, is one of the excitation sources of motor vibration. The electromagnetic force, determined by the combination of the slot numbers and the pole numbers of the stator and rotor, causes vibration [1,2,3,4]. In the 1990s, motor vibration reduction design was studied by considering the dynamic characteristics of the stator core only [5,6,7,8,9]. Then, both the electromagnetic characteristics and the mechanical characteristics of the stator core were considered based on the multiphysics analysis method [10,11,12,13], which analyzes the natural frequency, mode shape, and frequency response with 2-D geometry, instead of the actual 3-D geometry. Since it is difficult to predict or calculate vibration characteristics accurately using 2-D geometry results, vibration analysis has started to use 3-D geometry of the stator core structure with an electromagnetic-structural vibration coupled analysis method [14,15,16,17,18,19,20,21].
Furthermore, in order to predict the motor vibration characteristics more accurately, the finite element (FE) model includes the housing part attached to the stator and other parts [22,23,24,25,26], but the rotor is not considered or simplified with a rigid body. This simplified FE model results in a discrepancy in the vibration characteristics, such as the natural frequency and mode shape between the FE analysis results and the test results [27].
In addition, it is very important to investigate the motor vibration characteristics for the entire operating speed range because a motor can be used for many different applications, such as EVs and HEVs with various operating ranges. However, there are insufficient studies to predict the vibration characteristics of motors in a wide range of operating speeds.
In order to predict the noise and vibration characteristics of the variable-speed permanent magnet synchronous motor (PMSM), a multiphysics model of stator core and coil was constructed to perform the vibration and noise analysis [28,29]. Further, to analyze the vibroacoustic characterization of a PMSM motor powertrain system, a 3-D entire model was constructed to perform a multiphysics analysis [30]. However, this considered only the circumference modes of the motor and not the analysis of the influence of other components that made up the 3-D entire model.
In the previous study, the influence of the rotor or other end shield components were found by using the comparison of the results between the 3-D entire model and the simplified model [27]. However, there was a limitation as only certain operating speed results could be investigated. Moreover, the natural frequencies computed by using a numerical analysis were compared with only the frequency response function curve that was measured by the impact hammer test.
In this study, an electromagnetic force induced structural vibration for brushless direct current (BLDC) motor is developed using finite element analysis as well as an experiment for the operating speed range. The 3-D entire FE model, consisting of a stator core, rotor including rotor housing and permanent magnets, stator housing, fin, coil, and other various components is introduced to increase the accuracy of the analysis. Modal analysis is performed, and the results are validated using the modal test results of an actual motor. To predict the electromagnetic force induced vibration characteristics over a wide range of operating speeds for the BLDC motor, an electromagnetic-structural vibration coupled analysis is performed using Altair Optistruct and FLUX. The results are validated via comparison with a vibration experiment conducted under the same conditions. Finally, the advantages and contributions of the proposed analysis method over the entire operating variable speed are discussed.

2. Modal Analysis and Test of BLDC Motors Considering all Motor Components

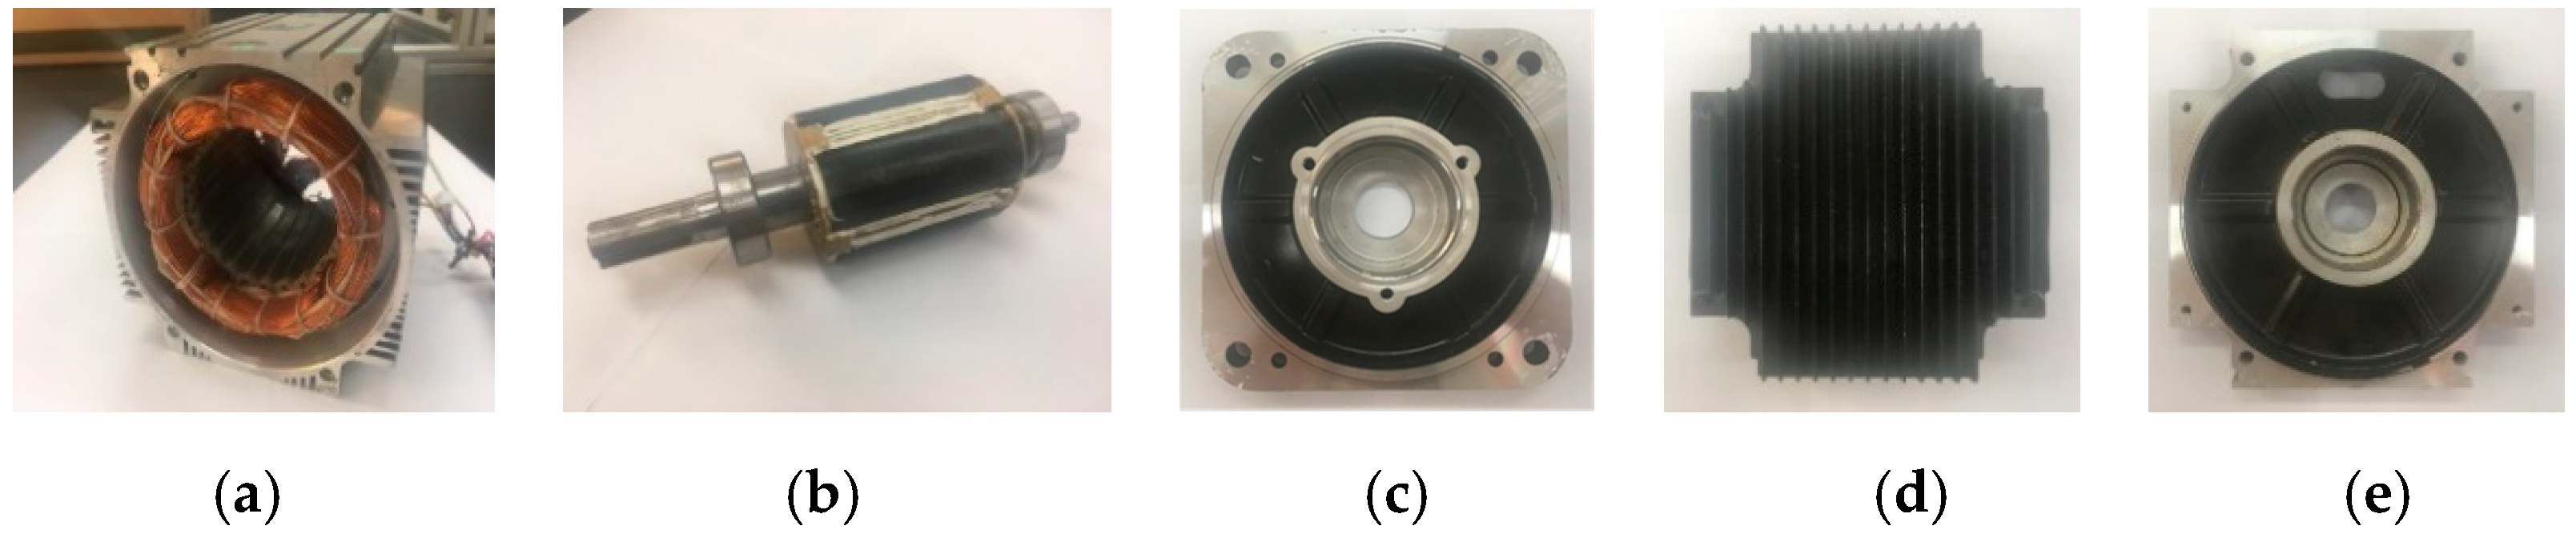
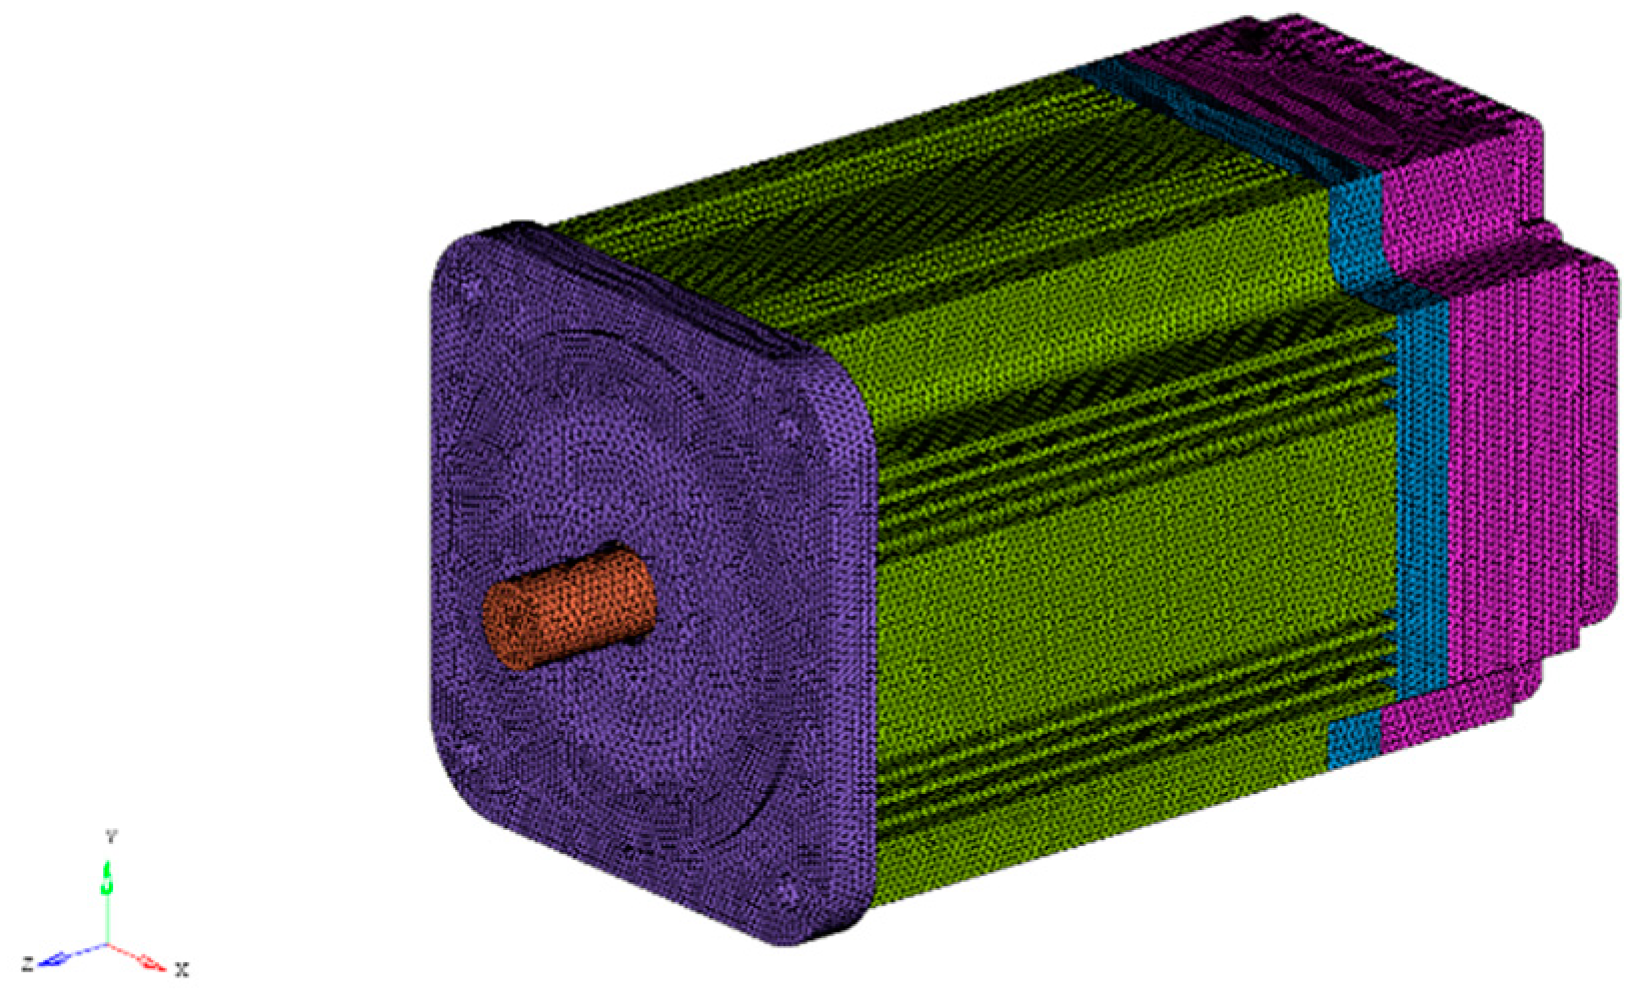
2.1. 3-D Entire Finite Element Model of BLDC Motors

In this study, a 3-phase BLDC motor with 4 poles and 24 slots is used as shown in Figure 1. The detailed model of the BLDC motor is shown in Table 1 and in Figure 2.
Based on the 3-D entire geometry of the BLDC motor, a 3-D entire FE model of the BLDC motor is constructed as shown in Figure 3 to perform the normal mode analysis and the electromagnetic-structural vibration coupled analysis. The 3-D entire FE model consisted of a 4-node tetrahedral solid element, and the number of elements is 1,060,151. Since the fixed connection between the motor components does not have a significant influence on the normal mode, the connection of each component of the FE model is made by node sharing. The material of the end shields, fin, rotor shield, and the housing are cast aluminum. The material of the stator and rotor is electrical steel. The shaft and the coil are structural carbon steel and copper, respectively.

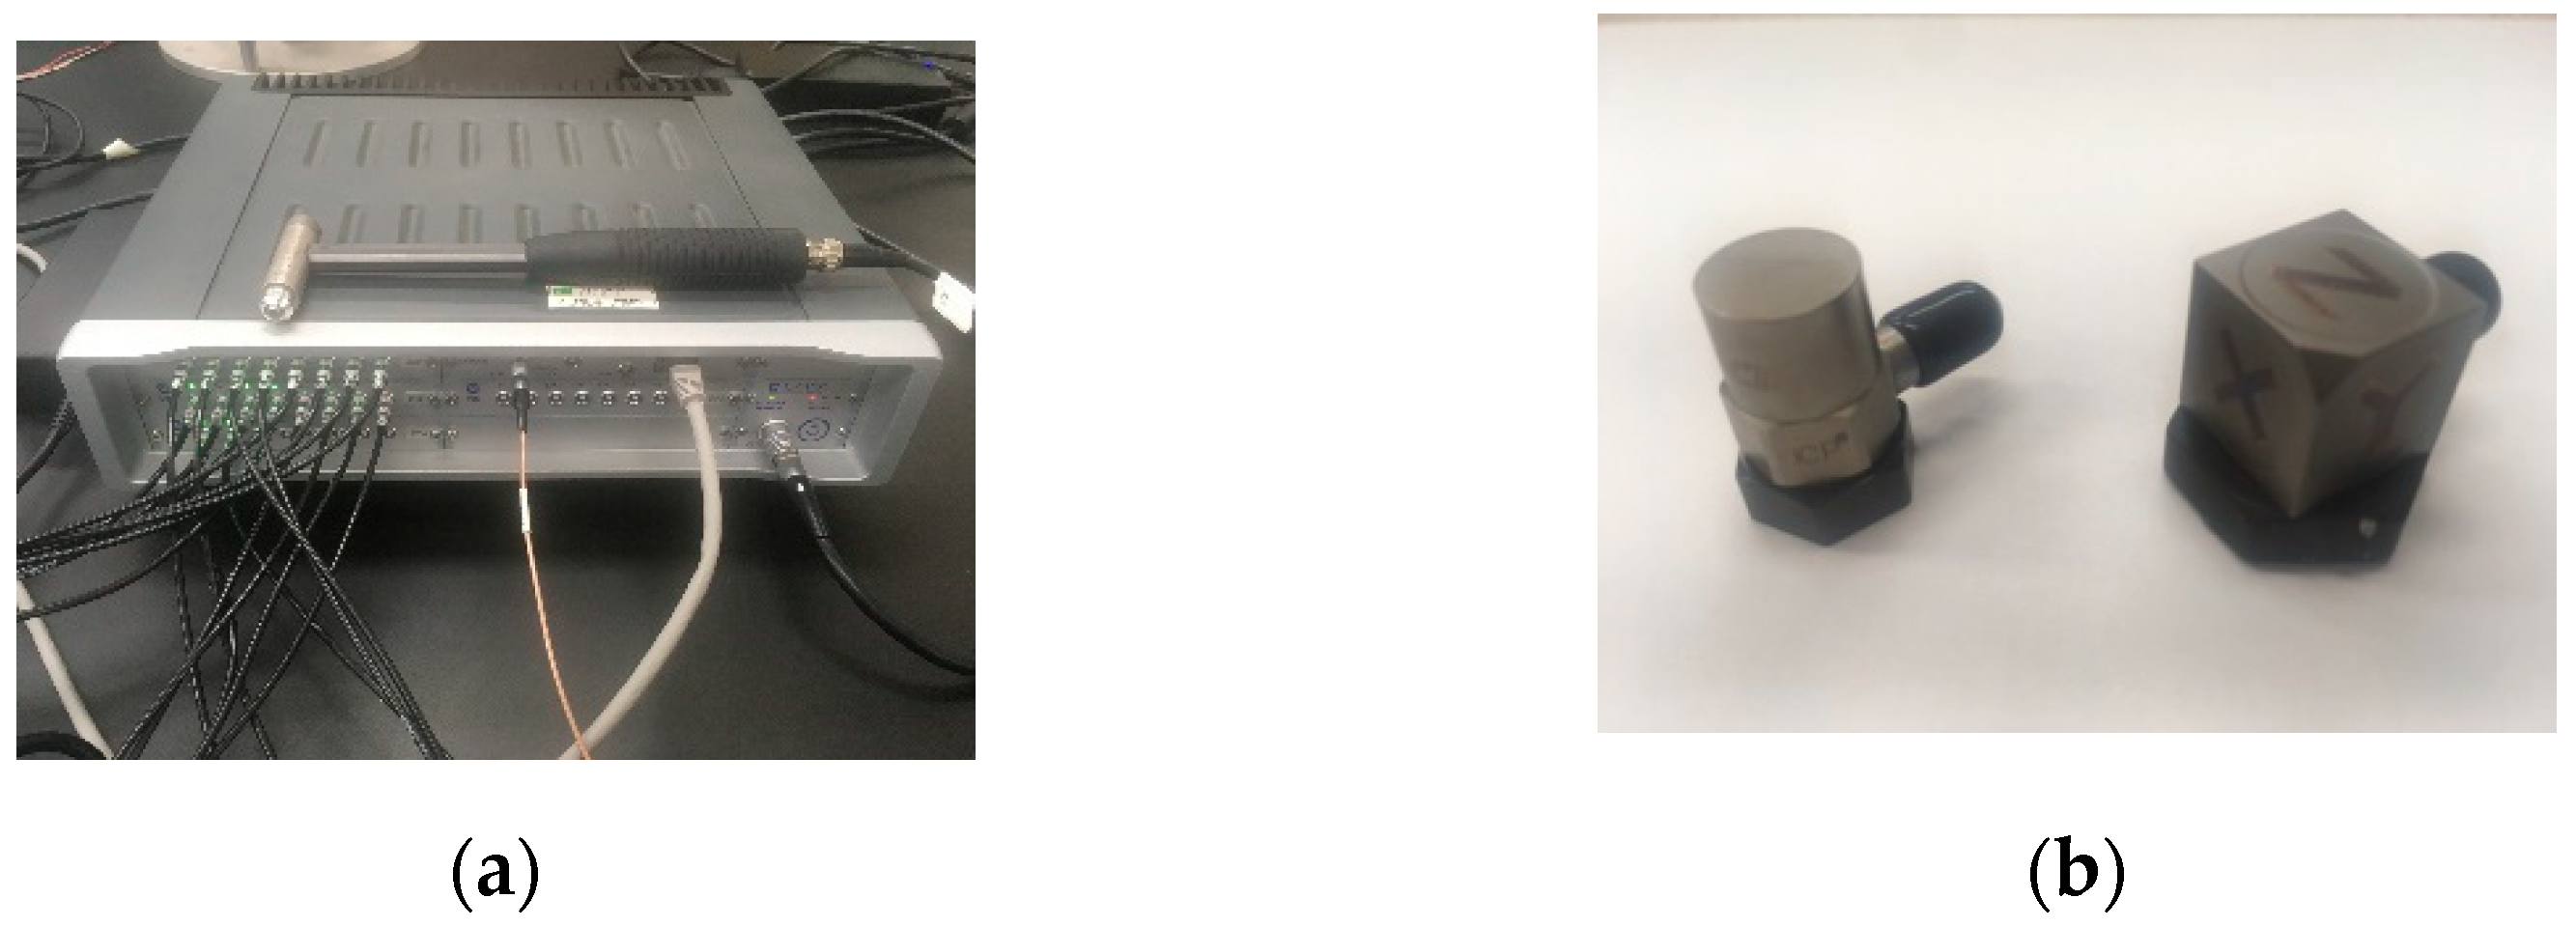
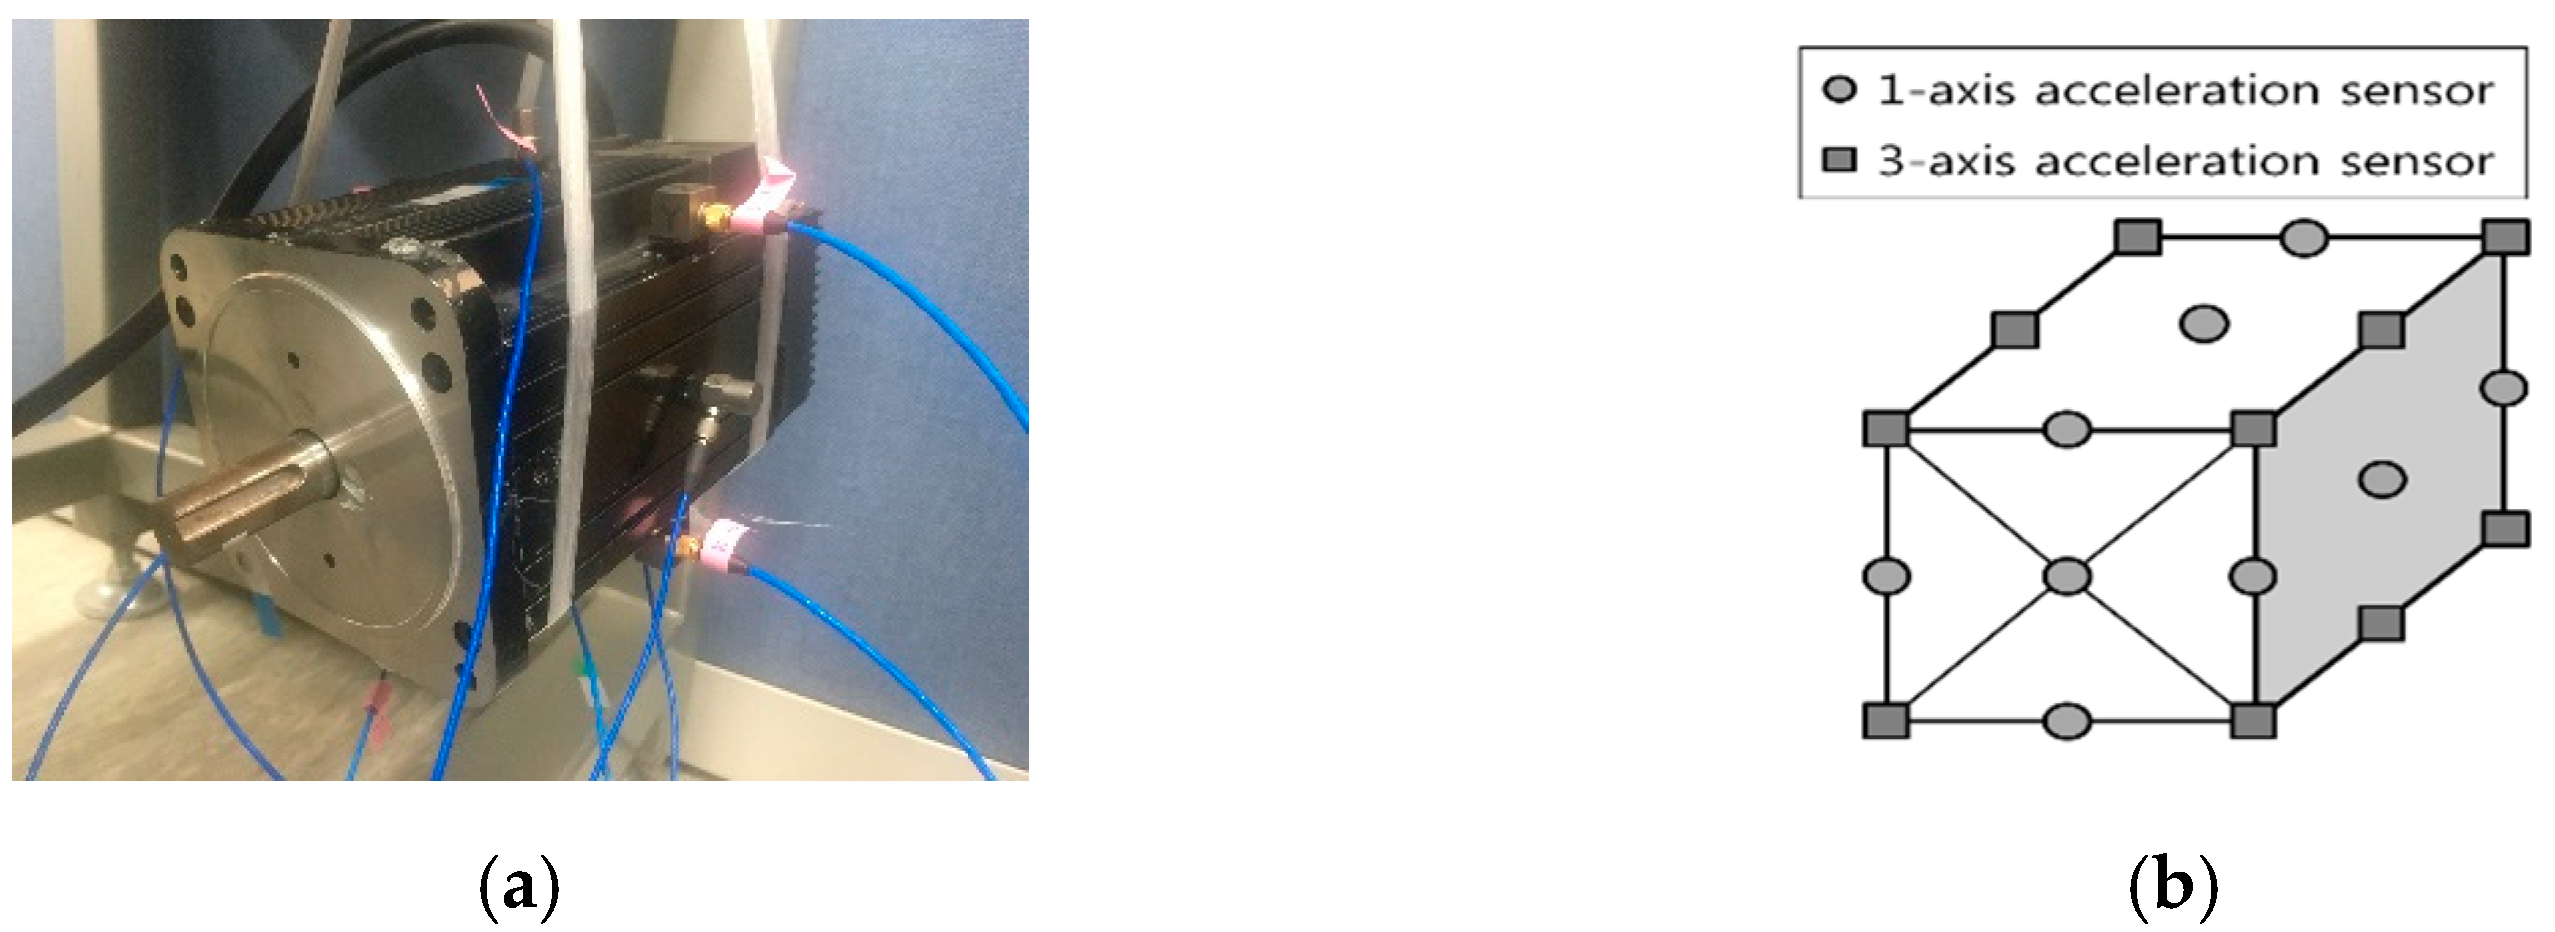
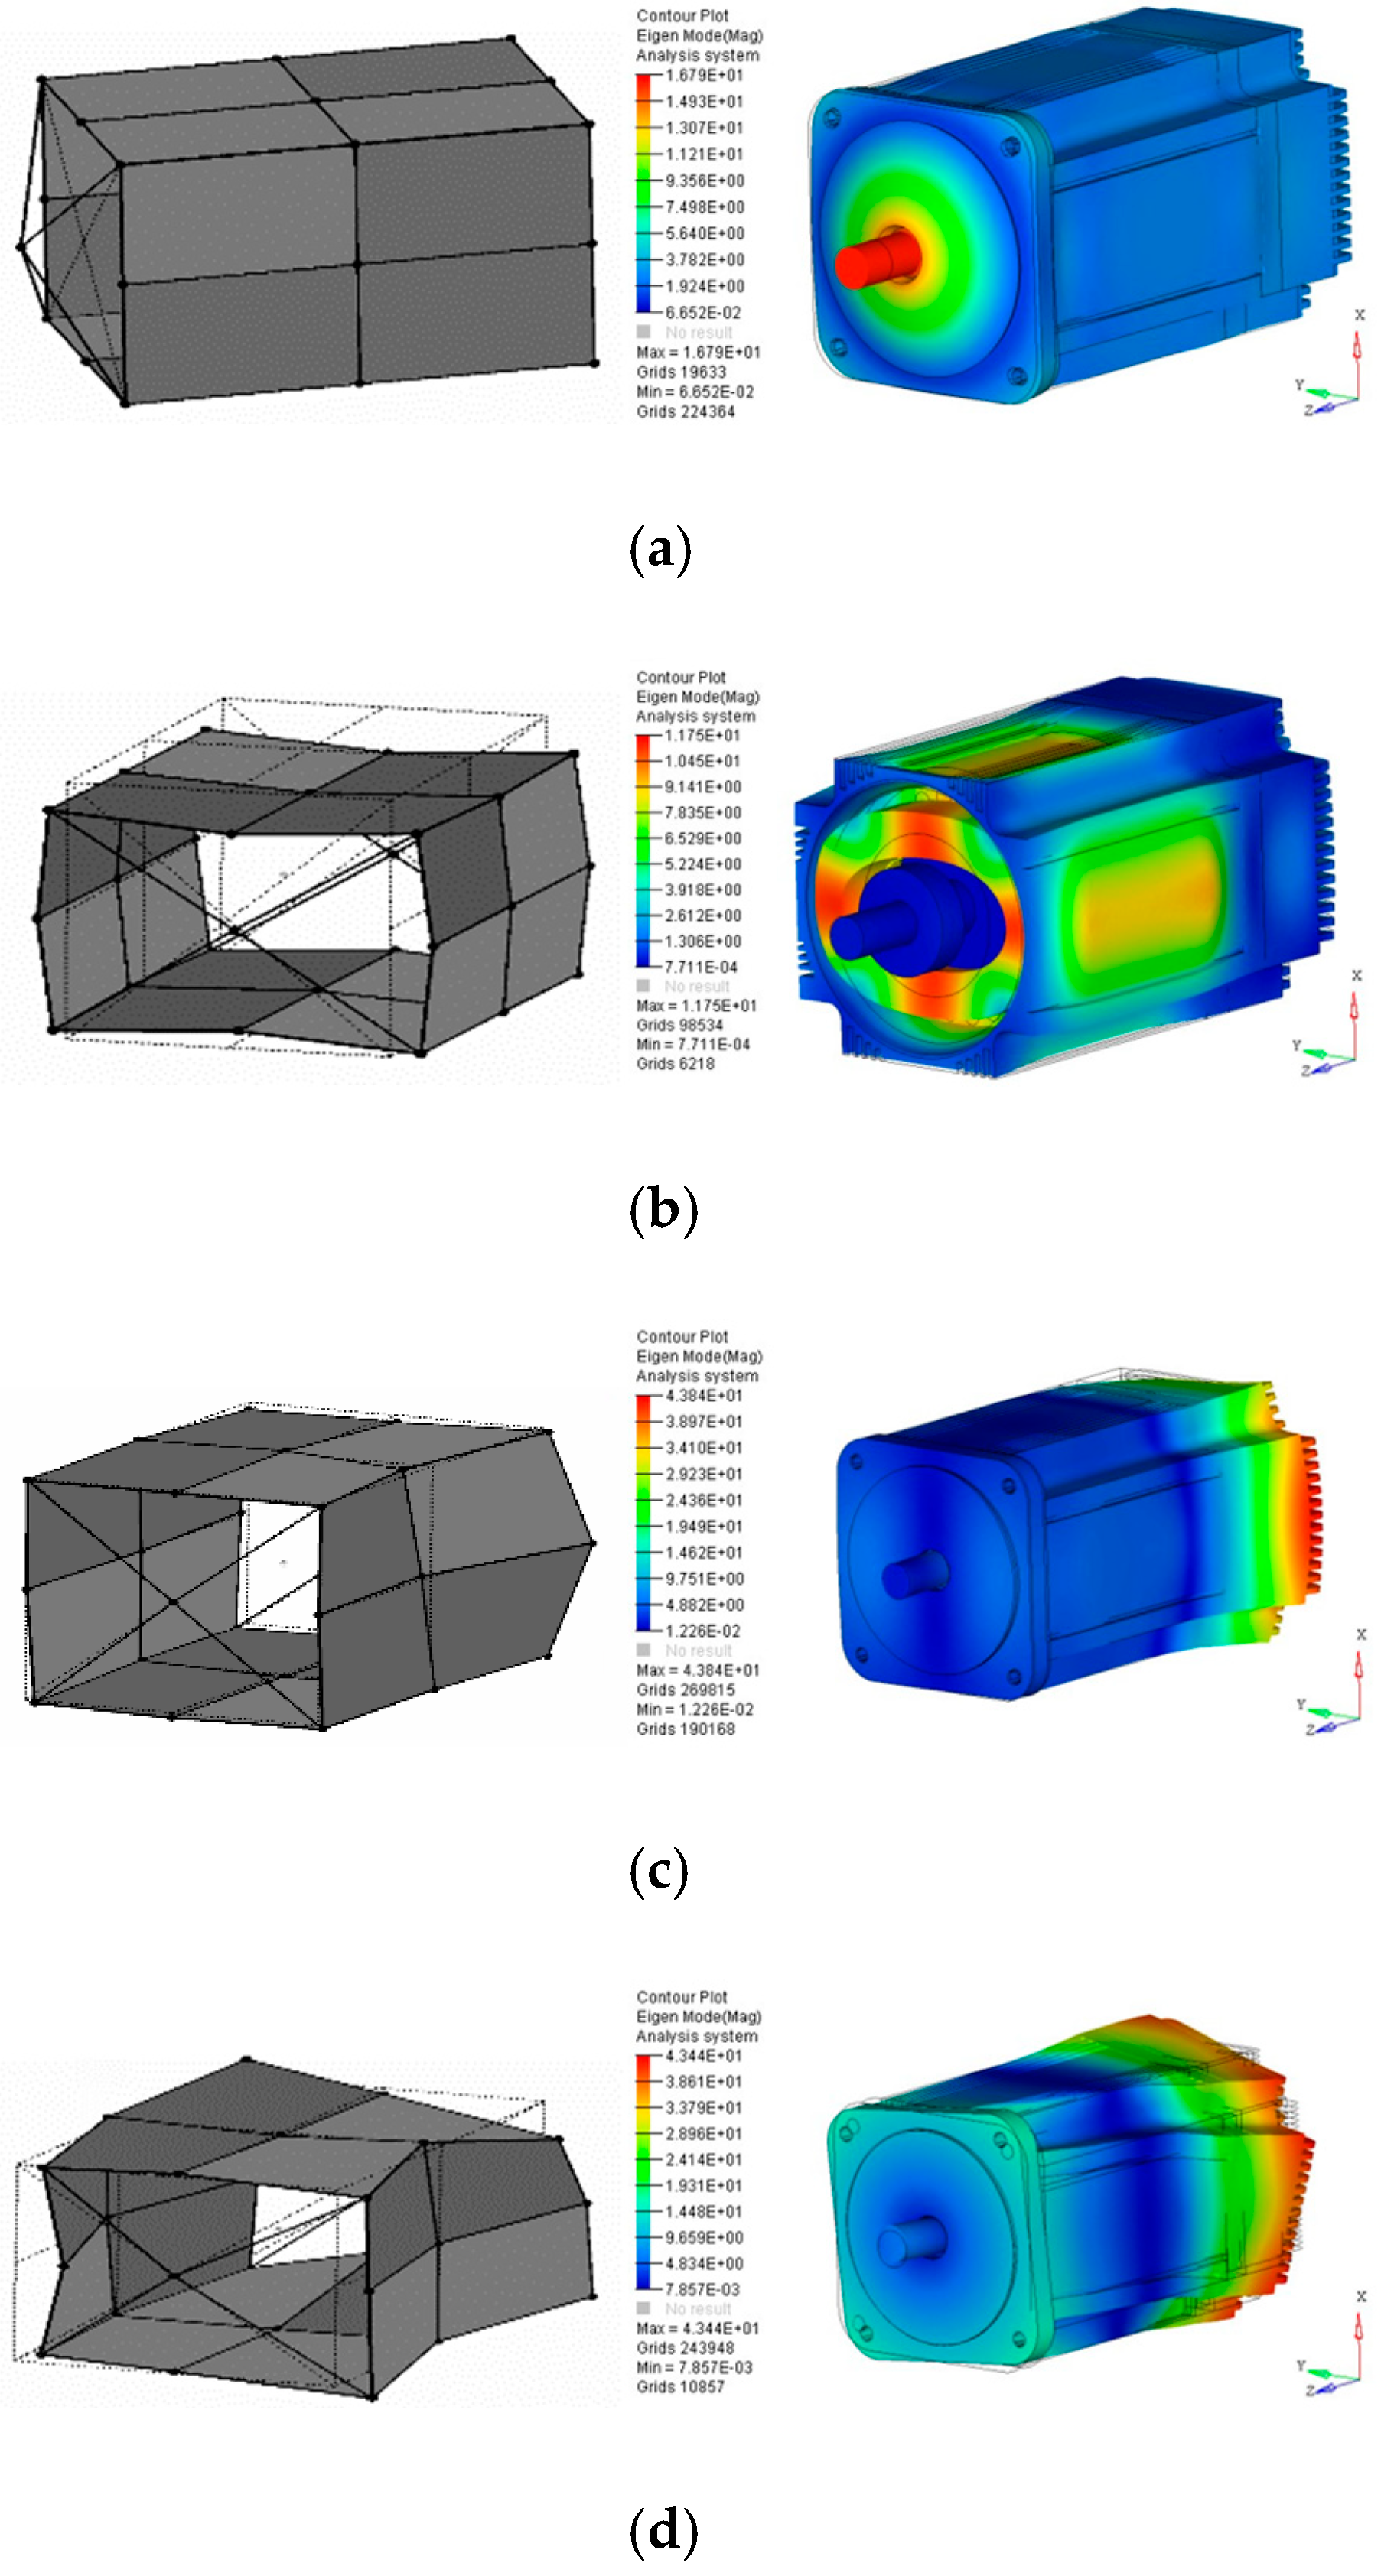
2.2. Normal Mode Analysis and Test

To validate the 3-D entire FE model, a normal mode analysis and modal test are performed. As shown in Figure 4, a digital acquisition (DAQ) system, an impact hammer, 1-axis and 3-axis accelerometers, and a fast Fourier transformation (FFT) analyzer is used in the modal test. The specifications of the test instruments are listed in Table 2. Conservatively considering the bandwidths of all instruments, the bandwidth of measurement is set to 3500 Hz. To measure the mode shape and natural frequency, impulse signals are given at 26 points on the surface, and the acceleration is measured as shown in Figure 5a. Figure 5b shows the type of accelerometer attached to the surface. To validate the 3-D entire FE model, the isotropic material properties are modified to obtain a correlation with the test results.
The results of the modal test and FE analysis are listed in Table 3. The relative error is less than 3% for four natural frequencies within the bandwidth, which indicates that the FE analysis results are very accurate. Figure 6 shows the test and FE analysis results of the mode shape occurring at natural frequencies. The mode shapes computed by FE analysis are very similar to the test results. The second mode shape is due to wave-shaped deflections known as the circumference mode of the stator. This type of mode shape is able to be calculated using 2-D FE analysis.
However, it can be seen that the first-order mode shape is the bending mode of the front housing generated by the rigid body mode of the rotor. In addition, the third-and fourth-order mode shapes are bending and torsion modes of the entire structure. These mode shapes can only be computed by using a 3-D entire FE model, not a 2-D or simplified FE model or an analytical model.

3. Vibration Analysis and Experiment at Operating Speed Range

To calculate the acceleration response induced by the electromagnetic force of the BLDC motor, an electromagnetic-structural vibration coupled analysis is conducted. This method is one of the methods used for analyzing the effect of the electromagnetic force on the structure. It is a one-way coupling between the electromagnetic domain and the structural domain. Over the operating speed range, the distribution of the magnetic field density of the motor air gap is computed using 2-D electromagnetic FE analysis. The calculated magnetic flux density is converted to the force on the surface of the stator teeth by using the Maxwell stress tensor theory. Modal transient analysis is performed by applying the transformed force to the 3-D entire FE model validated previously. To analyze the results on the frequency domain, the results are transformed through FFT. The results in the frequency domain are compared with the frequency response results of the experiment. The vibration characteristics of the BLDC motor are evaluated over the operating speed range by using the analysis results. Figure 7 shows the procedure for predicting the electromagnetic force induced vibration characteristics of the variable-speed BLDC motor.
The effect of PWM frequency is ignored in this study because, in general, PWM frequency is a band of high frequency. Therefore, only the fundamental frequency is considered for sine input current.

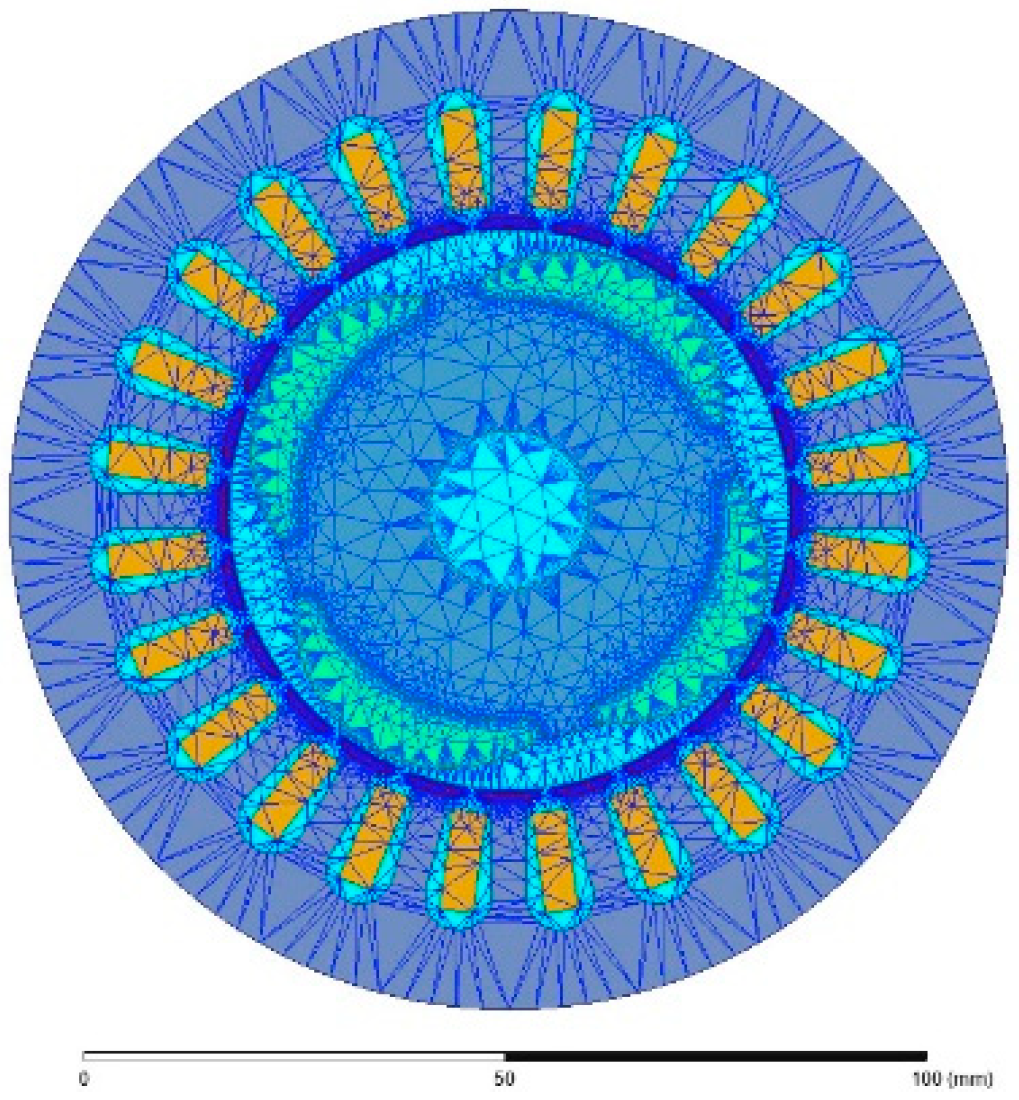
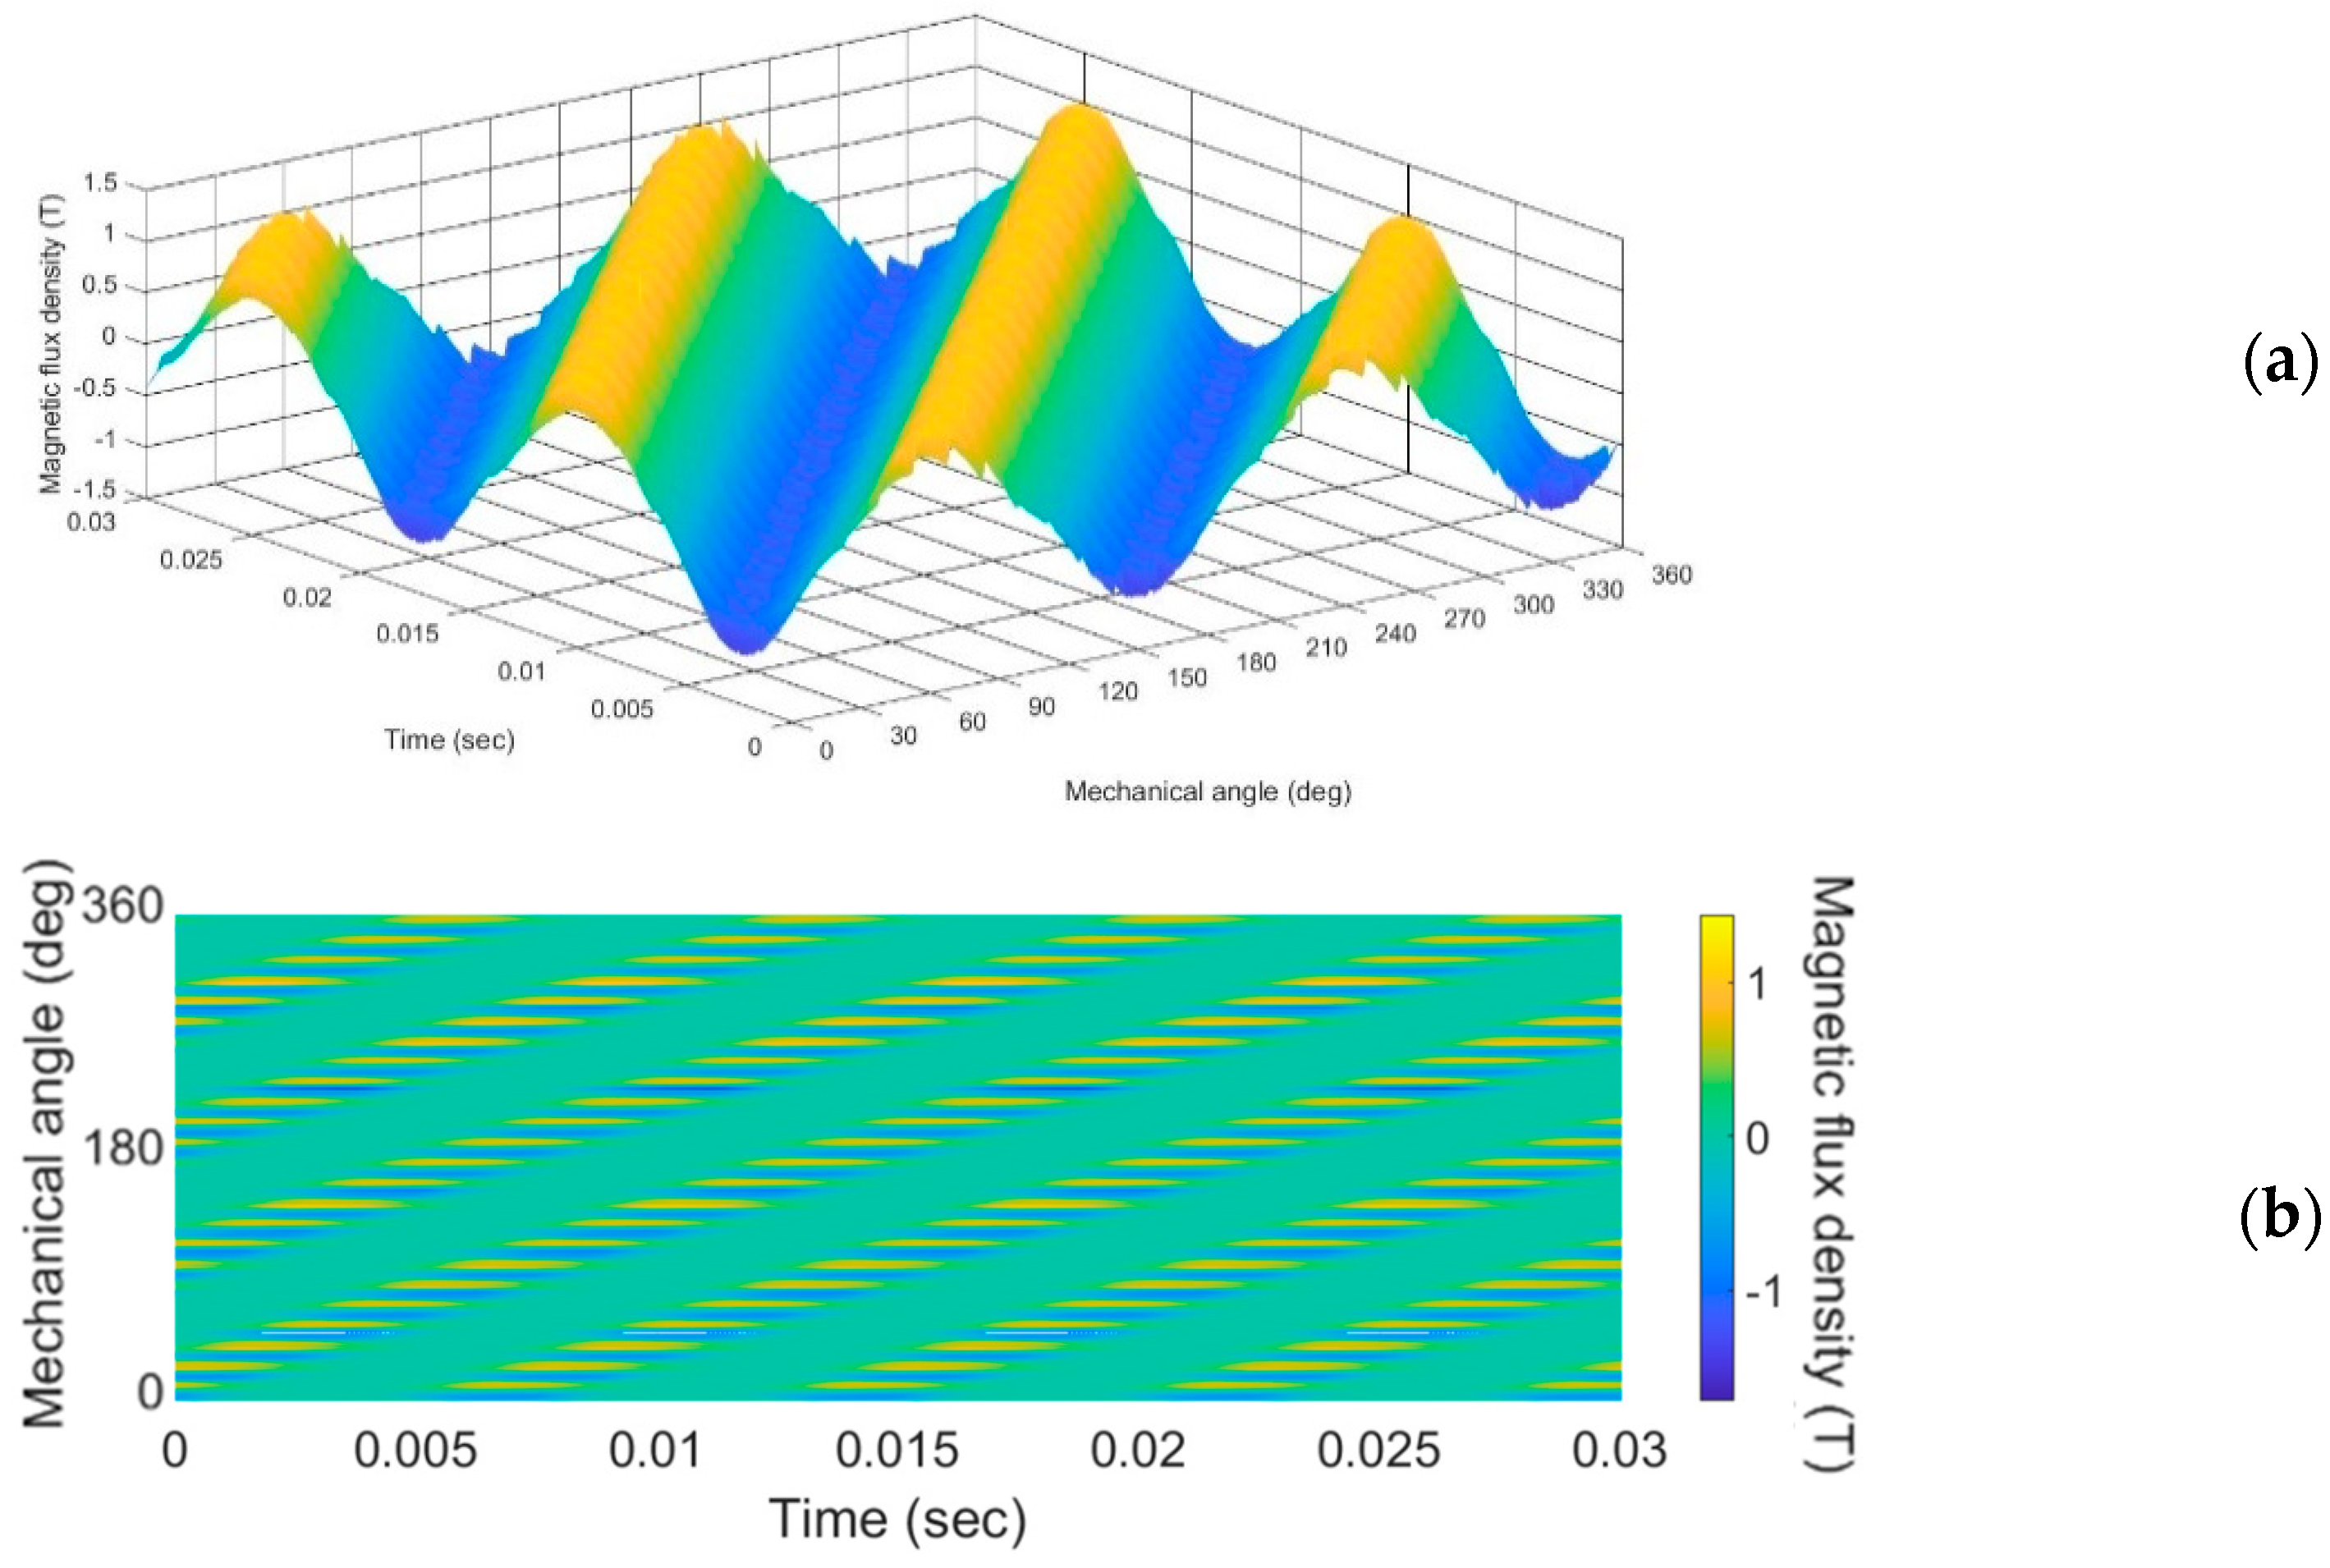
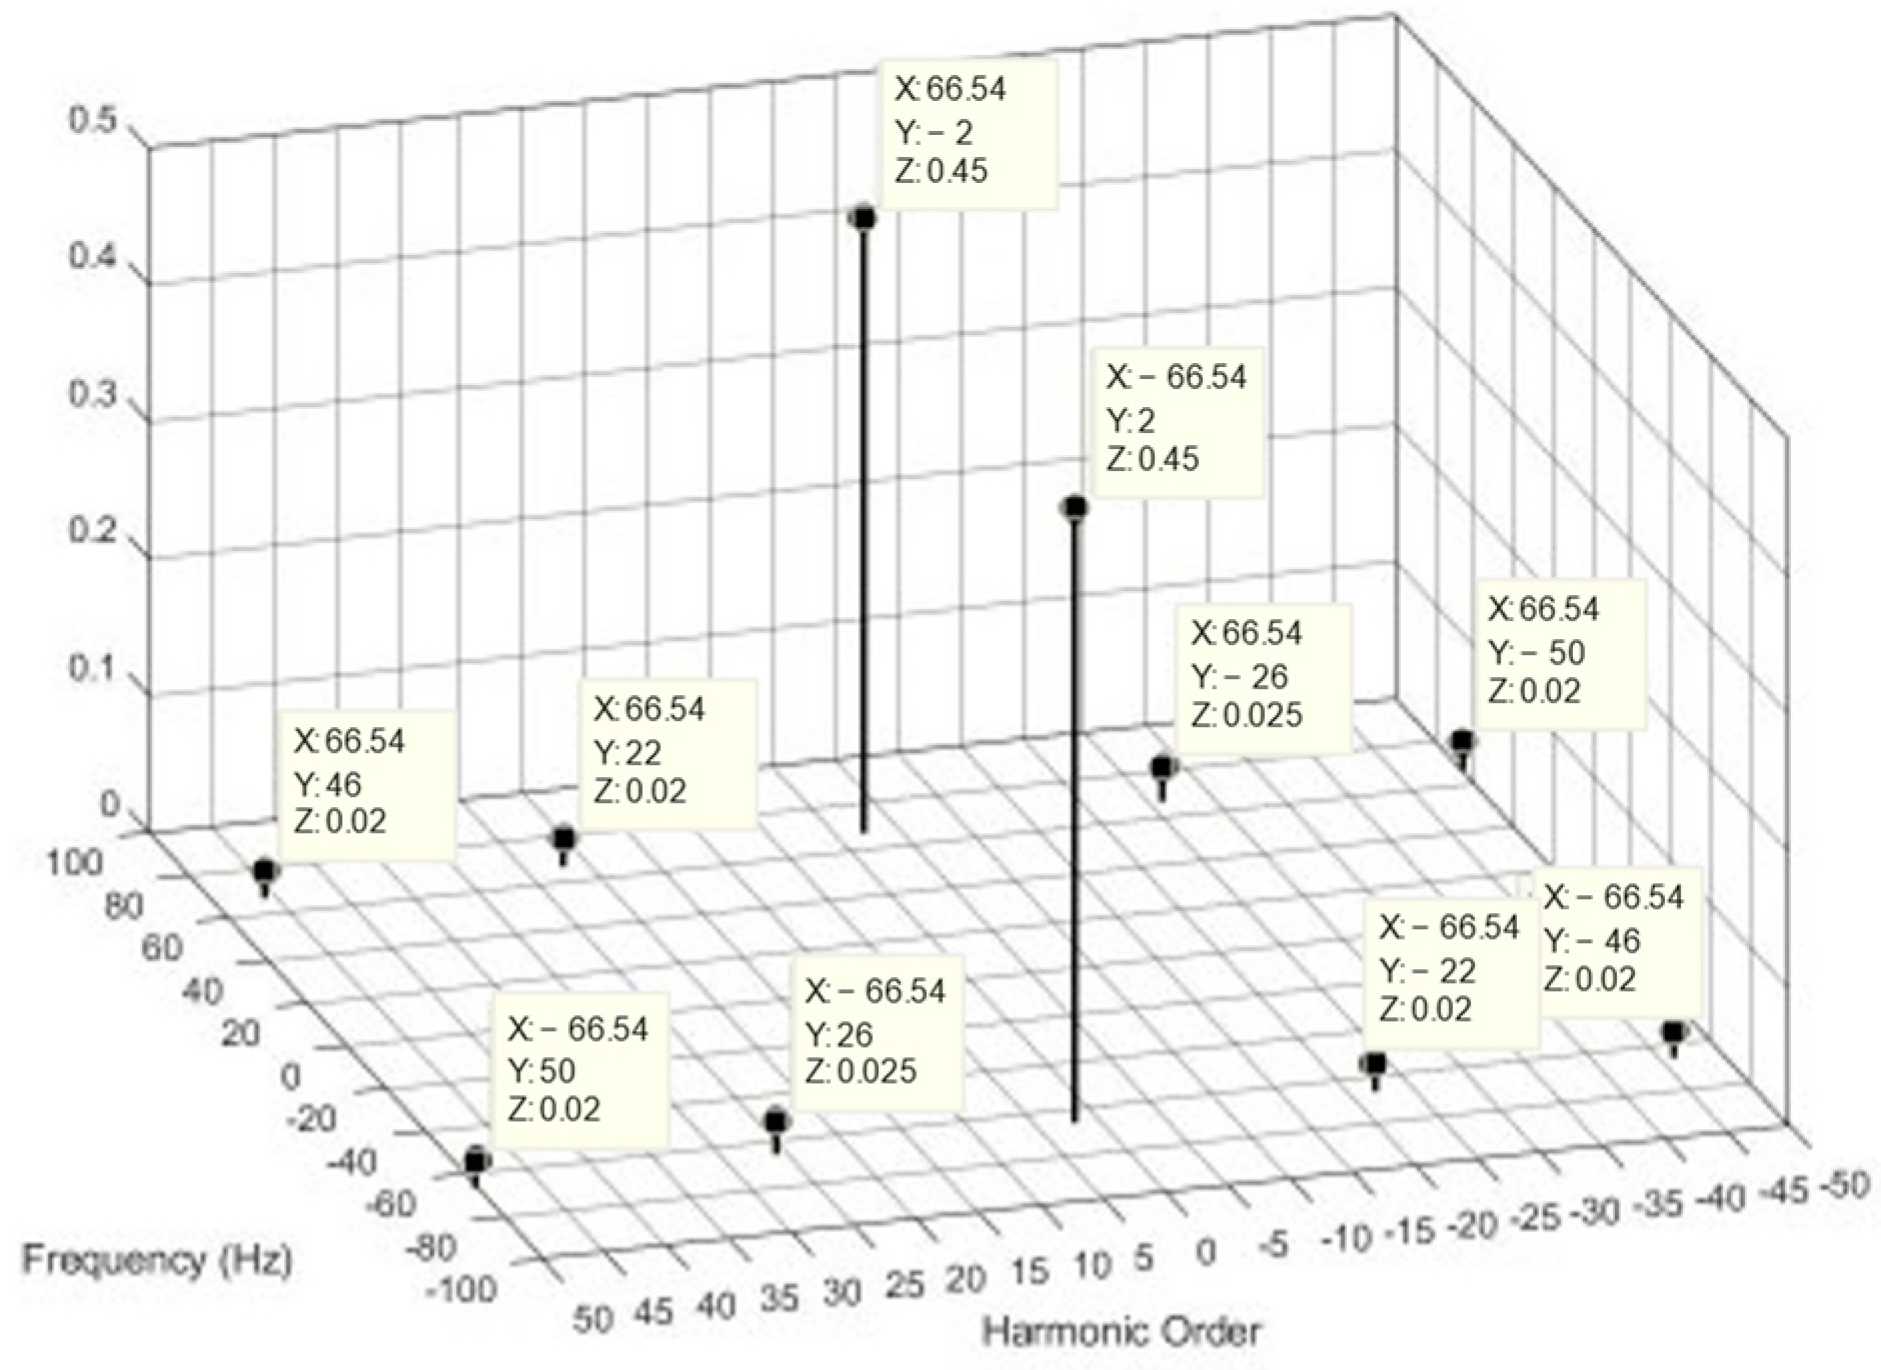
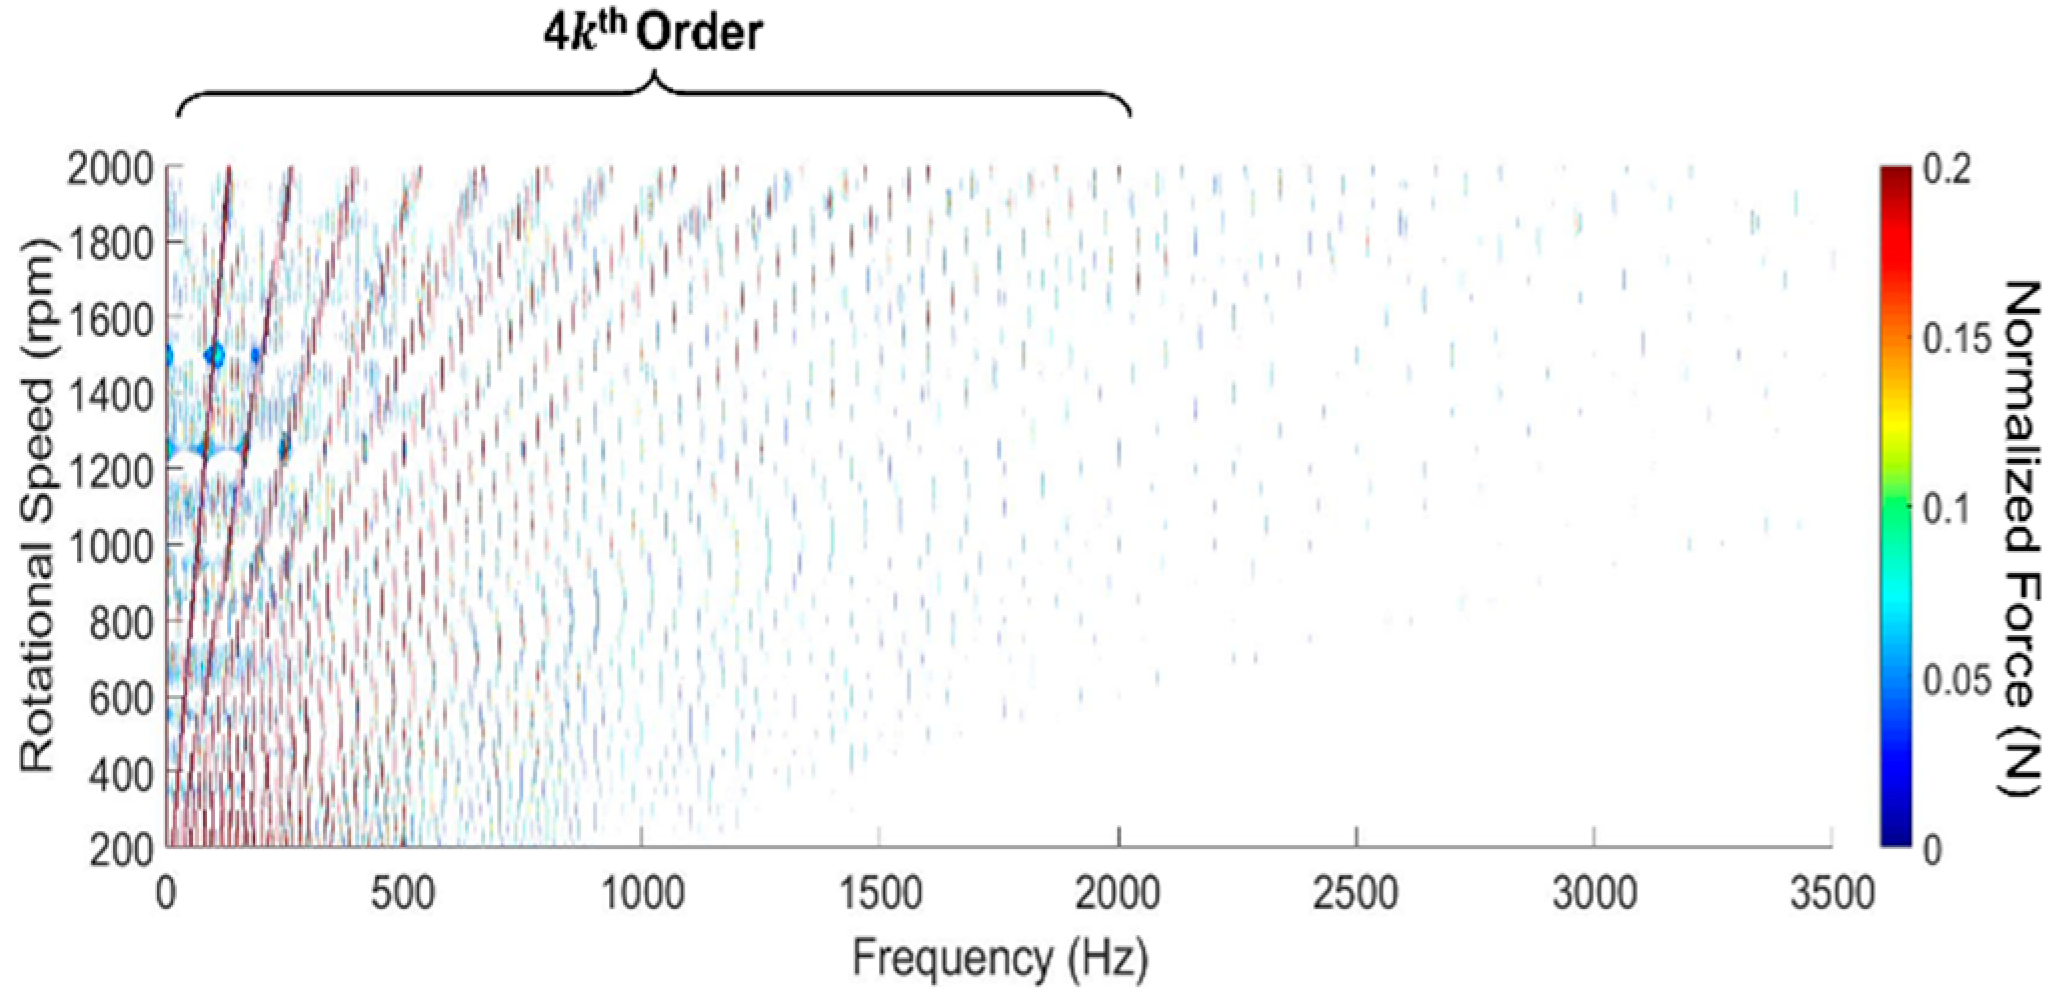
3.1. Electromagnetic Force Analysis for Operating Speed Range

The electromagnetic force, one of the sources of motor vibration, is calculated using the radial magnetic flux density of the air gap and the Maxwell stress tensor theory, as expressed in Equations (1)–(4) [28]. Previous studies have shown that the tangential electromagnetic force can be neglected because it is negligible compared to the radial electromagnetic force [31].
b ( α , t ) = b 1 ( α , t ) + b 2 ( α , t ) ,
b 1 ( α , t ) = ν = 1 B m ν cos ( ν p α ω t ) ,
b 2 ( α , t ) = μ = 1 B m μ cos ( μ p α ω t ) ,
p r ( α , t ) = 1 2 μ 0 [ b 2 ( α , t ) b t 2 ( α , t ) ] b 2 ( α , t ) 2 μ 0 ,
where b 1 is the magnetic flux density wave form of the stator, b 2 is the magnetic flux density wave form of the rotor, α is the electrical angle, and t is the time. Furthermore, B m ν and B m μ are the magnitude of the magnetic flux density of the stator and rotor for the stator space harmonic ν and rotor space harmonic μ , respectively. ω is the angular frequency, p r is the radial magnetic force per unit area at any point of the air gap, and μ 0 is the magnetic permeability of free space.
In this section, a 2-D electromagnetic field FE analysis is performed to calculate the electromagnetic force at an operating speed range of 200 to 2000 rpm. As shown in Figure 8, a 2-D FE model is constructed using 25,360 s-order 6-node triangular elements. A transient analysis is performed with a time step of 7.8 × 10 5 s for 0.64 s, because of the need to consider the subsequent structural analysis and vibration experiment. These analysis conditions are able to represent a bandwidth of 5120 Hz and the frequency resolution of 1.56 Hz when performing FFT to analyze the electromagnetic force in the frequency domain.
Figure 9. shows the distribution of magnetic flux density on air gap according to time at a constant speed of 2000 rpm. As shown in Figure 10, the distribution of magnetic flux density of the 4-pole permanent magnet motors mainly rotate to the shape of second spatial order, which is the fundamental spatial order, with a current frequency of 66.6 Hz. Furthermore, by using a waterfall graph analyzing the electromagnetic force applied on a tooth in the operating speed range as shown in Figure 11, it is possible to confirm the electromagnetic force component consisting of time frequencies that are four times larger than the mechanical rotation frequency occurrence.

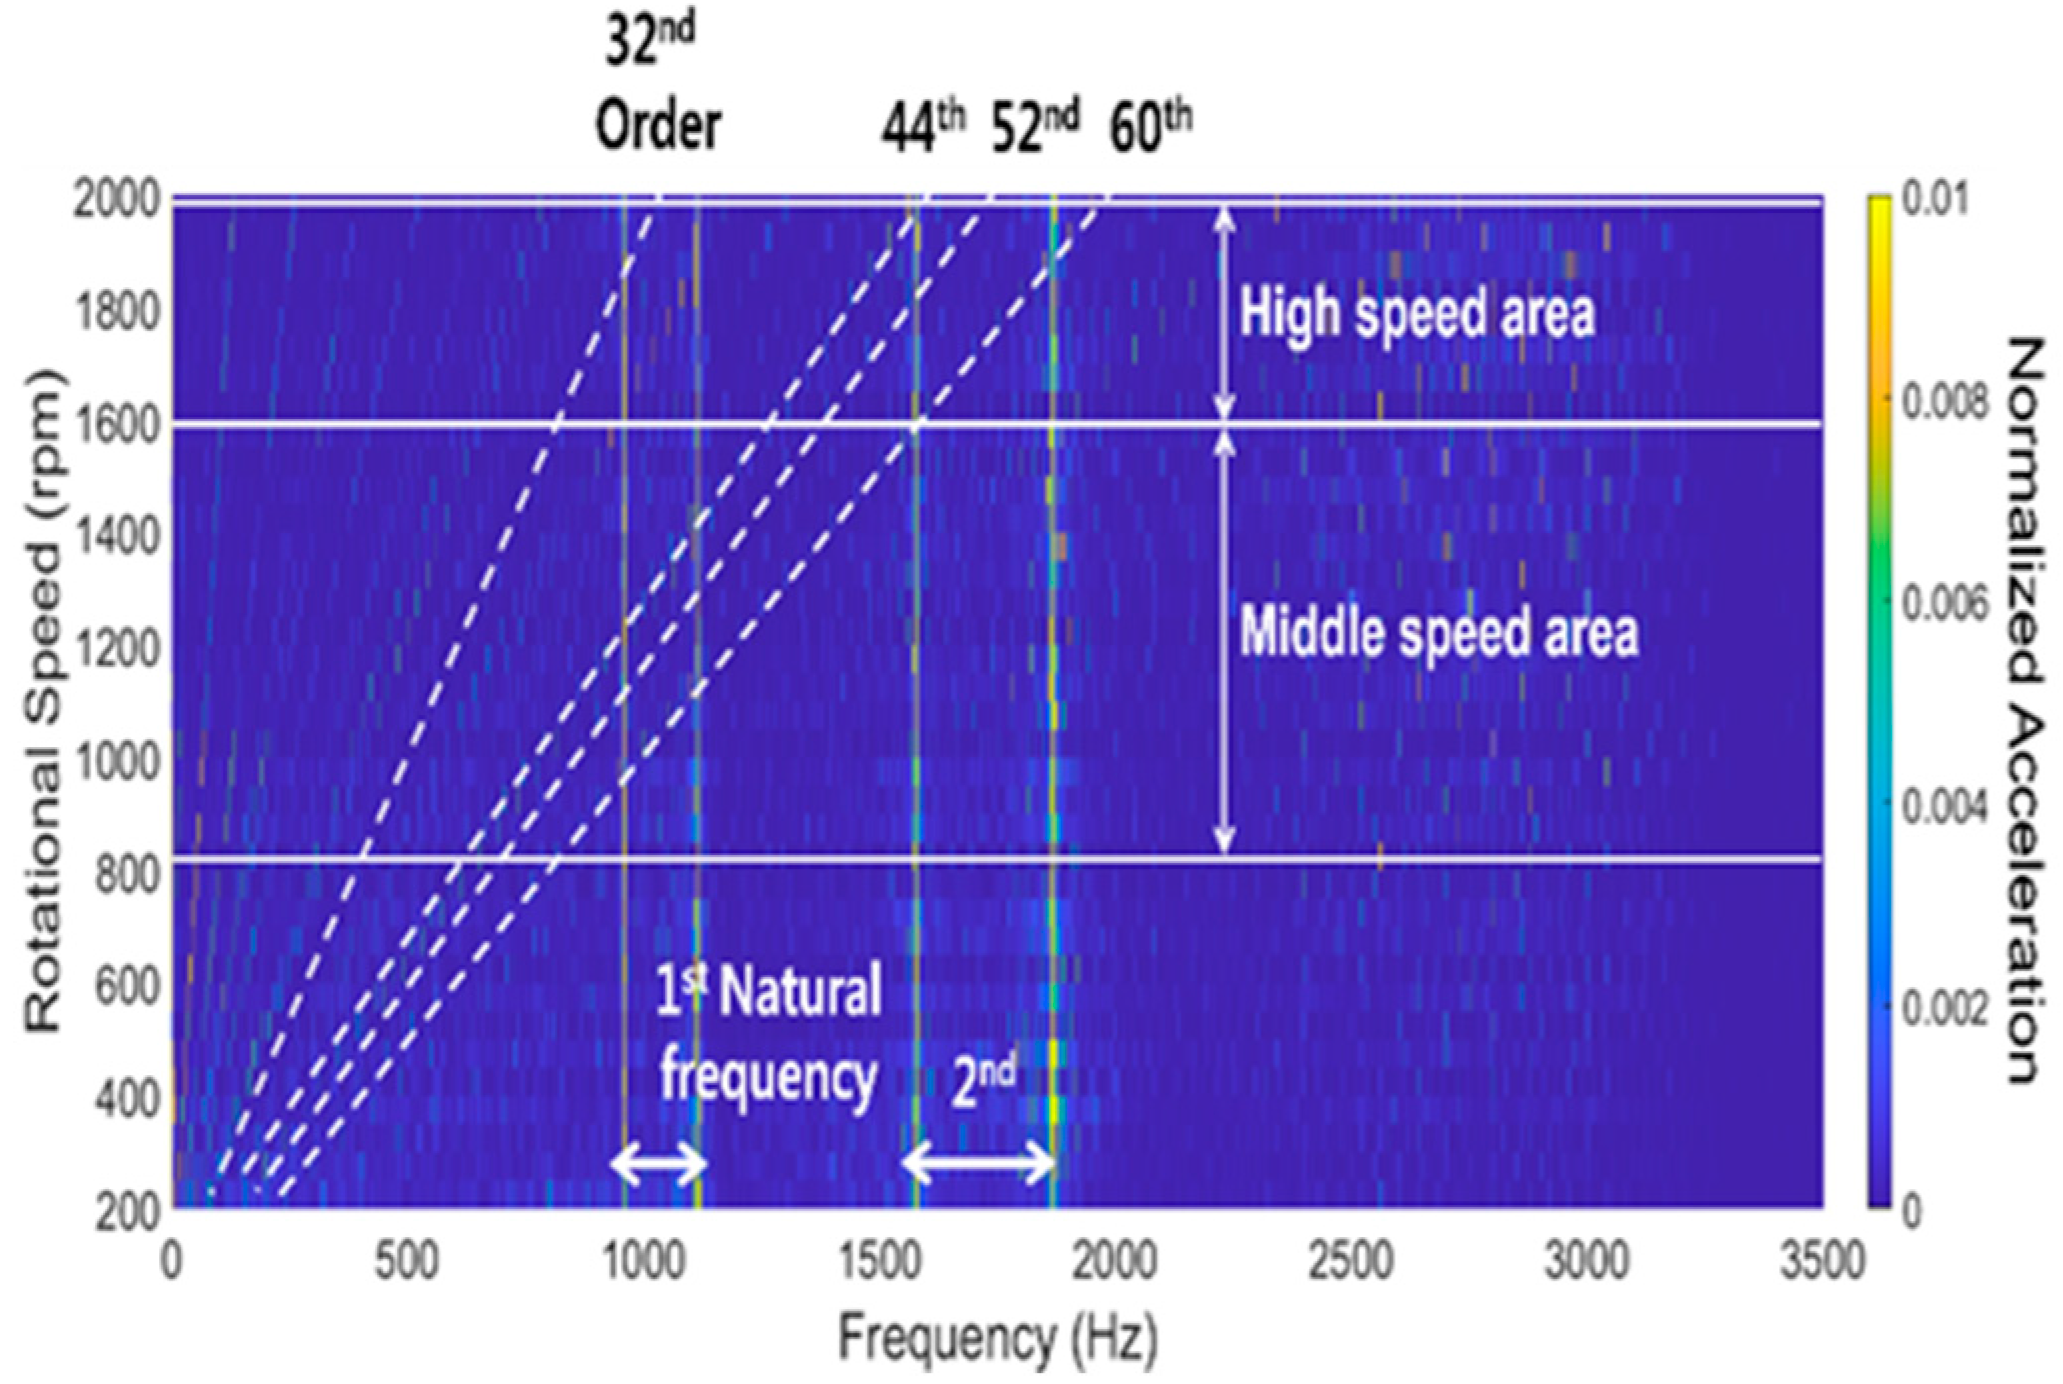
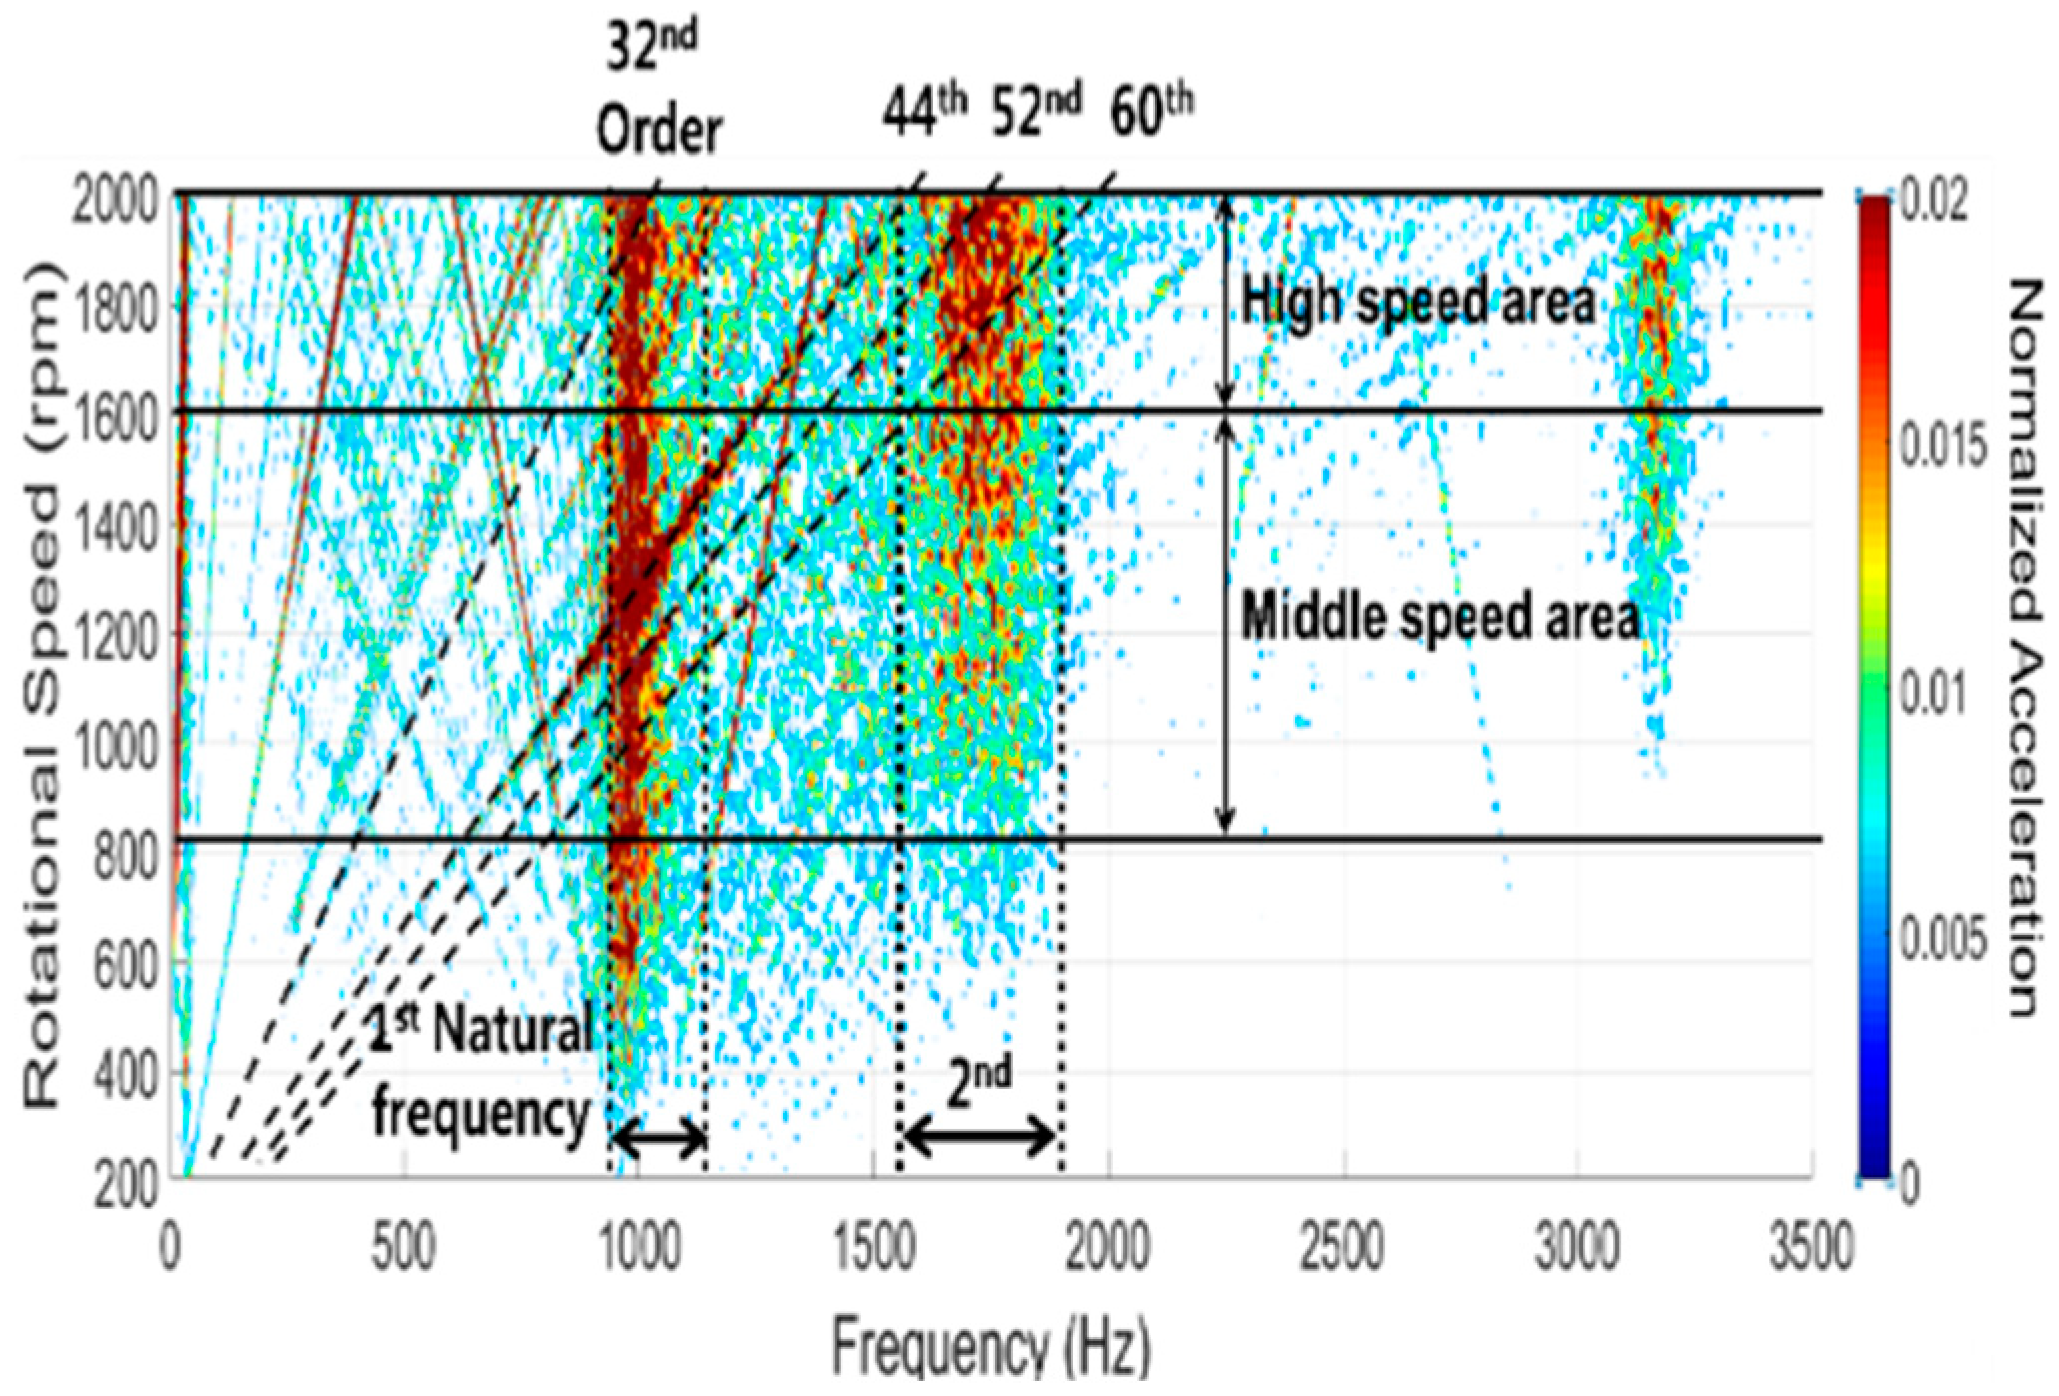
3.2. Electromagnetic Force Induced Vibration Analysis for the Operating Speed Range

In this section, the electromagnetic force induced vibration characteristics of the variable-speed motor are analyzed using the 3-D entire FE model validated previously. The FE analysis results are validated in comparison with the experiment results. Then, the FE analysis results are evaluated over a range of 3500 Hz, at which the validation is performed by modal analysis. The conditions of the vibration experiment are determined in consideration of the measurement time and numerical analysis precision, as listed in Table 4.
The electromagnetic-structural vibration coupled analysis method is used to analyze the vibration induced by the electromagnetic force of the motor. A transient analysis is performed by using the modal superposition method defined as Equations (5)–(7) [17].
[ M ] { x ¨ ( t ) } + [ K ] { x ( t ) } = { F ( t ) } ,
{ x ( t ) } = j = 1 k Φ j y j ( t ) ,
[ Φ ] T [ M ] [ Φ ] { y ¨ ( t ) } + [ Φ ] T [ K ] [ Φ ] { y ( t ) } = [ Φ ] T { F ( t ) } ,
where, [ M ] is a mass matrix, [ K ] is a stiffness matrix, { x } is a displacement vector, { F ( t ) } is a force vector, [ Φ ] is a mode shape matrix, and { y } is a modal displacement.
Also, the 3-D entire FE model validated in Section 2 and the electromagnetic force in the range of 200 to 2000 rpm calculated in Section 3.1 are used for the transient analysis. The vibration characteristics of the BLDC motor are evaluated over the range of operating speeds in the frequency domain by applying FFT to the transient analysis results.
Waterfall graphs of the FE analysis and the experiment results are shown in Figure 12 and Figure 13, respectively. As shown in Figure 12, a general vibration occurred around natural frequencies and electromagnetic force components of the 4 k -order frequencies ( k is a positive integer). In particular, at high operating speeds (1600 to 2000 rpm), the 32nd-order electromagnetic force component overlapped with the region of the 1st-order natural frequency, resulting in a large vibration. In addition, the 44th-, 52nd-, and 60th-order electromagnetic force components overlapped with the region of the 1st-order natural frequency at middle operating speeds (800 to 1600 rpm) and with the region of the 2nd-order natural frequency at high operating speeds, resulting in a large vibration. These vibration characteristics of the BLDC motor, according to the operating speed, can also be found in the experiment results. It is confirmed that the vibration characteristics occurring in the actual motor can be predicted very accurately by using the 3-D entire FE model.
On the other hand, the vibration characteristic calculated by using the electromagnetic-structural vibration coupled analysis on the operating speed range with the simplified FE model is shown in Figure 14. The simplified FE model consists of the motor housing and stator only [23,27]. It is found that there was not any vibration response in the first natural frequency around 1000 Hz at which the first natural frequency of the motor is in bending mode caused by the axial mode of the rotor structure. Therefore, the analysis results using the simplified FE model cannot calculate the vibration characteristics caused by the interaction between the first natural frequency and the 44th, 52nd, and 60th order of electromagnetic forces in the middle speed area.

4. Conclusions

In this study, the electromagnetic force induced structural vibration characteristics of the BLDC motor for operating speed ranges are predicted using a 3-D entire FE model, and the results are validated through a modal test. The 3-D entire FE model is developed by including the stator core, rotor, permanent magnets, stator housing, fin, coil, and other various components. The natural frequencies are accurately predicted within a relative error of 3% compared to the modal test results. The mode shapes computed by FE analysis are consistent with the modal test results.
For variable speed, the electromagnetic force induced vibration characteristics of the BLDC motor are predicted over the entire operating speed range by using the electromagnetic-structural vibration coupled analysis method with both the 3-D entire FE model and the simplified FE model. The harmonic order components of electromagnetic force, which induced a large amplitude of vibration, are calculated. The electromagnetic-structural vibration coupled analysis results are consistent with the vibration experiment results. In particular, the frequency that caused a large vibration on both the middle and high operating speed ranges can only be predicted well by using the 3-D entire FE model, which cannot be predicted using the simplified FE model. This research shows that the prediction of frequencies of peak magnitude that occur in the operating speed range is available by using the electromagnetic-structural vibration coupled analysis with a 3-D entire FE model.
The electromagnetic-structural vibration coupled analysis method for various operating speed ranges with the 3-D entire FE model proposed in this study will contribute to improving the prediction accuracy of motor vibration characteristics over a wide range of operating speeds.

Author Contributions

Conceptualization, S.C. and C.-W.K.; methodology, S.C. and C.-W.K.; software, S.C. and K.J.; validation, S.C., K.J. and C.-W.K.; formal analysis, S.C.; investigation, S.C.; resources, S.C.; data curation, S.C.; writing—original draft preparation, S.C. and C.-W.K.; writing—review and editing, S.C., K.J. and C.-W.K.; visualization, S.C.; supervision, C.-W.K. and K.-D.L.; project administration, C.-W.K.; funding acquisition, C.-W.K. All authors have read and agreed to the published version of the manuscript.

Funding

This paper was supported by the Technology Innovation Program (20012518) funded by the Ministry of Trade, Industry & Energy (MOTIE, Korea) and a National Research Foundation of Korea (NRF) grant funded by the Korean Government, Ministry of Science, ICT & Future Planning (No. 2019R1A2C1090228).

Institutional Review Board Statement

Not applicable.

Informed Consent Statement

Not applicable.

Data Availability Statement

Not applicable.

Conflicts of Interest

The authors declare no conflict of interest.

References

  1. Mori, D.; Ishikawa, T. Force and vibration analysis of induction motors. IEEE Trans. Magn. 2005, 41, 1948–1951. [Google Scholar] [CrossRef]
  2. Zhu, Z.Q.; Xia, Z.P.; Wu, L.J.; Jewell, G.W. Influence of slot and pole number combination on radial force and vibration modes in fractional slot PM brushless machines having single-and double-layer windings. In Proceedings of the 2009 IEEE Energy Conversion Congress and Exposition, San Jose, CA, USA, 20–24 September 2009; pp. 3443–3450. [Google Scholar]
  3. Verez, G.; Barakat, G.; Amara, Y.; Hoblos, G. Impact of pole and slot combination on vibrations and noise of electromagnetic origins in permanent magnet synchronous motors. IEEE Trans. Magn. 2015, 51, 1–4. [Google Scholar] [CrossRef]
  4. Tsypkin, M. The origin of the electromagnetic vibration of induction motors operating in modern industry: Practical experience—Analysis and diagnostics. IEEE Trans. Ind. Appl. 2016, 53, 1669–1676. [Google Scholar] [CrossRef]
  5. Kobayashi, T.; Tajima, F.; Ito, M.; Shibukawa, S. Effects of slot combination on acoustic noise from induction motors. IEEE Trans. Magn. 1997, 33, 2101–2104. [Google Scholar] [CrossRef]
  6. Kim, B.T.; Kwon, B.I.; Park, S.C. Reduction of electromagnetic force harmonics in asynchronous traction motor by adapting the rotor slot number. IEEE Trans. Magn. 1999, 35, 3742–3744. [Google Scholar]
  7. Hwang, S.M.; Lee, H.J.; Kim, T.S.; Jung, Y.H.; Hong, J.P. The influence of electromagnetic force upon the noise of an IPM motor used in a compressor. IEEE Trans. Magn. 2006, 42, 3494–3496. [Google Scholar] [CrossRef]
  8. Lee, S.H.; Hong, J.P.; Hwang, S.M.; Lee, W.T.; Lee, J.Y.; Kim, Y.K. Optimal design for noise reduction in interior permanent-magnet motor. IEEE Trans. Ind. Appl. 2009, 45, 1954–1960. [Google Scholar]
  9. Jung, J.W.; Lee, S.H.; Lee, G.H.; Hong, J.P.; Lee, D.H.; Kim, K.N. Reduction design of vibration and noise in IPMSM type integrated starter and generator for HEV. IEEE Trans. Magn. 2010, 46, 2454–2457. [Google Scholar] [CrossRef]
  10. Yu, S.; Tang, R. Electromagnetic and mechanical characterizations of noise and vibration in permanent magnet synchronous machines. IEEE Trans. Magn. 2006, 42, 1335–1338. [Google Scholar]
  11. Islam, R.; Husain, I. Analytical model for predicting noise and vibration in permanent-magnet synchronous motors. IEEE Trans. Ind. Appl. 2010, 46, 2346–2354. [Google Scholar] [CrossRef]
  12. Yim, K.H.; Jang, J.W.; Jang, G.H.; Kim, M.G.; Kim, K.N. Forced vibration analysis of an IPM motor for electrical vehicles due to magnetic force. IEEE Trans. Magn. 2012, 48, 2981–2984. [Google Scholar] [CrossRef]
  13. Yang, H.; Chen, Y. Influence of radial force harmonics with low mode number on electromagnetic vibration of PMSM. IEEE Trans. Energy Convers. 2013, 29, 38–45. [Google Scholar] [CrossRef]
  14. Torregrossa, D.; Fahimi, B.; Peyraut, F.; Miraoui, A. Fast computation of electromagnetic vibrations in electrical machines via field reconstruction method and knowledge of mechanical impulse response. IEEE Trans. Ind. Electron. 2011, 59, 839–847. [Google Scholar] [CrossRef]
  15. Torregrossa, D.; Paire, D.; Peyraut, F.; Fahimi, B.; Miraoui, A. Active mitigation of electromagnetic vibration radiated by PMSM in fractional-horsepower drives by optimal choice of the carrier frequency. IEEE Trans. Ind. Electron. 2010, 59, 1346–1354. [Google Scholar] [CrossRef]
  16. Islam, M.S.; Islam, R.; Sebastian, T. Noise and vibration characteristics of permanent-magnet synchronous motors using electromagnetic and structural analyses. IEEE Trans. Ind. Appl. 2014, 50, 3214–3222. [Google Scholar] [CrossRef]
  17. Lin, F.; Zuo, S.; Wu, X. Electromagnetic vibration and noise analysis of permanent magnet synchronous motor with different slot-pole combinations. IET Electr. Power Appl. 2016, 10, 900–908. [Google Scholar] [CrossRef]
  18. Lin, F.; Zuo, S.; Deng, W.; Wu, S. Modeling and analysis of electromagnetic force, vibration, and noise in permanent-magnet synchronous motor considering current harmonics. IEEE Trans. Ind. Electron. 2016, 63, 7455–7466. [Google Scholar] [CrossRef]
  19. Hong, J.; Wang, S.; Sun, Y.; Sun, X.; Cao, H. Piecewise stagger poles with continuous skew edge for vibration reduction in surface-mounted PM synchronous machines. IEEE Trans. Ind. Electron. 2020, 68, 8498–8506. [Google Scholar] [CrossRef]
  20. Wang, S.; Hong, J.; Sun, Y.; Cao, H. Mechanical and magnetic pivot roles of tooth in vibration of electrical machines. IEEE Trans. Energy Convers. 2020, 36, 139–148. [Google Scholar] [CrossRef]
  21. Lan, H.; Zou, J.; Xu, Y.; Liu, M. Effect of local tangential force on vibration performance in fractional-slot concentrated winding permanent magnet synchronous machines. IEEE Trans. Energy Convers. 2018, 34, 1082–1093. [Google Scholar] [CrossRef]
  22. Furlan, M.; Cernigoj, A.; Boltezar, M. A coupled electromagnetic-mechanical-acoustic model of a DC electric motor. COMPEL-Int. J. Comput. Math. Electr. Electron. Eng. 2003, 22, 1155–1165. [Google Scholar] [CrossRef]
  23. Torregrossa, D.; Peyraut, F.; Fahimi, B.; M’Boua, J.; Miraoui, A. Multiphysics finite-element modeling for vibration and acoustic analysis of permanent magnet synchronous machine. IEEE Trans. Energy Convers. 2010, 26, 490–500. [Google Scholar] [CrossRef]
  24. Park, S.; Kim, W.; Kim, S.I. A numerical prediction model for vibration and noise of axial flux motors. IEEE Trans. Ind. Electron. 2014, 61, 5757–5762. [Google Scholar] [CrossRef]
  25. Zuo, S.; Lin, F.; Wu, X. Noise analysis, calculation, and reduction of external rotor permanent-magnet synchronous motor. IEEE Trans. Ind. Electron. 2015, 62, 6204–6212. [Google Scholar] [CrossRef]
  26. Zhao, J.; Zhang, Q.; Wei, X. An integrated approach of a field-circuit coupling model and multi-physics finite-element simulation for analysing transient electromagnetic vibration of pump motors. IET Electr. Power Appl. 2022, 16, 1030–1056. [Google Scholar] [CrossRef]
  27. Cho, S.; Hwang, J.; Kim, C.W. A study on vibration characteristics of brushless DC motor by electromagnetic-structural coupled analysis using entire finite element model. IEEE Trans. Energy Convers. 2018, 33, 1712–1718. [Google Scholar] [CrossRef]
  28. Lin, F.; Zuo, S.; Deng, W.; Wu, S. Noise prediction and sound quality analysis of variable-speed permanent magnet synchronous motor. IEEE Trans. Energy Convers. 2017, 32, 698–706. [Google Scholar] [CrossRef]
  29. Fang, H.; Li, D.; Guo, J.; Xu, Y.; Qu, R. Hybrid model for electromagnetic vibration synthesis of electrical machines considering tooth modulation and tangential effects. IEEE Trans. Ind. Electron. 2020, 68, 7284–7293. [Google Scholar] [CrossRef]
  30. Fang, Y.; Zhang, T. Vibroacoustic characterization of a permanent magnet synchronous motor powertrain for electric vehicles. IEEE Trans. Energy Convers. 2017, 33, 272–280. [Google Scholar] [CrossRef]
  31. Gieras, J.F.; Wang, C.; Lai, J.C. Noise of Polyphase Electric Motors; CRC Press: Boca Raton, FL, USA, 2018. [Google Scholar]
Figure 1. The BLDC Motor: (a) stator, stator winding, and stator housing; (b) rotor, permanent magnets, rotor shield, and bearings; (c) front end shield; (d) fin; (e) back end shield.
Applsci 12 08497 g001
Figure 2. 3-D entire geometry of the BLDC motor including stator core, rotor, rotor housing, permanent magnets, stator housing, fin, coil, and other various components.
Applsci 12 08497 g002
Figure 3. 3-D entire finite element model of the BLDC motor.
Applsci 12 08497 g003
Figure 4. Equipment for the impact hammer test: (a) digital acquisition (DAQ) system and impact hammer; (b) single-axial (left), and tri-axial (right) accelerometer.
Applsci 12 08497 g004
Figure 5. Modal test of the BLDC motor. (a) sensors attached to the BLDC motor; (b) sensor attachment points.
Applsci 12 08497 g005
Figure 6. Results of the modal test (left) and modal analysis (right). (a) 1st mode; (b) 2nd mode; (c) 3rd mode; (d) 4th mode.
Applsci 12 08497 g006
Figure 7. Electromagnetic-structural vibration coupled analysis process.
Applsci 12 08497 g007
Figure 8. Finite element model to calculate electromagnetic force.
Applsci 12 08497 g008
Figure 9. Distribution of magnetic flux density at 2000 rpm. (a) 3-D distribution of magnetic flux density. (b) 2-D distribution of magnetic flux density.
Applsci 12 08497 g009
Figure 10. 2-D FFT results of magnetic flux density at 2000 rpm.
Applsci 12 08497 g010
Figure 11. Waterfall graph of electromagnetic force.
Applsci 12 08497 g011
Figure 12. Waterfall graph of electromagnetic-structural vibration coupled analysis with 3-D entire FE model in the operating speed range.
Applsci 12 08497 g012
Figure 13. Waterfall graph of vibration experiment in the operating speed range.
Applsci 12 08497 g013
Figure 14. Waterfall graph of the electromagnetic-structural vibration coupled analysis with the simplified FE model in the operating speed range.
Applsci 12 08497 g014
Table 1. Parameters of BLDC motor.
ParametersQuantity
TypeBLDC
Rated power1.5 kW
Rated speed2000 rpm
Rated torque7.17 N⋅m
Number of phases3
Number of poles4
Number of lots24
Table 2. Specifications of the equipment.
SpecificationsAccelerometerImpact Hammer
1-Axis3-Axis
Bandwidth (Hz)500050003500
Maximum
measurement
deviation (%)
2.23.6-
Table 3. Comparison of the natural frequencies between the FE analysis and modal test.
ModeFE Analysis Results (Hz)Test Results (Hz)Relative Error (%)
1101010040.6
218011810−0.5
3212121220
431913284−2.9
Table 4. Vibration experiment conditions.
ItemQuantity
Frequency resolution5 Hz
The number of spectral lines1024
Bandwidth5120 Hz
Publisher’s Note: MDPI stays neutral with regard to jurisdictional claims in published maps and institutional affiliations.

