Abstract
This study aimed to investigate the relationships between the modified t−agility test (MAT) time and muscular strength and power of lower limb extensors, adductors (AD), and abductors (AB). Nineteen male basketball players performed: linear sprint tests at 5 m and 20 m, MAT, countermovement (CMJ) and drop jump (DJ), leg press exercise, AD and AB hip maximum isometric strength measurements. All of them were left leg dominant. The correlation analysis showed a significant, moderate to very large negative relationship between MAT test time initiated to the left and height of CMJ and DJ (r = −0.69 and −0.54; p < 0.01, both), left (r = −0.56; p < 0.01) and right leg (r = −0.41; p < 0.05) AD, left leg AB (r = −0.48; p < 0.05) maximum isometric strength, left (r = −0.72; p < 0.01) and right (r = −0.64; p < 0.01) leg power output in leg press. In the case of the MAT test initiated on the right side first, the correlations were found between CMJ height (r = −0.46; p < 0.05), AD and AB maximum isometric strength of left (r = −0.58 and −0.84; p < 0.01, both) and right leg (r = −0.58 and −0.79; p < 0.01, both), and both legs power output in leg press (r = −0.66 for left and r = −0.59 for right; p < 0.01, both). The regression analyses showed that the prediction model of left leg press peak power, left leg AD maximum isometric strength, and CMJ height could explain up to 93% of the MAT test time initiated to the left first. The model, including left leg AB and AD maximum isometric strength, could explain up to 83% of the MAT test time initiated to the right side first. Findings from this study demonstrate that AB and AD maximum isometric muscle strength are highly related to MAT test performance, which is particularly important when the first turn is performed in the non−dominant direction in this test.
1. Introduction
Basketball is an intermittent sports activity characterized by periods of moderate and high-intensity exercise, including sprinting, backwards and sideways, running, shooting, rebounding, dribbling, jumping, as well as turning, and cutting. These activities are usually interspaced by very short, low-intensity recovery periods [1,2]. Depending on the sports level and playing position, a basketball player may change the direction (COD) and speed of movement from 550 up to 1000 times during a game [3]. McInnes et al. [4] and Abdelkrim et al. [5] indicate that an elite player performs over 997 ± 183 activities during a game, changing pace and direction of movement every 2 s. The same authors show that elite players perform up to 100 sprints at distances ranging from 3–5 m, while 30% of the game time, the players move laterally, usually by shuffling. Considering the motor characteristics of basketball, the COD ability is perhaps the most significant fitness component in this team sport.
Athletes’ ability to change direction quickly is a crucial aspect of their sport-related fitness, but there have been many disputes over how to evaluate and improve this skill [6]. It has long been believed that conventional strength and power training enhances COD performance. The strength and power characteristics and COD, however, do not appear to be strongly associated according to correlation analysis [7]. Additionally, linear speed has not demonstrated any meaningful relationships with COD [8], and reactive strength appears to have a stronger effect on COD than the lower limbs’ maximal isometric strength (MIS) [9]. While unilateral horizontal and lateral jump training has positively affected COD, numerous studies that used bilateral strength exercises in the vertical direction have failed to elicit improvements [10]. Considering test design and training program efficacy, it appears that COD evaluation and training deserve additional research.
A variety of methods, such as the pro-agility shuttle, three-cone drill, L-run, T-test, and the Illinois agility test, have been suggested to evaluate COD capability [11]. Therefore, coaches and trainers are challenged to select the most appropriate and specific test to assess the agility of their athletes. Considering the aforementioned basketball demands, the modified T-test (MAT) seems to provide the most appropriate agility measurement for this sport [12]. The MAT is a unique test with four changes of direction, such as forward and backward sprinting and shuffling to the left and right over a short distance (total distance of 20 m). Therefore, this test provides a more specific measurement of agility for basketball.
Scientists and coaches differ in opinions on the contribution of particular abilities in determining CODs. Yet, most of them include lower limb strength and power tests, as well as linear speed [12,13,14,15]. Although MAT is the recommended test for basketball [15], to the best of our knowledge, only one study has so far studied the relationship between MAT and strength skills in a group of male basketball players [16]. A study by Scanlan et al. [16] showed that MAT performance is challenging and largely underpinned by several power-related characteristics such as standing long jump distance, relative peak force during the isometric midthigh pull, and relative peak force during a countermovement jump (CMJ), and 10 m sprint time Moreover; it’s interesting to note that research investigating the relationship between athletes’ power attributes and MAT performance took into account trials carried out solely on the athletes’ left side or dominant leg [7,16]. Hence it is unknown whether the initiation side is a factor modulating the MAT performance and its relationship with power-related measures. Furthermore, even though half of the MAT test distance is carried out by shuffling, there is a lack of research on its relationship with abductor and adductor strength.
Deterministic models of CODs would help identify the most significant components of this ability and then optimize training variables, including exercise choice, exercise time, intensity, volume, and the complexity of exercises directed at this ability. Another aspect worth considering is COD’s impact on technical and tactical skills in team sports games. Considering the significance of COD speed in basketball, we attempted to determine which strength, speed, and power characteristics determine COD performance to the greatest extent. Therefore, the primary aim of this study was to quantify the magnitude of the relationships between the MAT time and the muscular strength of lower limb extensors, abductors, and adductors, the CMJ, drop jump (DJ), reactive strength index (RSI), and sprinting speed over 5 m and 20 m. The secondary aim was to investigate whether the relationships differ depending on the side initiation of the MAT test (to the left and right sides first).
2. Materials and Methods
2.1. Materials
Nineteen male competitive academic basketball players (Polish Second Division) with an average age of 22.7 ± 3.4 years were qualified for the research. The athletes constituted a homogenous group in regards to age, physical fitness, and training experience. The average body height and body mass of the athletes equaled 192.6 ± 4.8 cm, at 86.5 ± 5.7 kg, respectively, with 5.8 ± 2.3 years of training experience. The dominant limb of athletes was defined as the one used preferably in a single-legged jump [17]. All of the examined athletes were left leg dominant. All athletes had valid medical examinations, which allowed them to take part in the experiment. The research was conducted at the beginning of the competitive season; thus, the players had significant conditioning, which included several weeks of general and specific basketball fitness training. Testing was scheduled for the same time of the day (at the typical training time, in the evening, between 5:00 and 7:00 p.m.) for both experimental sessions to avoid the effects of the circadian rhythm (on Monday and Tuesday after a day of rest). During both sessions, similar environmental conditions were ensured: temperature (21–22 °C) and relative air humidity (51–56%). The athletes were also told to adhere to the following rules before testing: (i) maintain their usual dietary and sleep habits, (ii) no intake of any energy/performance-enhancing supplements or drinks at least 24 h before testing; (iii) no intake of beverages containing alcohol and caffeine at least 24 h before testing. Moreover, they were told to wear their official competition suit during testing.
2.2. Methods
For the purpose of the study, an appropriate training cycle was constructed, which included testing on 2 days, planned in a specific order. The research started with the evaluation of body mass, body height, and body composition using bioelectric impedance. The measurements of body height were performed with a stadiometer (Seca 284, Seca Instruments Ltd., Hamburg, Germany) with a precision of 0.1 cm. Body composition was evaluated using the electrical impedance technique (Inbody 720, Biospace Co., Tokyo, Japan). Each testing day was preceded by a typical pre-training standardized 20–25 min warm-up, which consisted of jogging, dynamic stretching, skipping, backward and lateral movements, as well as several accelerations over 10 m. Depending on the test, a short specific warm-up was conducted, activating the muscles used in a particular movement. The linear sprint tests at 5 m and 20 m were performed first after a day of rest, followed by the MAT test. The following day, all strength and power evaluations were performed, including the CMJ, DJ, the leg press exercise, and the abductor and adductor lower limb strength measurements. The 5 and 20 m sprint tests and the MAT test were conducted on a wooden basketball court, while all other evaluations were performed in the Strength and Power Laboratory of the Institute of Sport Sciences, The Academy of Physical Education in Katowice, Poland. The study protocol was approved by the Bioethics Committee for Scientific Research, at the Academy of Physical Education in Katowice, Poland (3/2021), according to the ethical standards of the Declaration of Helsinki, 1983.
2.2.1. Measurement of Change of Direction (Modified Agility T-Test)
The MAT test was performed over a distance of 20 m and included linear sprints, lateral shuffling, and back pedaling, actions specific to the basketball [14] (Figure 1). The athletes started the test from a semi-crouched position facing forwards with the front foot placed 0.5 m behind the first timing gate to prevent any early triggering of the start gate. The players sprinted 5 m forwards to touch the top of the middle cone, then shuffled 2.5 m to the left or right, depending on the trial, to touch the next cone, shuffled 5 m in the opposite direction, touched the cone, shuffled 2.5 m back to the middle marker and finally pedaled back through the timing gates to the finish. Four trials were completed, with two initiating the shuffle to the left side first and two to the right side first. Three-minute rest intervals were used between trials. The timing gate was placed at the starting line (Witty, Microgate, Bolzano, Italy).
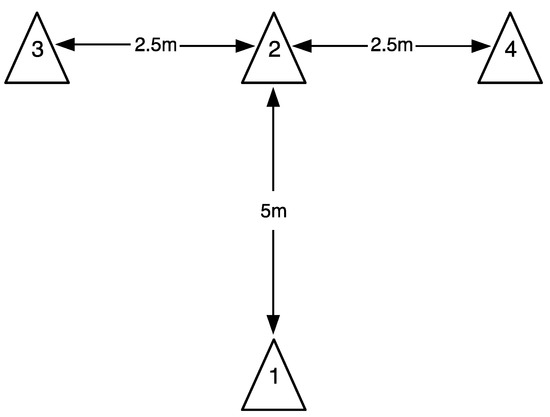
Figure 1.
Schematic presentation of the modified agility T-test.
2.2.2. Measurement of Sprint Performance (5 m, 20 m)
The 20 m test trials evaluated linear starting speed and acceleration. The athletes began from a crouched start, with their lead foot placed 30 cm behind the timing gate. Three timing gates were used (Witty, Microgate, Bolzano, Italy), which allowed to measure the sprint time at 5 m and 20 m. After receiving a verbal signal, the athlete started at will. Two trials were used with a 3 min rest interval in between.
2.2.3. Measurement of Jumping Performance (CMJ, DJ)
Jumping assessments were performed on a force plate (Force Decks, Vald Performance, Albion, Australia), which has been previously proposed as a reliable device [18]. The CMJ was performed according to the recommendations previously proposed by Young et al. [19]. The athletes started in the standing position with a straight torso and knees fully extended with the feet shoulder-width apart, and hands were free to move. Then, they dropped into the countermovement position to a self-selected depth and immediately followed with a maximal effort vertical jump. Athletes were instructed to land in the same position as the take-off in the mid-section of the force plate. The athlete returned to the starting position after each jump, and the procedure was completed for a total of two jumps. The following variables were evaluated: jump height [cm], peak velocity [m/s], relative peak power [W/kg].
The DJ was performed according to the recommendations previously proposed by Young et al. [19]. To initiate the drop action, the athletes were instructed to: “step off” the box one foot at a time (left limb first) and then to “jump up as fast as possible after contact with the ground, making sure that the jump is the highest possible”. This instruction prevented athletes from jumping out of the box. The athlete was instructed to perform the contact phase and landing phase on the force plate. The jump was invalid if the athlete raised the feet during the jump flight, landed behind the force plate, or jumped off the box. The DJ was performed from a 60 cm wooden box, as no greater drop heights are recommended in order to maximize RSI [20]. The following variables were evaluated: contact time (s), jump height (cm), RSI, and relative peak power (W/kg). The best jump in terms of height from the two attempts was used for further analysis.
2.2.4. Measurement of Maximum Isometric Hip Strength
After a standardized warm-up, the athletes performed the isometric strength test of the Abd-Add muscles. Athletes were positioned beneath the GroinBar Hip Strength Testing System (Vald Performance, Albion, Australia) in a supine position, and the bar height was customized for each athlete to ensure they maintained a knee joint angle of 45 degrees and a hip joint angle of 45 degrees during testing. After placing the femoral medial condyle of both knees on the sensors (sample rate of 50 Hz), the athletes were given a verbal command to complete a single attempt at approximately 80% of their maximum effort. Afterward, two maximum attempts interspersed with 3 min rest intervals were performed. Athletes were asked to push their femoral medial condyles against the pads for 5 s. Previous studies have shown high reliability of intra-class correlation coefficients (ICC) of 0.94 [21].
2.2.5. Measurement of Peak Power during the Leg Press
Peak power output obtained during the leg press exercise at 60% one-repetition maximum (1RM) was assessed using the Keiser Leg Press A420 pneumatic device (Keiser, Fresno, CA, USA). This external load was chosen because it falls within the range indicated as optimal for obtaining the highest values of peak power outputs during a leg press exercise [22]. The test was performed from a seated position (approximately 90° knee flexion) with feet flat on each footplate. Athletes were asked to complete each repetition by extending both legs together with maximum velocity and instruction to “push as fast as possible”. Each athlete performed two attempts with 3 min rest intervals, and the highest power output from each leg was retained for further analysis.
2.3. Statistical Analyses
The sample size for a Spearman correlation was determined using G*Power version 3.1.9.2 (Dusseldorf, Germany), a power of 0.8, the significance level of 0.05, and the effect size of 0.53–0.67 based on the previous study that investigated determinants of MAT test performance [16]. Based on the aforementioned assumptions, the required sample size was determined to be between 15 to 25. All statistical analyses were performed using the SPSS (version 25.0; IBM, Inc., Chicago, IL, USA). Data are presented as means and standard deviations (SD) with 95% confidence intervals. The normality of the data was confirmed by the Shapiro–Wilk test. Spearman’s correlation was used to determine the relationship between all measured variables and both limbs with 95% confidence intervals followed by stepwise forward regression. For regression analyses hip MIS, leg press peak power, vertical jumping, and sprint performance values were set as independent variables (predictors) and MAT performance as the dependent variable. The common variance between variables was described with the coefficient of determination (R2). Correlations were evaluated as follows: trivial (0.0–0.09), small (0.10–0.29), moderate (0.30–0.49), large (0.50–0.69), very large (0.70–0.89), nearly perfect (0.90–0.99), and perfect (1.0) [23]. The significance level for the correlation and regression analysis was set as p < 0.05.
3. Results
Descriptive data for all the variables is shown in Table 1.

Table 1.
Descriptive data (mean ± SD [95% confidence intervals]).
The correlation showed significant, moderate to very large negative correlations between MAT time initiated to the left or right side first (Table 2).
Table 2.
Correlations between the MAT tests and vertical jump variables, 5 m and 20 m sprint time, abductors and adductors maximum isometric strength, and leg press.
The regression analyses showed that the prediction model of left leg press peak power, left leg hip adductors MIS, and CMJ height were able to explain up to 93% of the MAT time initiated to the left first, and the model including left leg hip adductors and abductors MIS was able to explain up to 83% of the MAT time initiated to the right side first (Table 3).
Table 3.
Stepwise regression analyses relating left and right MAT with hip maximum isometric strength, Keiser leg press peak power, vertical jumping, and sprint performance values.
The regression model for the dependent variable YMAT LEFT took the form:
YMAT LEFT = 7.927 − 0.001 × Leg PressLEFT − 0.002 × ADLEFT − 0.028 × CMJ JH
In terms of practical implications, it means that if the value of the left leg peak power leg press result increases by a unit, the MAT initiated to the left side decreases by 0.001 s. Similarly, if the left leg hip adductors MIS or CMJ JH variable increases, the MAT initiated to the right will decrease accordingly by 0.002 s or 0.028 s.
At the same time, the independent variable having the most significant impact on the dependent variable turned out to be CMJ JH.
The regression model for the dependent variable YMAT RIGHT took the form:
YMAT RIGHT = 8.86 − 0.002 × ABLEFT − 0.001 × ADLEFT
In terms of practical implications, if the value of the left leg hip abductors MIS result increase by a unit, the MAT initiated to the right side decreases by 0.002 s. If the left leg hip adductors’ MIS increases by a unit, the MAT initiated to the right first decreases by 0.001 s.
At the same time, the independent variable having the most significant impact on the dependent variable turned out to include abductor left leg MIS.
4. Discussion
The results of this study showed that a large amount of the MAT performance could be explained by an athlete’s strength and power characteristics; however, the model differs depending on which side it is initiated. Using the adjusted coefficient of determination, 93% of the MAT time initiated to the left first could be explained by a model including left leg peak power during the leg press, left leg hip adductors MIS, and CMJ height. On the other hand, 83% of the MAT time initiated to the right first might be predicted by dominant limb abductors and adductors’ MIS. Correlations between the athlete’s strength and power characteristics and the MAT initiated to the left and right were similarly significant, except for DJ height which was largely negatively correlated with the MAT initiated to the left first. In contrast, a very large negative correlation was found between right leg hip abductors MIS and MAT initiated to the right first.
Studies on the associations between the strength and power characteristics and MAT performance demonstrate equivocal findings. For example, Sassi et al. [12] reported no relationship between MAT time, 10 m linear sprint, and CMJ height with arm swing in male team sports players. However, these findings might not transfer to basketball since its game play is more specifically related to the shuffling motions in the MAT than other team sports (i.e., soccer and handball). To our knowledge, this and a study by Scanlan et al. [16] were the only ones that investigated relationships between MAT time and strength power-related characteristics among basketball players. However, comparing the results obtained in this study and Scanlan et al. [16] is difficult because the measures of strength and power-related outcomes used varied significantly between studies. Moreover, taking into account registered MAT times, it seems that the players participating in the Scanlan et al. [16] study were better trained compared to the participants of this study, which may also be a factor modulating the conclusions [24]. Nevertheless, significant knowledge and training clues can be derived from comparing those studies’ data. Scanlan et al. [16] sought relationships between MAT time and absolute and relative peak force in CMJ and standing long jump distance. In contrast, height, peak velocity, and relative peak power during CMJ and DJ were evaluated in the current study. Scanlan et al. [16] showed a large negative relationship between standing long jump distance and relative peak force during CMJ and MAT time. While the current study found a moderate and large negative relationship between MAT time and tested vertical jumps height (DJ and CMJ). Therefore, it seems that MAT time might be associated with jumping performance. Nevertheless, it has to be highlighted that the remaining jumping measures (relative peak power, peak velocity, contact time, RSI) weren’t significantly correlated. This indicates that more in-depth research evaluating various measures of jumping performance and MAT time is required to draw conclusions.
Concerning the relationship between MAT time and linear sprint, a study by Scanlan et al. [16] and the current ones consistently show no correlation with the 5 m distance. However, Scanlan et al. [16], contrary to Sassi et al. [12], showed a largely positive relationship between 10 m linear sprint and MAT time. Additionally, the current study found no association between 20 m and MAT time. That is surprising because the MAT test starts with a 5 m linear sprint. Therefore, since the longest distance is covered by the shuffle (10 m) compared to the linear sprint (5 m) and the backward run (5 m), it seems that MAT time can be mostly related to lateral movements. However, a study by Scanlan et al. [16] did not confirm this, showing a small association between the MAT time and lateral bound distance. Nevertheless, it should be noted that the tests were performed only on the dominant leg, which is a significant limitation because MAT involves bidirectional lateral movements. Additionally, to the best of the authors’ knowledge, it was the first study that examined the relationship between athlete’s abductors and adductors’ MIS and MAT time. The results indicated a significant moderate to a large negative correlation between adductors of both lower limbs and MAT time. This may suggest that, rather than using complex movement measures such as the repeated lateral bounds used by Scanlan et al. [16], isolated measurement of the adductors’ and abductors’ strength is advisable in order to look for an association with MAT time. Additionally, the large and very large relationship between leg press peak power and MAT time found in the current study can confirm this.
Presumably, this is the first study that examined the relationship between male basketball players’ strength and power characteristics and the MAT, depending on which side the first turn was initiated. Interestingly, a very large negative correlation was noted between abductors’ MIS of both lower limbs and MAT to the right first. However, with MAT to the left first, the correlations were weaker, and only a moderate negative correlation was found with left leg hip abductors’ MIS. Moreover, the regression models also differ depending on which side the first turn was initiated on. Thus, these findings highlight the first direction as a differentiating factor of MAT performance. Despite that, it has to be noted that the dominant leg (left for athletes of this study, as the preferable take-off leg during jumping) strength-power characteristics were crucial, no matter on which side the MAT was initiated.
Interestingly, studies investigating the relationship between athletes’ strength and power characteristics and MAT performance considered trials performed only on the dominant leg or athletes’ left side [7,16]. Indeed, the distance covered by each leg as a leading and supporting one is the same regardless of which side the first turn is performed, and changes of direction alternate between legs which may mask any differences between the ability to change direction. However, when turning to the left first, the leading leg for the first 2.5 m is the left leg, and then the right initiates the movement for another 5 m, then the following change occurs, and again for 2.5 m, the left leads. Therefore, the first turn determines which leg will lead for a longer time. Moreover, when turning to the left first, the right leg is the push-off limb twice (during the first and third turn). All athletes in this study were left-leg dominant. Therefore, the results of this study indicate that during the MAT initiated to the right first, the left leg hip abductors and adductors’ MIS largely explain the time of this test. Since, in this scenario, the left leg was the push-off limb twice, it seems that its ability to re-accelerate was crucial for MAT time. Therefore, this might partially explain higher correlations reported between the left leg hip abductors and adductors’ MIS and MAT initiated to the right first.
Certain study limitations should be acknowledged. One limitation of this study is that only the hip abductors and adductors MIS were assessed; thus, these relationships may vary if dynamic strength is evaluated. Furthermore, all of the participants were left leg dominant. In addition, only correlations between bilateral vertical jumps were evaluated instead of single-leg jumps. Moreover, considering that gender [12], playing level [24], and sports discipline [25] significantly impact relationships between MAT performance and strength power-related characteristics, caution is needed when extrapolating these results to other populations. Bearing in mind also the demands encountered by basketball players of different playing positions [26]. Additionally, assessing the electromyographic activity of hip muscles during MAT could shed new light on its involvement in lateral movements. Furthermore, it would be of great interest to examine the relationship between hip abductors and adductor MIS, single-leg lateral and vertical jumps, and other COD tests among athletes with a strength imbalance between the muscles mentioned above.
5. Conclusions and Practical Applications
To the best of the authors’ knowledge, this is the first study that examined the relationship between an athlete’s strength and power characteristics and the MAT, depending on which side the first turn was initiated. Findings from this study demonstrate that hip abductors and adductors MIS are highly related to MAT performance, with particular importance when the first turn is performed in the non-dominant direction in this test. Moreover, this study underlines the need for multiple component assessments of MAT performance, highlighting CMJ height, both limbs’ peak power during the leg press exercise, and hip abductors and adductors MIS as deterministic factors. Based on the findings of this study, it might be inferred that the proper development of hip abductors and adductor MIS has the potential to improve MAT performance in basketball players.
Author Contributions
Conceptualization, M.P. and A.Z.; methodology, M.P. and A.Z.; software, A.M.; validation, A.M.; formal analysis, A.M.; investigation, M.P. and D.P.; data curation, M.P.; writing—original draft preparation, M.K. and M.P.; writing—review and editing, M.K., D.P. and M.P.; supervision, M.K. and A.Z. All authors have read and agreed to the published version of the manuscript.
Funding
This research received no external funding.
Institutional Review Board Statement
All subjects gave informed consent for inclusion before participating in the study. The study was conducted in accordance with the Declaration of Helsinki, and the protocol was approved by the Institutional Review Board of the Academy of Physical Education in Katowice (3/2021). Informed consent was obtained from all subjects involved in the study.
Informed Consent Statement
Not applicable.
Data Availability Statement
The datasets analyzed during the current study are available from the corresponding author on reasonable request.
Conflicts of Interest
The authors declare no conflict of interest.
References
- Mikolajec, K.; Waskiewicz, Z.; Maszczyk, A.; Bacik, B.; Kurek, P.; Zając, A. Effects of Stretching and Strength Exercises on Speed and Power Abilities in Male Basketball Players. Isokinet. Exerc. Sci. 2012, 20, 61–69. [Google Scholar] [CrossRef]
- Ostojic, S.M.; Mazic, S.; Dikic, N. Profiling in Basketball: Physical and Physiological Characteristics of Elite Players. J. Strength Cond. Res. 2006, 20, 740–744. [Google Scholar] [CrossRef] [PubMed]
- Drinkwater, E.J.; Pyne, D.B.; McKenna, M.J. Design and Interpretation of Anthropometric and Fitness Testing of Basketball Players. Sports Med. 2008, 38, 565–578. [Google Scholar] [CrossRef] [PubMed]
- McInnes, S.E.; Carlson, J.S.; Jones, C.J.; McKenna, M.J. The Physiological Load Imposed on Basketball Players during Competition. J. Sports Sci. 1995, 13, 387–397. [Google Scholar] [CrossRef]
- Ben Abdelkrim, N.; El Fazaa, S.; El Ati, J.; Tabka, Z. Time-Motion Analysis and Physiological Data of Elite under-19-Year-Old Basketball Players during Competition. Br. J. Sports Med. 2007, 41, 69–75. [Google Scholar] [CrossRef] [PubMed]
- Lockie, R.G.; Schultz, A.B.; Callaghan, S.J.; Jeffriess, M.D.; Berry, S.P. Reliability and Validity of a New Test of Change-of-Direction Speed for Field-Based Sports: The Change-of-Direction and Acceleration Test (CODAT). J. Sports Sci. Med. 2013, 12, 88–96. [Google Scholar]
- Spiteri, T.; Nimphius, S.; Hart, N.H.; Specos, C.; Sheppard, J.M.; Newton, R.U. Contribution of Strength Characteristics to Change of Direction and Agility Performance in Female Basketball Athletes. J. Strength Cond. Res. 2014, 28, 2415–2423. [Google Scholar] [CrossRef]
- Papla, M.; Krzysztofik, M.; Wojdala, G.; Roczniok, R.; Oslizlo, M.; Golas, A. Relationships between Linear Sprint, Lower-Body Power Output and Change of Direction Performance in Elite Soccer Players. Int. J. Environ. Res. Public. Health 2020, 17, 6119. [Google Scholar] [CrossRef]
- Marcovic, G. Poor Relationship between Strength and Power Qualities and Agility Performance. J. Sports Med. Phys. Fitness 2007, 47, 276–283. [Google Scholar] [PubMed]
- Brughelli, M.; Cronin, J.; Levin, G.; Chaouachi, A. Understanding Change of Direction Ability in Sport: A Review of Resistance Training Studies. Sports Med. 2008, 38, 1045–1063. [Google Scholar] [CrossRef]
- Chaabene, H.; Prieske, O.; Moran, J.; Negra, Y.; Attia, A.; Granacher, U. Effects of Resistance Training on Change-of-Direction Speed in Youth and Young Physically Active and Athletic Adults: A Systematic Review with Meta-Analysis. Sports Med. 2020, 50, 1483–1499. [Google Scholar] [CrossRef] [PubMed]
- Sassi, R.H.; Dardouri, W.; Yahmed, M.H.; Gmada, N.; Mahfoudhi, M.E.; Gharbi, Z. Relative and Absolute Reliability of a Modified Agility T-Test and Its Relationship With Vertical Jump and Straight Sprint. J. Strength Cond. Res. 2009, 23, 1644–1651. [Google Scholar] [CrossRef] [PubMed]
- Young, W.B.; James, R.; Montgomery, I. Is Muscle Power Related to Running Speed with Changes of Direction? J. Sports Med. Phys. Fitness 2002, 42, 282–288. [Google Scholar] [PubMed]
- Lockie, R.G.; Callaghan, S.J.; Berry, S.P.; Cooke, E.R.A.; Jordan, C.A.; Luczo, T.M.; Jeffriess, M.D. Relationship Between Unilateral Jumping Ability and Asymmetry on Multidirectional Speed in Team-Sport Athletes. J. Strength Cond. Res. 2014, 28, 3557–3566. [Google Scholar] [CrossRef]
- Wen, N.; Dalbo, V.J.; Burgos, B.; Pyne, D.B.; Scanlan, A.T. Power Testing in Basketball: Current Practice and Future Recommendations. J. Strength Cond. Res. 2018, 32, 2677–2691. [Google Scholar] [CrossRef]
- Scanlan, A.T.; Wen, N.; Pyne, D.B.; Stojanović, E.; Milanović, Z.; Conte, D.; Vaquera, A.; Dalbo, V.J. Power-Related Determinants of Modified Agility T-Test Performance in Male Adolescent Basketball Players. J. Strength Cond. Res. 2021, 35, 2248–2254. [Google Scholar] [CrossRef]
- Sugiyama, T.; Kameda, M.; Kageyama, M.; Kiba, K.; Kanehisa, H.; Maeda, A. Asymmetry between the Dominant and Non-Dominant Legs in the Kinematics of the Lower Extremities during a Running Single Leg Jump in Collegiate Basketball Players. J. Sports Sci. Med. 2014, 13, 951–957. [Google Scholar]
- Heishman, A.D.; Daub, B.D.; Miller, R.M.; Freitas, E.D.S.; Frantz, B.A.; Bemben, M.G. Countermovement Jump Reliability Performed With and Without an Arm Swing in NCAA Division 1 Intercollegiate Basketball Players. J. Strength Cond. Res. 2020, 34, 546–558. [Google Scholar] [CrossRef]
- Young, W.B.; Pryor, J.F.; Wilson, G.J. Effect of Instructions on Characteristics of Countermovement and Drop Jump Performance. J. Strength Cond. Res. 1995, 9, 232–236. [Google Scholar]
- Addie, C.D.; Arnett, J.E.; Neltner, T.J.; Straughn, M.K.; Greska, E.K.; Cosio-Lima, L.; Brown, L.E. Effects of Drop Height on Drop Jump Performance. Int. J. Kinesiol. Sports Sci. 2019, 7, 28. [Google Scholar] [CrossRef]
- Ryan, S.; Kempton, T.; Pacecca, E.; Coutts, A.J. Measurement Properties of an Adductor Strength-Assessment System in Professional Australian Footballers. Int. J. Sports Physiol. Perform. 2019, 14, 256–259. [Google Scholar] [CrossRef] [PubMed]
- Thomas, M.; Fiatarone, M.A.; Fielding, R.A. Leg Power in Young Women: Relationship to Body Composition, Strength, and Function. Med. Amp Sci. Sports Amp Exerc. 1996, 28, 1321–1326. [Google Scholar] [CrossRef] [PubMed]
- Hopkins, W.G.; Marshall, S.W.; Batterham, A.M.; Hanin, J. Progressive Statistics for Studies in Sports Medicine and Exercise Science. Med. Sci. Sports Exerc. 2009, 41, 3–12. [Google Scholar] [CrossRef] [PubMed] [Green Version]
- Lockie, R.; Dawes, J.; Jones, M. Relationships between Linear Speed and Lower-Body Power with Change-of-Direction Speed in National Collegiate Athletic Association Divisions I and II Women Soccer Athletes. Sports 2018, 6, 30. [Google Scholar] [CrossRef] [PubMed]
- Domaradzki, J.; Popowczak, M.; Zwierko, T. The Mediating Effect of Change of Direction Speed in the Relationship between the Type of Sport and Reactive Agility in Elite Female Team-Sport Athletes. J. Sports Sci. Med. 2021, 20, 699–705. [Google Scholar] [CrossRef]
- Ferioli, D.; Rampinini, E.; Martin, M.; Rucco, D.; La Torre, A.; Petway, A.; Scanlan, A. Influence of Ball Possession and Playing Position on the Physical Demands Encountered during Professional Basketball Games. Biol. Sport 2020, 37, 269–276. [Google Scholar] [CrossRef]
Publisher’s Note: MDPI stays neutral with regard to jurisdictional claims in published maps and institutional affiliations. |
© 2022 by the authors. Licensee MDPI, Basel, Switzerland. This article is an open access article distributed under the terms and conditions of the Creative Commons Attribution (CC BY) license (https://creativecommons.org/licenses/by/4.0/).