1. Introduction
High-strength concrete (HSC) has been widely used as a construction material owing to its high workability, strength, and durability [
1]. These properties result from using pozzolanic materials, such as silica fume, as supplementary cement materials. Although silica fume is expensive, it can improve the mechanical performance and durability of concrete [
2]. Silica fume comprises spherical particles with an average diameter of 0.03 to 0.1 μm, which is approximately 100-fold smaller than cement particles. This makes the specific surface area approximately 20,000 m
2/kg, which is 10 to 20-fold larger than that of other pozzolanic materials [
3]. Based on these properties, silica fume with ultrafine particles and low density can contribute to the densification and subsequent strengthening of concrete. For HSC and ultrahigh performance concrete (UHPC) subjected to high-density packing, their dense internal structures cause a sharp reduction in internal humidity, which may cause autogenous shrinkage. Thus, drying must be reduced to control autogenous shrinkage and cracking at early ages. However, the method of spreading external moisture to the internal structure through conventional water curing or water spray curing for concrete is ineffective for supplying moisture into HSC and UHPC [
4].
Various studies have focused on reducing the shrinkage of HSC and UHPC with dense internal structures by improving internal hydration. Bentz et al. reported that the internal curing technique for concrete using porous lightweight aggregates (LWAs) has various benefits, such as reducing shrinkage and cost [
5]. In a related study, Justs et al. increased the degree of hydration using a method similar to increasing the water-to-cement ratio inside the matrix by a hydration process using superabsorbent polymers (SAPs) and investigated the resultant internal hardening [
6]. Mechtcherine et al. and Mönnig et al. verified the mechanism through which SAP absorbs and releases moisture inside concrete [
7,
8,
9]. Rößler et al. applied the moisture absorption property of rice husk ash to UHPC and confirmed its effect on improving strength [
10]. Liu et al. applied porous aggregates comprising calcined bauxite and basalt aggregates to UHPC and proposed a method to improve matrix strength, excluding fibers [
11]. Sun et al. investigated the effect of moisture transport of porous aggregates on the shrinkage reduction and microstructure optimization of UHPC and reported a method for designing a UHPC matrix using a high-density particle packing model (Andreasen and Andersen model) [
12]. To study hydration inside UHPC with LWA for strength improvement, the hydrates generated inside specimens were detected using thermogravimetric analysis (TGA) and scanning electron microscopy–energy-dispersive X-ray spectrometry (SEM–EDS). Based on the aforementioned results, many studies have improved the hydration degree inside UHPC using porous materials.
Most of the internal curing materials currently used in UHPC are porous. The addition of SAPs and LWAs is the most commonly used method because these materials can significantly inhibit the increase in the autogenous shrinkage of UHPC and fully compensate for the initial shrinkage of concrete [
13,
14,
15]. However, SAPs and LWAs contain numerous pores, which may degrade the mechanical properties and durability of UHPC by increasing the number of pores. Therefore, pre-wetted LWAs can effectively minimize the extent of drying and autogenous shrinkage of UHPC [
16]. Bentz et al. reported that the moisture introduced into concrete by LWA can inhibit internal shrinkage and cracking as well as improve the hydration degree of the surrounding mortar, thereby improving the strength of concrete [
17,
18,
19]. Akcay et al. and Henkensiefken et al. analyzed the influence of LWA particle diameter on the internal curing efficiency and reported that hydration increases as diameter decreases [
20,
21,
22]. Van et al. proposed a mechanism to improve mechanical properties via the shrinkage reduction in concrete using rice husk ash as pre-wetted LWA because it can delay the relative humidity reduction inside UHPC and promote the continuous hydration of cement [
23]. Wang et al. examined an effective method of mitigating the autogenous shrinkage of UHPC using coral aggregates [
24]. Yang et al. conducted research to increase the internal relative humidity and decrease autogenous shrinkage by adding zeolite into cement paste with a low moisture content [
25]. The degree of hydration of UHPC through the internal curing effect of LWA has been primarily analyzed using TGA, X-ray diffraction (XRD), and SEM–EDS; however, studies on the hydration degree of the individual elements in paste, such as Si, in high-strength cement composites (HSCCs), such as UHPC, remain limited.
In previous studies [
6,
7,
8,
9,
10,
11,
12,
13,
14,
15,
16,
17,
18,
19,
20,
21,
22,
23,
24,
25], the hydration effect of various porous materials was examined to improve the internal hydration of HSC and UHPC. However, as the studies on hydration analysis using LWA have not performed thermodynamic modeling based on the hydration degree of certain elements formed in the HSCC paste, they have failed to identify the hydration tendency by age. Therefore, this study examined whether non-hydrated reactants inside HSCCs can be reduced using waste glass beads (WGBs) as LWAs based on the internal hydration mechanism of high-density concrete. In addition, WGB was subjected to pre-wetting to examine the improvement in internal hydration by water-containing aggregates, and the hydration tendency by age was identified via thermodynamic modeling. The specimens prepared by adding WGBs at ratios of 5%, 10%, and 20% were subjected to steam curing and room temperature curing. For each test group, the internal hydration effect of HSCCs was examined via uniaxial compression testing, XRD/Rietveld-based quantitative phase analysis, TGA, solid-state
29Si magic-angle spinning nuclear magnetic resonance (MAS NMR), and thermodynamic modeling. In addition to understanding the hydration level of the paste, the internal state of WGB pores was confirmed through a visual inspection of the cross-section of a test specimen mixed with WGBs and through SEM–EDS analysis.
2. Materials and Methods
2.1. Experimental Procedure
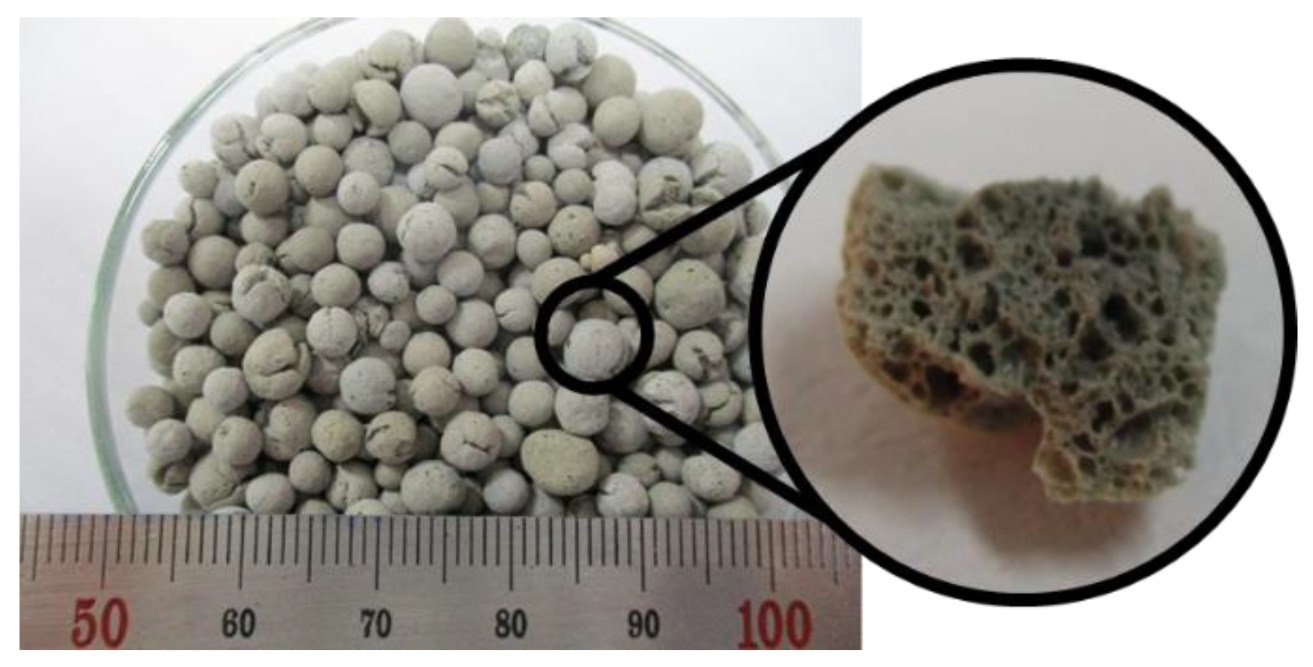
CEM Type 1 (SsangYong C&E, Seoul, Korea) of ASTM C 150-85 and silica fume (Elkem Silicones) were used as binders for the materials used to prepare the specimens. Silica powder (SAC Materials, Pure silica S-SIL 30) was used as a filler, and a polycarboxylate superplasticizer for UHPC (FLOWMIX 3000S) was used for effective mixing. WGB, which was used as an internal moisture supply medium to reduce unreacted hydrates inside the matrix, had a particle diameter of 2.00 to 6.00 mm and a dry density of 0.89 g/cm
3, as shown in
Figure 1. WGB is fabricated through a special heat treatment process at 900 °C or higher after the waste glass is collected and crushed into a finer powder. In this instance, the Si component of waste glass causes internal expansion, resulting in numerous pores inside. This fabrication process aims to recycle resources; the pores generated in the process lead to a higher water absorption rate of 13.04%. WGB was soaked in water for 48 h, and the saturated surface dry (SSD) state was used.
Table 1 lists the physical and chemical properties of WGB. In this study, reinforcing fibers and silica sand, which may act as variables, were excluded to effectively observe the formation of hydration products in specimens as a function of curing time.
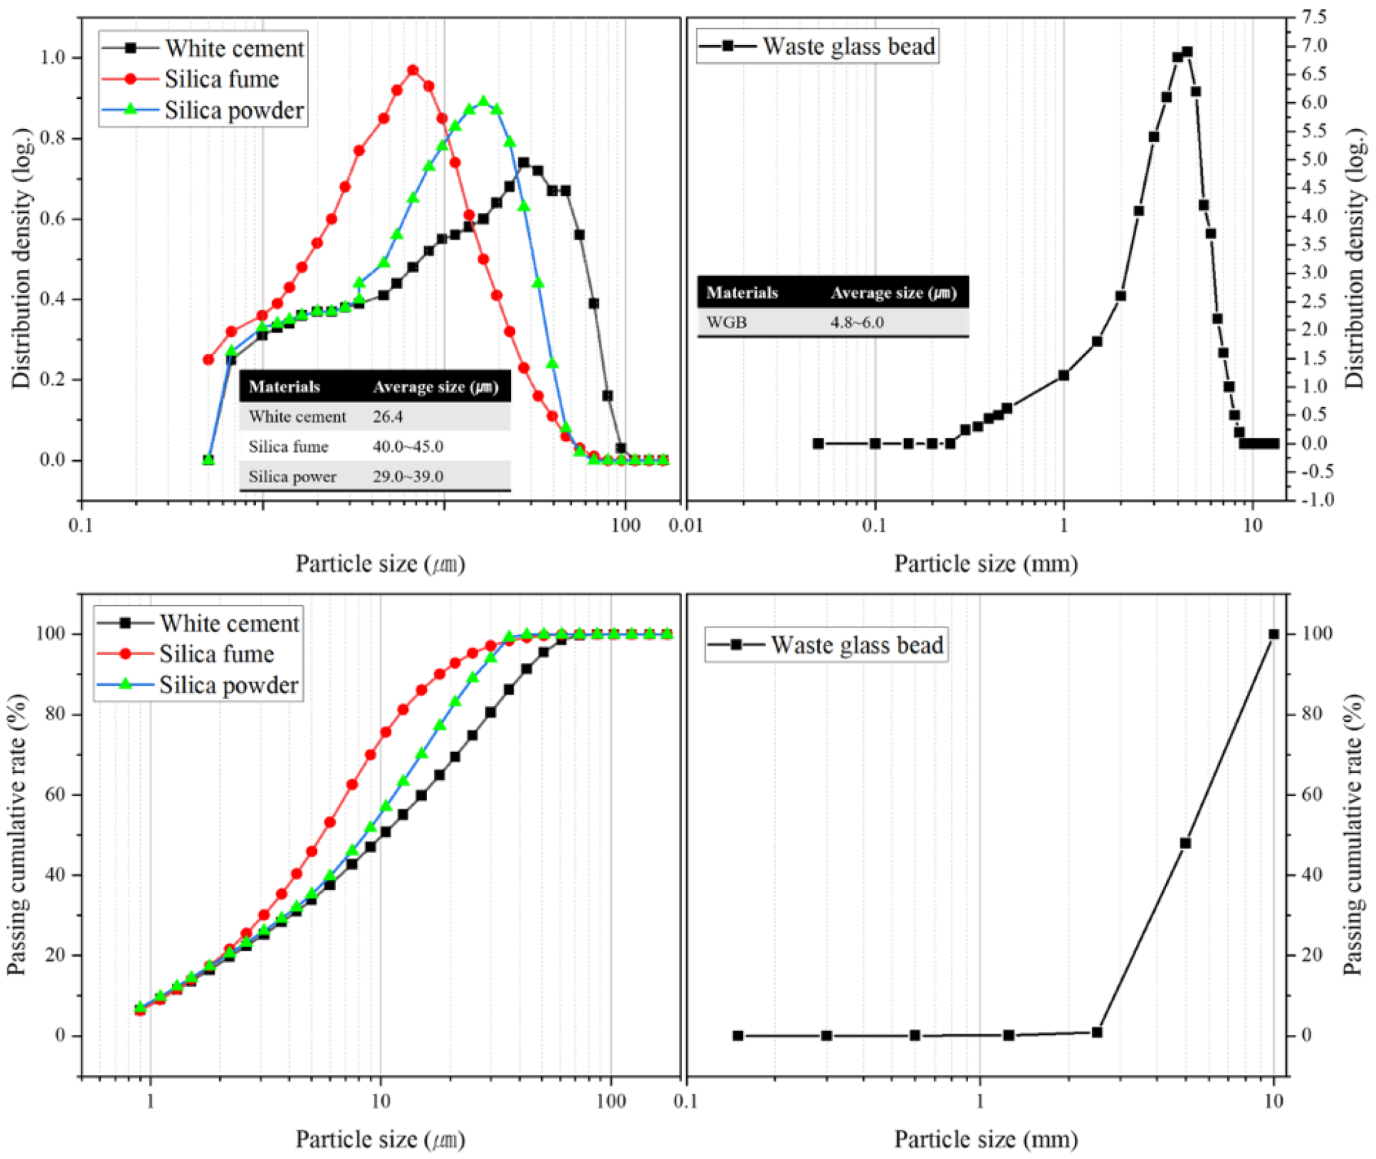
Table 2 lists the chemical compositions of the binders used to prepare specimens, and
Figure 2 shows the particle sizes of raw materials. The particle distribution of the material used for HSCCs is presented to understand the materials constituting the dense microstructure in HSCCs, which exhibit a dense internal structure with nanostructured material.
Table 2 lists the analysis results performed with the Bruker (D8 ADVANCE) equipment of Chungnam National University. This study aimed to examine the improvement in internal curing by identifying the changes in the tightly closed internal structure as a result of mixing WGB with the internal structure in which several nanosized materials exist.
Table 3 lists the mix proportions of specimens. Notations are listed to identify each specimen according to the curing condition and mixing ratio of WGB. WGB mixing ratios of 5%, 10%, and 20% were selected to activate and investigate internal curing while minimizing strength degradation that occurs when a large amount of lightweight aggregate is mixed. This was carried out by referring to a previous study [
26]. A study conducted by Elango et al. produced self-compacting concrete using diatomite aggregate and observed significant deterioration in the mechanical properties and durability when the aggregate was replaced at 5%, 10%, 15%, and 20% levels. The binders were subjected to an anhydride mix for 5 min. Next, water and admixtures were added; moreover, additional mixing was performed for 2 min to ensure complete mixing. WGB was then added and mixed for another 2 min. Upon completion of the mixing process, the fresh mixture was poured into a Ø100 × 200 mm mold. A 50 × 50 × 50 mm test piece was additionally prepared to confirm the cross-section of the specimen. The mold was sealed with a film and cured under natural conditions for 24 h. SP, S5, S10, and S20 specimens (hereinafter called “S-group specimens”) were subjected to steam curing at 80 °C for 72 h [
27] and then curing at room temperature (Temp. 20 °C, Hum. 55%), whereas RP, R5, R10, and R20 specimens (hereinafter called “R-group specimens”) were subjected to room temperature curing from the beginning. In this study, steam curing was performed to study the activation of internal curing of UHPC, a high-strength and high-performance concrete, which was compared with room temperature curing. Two types of curing environments were applied to examine the applicability of PC products in the actual field later.
2.2. Testing Methodology
For each specimen, the compressive strength was measured at the ages of 1, 3, 28, and 56 d; the density was measured at the age of 28 d; and XRD, TGA, and MAS NMR spectroscopy were conducted at the ages of 3 and 56 d. HSCC fluidity was measured in the unhardened state before a specimen was placed in the mold. The flow table method (ASTM C 1437) was used in which the mixture in a fresh state was placed on a flow table and measured after the flow stopped. The density of HSCC specimens was measured according to ASTM D 792. For compressive strength measurements, the compressive strengths of three cylindrical specimens were measured, and the average was selected as the compressive strength in accordance with ASTM C109/C109a.
Powder samples that passed through a 75 µm sieve were collected from the specimens used for compressive strength and hydrate composition measurements. When WGB was added, a 50 × 100 mm area was selected at the center of the Ø100 × 200 mm specimen, and then paste powder samples were collected. A flake-type sample was taken from the specimen destroyed by a compressive strength test using stainless steel tweezers. Subsequently, WGB was removed from the flake-type sample with stainless steel tweezers and was powdered using a mortar. To stop further hydration of the collected samples for Rietveld-refinement-based quantitative analysis, the solvent exchange method using isopropanol and ethyl ether was used as the standard condition. The samples were kept dry using silica gel until testing. The test conditions for hydration product composition analysis are as follows.
XRD was performed using a PANalytical X’Pert PRO-MPD device (DA101 at the KBSI Daegu Center), and the scan range was set to 0.02°. Measurements were obtained over a range of 5° to 70° at intervals of 3.0°.
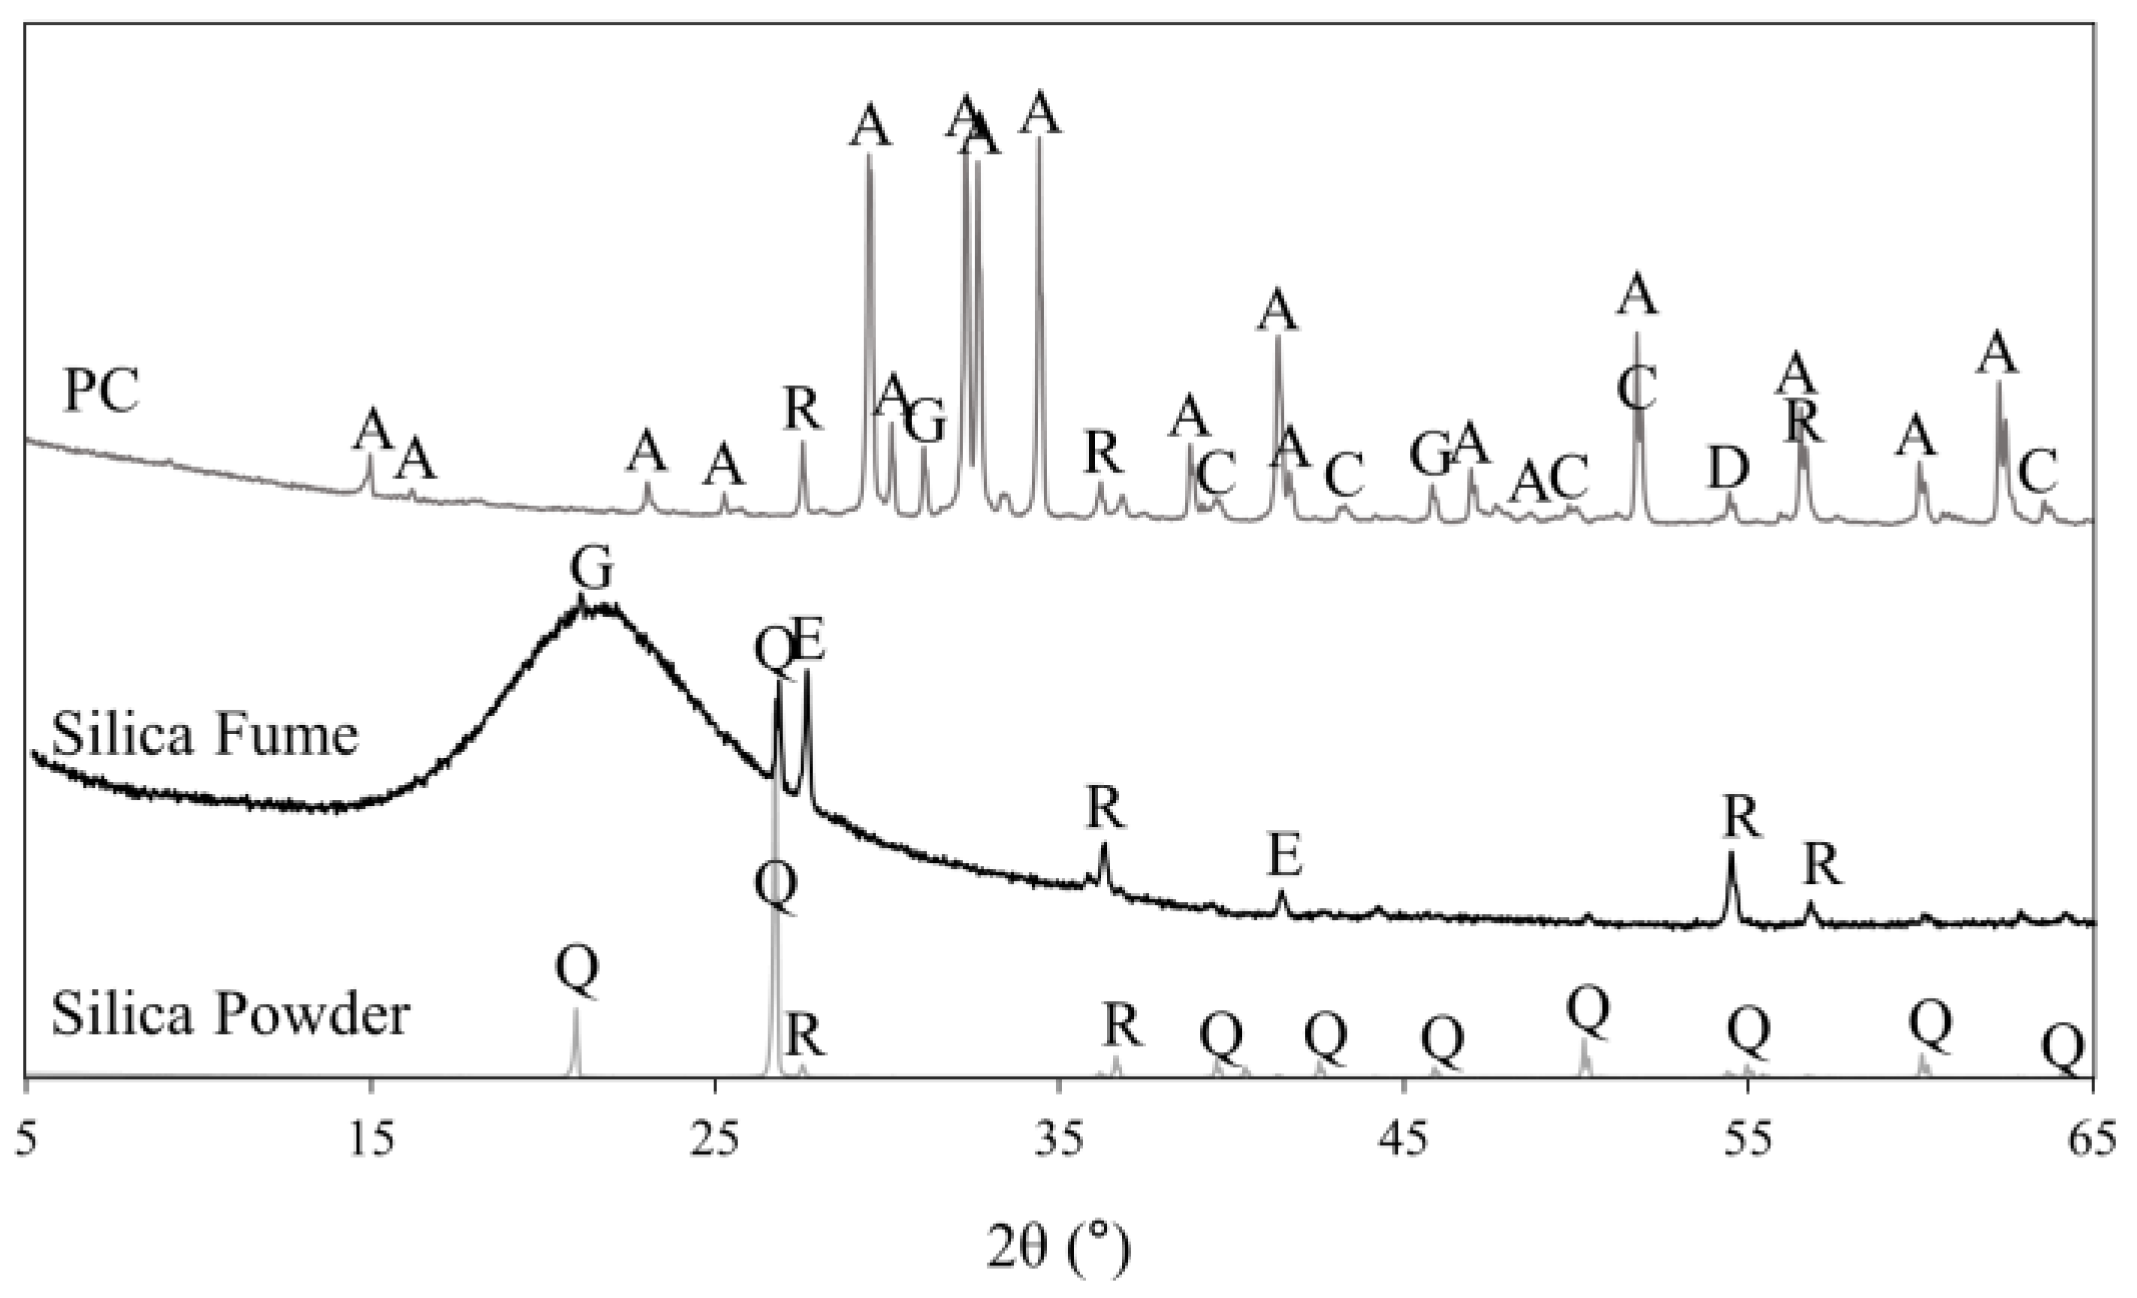
Figure 3 shows the XRD patterns of the binders used in this study. TGA was conducted at a heating rate of 10 K/min in a N
2 environment using a thermal analyzer (TA Instrument, Q600, PH407, KBSI Pusan Center). Solid-state
29Si MAS NMR was analyzed using an INOVA 600 spectrometer (KBSI Western Seoul Center). The
29Si MAS NMR spectrum was obtained at a rotation speed of 10.0 kHz, pulse width of 2.2 µs, and relaxation delay of 22 s using a 5 mm HX-CPMAS probe and 5 mm zirconia rotor.
To estimate the extent of hydration, thermodynamic modeling was performed based on the clinker reactivity obtained using the Gibbs energy minimization software GEM-Selektor v3.3 and CEMDATA 18.01 database [
28]. The reactivity model of UHPC mixed with WGBs was designed using the Rietveld refinement method and Parrot Killoh’s hydration model [
29]. This method, which tracks hydration dynamics as a function of hydration time, was used to model HSCC mixed with WGBs. The aforementioned database contains thermodynamic data as well as data for cement minerals, such as ettringite (Aft), single-phase aluminum-iron (Afm), hydrotalcite, hydrated garnet, and calcium silicate hydrate (C–S–H). The chemical composition of cement and the hydration reaction conditions defined and entered in GEMS were combined with the Parrot–Killoh model to obtain the relationship between cement hydration degree and time. The Parrot–Killoh empirical model is expressed in Equations (1)–(3). Equation (1) concerns nucleation and growth. Equation (2) concerns diffusion, and Equation (3) concerns the formation of hydration phase. The degree of hydration
α at time
t (in days) is expressed as
αt =
αt − 1 + ∆
t·
Rt − 1. The parameter values used to calculate the degree of hydration were obtained from relevant literature [
30,
31,
32,
33,
34,
35]. Equations (1)–(3) are the same as the values of
K1,
N1,
K2,
K3 and
N3 arranged by Parrott [
32].
The cross-section of the specimen was analyzed by cutting the produced specimen to half its size. SEM–EDS imaging was then performed by taking a 3 × 3 mm sample from the specimen. For SEM–EDS analysis, a HITACHI S-4800 (KBSI, Smart openlab) was used.
3. Results and Discussion
3.1. Flow Table and Density
Table 4 summarizes the constructability and density of HSCCs. The HSCCs in this study were fabricated using a high-flow admixture (superplasticizer), and the flow table method was performed after the flow stopped. The flow table of the fresh mixture state was measured as 220 mm when WGBs were not incorporated. As the incorporation rate of WGB increased, liquidity tended to decrease. S20 and R20, with a WGB incorporation rate of 20%, showed a decrease in the fluidity of approximately 50 mm. WGB is pre-wetted and has a very low probability of absorbing formulation water. The friction with the paste due to the surface texture of WGB reduces the overall workability. Although a WGB is spherical, it is produced by expanding waste glass powder and has a rough surface with many pores. According to a previous study [
36], the surface texture of aggregate affects the surface friction properties of the mixture and consequently affects the fluidity of the mixture in the fresh mixture state. Therefore, as the mixing rate of WGBs increases, the fluidity decreases owing to the friction between paste and WGBs. The HSCC density tended to decrease as the amount of WGBs mixed increased. Since WGBs have a low density, the HSCC density decreases with an increasing incorporation rate. The densities of the S- and R-group specimens were different; generally, R-group specimens had a lower density than S-group specimens. Therefore, the density decreased as the age of the WGB-mixed specimen increased and as the room temperature curing proceeded.
3.2. Compressive Strength
Figure 4 shows the compressive strength test results of the HSCC specimens mixed with WGBs. The average compressive strengths of SP, S5, S10, and S20 specimens were 120.3, 85.6, 71.8, and 67.4 Mpa, respectively. As shown in
Figure 4, the average compressive strengths of RP, R5, R10, and R20 specimens were 62.1, 50.3, 39.6, and 35.5 Mpa, respectively. The compressive strengths of cast-off specimens at 1 d of age were similar for the two test groups. The error bars in
Figure 4 indicate the 95% confidence interval.
The compressive strength of S-group specimens was approximately twice that of R-group specimens. As shown in
Figure 4, the strengths slightly increased with age even after the completion of steam curing. Since typical HSCCs are subjected to steam curing at early ages, the maximum hydration reaction occurs in the matrix during this period [
36,
37]. Therefore, high-temperature and high-pressure curing can significantly improve the mechanical properties of HSCCs [
38].
Figure 4 shows the strengths of R-group specimens. The compressive strength of RP specimen at the age of 56 d is comparable to that of S20 specimen at the age of 56 d in
Figure 4. HSCC specimens contain large amounts of silica fume and silica powder. Moreover, the reaction between them is activated only at high temperatures; consequently, steam curing at earlier stages leads to faster strength development [
38,
39]. Hence, the HSCC specimens subjected to room temperature curing showed slower strength development owing to the insufficient activation reaction of internal silica components.
WGBs reduced the compressive strengths of specimens to a certain level, and specimens with a maximum content of 20% developed approximately half the strength of the specimens without WGBs. In general, concrete mixed with LWAs contributes to a decrease in density, which tends to reduce mechanical strength [
40,
41]. The reduction in compressive strength results from the low mechanical strength of WGBs as LWAs, and the destruction of aggregates results from the increasing volume content of LWAs [
38].
If WGBs are to be used in mixing high-strength concrete and cement composites, an additional review on the mixing rate and curing method of WGBs is needed.
3.3. XRD Analysis
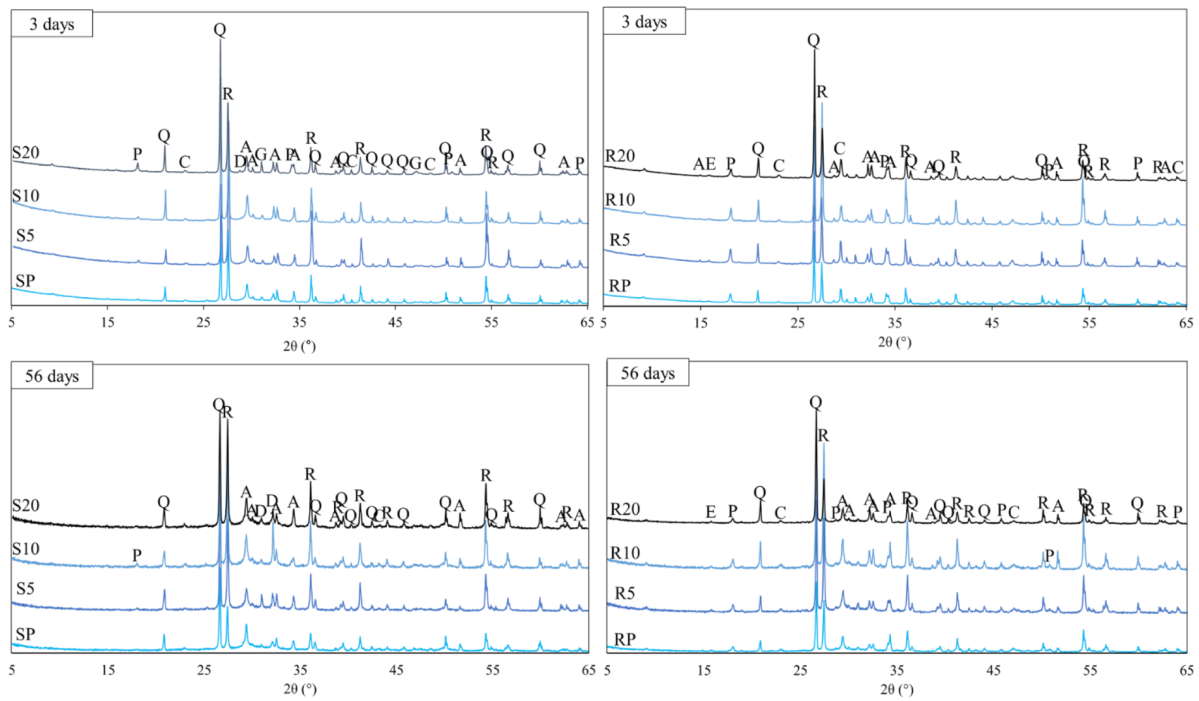
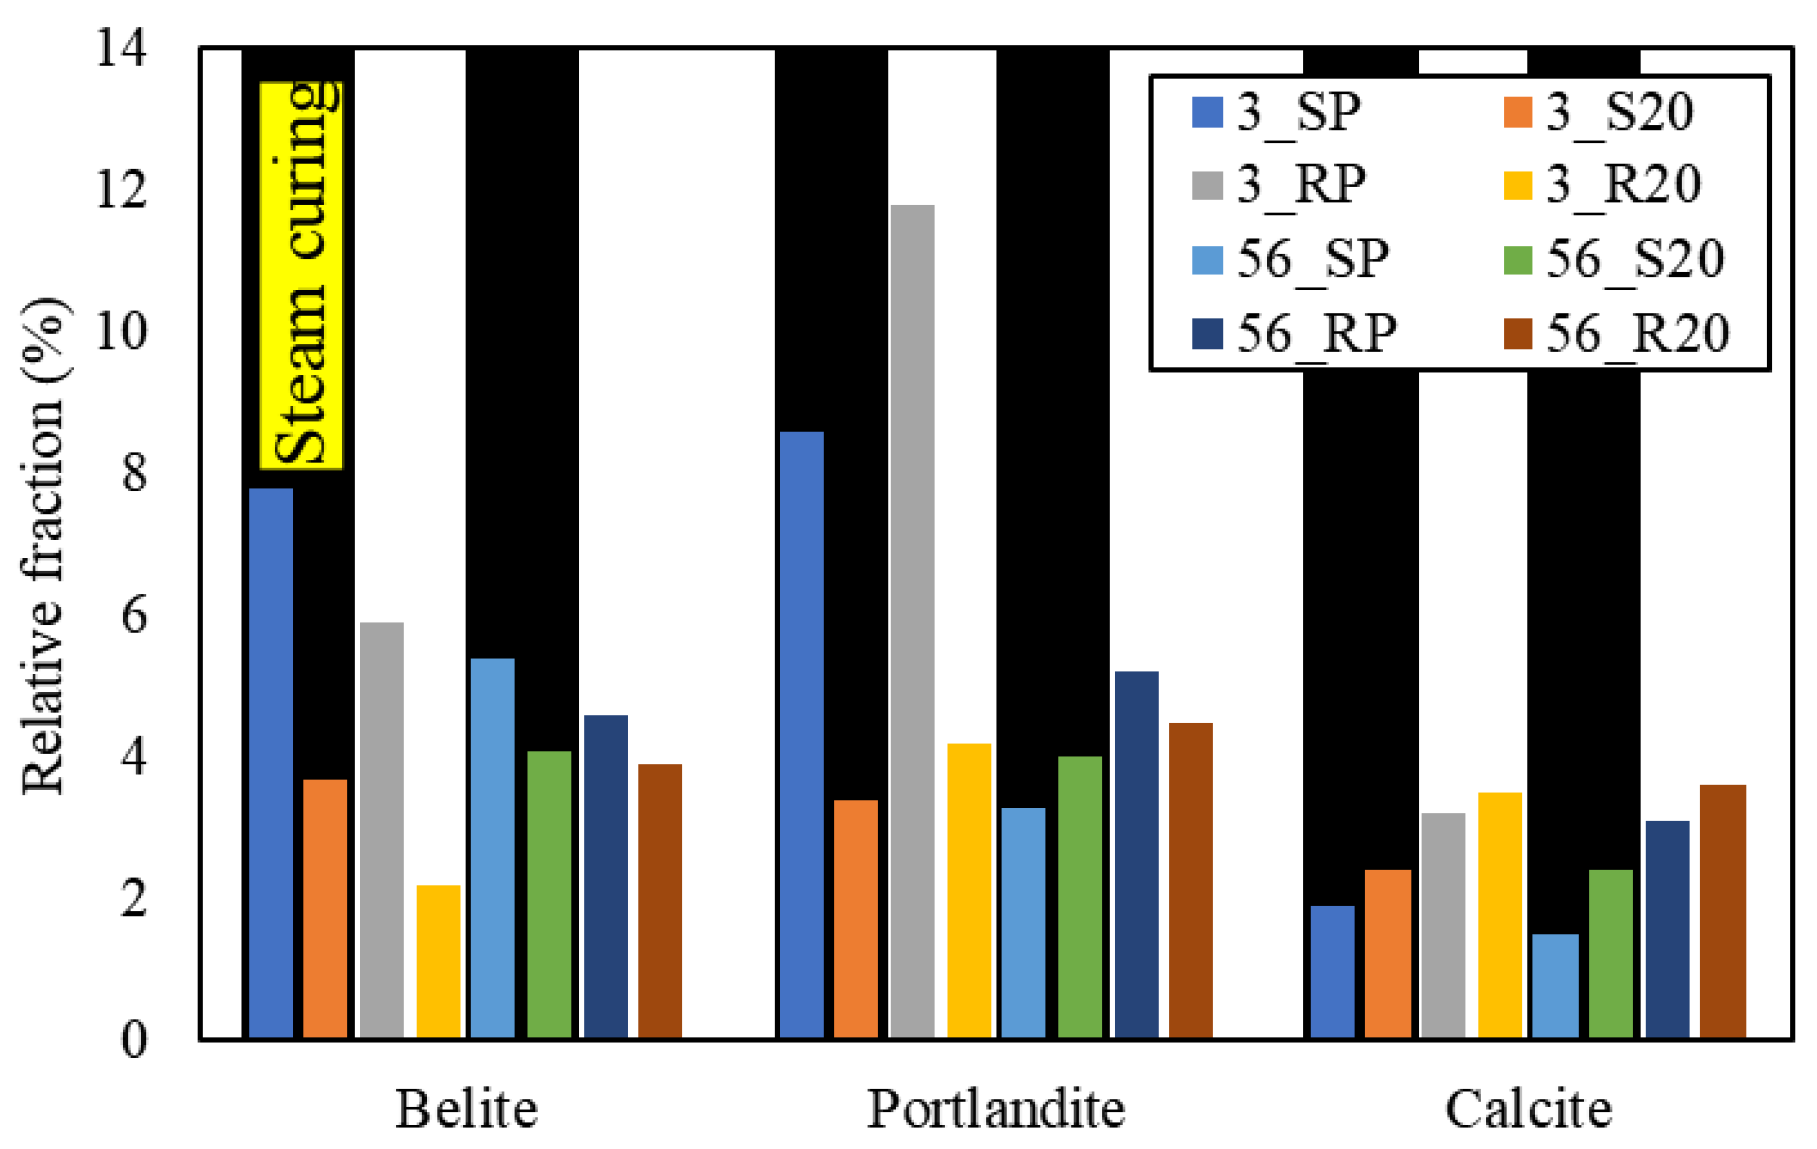
Figure 5 shows the representative XRD patterns of the HSCC specimens that used WGBs at the ages of 3 and 56 d. Belite was the major hydration product of most samples. In some peaks, calcite, which is part of the cement raw material, and portlandite, which is generated by humidity during curing, were observed. Rutile was observed along with quartz, and it was used as an internal standard sample to ensure the internal standard mixing amount [
42]. S-group specimens had similar hydration products regardless of age. The peak increase or decrease was similar because the initial hydration reaction was maximized during steam curing. For S-group specimens, the peak intensity of the specimens with a WGB content of 10% or 20% was observed to increase with age. The peak of portlandite at 18.0° changed with increasing WGB content and age. This appeared conspicuously in R-group specimens, and the internal moisture is expected to remain during curing. In R-group specimens, some belite was found regardless of age. Belite was measured at 16.2°, and the peak occurred regardless of WGB content. The proportion of belite generated in samples at the age of 3 d tended to increase with WGB content; this can be observed at 32.5°, 51.6°, and 38.0°. The proportion of belite detected in samples at the age of 56 d was the highest in the R10 sample; this can be noticed at 29.5°, 32.0°, 32.3°, 34.8°, and 52.0°. R10 specimen exhibited somewhat higher peak intensities than other samples at the ages of 3 and 56 d, probably because the WGB content of 10% improved the hydrate formation rate in the paste matrix.
For the samples analyzed using the internal standard method, the quantification results of calcium hydroxide obtained through the normalization of anhydride are as follows. For SP, S5, S10, and S20, the measurements at the age of 3 d were 0.2%, 0.2%, 0.3%, and 1.5%, respectively; moreover, the measurements at the age of 56 d were 0.1%, 0.3%, 0.2%, and 0.2%, respectively. For RP, R5, R10, and R20, the measurements at the age of 3 d of age were 2.9%, 1.9%, 4.2%, and 4.5%, respectively; moreover, the measurements at the age of 56 d were 1.5%, 1.0%, 1.2%, and 1.2%, respectively.
Figure 6 shows the results of quantitative analysis according to the Rietveld results of XRD. The fractions of clinker and hydrate production were obtained at the ages of 3 and 56 d; moreover, SP, S20, RP, and R20 were analyzed. When the mixing amount of WGBs and the amount of water captured were the same, the level of internal constituent materials verifiably differed based on steam curing and room temperature curing.
3.4. TGA
Figure 6 shows the derivative TG/TGA (DTG/TGA) results of HSCC specimens at the ages of 3 and 56 d, respectively. The weight loss at 100 °C or less was caused by the dehydration and decomposition of bound water and ettringite [
43]. At the age of 3 d, SP and R10 specimens showed the highest weight losses, which were 2.53% and 3.69%, respectively. At the age of 56 d, S20 and R10 specimens exhibited the highest weight losses, which were 3.24% and 2.79%, respectively. The weight loss observed in the range of 250–280 °C is due to the decomposition of aluminum hydroxide [
44]. Among S-group specimens at the age of 56 d, S10 and S20 specimens showed thermal decomposition and mass losses of 2.22% and 2.32%, respectively. As WGB content increased, the weight reduction in samples increased, and a more dynamic difference was observed in room temperature curing than in steam curing. According to
Figure 7, at the age of 3 d, the SP sample had the highest weight loss. However, according to
Figure 8, at the age of 56 d, the S20 sample had the largest weight reduction with a WGB content of 20%. Pre-wetted WGBs reduced the strength owing to the nature of LWAs, but the water contained inside contributed to the hydration reaction in the matrix, as confirmed by the difference in the TGA of the generated hydrates.
The R10 sample exhibited a weight loss similar to that of R20 at an early age, but it had the highest weight loss of all samples at the age of 56 d. This indicates that most hydrates were formed in the R10 sample, which is obvious in its XRD peak intensity. Moreover, the hydration degree of the specimen with a WGB content of 10% was higher in the case of room temperature curing. In addition, in S-group specimens, those specimens with the highest weight losses at the ages of 3 and 56 d were SP and S20, respectively. This indicates that internal curing is more effective as age increases and is considered to influence the improvement of the internal curing of WGB after steam curing. R-group specimens showed proportional results with increasing weight loss and increasing WGB mixing rate as age increased. Thus, internal curing by WGBs was performed in R20, in contrast to RP, which was sealed inside as age increased.
Considering a major weight loss, the AFm phase-related dehydration of C–S–H and ettringite occurs at 100 °C or less; moreover, the evaporation of bound water in the physically bound matrix occurs at 130 °C. Dehydroxylation of portlandite then occurs until 400–450 °C, followed by the decarbonation of calcium carbonate and unreacted clinker between 500 and 700 °C [
45,
46,
47,
48]. At an early age, portlandite was apparently consumed for some level of hydration as age increased, confirming the occurrence of pozzolanic reaction. This led to a larger change in R-group specimens, and the consumption of portlandite increased as WGB content increased. All samples showed similar tendencies, indicating that significant initial hydration occurred because of the curing environment, such as steam curing.
Table 5 summarizes the relative weight loss due to the dehydration of C–S–H and ettringite, dehydroxylation of portlandite, and decarbonation of unreacted clinker. The weight loss trend below 200 °C clearly decreased with long-term age, and the decrease rate was larger in the case of steam curing specimens. The ratio of Ca(OH)
2 produced was similar for both steam curing and room temperature curing on the 56th day. The amount of CaCO
3 clearly decreased with time due to long-term aging, and the decrease was large in the specimens subjected to steam curing.
3.5. Solid-State 29Si MAS NMR Spectroscopy
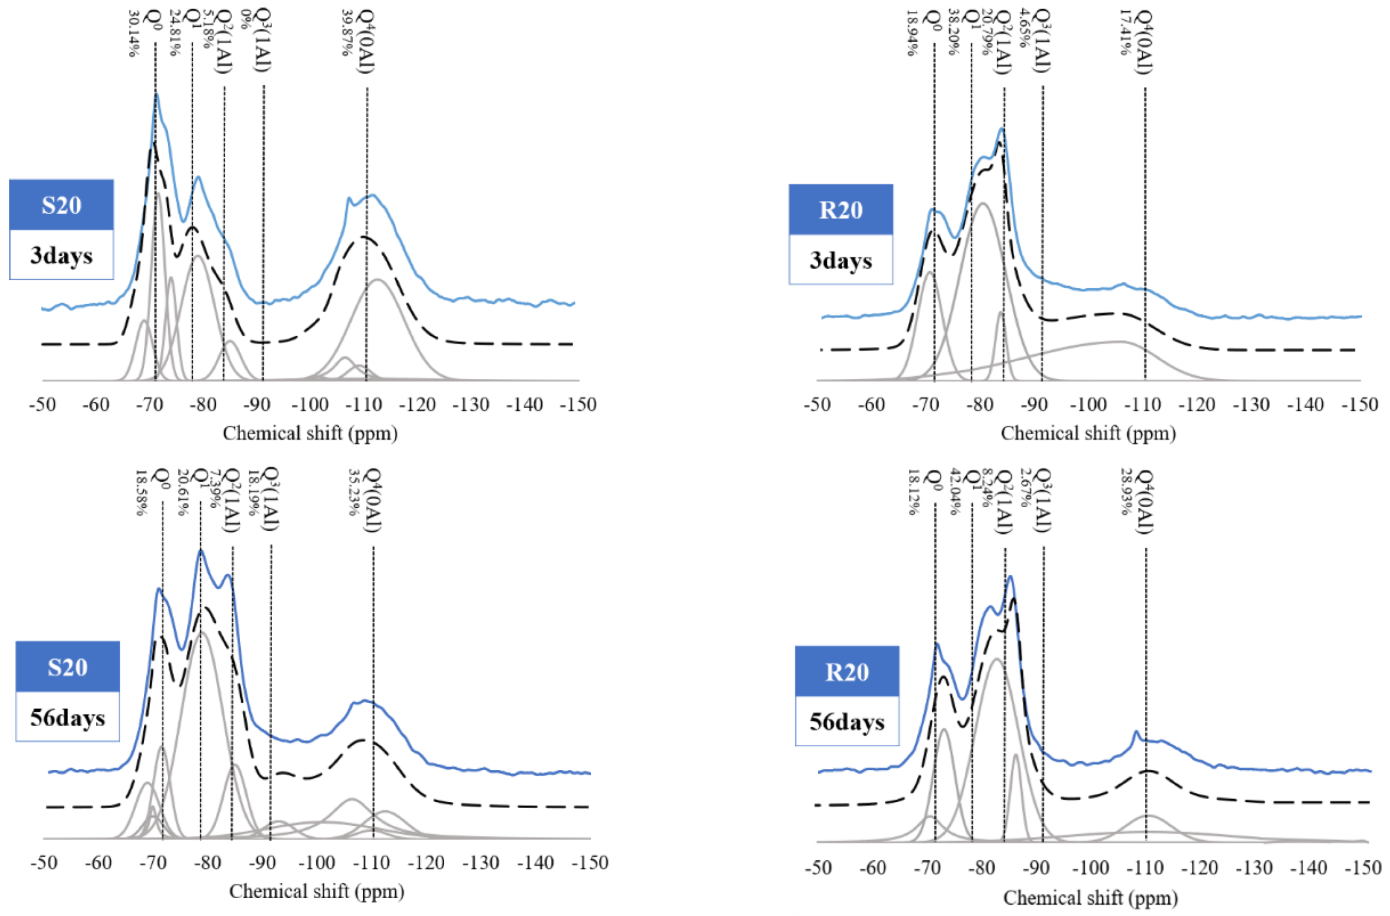
Figure 8 shows the
29Si MAS NMR analysis spectrum of HSCCs mixed with WGBs. Spectral deconvolution was performed using OriginPro software after selecting the number of characteristic peaks by referring to the existing literature. The simulation was repeated until the chi-square estimated by emulating each peak using Gaussian and Lorentzian functions reached 10
−6 [
49].
Since typical HSCCs are subjected to steam curing, the NMR of S20 and R20 samples was measured based on the sample with a WGB content of 20% that exhibited the highest C–S–H hydrate formation rate among S-group specimens. This choice was based on the dehydration of AFm and the mass reduction rate of the AFt phase that occurred with increasing age, as listed in
Table 4.
Among the raw materials used for producing HSCCs, the amorphous component of cement showed a narrow resonance at −71.3 ppm related to Q
0, which is the peak related to belite (C
2S) [
49,
50]. The relative Q
0 site area of the S20 sample shown in
Figure 8 (3 d) significantly decreased after 56 d. Hydrates that occur at the beginning of curing show that most of the hydration was completed during steam curing, and all remaining hydrates that occur with increasing age indicate the completion of hydration. The R20 sample in
Figure 8 (56 d) showed a relatively larger area than that of the S20 sample in
Figure 8 (3 d); moreover, initial hydrates were observed due to the hydration of cement during the standard curing period.
The resonance of Q
1 and Q
2 occurred at −79 and −85 ppm, respectively. This section confirmed the existence of Si chains in the C–S–H gel. For the S20 sample in
Figure 8 (3 d) and the R20 sample in
Figure 8 (56 d), the relative area increased with age. For S20 specimen, Q
1/Q
2 were 2.78 and 5.10 at the ages of 3 and 56 d, respectively; for R20 specimen, Q
1/Q
2 were 4.79 and 1.84 at the ages of 3 and 56 d, respectively. Generally, a more pozzolanic reaction occurs as Q
1/Q
2 decreases for HSCCs [
50,
51,
52,
53,
54]. Q
1/Q
2 values show that the initial extent of pozzolanic reaction was higher for S20, and the extent of pozzolanic reaction gradually increased with age for R20. Hence, the peak intensity near 420 °C related to CH decomposition can be observed by referring to the DTG analysis in
Figure 7 (R-Deriv. weight). C–S–H decomposition near 420 °C in
Figure 7 (R-Deriv. weight) decreased with age, which portrays the decreasing extent of the internal pozzolanic reaction [
50]. In the
29Si MAS NMR analysis results for HSCCs, silica fume displayed a peak at −109.1 ppm related to Q
4, and silica powder displayed a peak at −112.5 ppm, representing the presence of micro-silica [
54,
55]. In
Figure 8 (56 d), a significant amount of micro-silica remained owing to the low pozzolanic reaction of the silica powder component in the R20 sample, but more pozzolanic reaction occurred as age increased. A similar tendency can be observed from the S20 sample in
Figure 8 (3 d).
For the S20 sample, the hydration degree of Si at the age of 3 d tended to increase with age; in particular, it was approximately 4-fold higher at the age of 56 d than that at the age of 3 d. For the R20 sample, the hydration degree of Si was approximately 5-fold higher at the age of 56 d than that at the age of 3 d. In the NMR results for the same WGB content and age, Q1, Q2, and Q3 had higher intensities in the steam curing environment than that in the standard curing environment. This indicates that the moisture inside pre-wetted WGBs can improve the hydration degree of Si in the specimen in a steam curing environment.
3.6. Thermodynamic Modeling
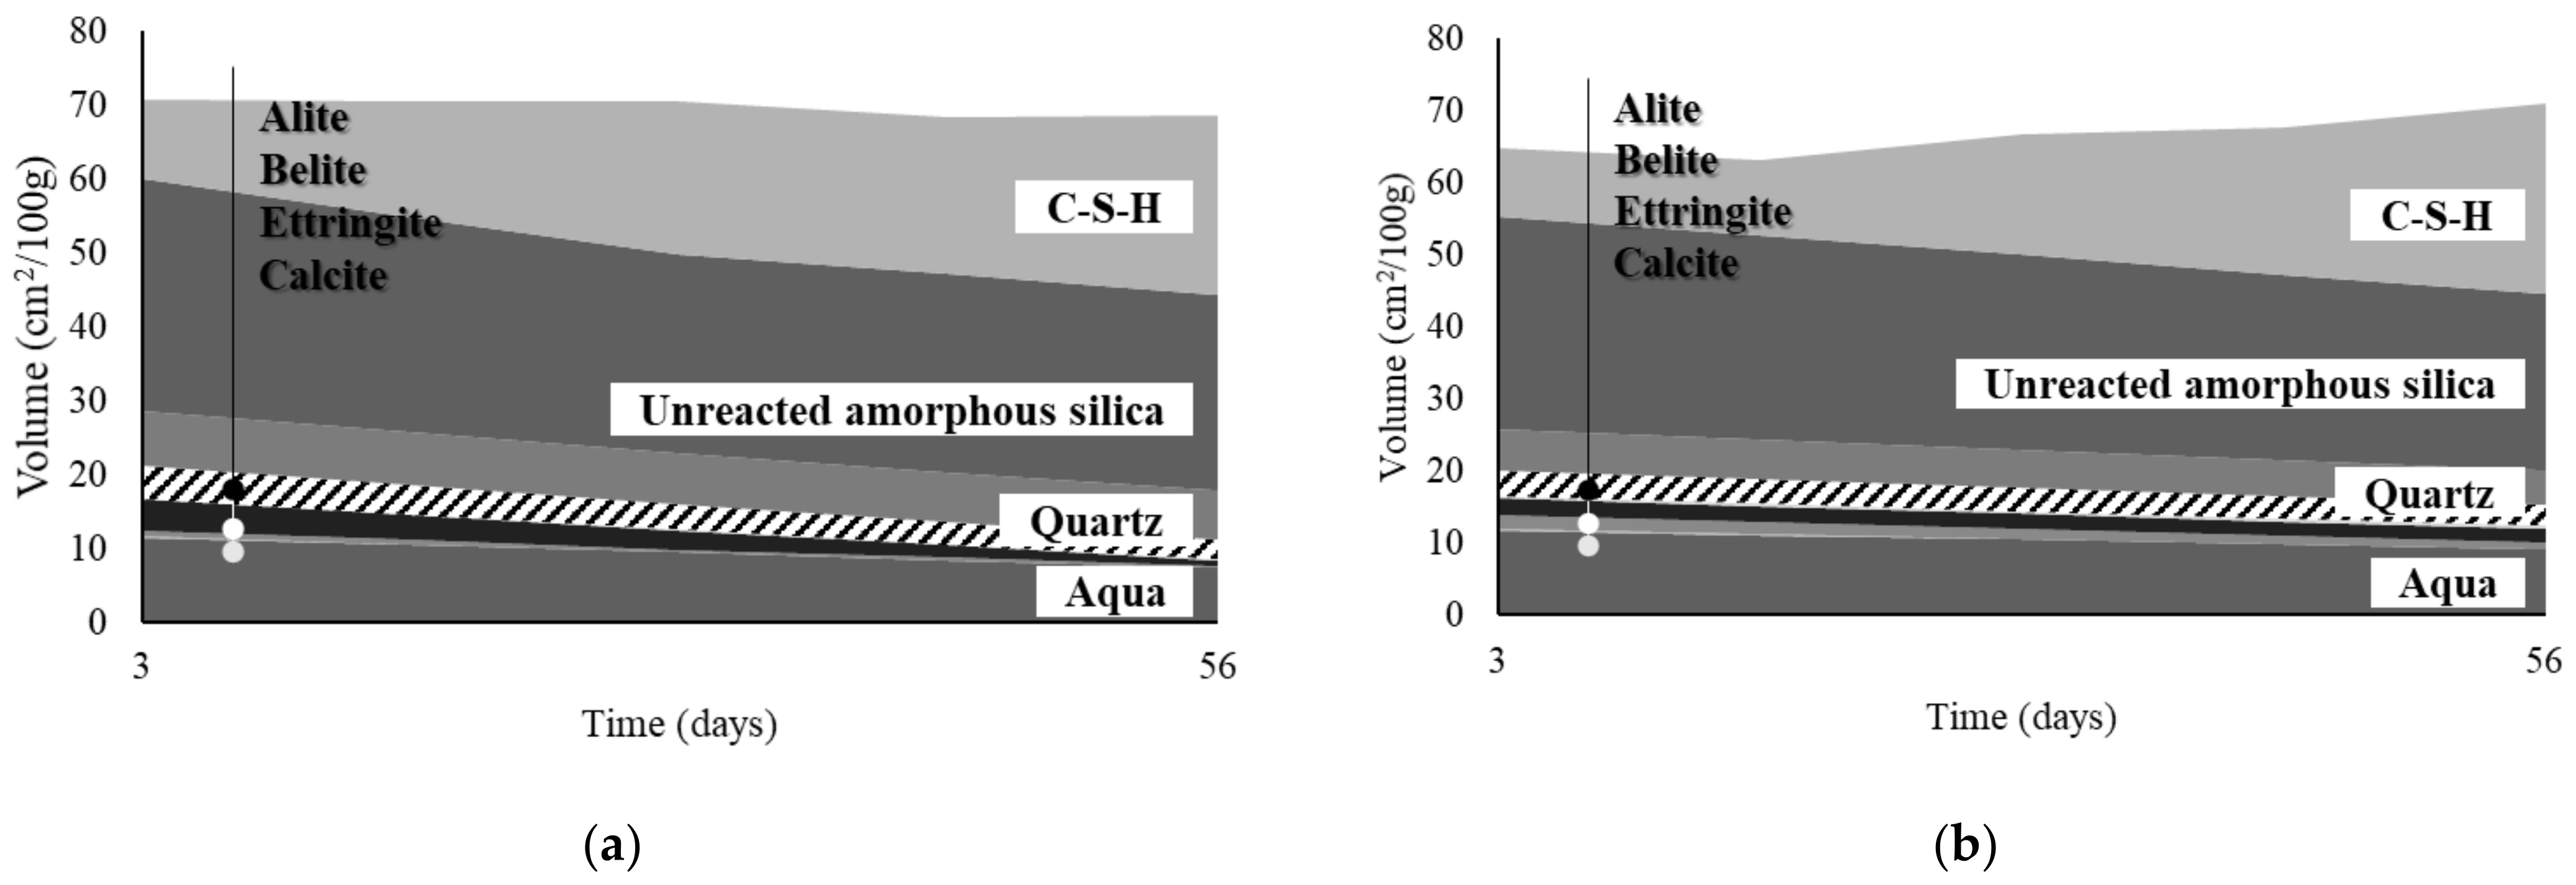
Figure 9 shows the thermodynamic modeling results of the S20 and R20 samples as a function of age. Thermodynamic modeling excluded the influence of the temperature parameter applied to specimens during the initial steam curing and simply calculated the total amount of hydrates produced in specimens. The major hydration products of the two samples were predicted to be ettringite, mono sulfate, C–S–H, and portlandite; moreover, the analysis was conducted based on the Rietveld method. The results showed that the volume of the solid in the gel phase increased as the hydration reaction progressed inside the samples mixed with pre-wetted WGBs, which agreed with the XRD and
29Si MAS NMR results.
The total volume of the S20 sample was approximately 10% larger than that of the R20 sample at the age of 56 d because the generated hydrates had different volumes. The volume of C–S–H gel was larger in the S20 sample at all ages. The change in the Ca/Si ratio of C–S–H is closely related to the presence and consumption of portlandite, which shows that the ratio begins to decrease as portlandite is completely consumed [
56,
57]. This change occurred earlier in the S20 sample. Some discrepancies between the experimental results and thermodynamic calculations can be considered errors caused by the absence of the AFm phase [
20,
48]. When the same level of WGB was added, the difference in the volume content of solid hydrates caused by the difference in the curing environment could be observed, and the generation of C–S–H gel is expected to increase as the curing period increases. In addition, the finding that a certain amount of internal moisture was maintained indicates that pre-wetted WGBs contributed to continuous internal hydration during the curing period by releasing moisture.
3.7. Cross-Sectional Analysis of Specimens
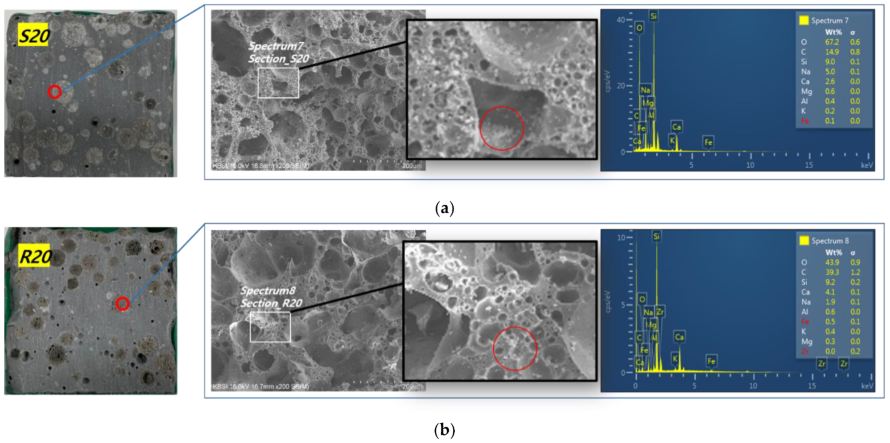
Figure 10 shows the cross-section of a specimen mixed with WGBs at the age of 56 d, confirming the distribution of WGBs inside the specimen and the moisture inside WGBs. For S20, numerous white products were formed inside WGBs. These products were heterogeneous substances with gel-like aggregates. Some WGBs still had residual moisture, which could be confirmed with the naked eye. WGB pores were filled with hydrates by the moisture captured in WGBs. SEM analysis confirmed internal voids; a large amount of C–S–H gel was formed on the pore surface. For R20, moisture was confirmed to remain inside WGBs when the cross-section of the specimen was visually checked. SEM and SEM–EDS analyses of WGBs confirmed that the intensity of the spectrum was lower than that for S20. These results were similar to those of thermodynamic modeling. Thermodynamic modeling confirmed the hydration tendency of paste except in the case of WGB; however, even in the case of WGB, hydration tendency can be considered similar to that inside the pores of paste and WGBs connected by micropores. In addition, when steam curing was performed and when the absorbed water in WGB was mixed, the hydration tendency inside WGB was higher. Therefore, microstructure hydration could be improved by combining the mixing of captured WGBs and steam curing to effectively improve the internal curing of HSCCs. In addition, this trend was confirmed by the tendency for forming hydrates in pores similar to that of Beyene et al. and Zhang et al. [
58,
59]. Beyene et al. identified the hydrate form and content level through SEM-EDS, which was similar to that found around R20 WGB analyzed in this study. S20 has high silica (Si) and the calcium (Ca), magnesia (Mg), and alumina (Al) contents are up to 3-fold higher than that in R20. It was found that there was a difference in the amount of hydrate formed in the surface pores of WGB as hydration was promoted by steam curing. A study by Zhang et al. confirmed the formation of abundant hydration products in the vicinity of LWA due to water released from LWA. This study found that the analysis results of the formation of hydrates generated around WGB and surface voids were similar to the results of thermodynamic modeling analyzed in
Section 3.6. Accordingly, the curing water released by the WGB promotes hydration of the cement particles around it and makes the particle spacing denser.
The experimental results of this study revealed that WGBs used in HSCCs could improve internal hydration reactions. The curing method for HSCCs mixed with WGBs was demonstrated to affect the number of hydration products based on age, which may also influence the extent of strength development. In the case of steam curing, strength development and internal hydrate formation levels at early ages were almost twice that of room temperature curing at the age of 56 d. Even after completing steam curing, the proportion of unreacted silica inside was partially reduced, and the internal moisture content was maintained at a certain level by pre-wetted WGBs. Therefore, WGBs could contribute to reducing unreacted hydrates inside HSCCs.
4. Conclusions
This study used WGBs as LWAs to improve the internal hydration degree of HSCCs that use ultrafine particles. Moreover, internal hydration characteristics were investigated for different aging durations. The correlation between the presence of pre-wetted WGBs and internal hydration was established. The results of this study are summarized as follows.
The compressive strength of HSCC specimens decreased as WGB content increased, regardless of the curing environment. This was due to the low mechanical strength of the added WGBs; strength decreased as the volume content of WGBs increased.
From XRD pattern analysis results, S-group specimens showed similar reactant peak tendencies regardless of age. In R-group specimens, as WGB content increased according to age, the production of products, such as belite, also increased.
From TGA results, S20 specimen exhibited the highest weight loss at the age of 56 d in the section below 200 °C. Based on these results, NMR spectrum analysis was conducted for S20 and R20 specimens; the extent of pozzolanic reaction increased as the Q1/Q2 ratio decreased.
The interactions among the major hydration products inside the matrix were identified through thermodynamic modeling. The volume of the generated hydrates differed depending on the curing environment, and a large difference in the amount of C–S–H gel generated was confirmed at an early age. R20 specimen exhibited hydrate proportions similar to those of S20 specimen with increasing age.
The residual moisture trapped inside WGB was confirmed through cross-sectional imaging of the specimen and SEM–EDS analysis. The amount of hydrates produced by S20 and R20 confirmed through EDS analysis was found to have a difference of up to 3 fold in the Si, Ca, and Al content. Moreover, the hydration tendency inside WGB was similar to that in thermodynamic modeling.
The XRD, TGA, 29Si MAS NMR, and SEM–EDS results of the HSCC paste mixed with WGBs subjected to steam curing and room temperature curing showcased varying formation of hydrates, including C–S–H gel. These results agreed with the results of thermodynamic modeling. This study also confirmed the effect of internal curing by WGBs. However, the compressive strength tended to decrease with the addition of WGBs owing to the prior damage and poor mechanical properties of WGBs. Therefore, an analysis of the hydration products formed inside WGB micropores is required. Moreover, further research is required in the future to decrease the influence of WGBs on strength by adjusting the geometry and size of WGBs or by selecting a more suitable LWA than WGB. This will help improve the hydration degree in a highly densified matrix, such as UHPC.


