Article

Compressive-Strength Analysis of High-Strength Cementitious Composites Mixed with Red and Green Pigments

1
Department of Architectural Engineering, Chungnam National University, 99 Daehak-ro, Yuseong-gu, Daejeon 34134, Korea
2
Department of Building Research, Korea Institute of Civil Engineering and Building Technology, 283 Goyang-daero, Ilsanseo-gu, Goyang-si 10223, Gyeonggi-do, Korea
3
MIICON, 17–14 Purundeulpan-ro 567beon-gil, Paltan-myeon, Hwaseong-si 18529, Gyeonggi-do, Korea
*
Author to whom correspondence should be addressed.
Appl. Sci. 2022, 12(15), 7667; https://doi.org/10.3390/app12157667
Submission received: 7 July 2022 / Revised: 27 July 2022 / Accepted: 27 July 2022 / Published: 29 July 2022
(This article belongs to the Special Issue Advanced Fiber-Reinforced Cementitious Composites)

Abstract

:
We estimate the mechanical properties of pigment-containing ultra-high-strength cement composites (UHSCCs) and the pigment-induced changes in their physical properties via thermal and X-ray diffraction analyses. Hydrates in samples are analyzed using thermogravimetry. Additionally, the change in color expression with the UHSCC age is examined via the Commission Internationale de l’ Éclairage L*a*b* analysis. Correlation analysis is performed to determine linear relationships between experimental factors by calculating R2. A change in hydrate expression is confirmed as the strength increases with age. The pigment used affects the change in hydrate expression as well as color development. Correlation analysis of the results for all ages reveals that 5% red pigment mixing yields the highest R2 of 0.9858 in intensity-a*. The case of 10% red pigment mixing yields the lowest R2 of 0.5229 in intensity-b*. According to the amount of pigment used, we believe that quantitative results can be obtained by considering L* (contrast), rather than the relationship between intensity and color components. The appropriate mixing ratio based on the intensity expression of the red pigment is 3–8%, and the green pigment intensity and strength expression are inversely proportional. Our results can serve as a guideline for the performance development of pigmented cement-based composites.

1. Introduction

Unique building spaces have been developed over the years [1], and the construction of such buildings requires unique materials such as colored concrete. However, the addition of excessive amounts of pigments for coloration may degrade the workability and compression performance of concrete [2,3,4] because the pigments absorb the water required for cement hydration. Because the particle size of inorganic pigments is generally smaller than that of cement, the specific surface area of pigment particles in contact with moisture is larger, and the addition of excessive amounts of pigments can deteriorate the mechanical properties of concrete [5,6]. Therefore, to minimize the reduction in strength or performance when pigments are added to concrete, white cement is typically used for color development.
Various concrete products, such as precast concrete (PC), that can be customized with distinct colors have emerged in the construction industry [7]. Existing colored concrete products are evaluated based on three factors: brightness, saturation, and hue. The quantification of hues is necessary to standardize colored concrete products [8,9]. Colored concrete, mainly produced by mixing pigments or using colored materials, is widely used in interior and exterior spaces. Its usability has been low because of its high cost and color durability caused by the mixing of pigments. Nevertheless, the demand for colored concrete is increasing with the increasing interest in designability [10].
Fine pozzolanic materials, such as ultra-high-strength concrete and ultra-high-performance concrete (UHPC), have been developed for use in interior and exterior finishing materials [11,12,13,14,15]. High-strength and high-toughness UHPC products can be used to realize shapes and colors in various environments because of the maximum hydration reaction induced by the initial steam-curing process. High-purity UHPC and binders with large specific surface areas increase the strength of conventional concrete because of the fast pozzolanic reaction of silica fume [16]. Gopinath et al. revealed that mixing concrete with nano-silica increases its mechanical strength [17]. Schmidt et al. found that materials with a large specific surface area can be added to UHPC to increase the internal density or prepare high-strength concrete specimens with a low water content [18]. Fe2O3, a reddish-brown iron oxide, has been used as a nanoscale pigment. The addition of reddish-brown marble powder containing Fe2O3 enhances the compressive strength in most curing periods as the pigment content decreases. Nazari and Riahi reported that the mechanical properties of concrete containing Fe2O3 were enhanced because of an increase in the nanoparticle content. Strength tends to increase when a moderate amount of pigment is added. However, when pigments are added in large quantities, the mechanical properties are affected because the moisture content in the material decreases [19,20,21,22]. Colored concrete can be used as an alternative material in challenging architectural designs and applications for multi-purpose features, including aesthetic elements. However, the mechanical properties of such materials need to be enhanced further [20]. Therefore, the properties of colored concrete with improved durability and color development must be evaluated for satisfying consumer demands resulting from an increase in the diversity of PC products. However, existing studies have not examined the hydration properties of pigment-added concrete.
In this study, various analyses were performed to confirm the hydration properties of concrete containing pigments. To this end, colored ultra-high-strength cementitious composites (C-UHSCCs) mixed with red and green inorganic pigments were fabricated, and their strengths were measured according to their age and hydration state. X-ray diffraction (XRD) and thermogravimetric (TG) analyses [23] were performed to determine the difference in hydration products due to the increase in the amount of pigment used, degradation of certain products, and color difference (ΔE). Subsequently, correlation analysis was performed to examine the relationship between strength expression and other measurement factors according to age and mixing rate. A linear relationship between the properties of colored concrete and cement composites mixed with pigments was identified. This relationship is expected to be utilized in color concrete manufacturing and research.

2. Experimental Design and Methodology
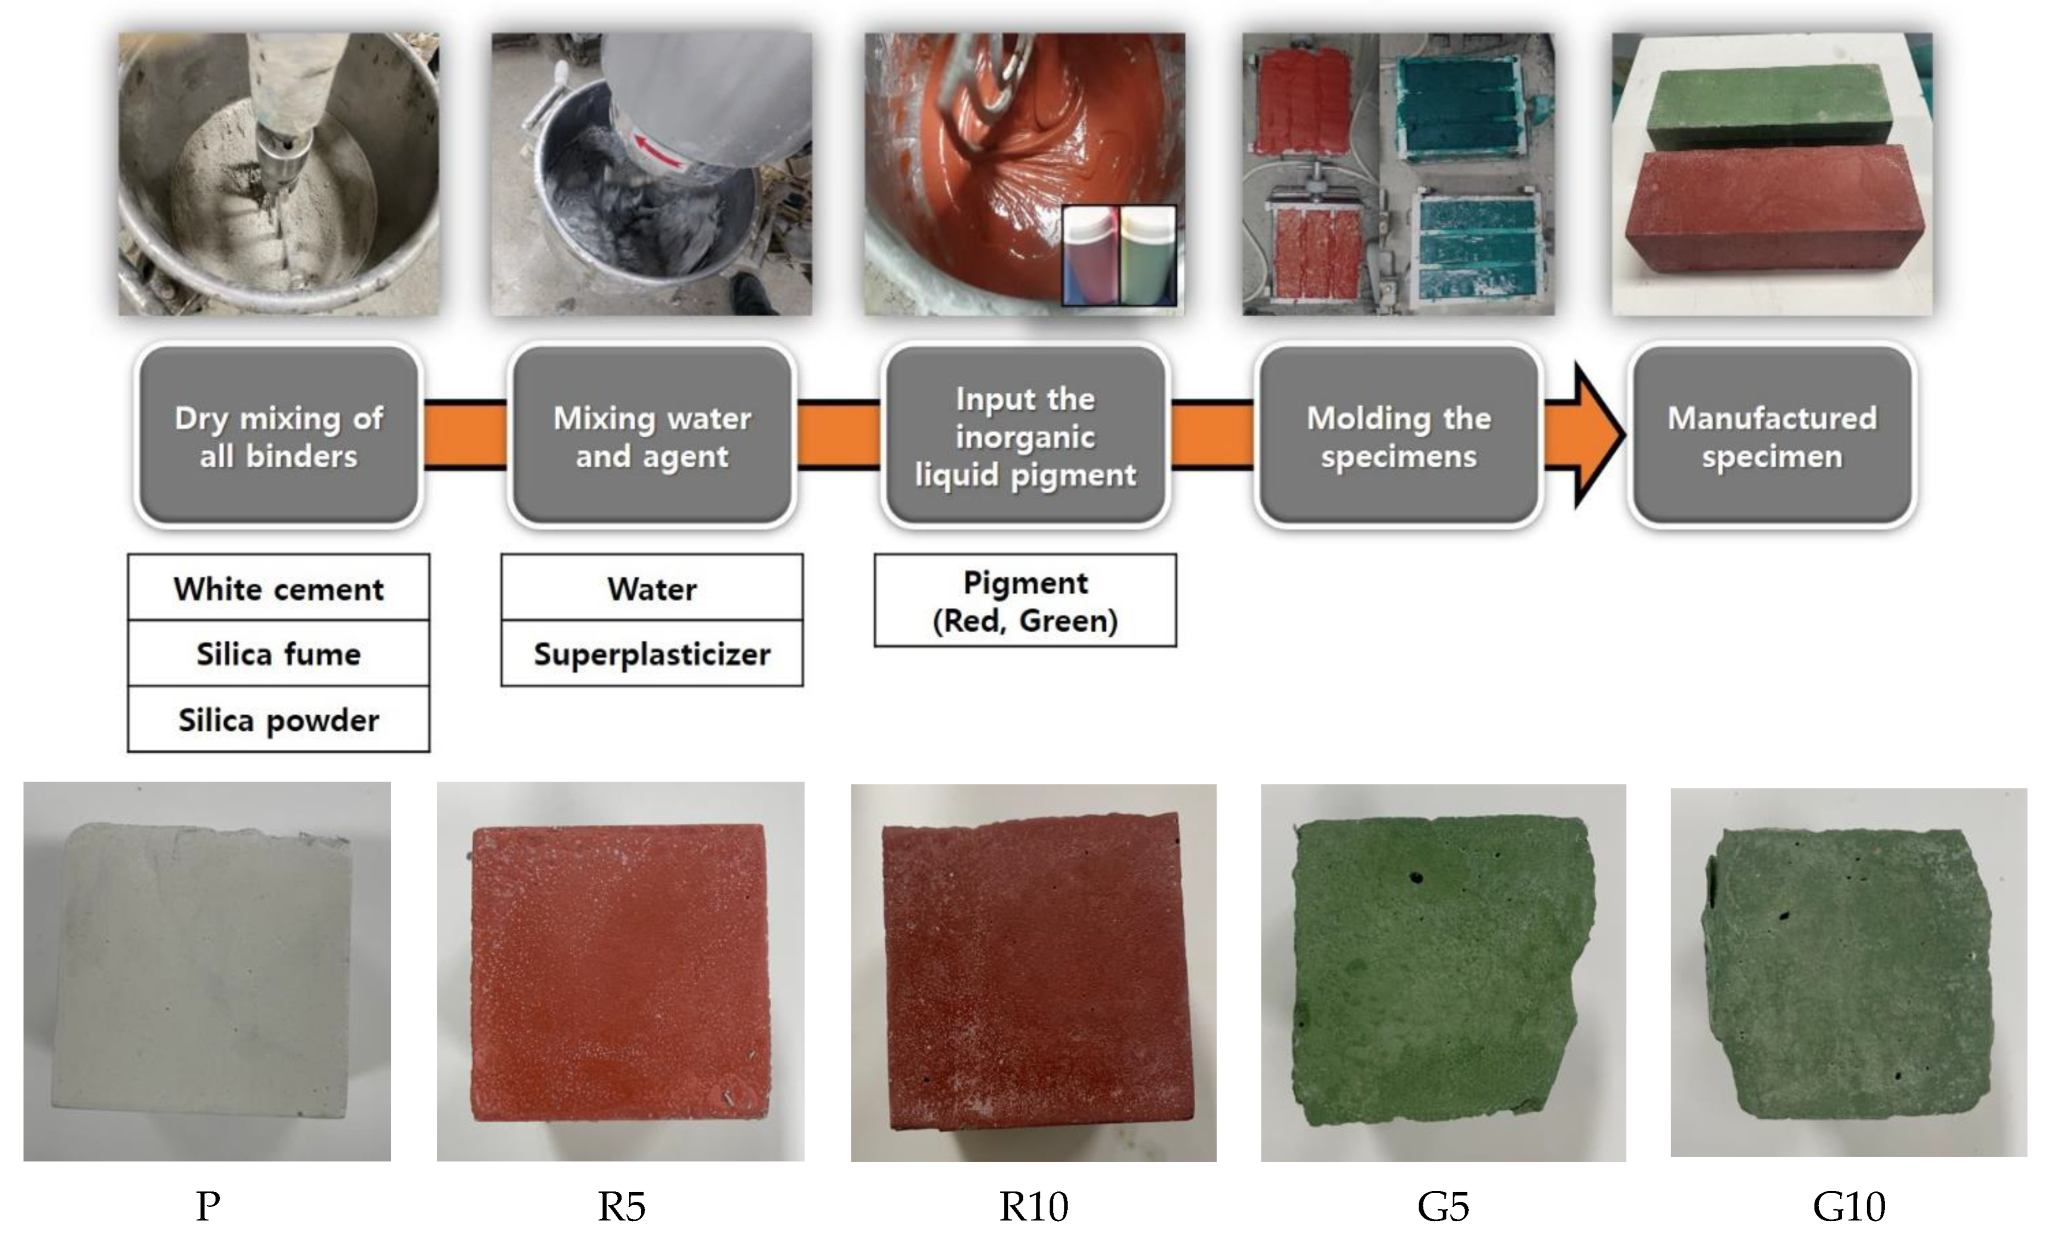
2.1. Specimens

CEM Type 1 (Union Corp., Seoul, Korea) based on ASTM C150-85 and silica fume (Elkem Silicones, Oslo, Norway) was used to prepare the samples used in this study. Silica powder (SAC Materials, pure silica S-SIL 30, Ulsan, Korea), a micro filler, was also applied. For the color development of the pigments, white Portland cement with a Hunter whiteness index of 90.5 was selected. Nanomaterials were used to improve the dense hydration structure of the test specimen because of concerns regarding the decrease in strength due to the addition of pigments. Table 1 lists the chemical composition of the binders and pigments used. A polycarboxylate-type superplasticizer (flowmix 3000U, Dongnam Sdn. Bhd., Siheung-si, Gyeonggi-do, Korea) was also used. Water-soluble inorganic red and green pigments were added at 5% and 10% of cement mass, respectively; these quantities were determined using the EN 12878:2014 and ASTM C979 standards, which recommend that the pigment content should not exceed 10%. Red and green pigments have the second-highest demand following gray and white pigments, which have the highest demand, and they are used in various finishing materials. In addition, the red pigment is mainly composed of iron oxide and exhibits stable properties when incorporated with concrete. In addition, specimens were prepared without aggregates or fiber to investigate the influence of pigment addition on the improvement of hydration in HSCCs for developing colored concretes.
Table 2 lists the mix proportions of the HSCCs manufactured and the notation used for each specimen. Dry mixing was performed for 5 min to mix the binders with each pigment, following which water and superplasticizer were added to the mixtures. All the materials were further mixed for 5 min to ensure thorough mixing. The fresh mixture was confirmed to have a table flow of 200 mm or higher in the non-beating state according to ASTM C4137. Finally, the fresh mixtures were poured into a mold with a volume of 50 mm × 50 mm × 50 mm. Specimens were prepared for compressive strength, XRD, and TG spectroscopy analyses. Samples for Commission Internationale de l’ Éclairage (CIE) L*a*b* (CIELAB) measurements were fabricated as panels with dimensions of 200 mm × 200 mm × 20 mm. Furthermore, Ø100 mm × 200 mm specimens were prepared for measuring the water-absorption rate according to age. The prepared specimens were sealed with a film and cured in the ambient atmosphere for 24 h. Subsequently, they were demolded and subjected to steam curing at 80 °C for 72 h. Finally, constant temperature and constant humidity curing were performed until the 28th day. Figure 1 shows photographs of specimens manufactured via this process.

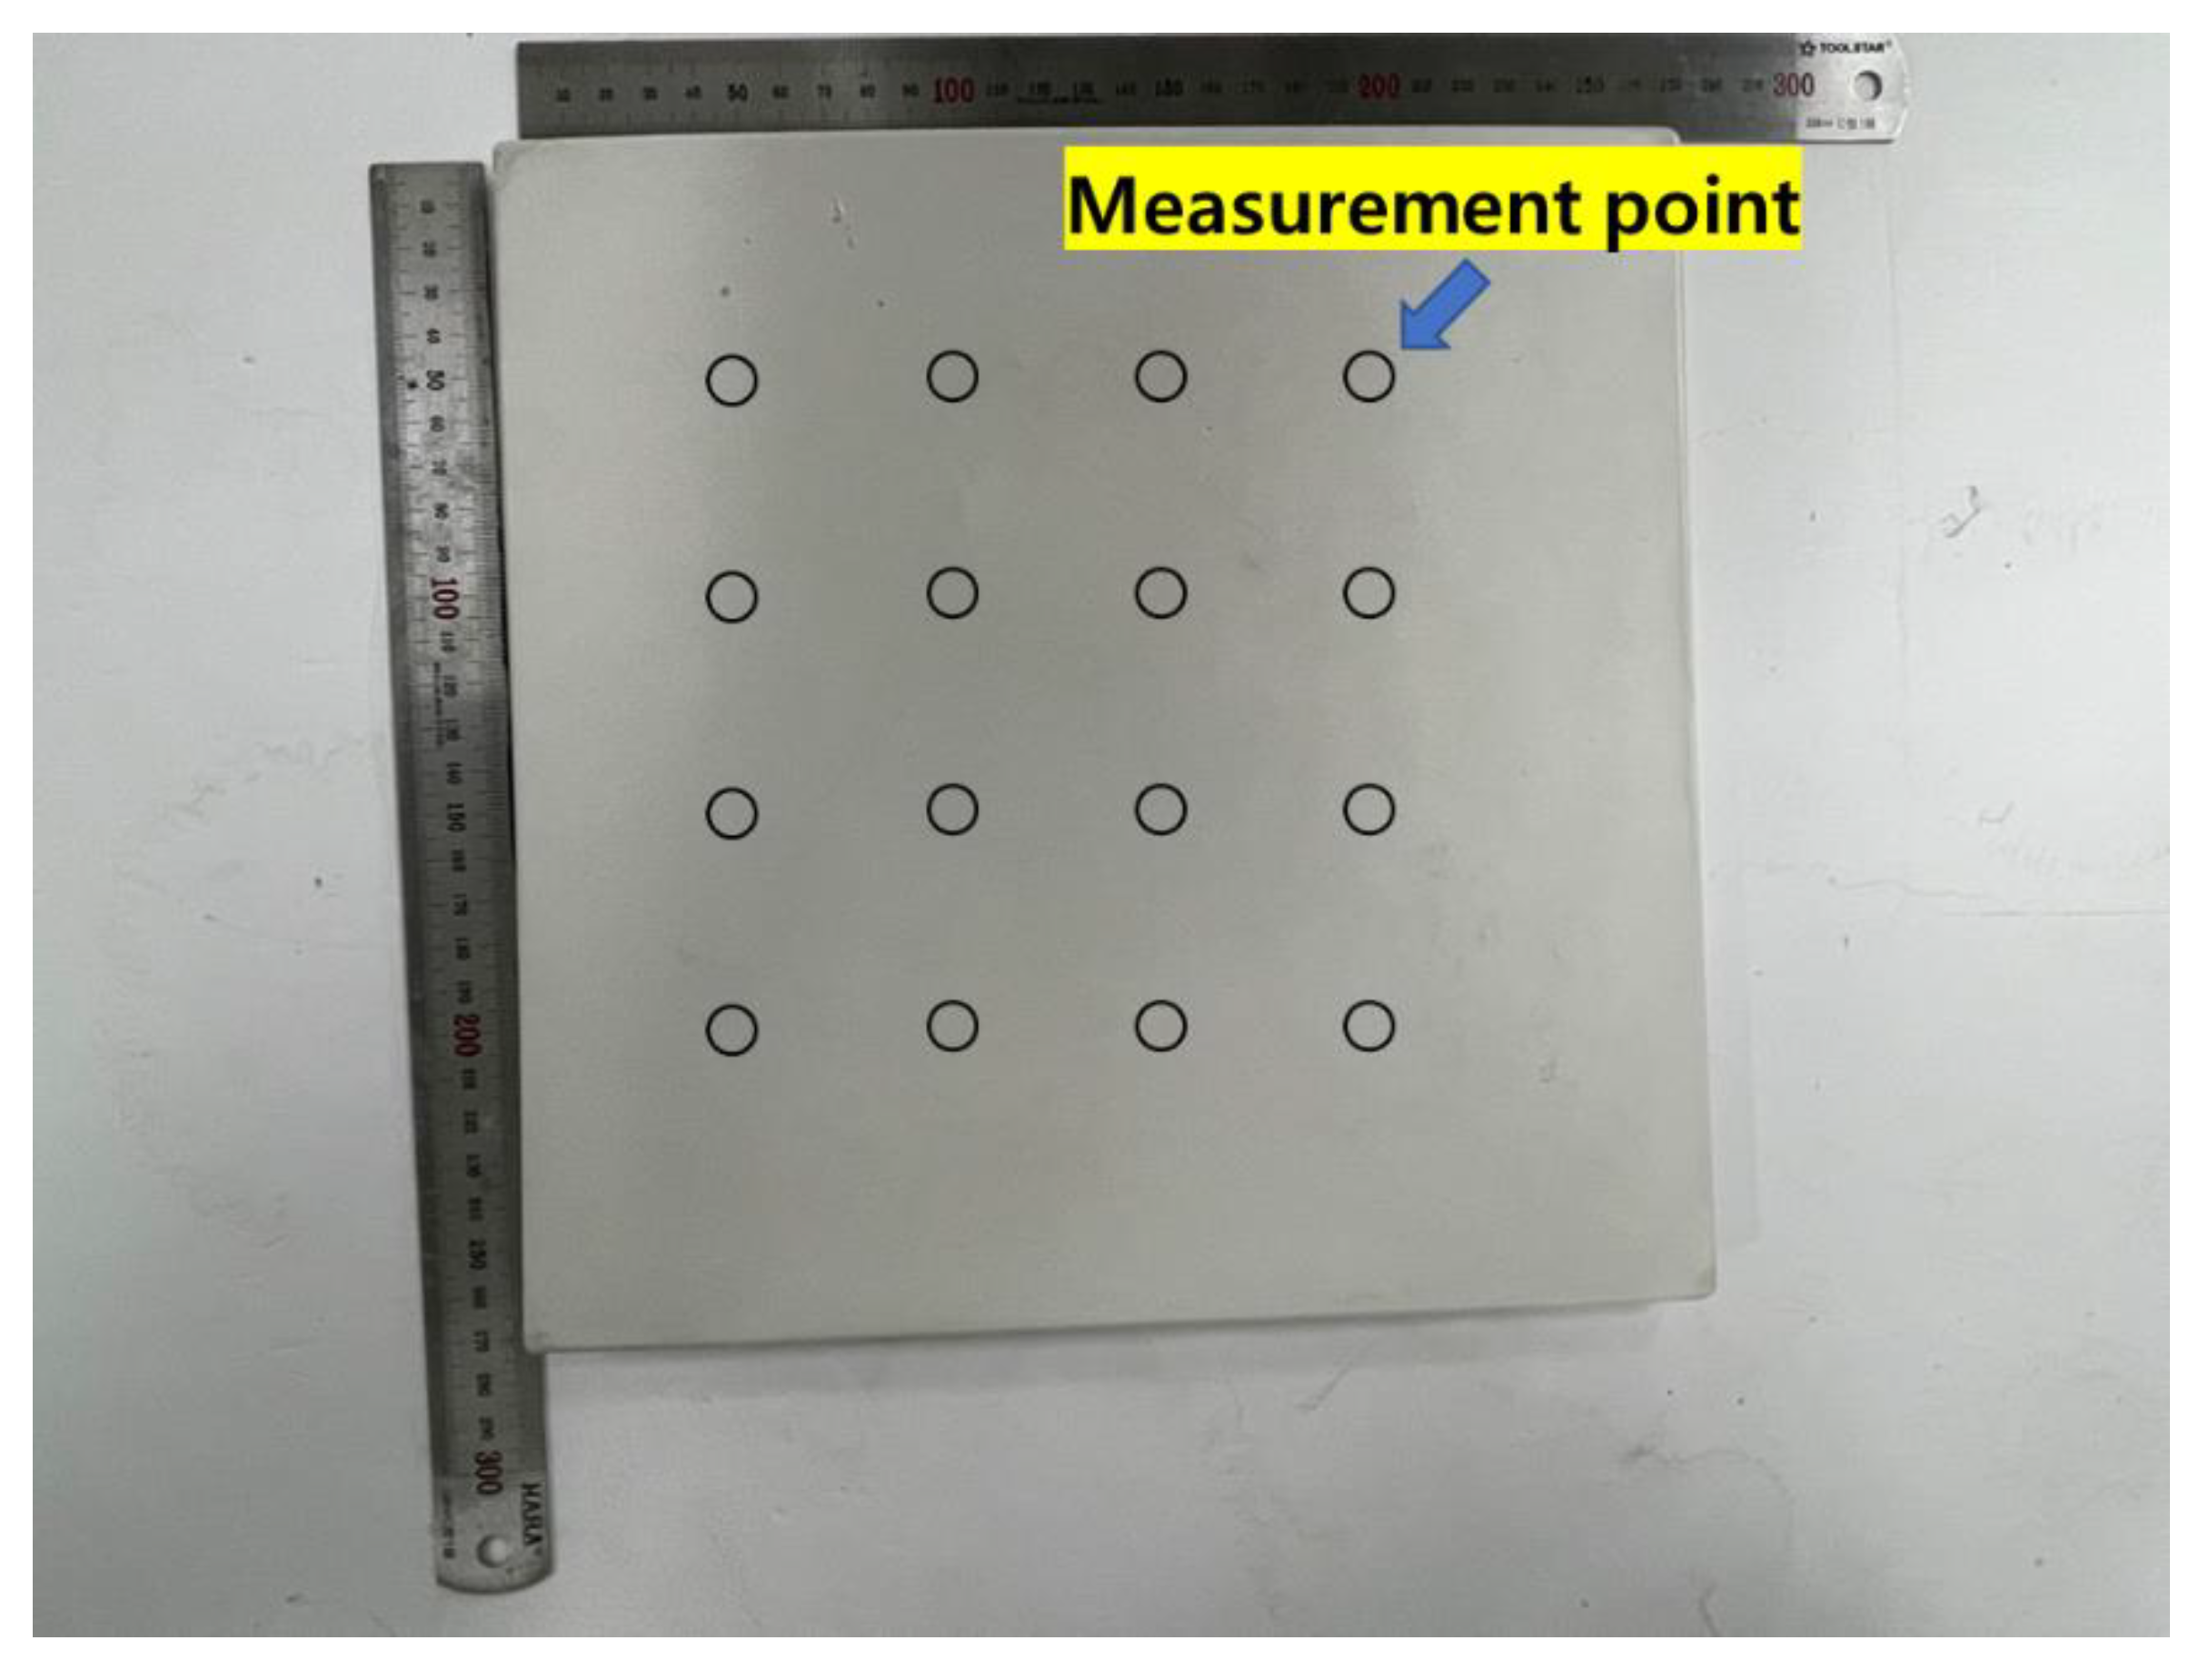
2.2. Test Methodology

Compressive strength, CIELAB, and TG spectroscopy measurements were performed at 3, 7, and 28 days of age. However, XRD measurements were performed on the 28th day only.
The compressive strength was measured using a hydraulic universal testing machine (Toni Technik, Baustoffprüfsysteme, Berlin, Germany) in accordance with ASTM C109 [24]. Compressive strength is defined as the load divided by the cross-sectional area. Compressive strength measurements showed that the average measured values of three specimens and the standard deviation were within a confidence level of 95%.
To investigate the compositions of hydrates, powder-type samples that passed through a 75 µm sieve were separated from the specimens with which compressive strength was measured at each age. To stop the hydration of the samples used for Rietveld refinement–based quantitative analysis, the samples were immersed in acetone according to the solvent-exchange method and were subjected to oven drying. The crushed parts were dried using silica gel, and XRD and TG were performed after maintaining a vacuum state in a desiccator. The test conditions for analyzing the hydration product compositions are as follows: XRD was performed using a P-analytical X’Pert PRO-MPD device (DA101 at KBSI Daegu Center, Daegu, Korea), and the analysis was conducted by setting the CuKα radiation at 40 kV and 30 mA. The scan range of the specimen was 0.02° in 2θ, and scanning was performed from 5° to 70° at 3.0 s intervals for 3 h. For TG analysis (TGA), a temperature range of 0 °C to 800 °C was set in an N2 gas-injection environment using a TA Instruments Q600 device (PH407, KBSI Pusan Center, Pusan, Korea), and the heating rate was set to 10 °C per min [25,26,27,28].
For CIELAB, a color system (NR-11A, Nippon Denshoku Industries Co. Ltd., Tokyo, Japan) was used to perform quantitative color analysis. The light reflected from the object was measured for 2 s at each wavelength and every 6 s via spectrocolorimetry using the diffraction-grating post-spectral method. The measurement stability was within ΔE*ab = 0.06, and high-precision measurements were performed by calculating the X, Y, and Z values from the RGB values. The X, Y, and Z values belong to the color mixture system and quantitatively represent colors.
Correlation analysis was performed on the factors measured through the abovementioned analysis method according to age using the statistical package for social sciences version 26 (IBM SPSS Statistics 26, SPSS Inc., Chicago, IL, USA).

3. Results and Discussion

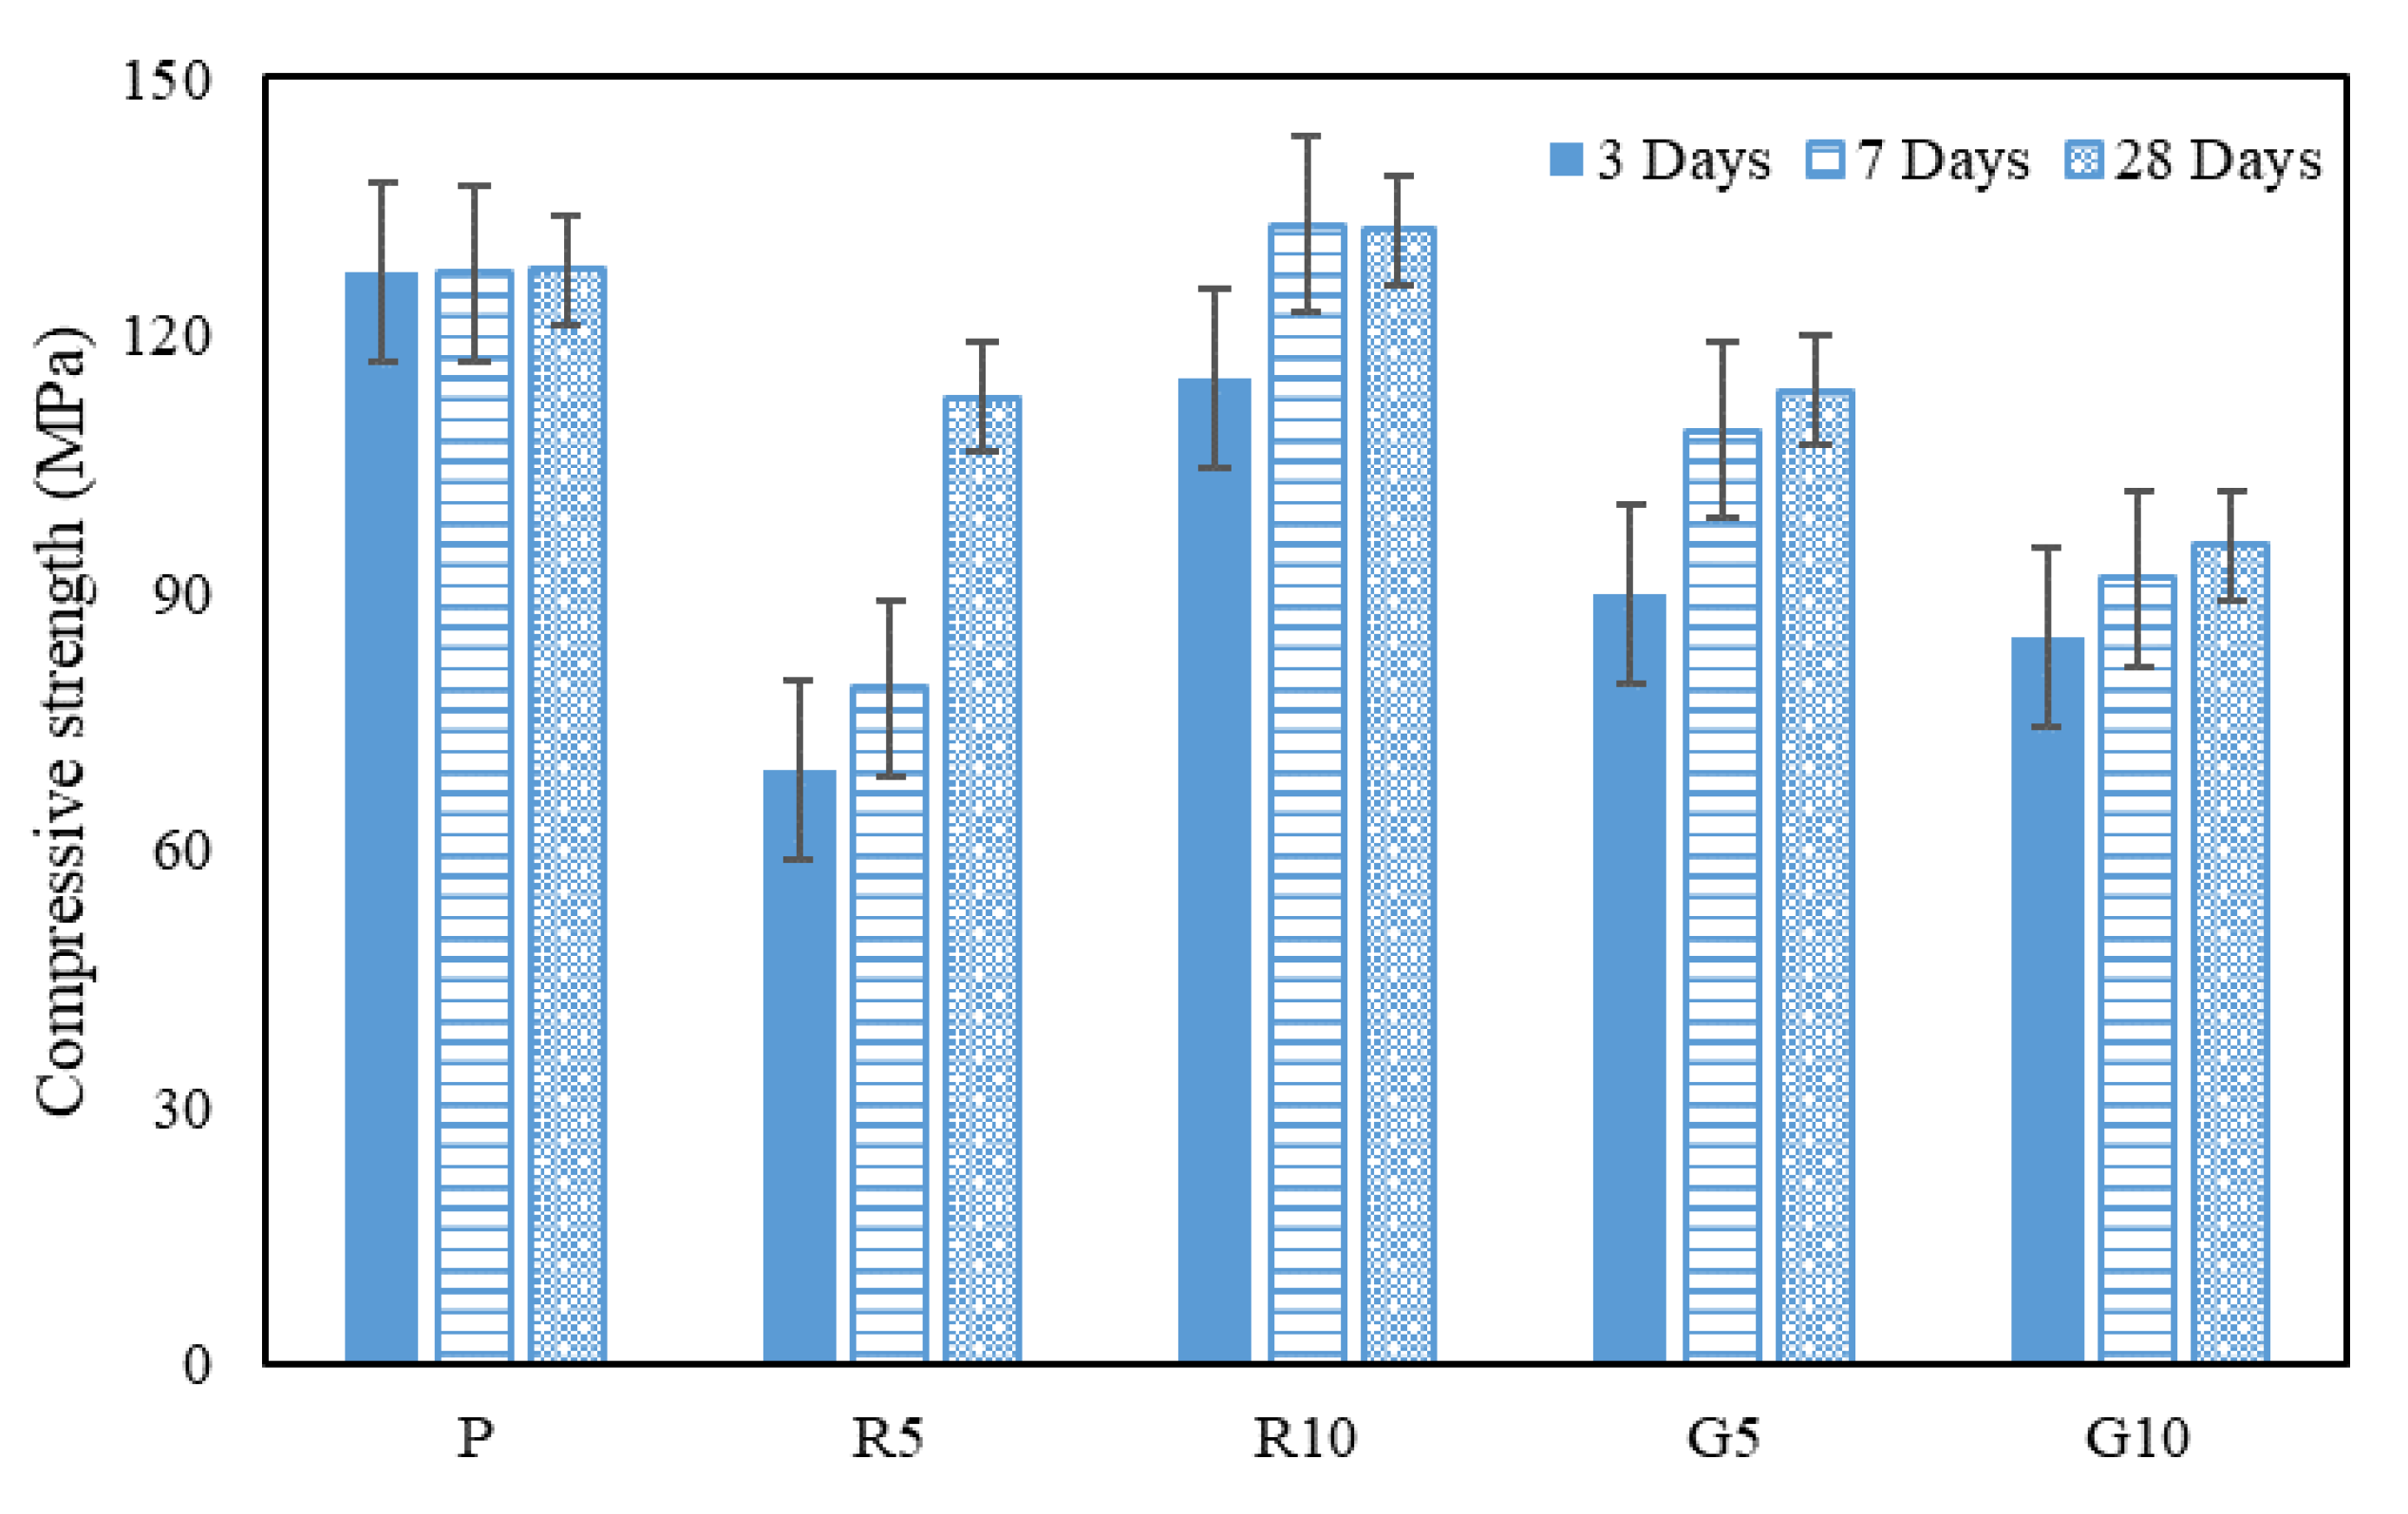
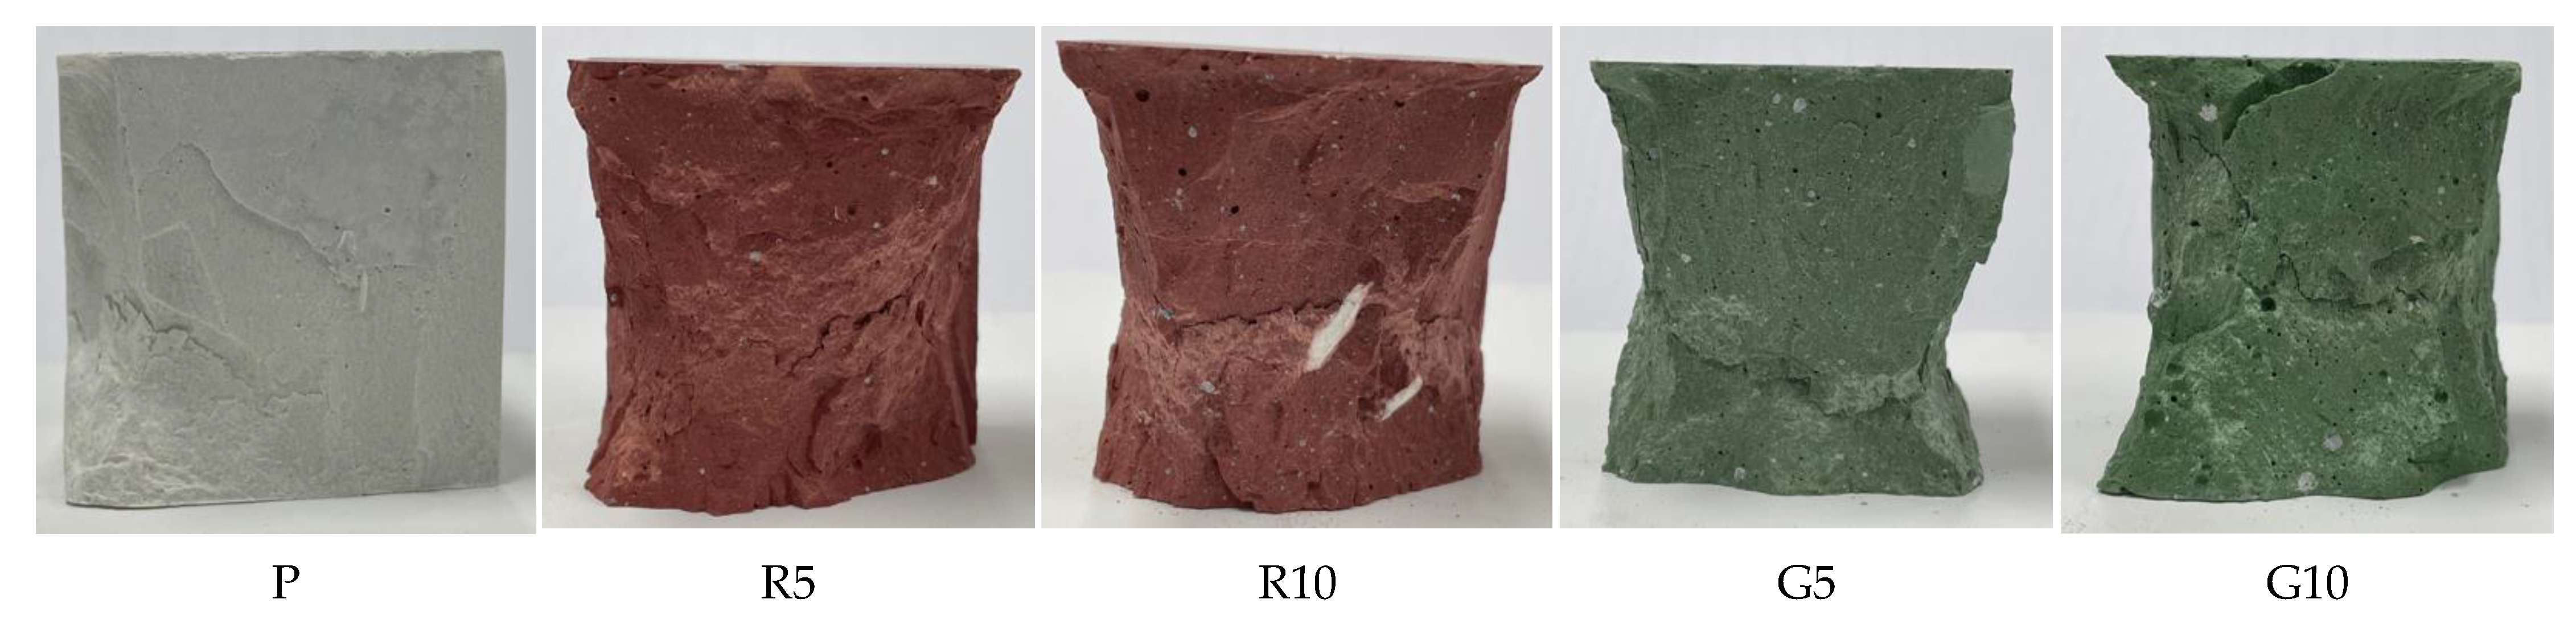
3.1. Compressive Strength

Figure 2 displays the compressive strengths of the C-UHSCC samples mixed with the inorganic pigments. Compressive strengths were measured at 3, 7, and 28 days, and the average strength values of the three specimens of different ages were used. Error bars exhibited a 95% confidence level. The compressive strength test results revealed that the specimen strength differed according to the inorganic pigment color. The initial hydration reactions of all the specimens were maximized through a 72 h steam-curing process, which accelerated the initial strength-development rate [29]. For specimen P, which had no pigment, the strength at 28 days of age showed negligible change from that at an early age measured after the completion of steam curing. This result indicates that the maximum strength was developed for specimen P because of the completion of all hydration reactions [30]. For the red specimens, the strength development was higher than that of specimen P as the pigment content increased with age; this was because the filling effect of the Fe2O3 component in the red pigment contributed to the strength development [20]. Compared with the red specimens, the green specimens exhibited lower strength; however, their strength gradually increased with age. Although the water used for mixing was adsorbed on the pigments during the initial mixing process, the hydration reaction progressed under steam curing. As adequate amounts of moisture and heat were continuously supplied under atmospheric pressure to the specimens, further strength development was achieved [12,31,32,33,34].
For all colors except red, the strength tended to decrease with increasing inorganic pigment content. However, the red specimens with 10% pigment content exhibited higher strengths than those with lower pigment contents. Strengths higher than that of specimen P were observed as the pigment content increased because the Fe2O3 particles in the red pigment were nanosized. The nano-Fe2O3 particles could partially fill the pores of the binder particles [35,36]. Although a slightly different tendency was observed in the compressive strength results of a previous study that used a maroon marble powder additive containing an Fe2O3 component [20], water curing was used, and the difference in results could be attributed to the difference between the water-curing and steam-curing environments. The specimens mixed with the pigments exhibited compressive strengths higher than 90 MPa at 28 days of age, but those with the green pigment exhibited the lowest strength.

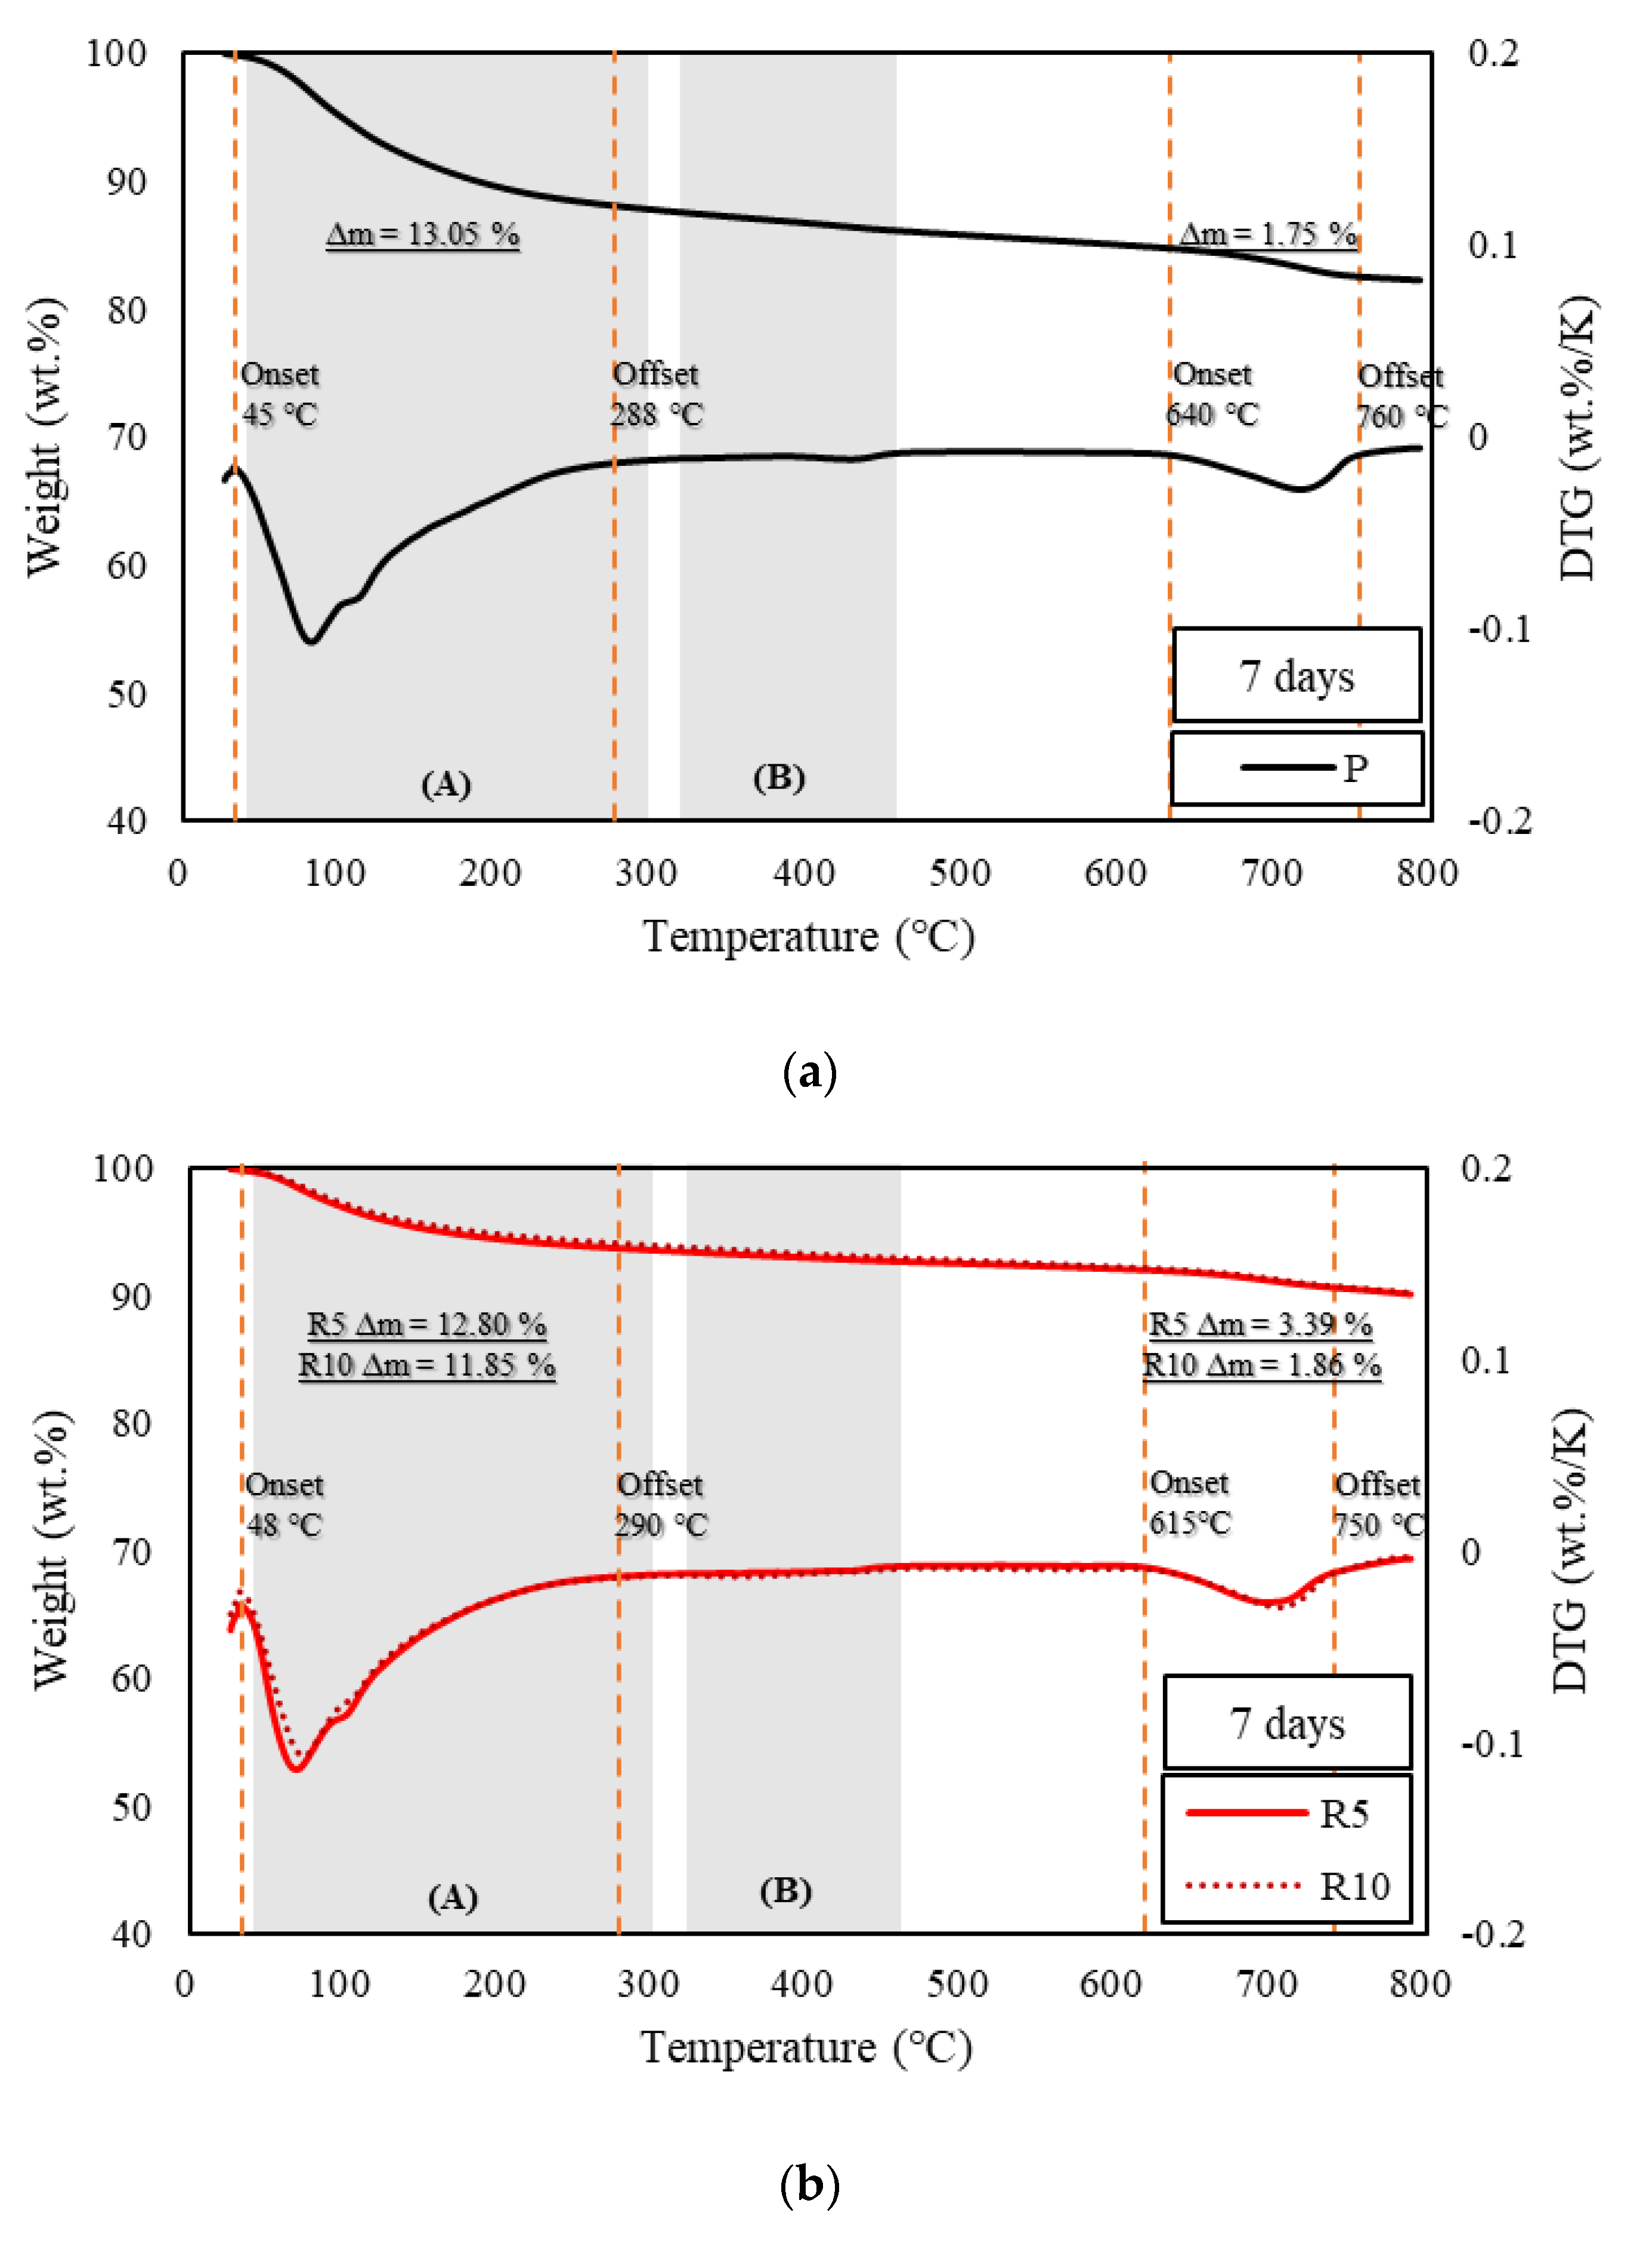
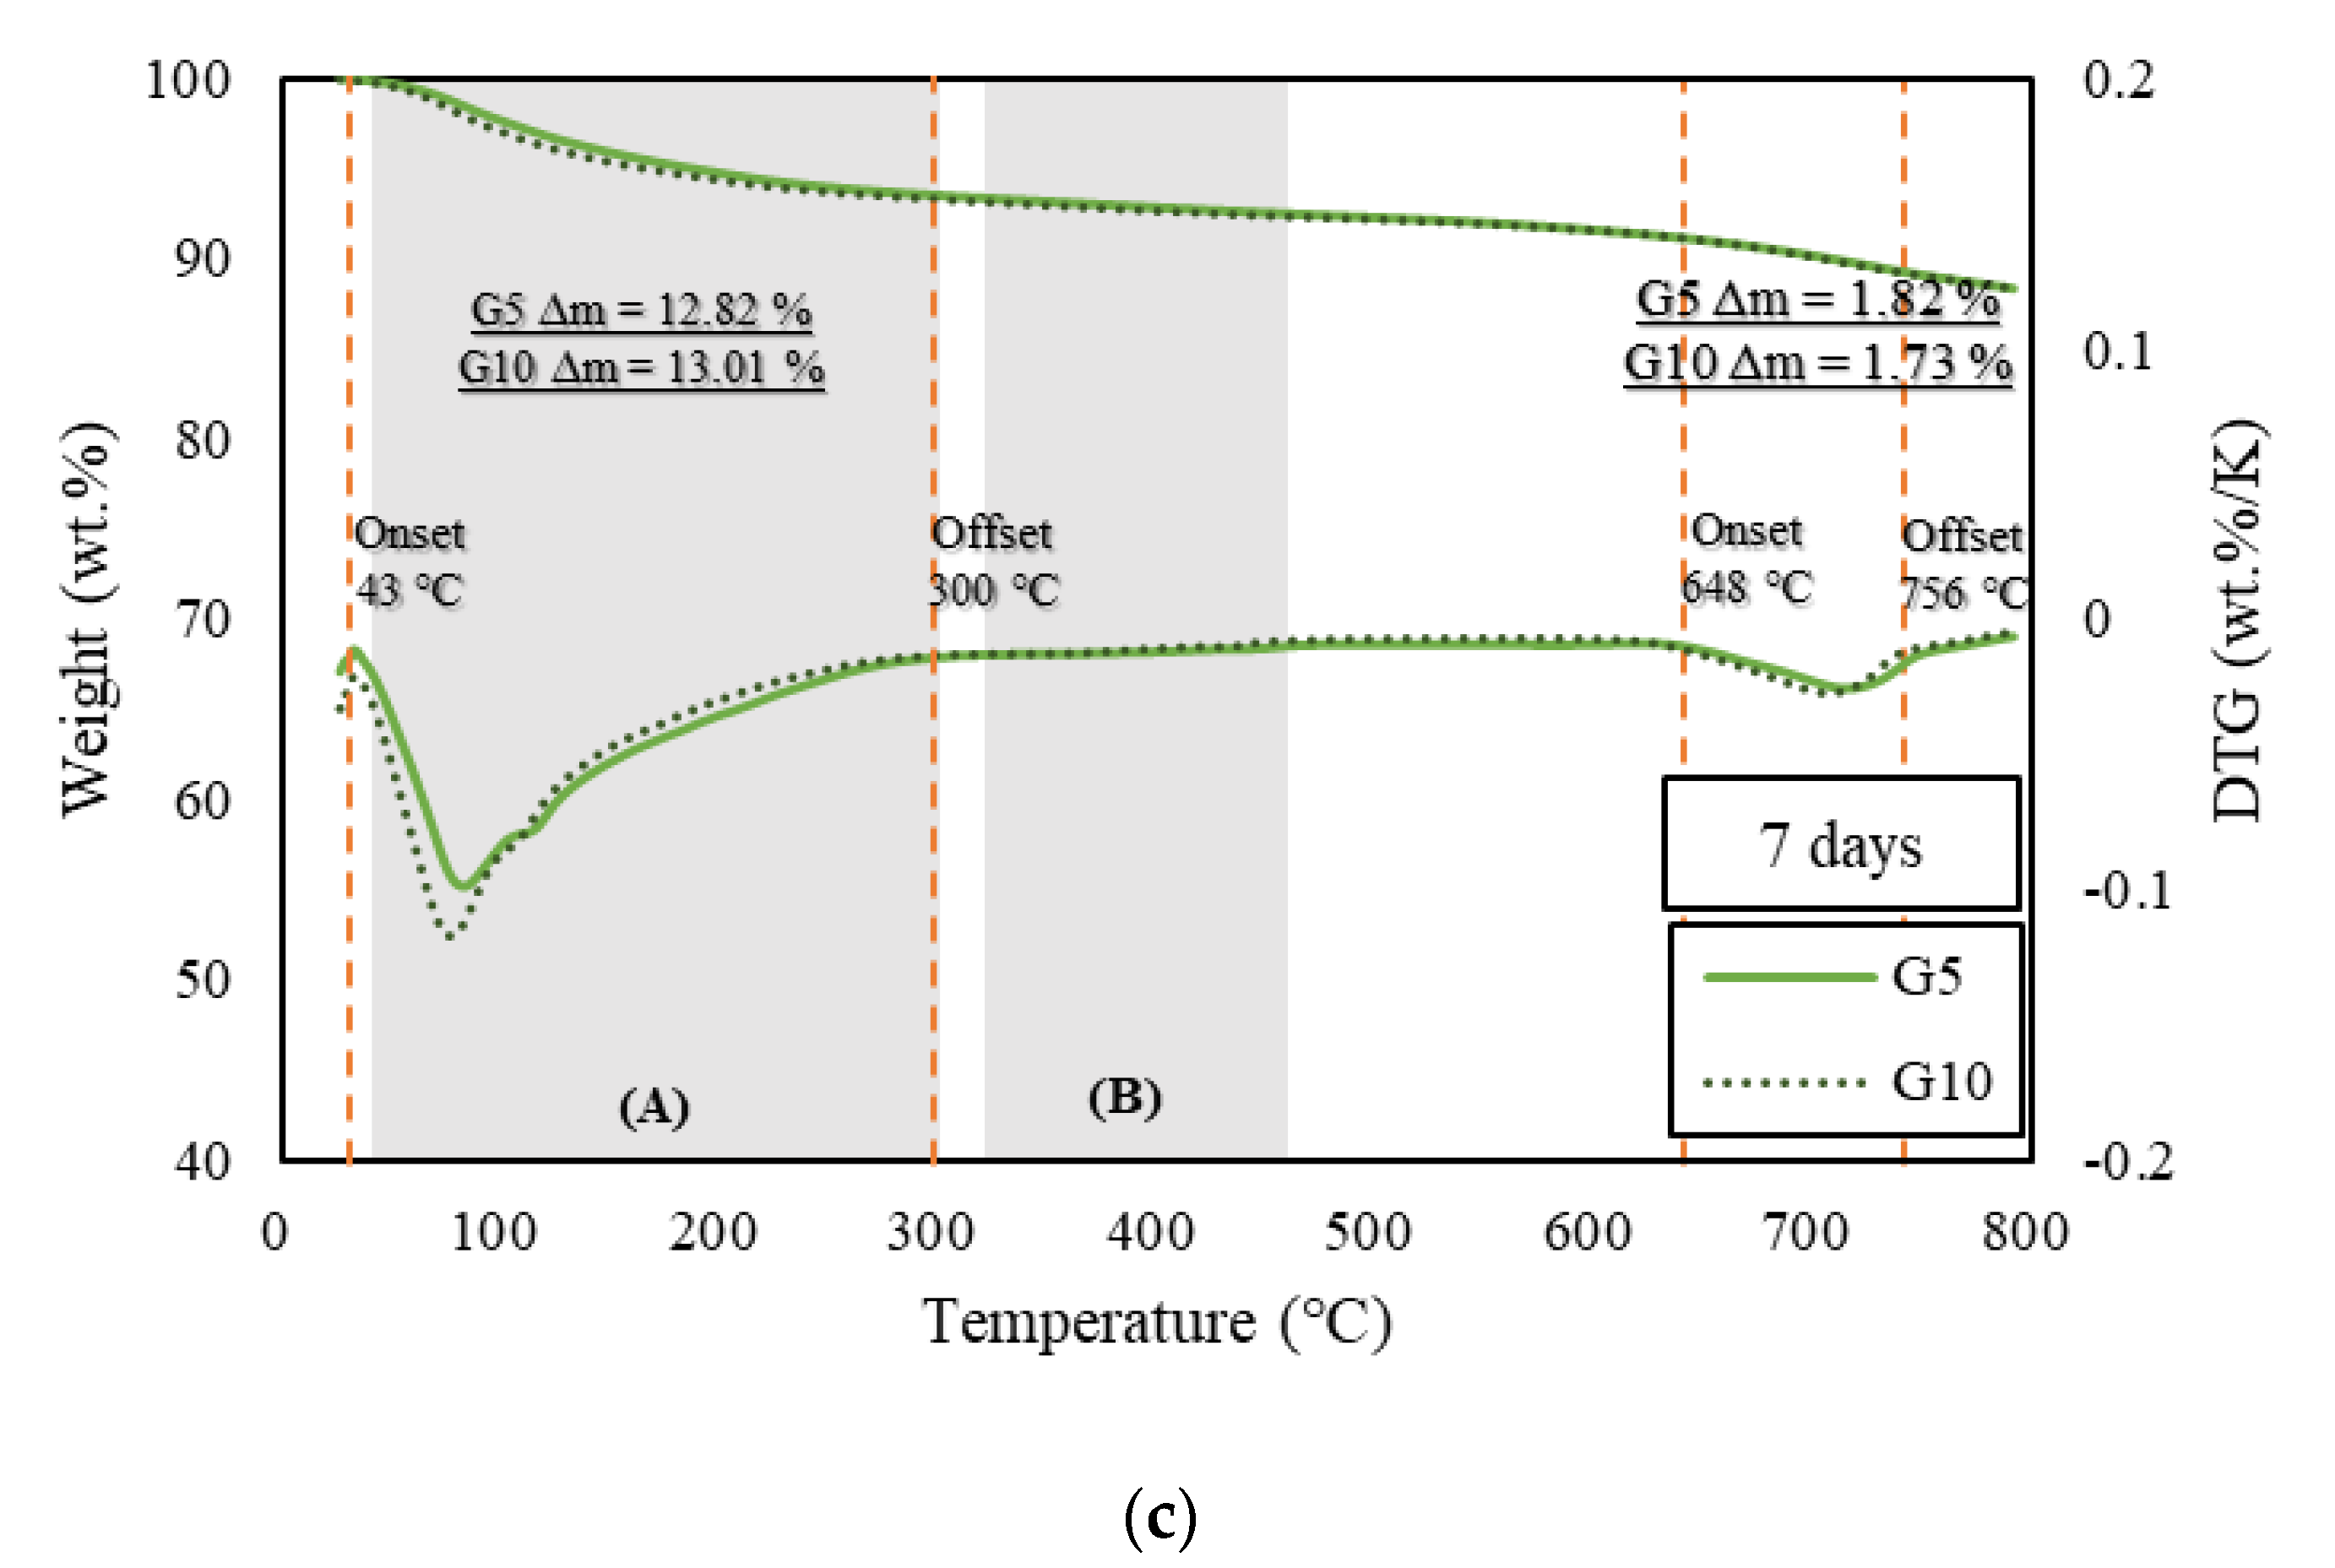
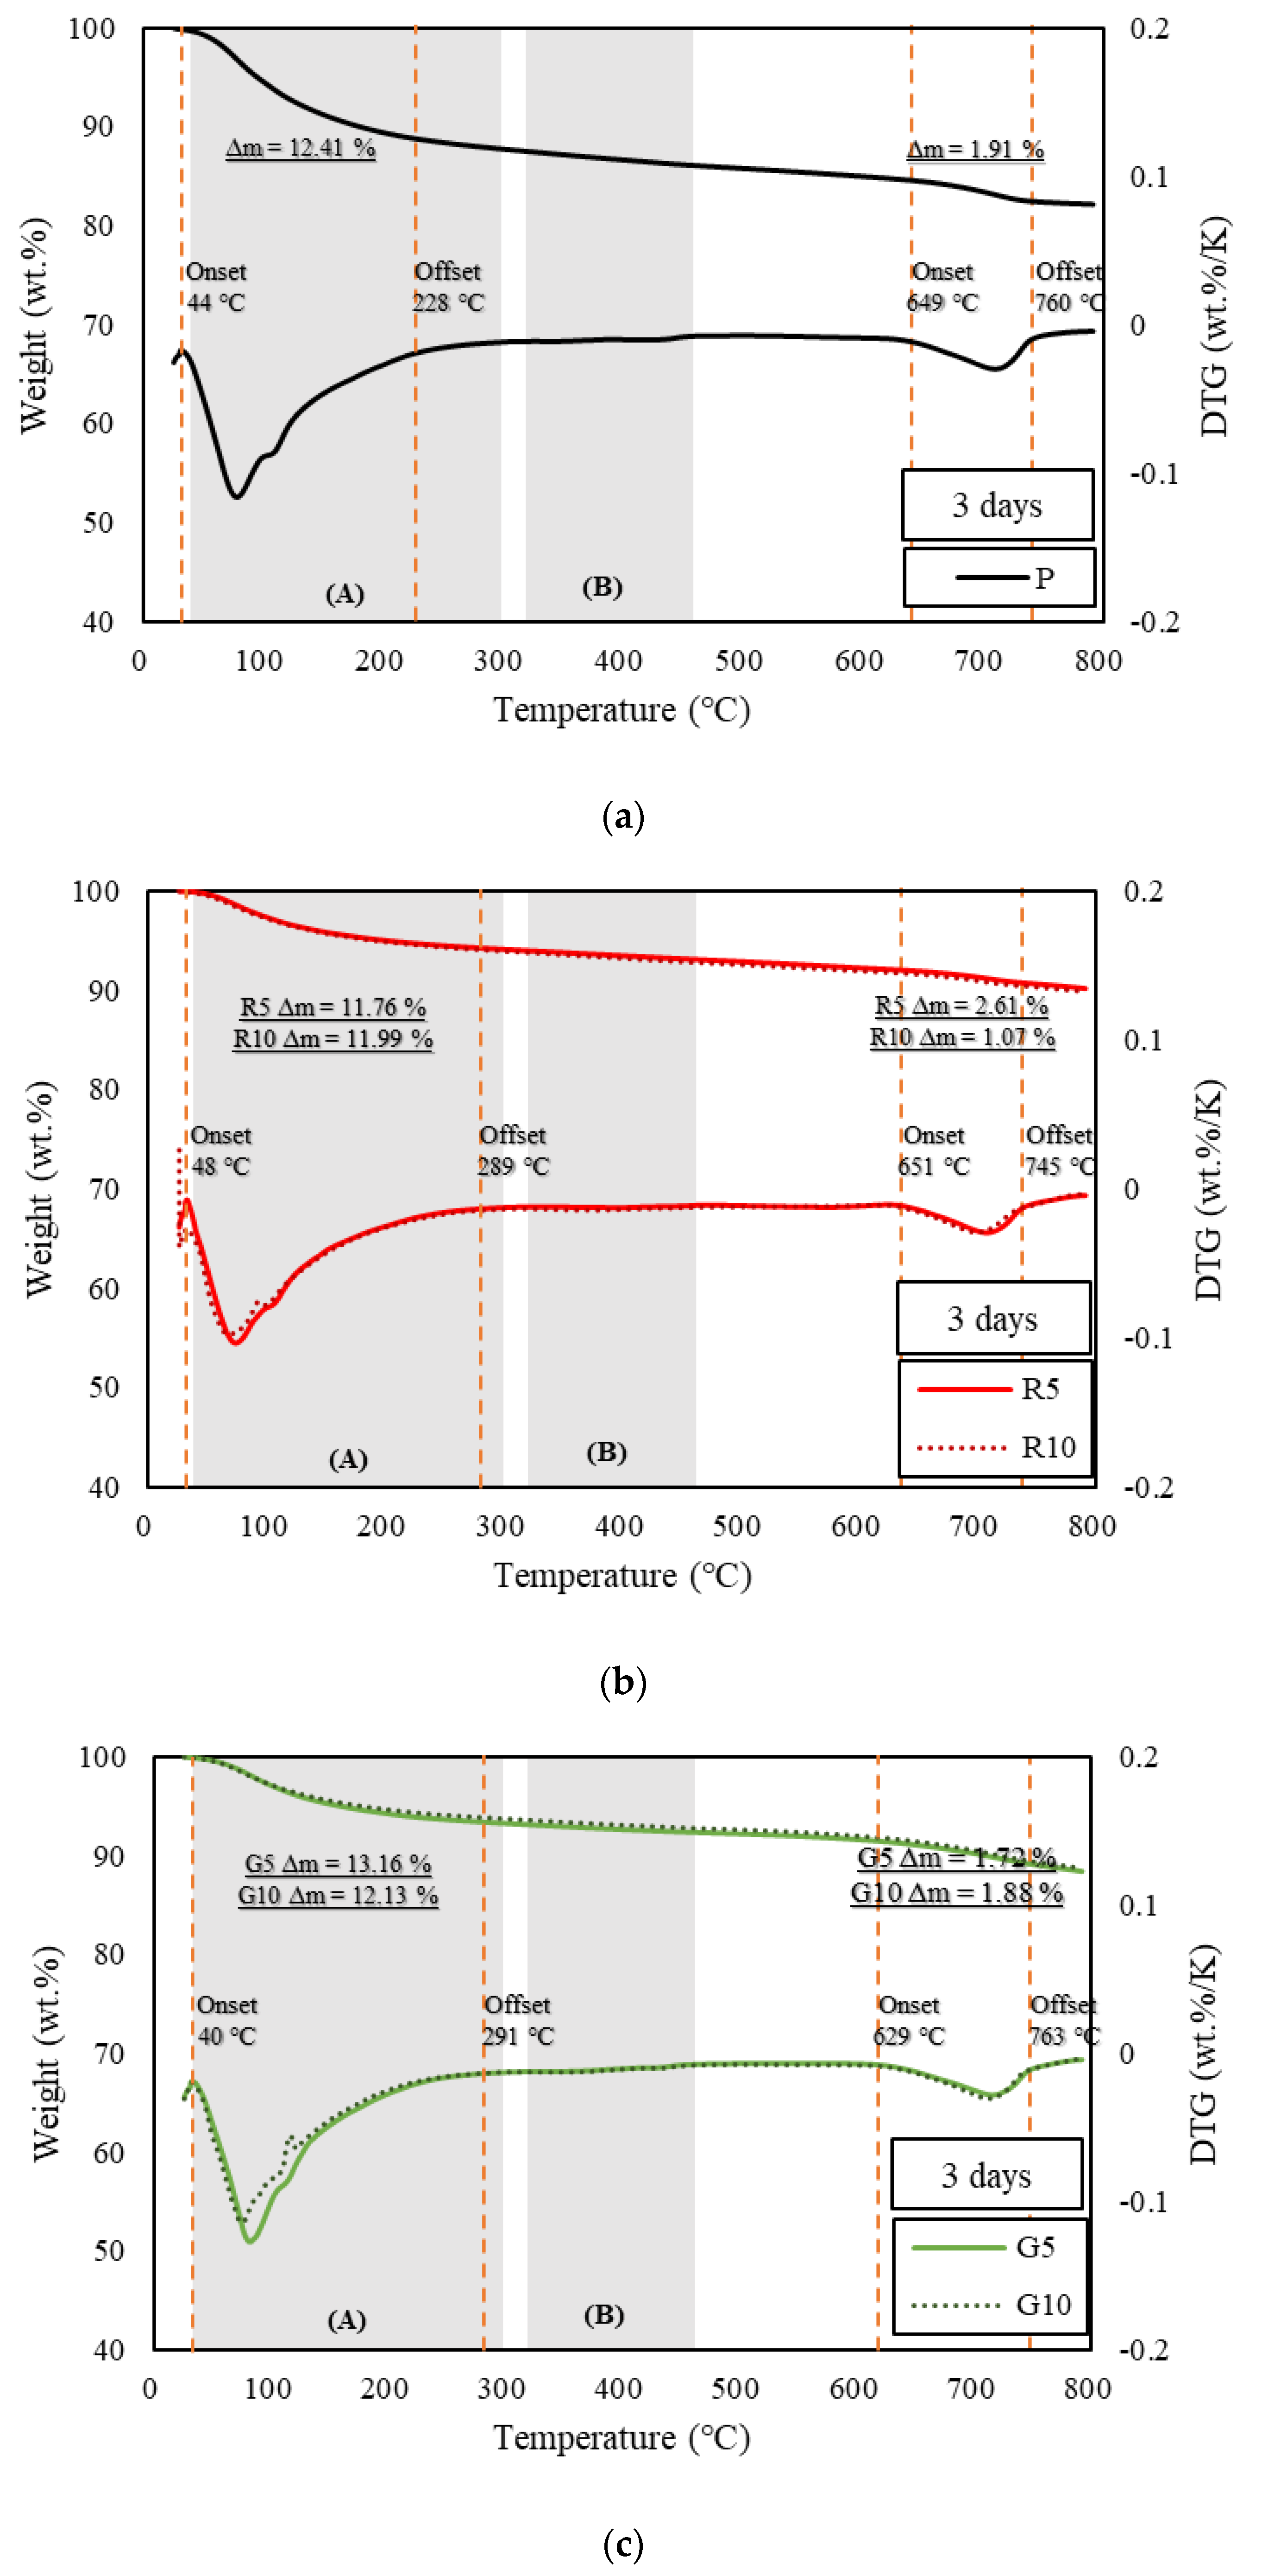
3.2. Thermogravimetry

Figure 3, Figure 4 and Figure 5 show the derivative thermogravimetry (DTG) curves of the HSCCs. For the corresponding samples, ettringite, gypsum, and monosulfate, which are early-age hydrates (Afm), were not observed in the XRD patterns because high-temperature steam curing was performed in the initial stage of hydration. All the moisture content inside the samples, including capillary water and condensate, evaporated around 100 °C [26], and peaks are observed in section (A) of Figure 3, Figure 4 and Figure 5. This indicates that most early-age hydrates were combusted below 300 °C along with the C–S–H gels. Here, G10 exhibited the highest combustion rate because the initial hydration was delayed as compared to the other samples. Thus, unhydrated initial hydrates (Afm) remained even after steam curing. The peaks near 700 °C at all ages were those of carbonate, an impurity in the raw material of cement, which burned at a high temperature [27,37]. With increasing age, most of the samples exhibited a larger residual mass than specimen P.

3.3. Analysis and Verification of Hydration Dynamics via TGA
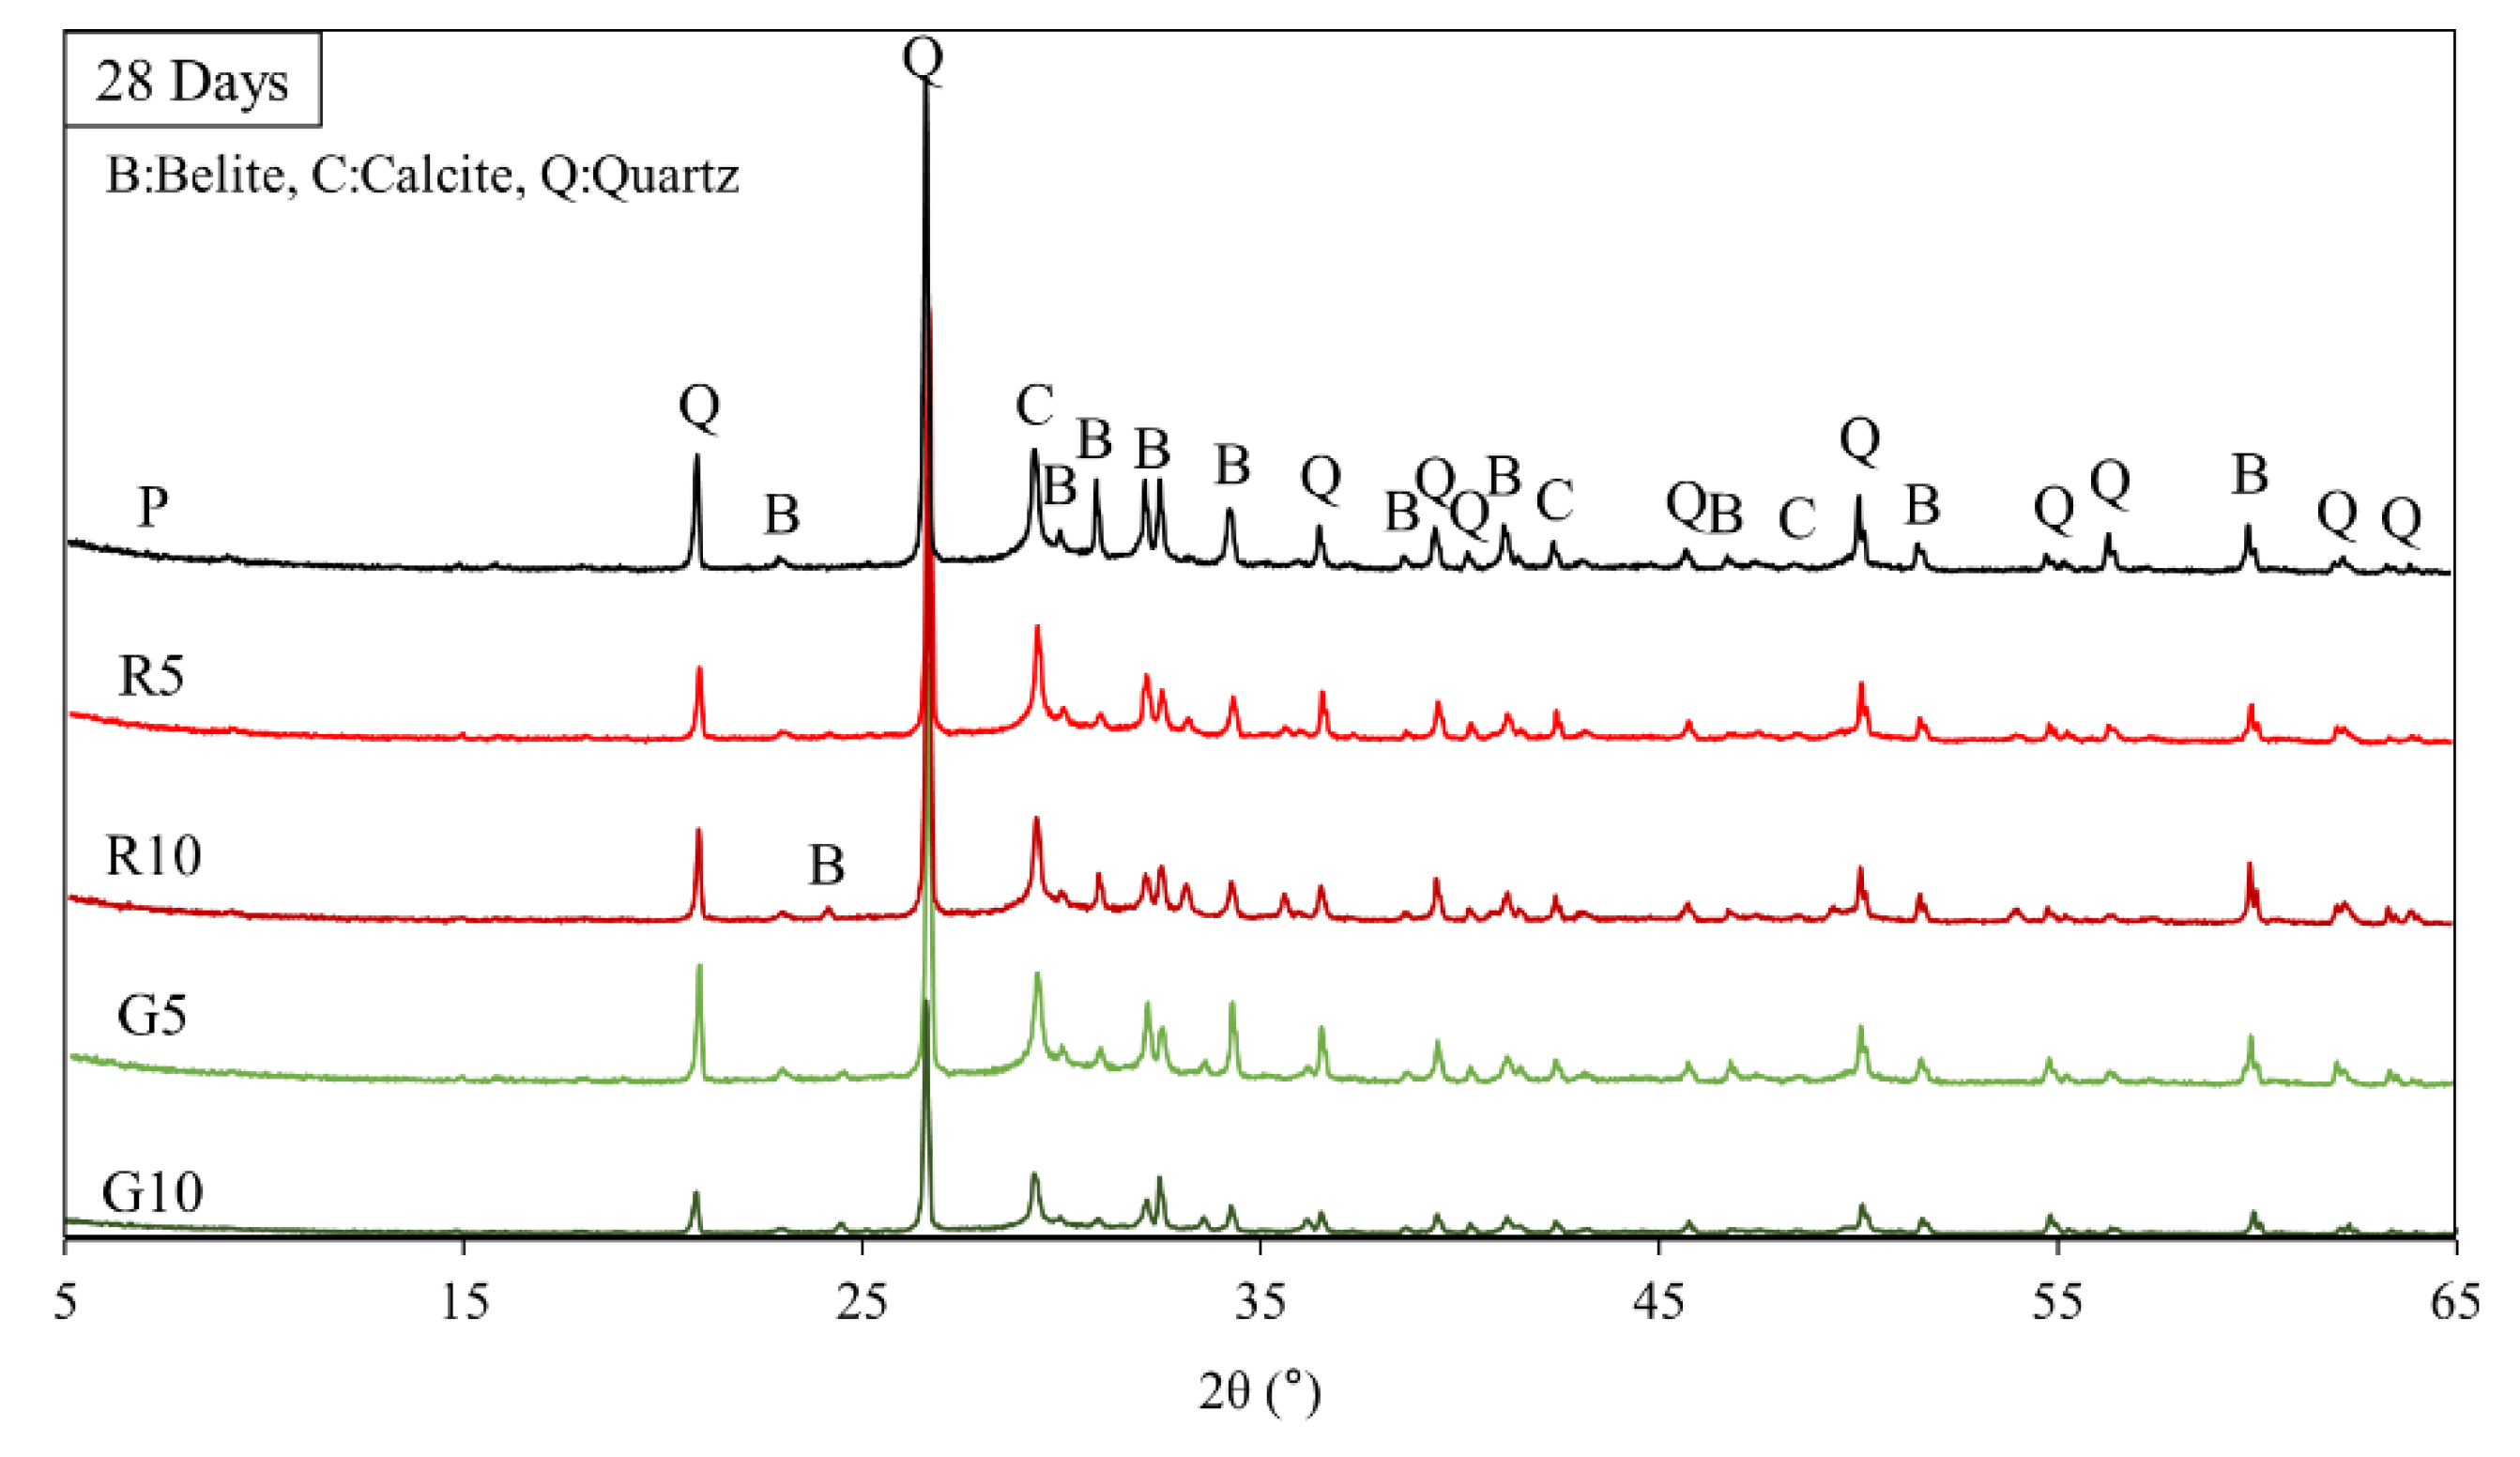
The pozzolanic reaction and strength development depend on the amount of calcium hydroxide generated by the hydration reaction of cement [38]. TGA is typically used to measure the calcium hydroxide content in cement. TGA was conducted using the DTG curves of HSCCs shown in Figure 3, Figure 4 and Figure 5. The amount of calcium hydroxide (Δm) generated in each specimen was quantified, and the values are plotted in Figure 3, Figure 4 and Figure 5. The analysis of hydration dynamics using TGA was performed by employing two methods (DTG/TGA), and a stepwise method was used here. The weight loss of C–S–H, ettringite, and monocarbonate occurred in the range below 230 °C [39]. Calcium hydroxide decomposed in the ranges 380 °C to 480 °C [40] and 400 °C to 560 °C, and the difference in mass was used to determine the amount of calcium hydroxide [41,42]. The weight loss in TG was caused by calcium-hydroxide dehydration, and this value was used to quantify the amount of calcium hydroxide. A major quantity of calcium hydroxide was generated rapidly in the C-UHSCC specimens during the initial steam-curing process, and this quantity increased or decreased as the curing period increased, which indicated that internal hydration was in progress. When the pigments were added, the calcium hydrate content increased relative to that of specimen P as the age increased. This phenomenon indicated that the moisture absorbed by the pigments was released, or the hydration was delayed owing to the moisture supplied during the steam-curing process.

3.4. XRD Analysis

Figure 6 shows the XRD patterns of the HSCCs samples. The 5–65° section was used to examine the changes in the crystal phases formed during the hydration reaction, and each sample was distinguished. Because most of the hydration process occurred during the initial curing period of the steam-cured specimens, the XRD patterns observed after steam curing exhibited similar trends. When curing was performed in a constant temperature and constant humidity environment, rather than in an underwater environment, continuous hydration did not occur, because moisture was not directly supplied to the specimen [43,44]. HSCCs with a low w/b ratio could contribute to the continuous hydration reaction until the final hydration process because of their high densities, especially when moisture is supplied continuously even after steam curing [45]. As shown in Figure 6, quartz (SiO2), alite (3CaO·SiO2(C3S)) and calcite (CaCO3) were detected in most specimens. The generation ratio of alite (A) measured in the 32–33° and 41–42° sections of specimen P and that of specimens mixed with the pigments differed considerably. Peak C at 29.1°, 42.7°, and 48.2° was ascribed to calcium hydroxide, which was utilized to detect the carbonates, such as calcite, generated by it. Peak C of the G10 specimen was at 29.1° and 42.7°. XRD patterns with similar trends were observed after the steam-curing process. Although some differences existed in the proportions of the generated substances, as indicated by the areas under the patterns, the deviations were marginal.

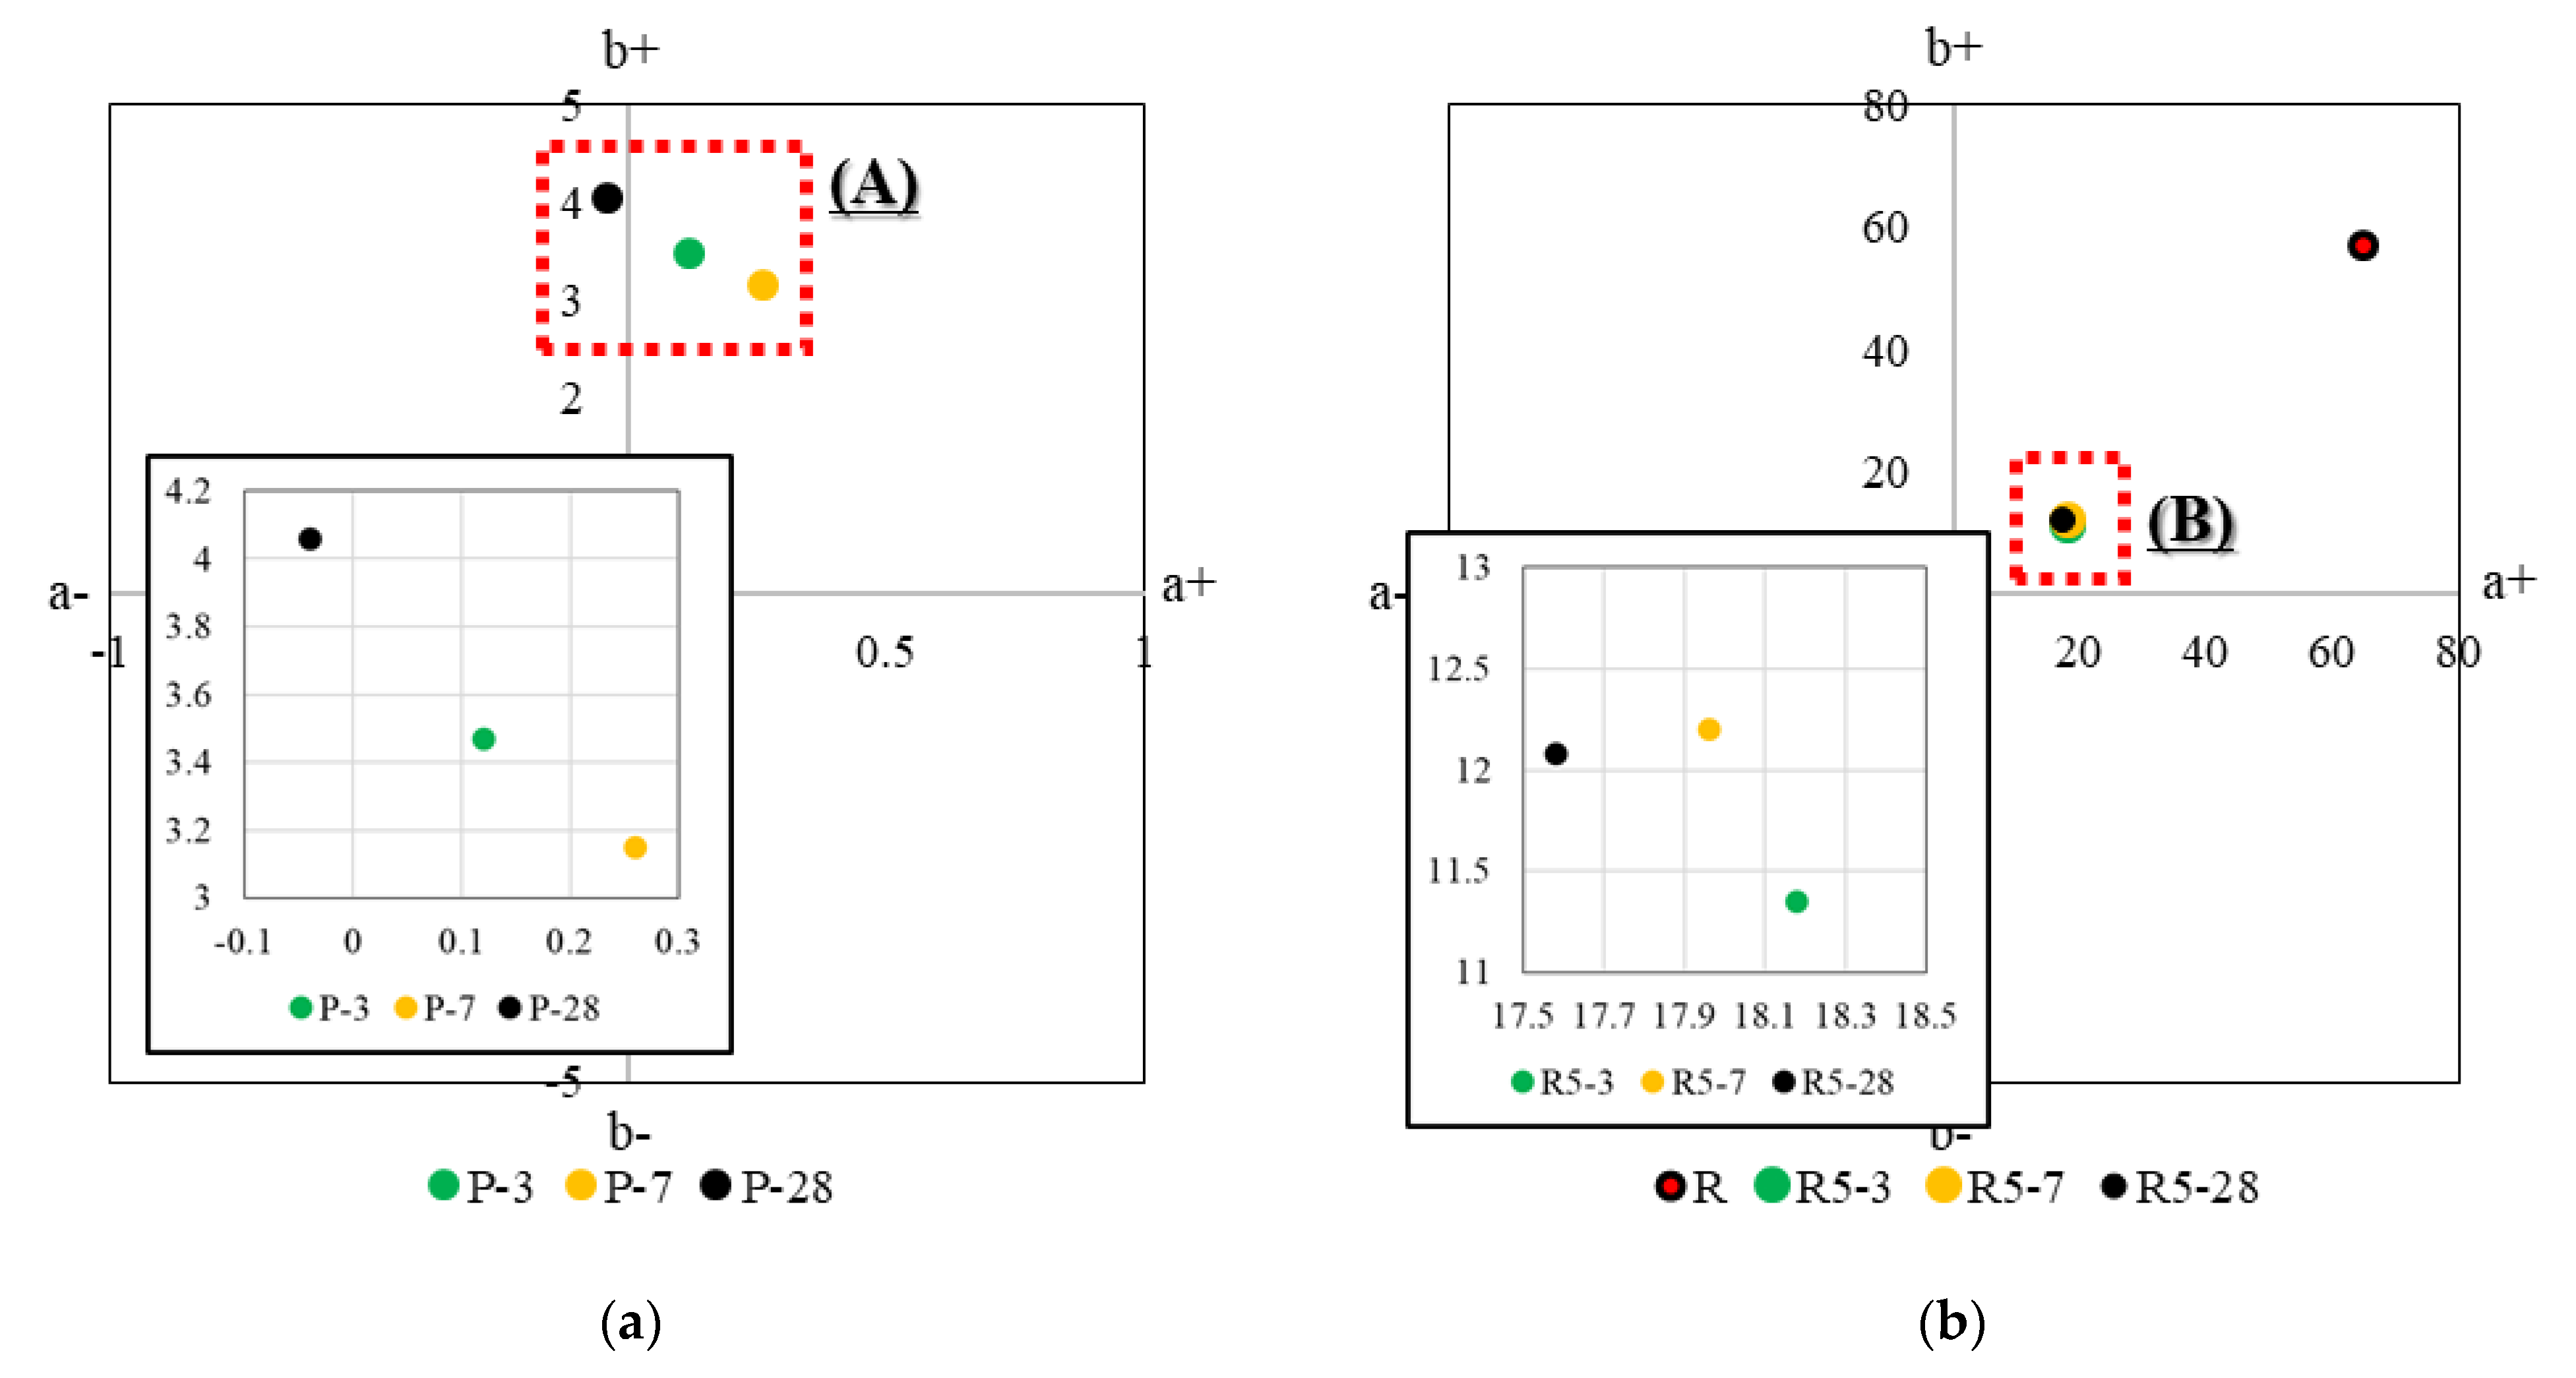
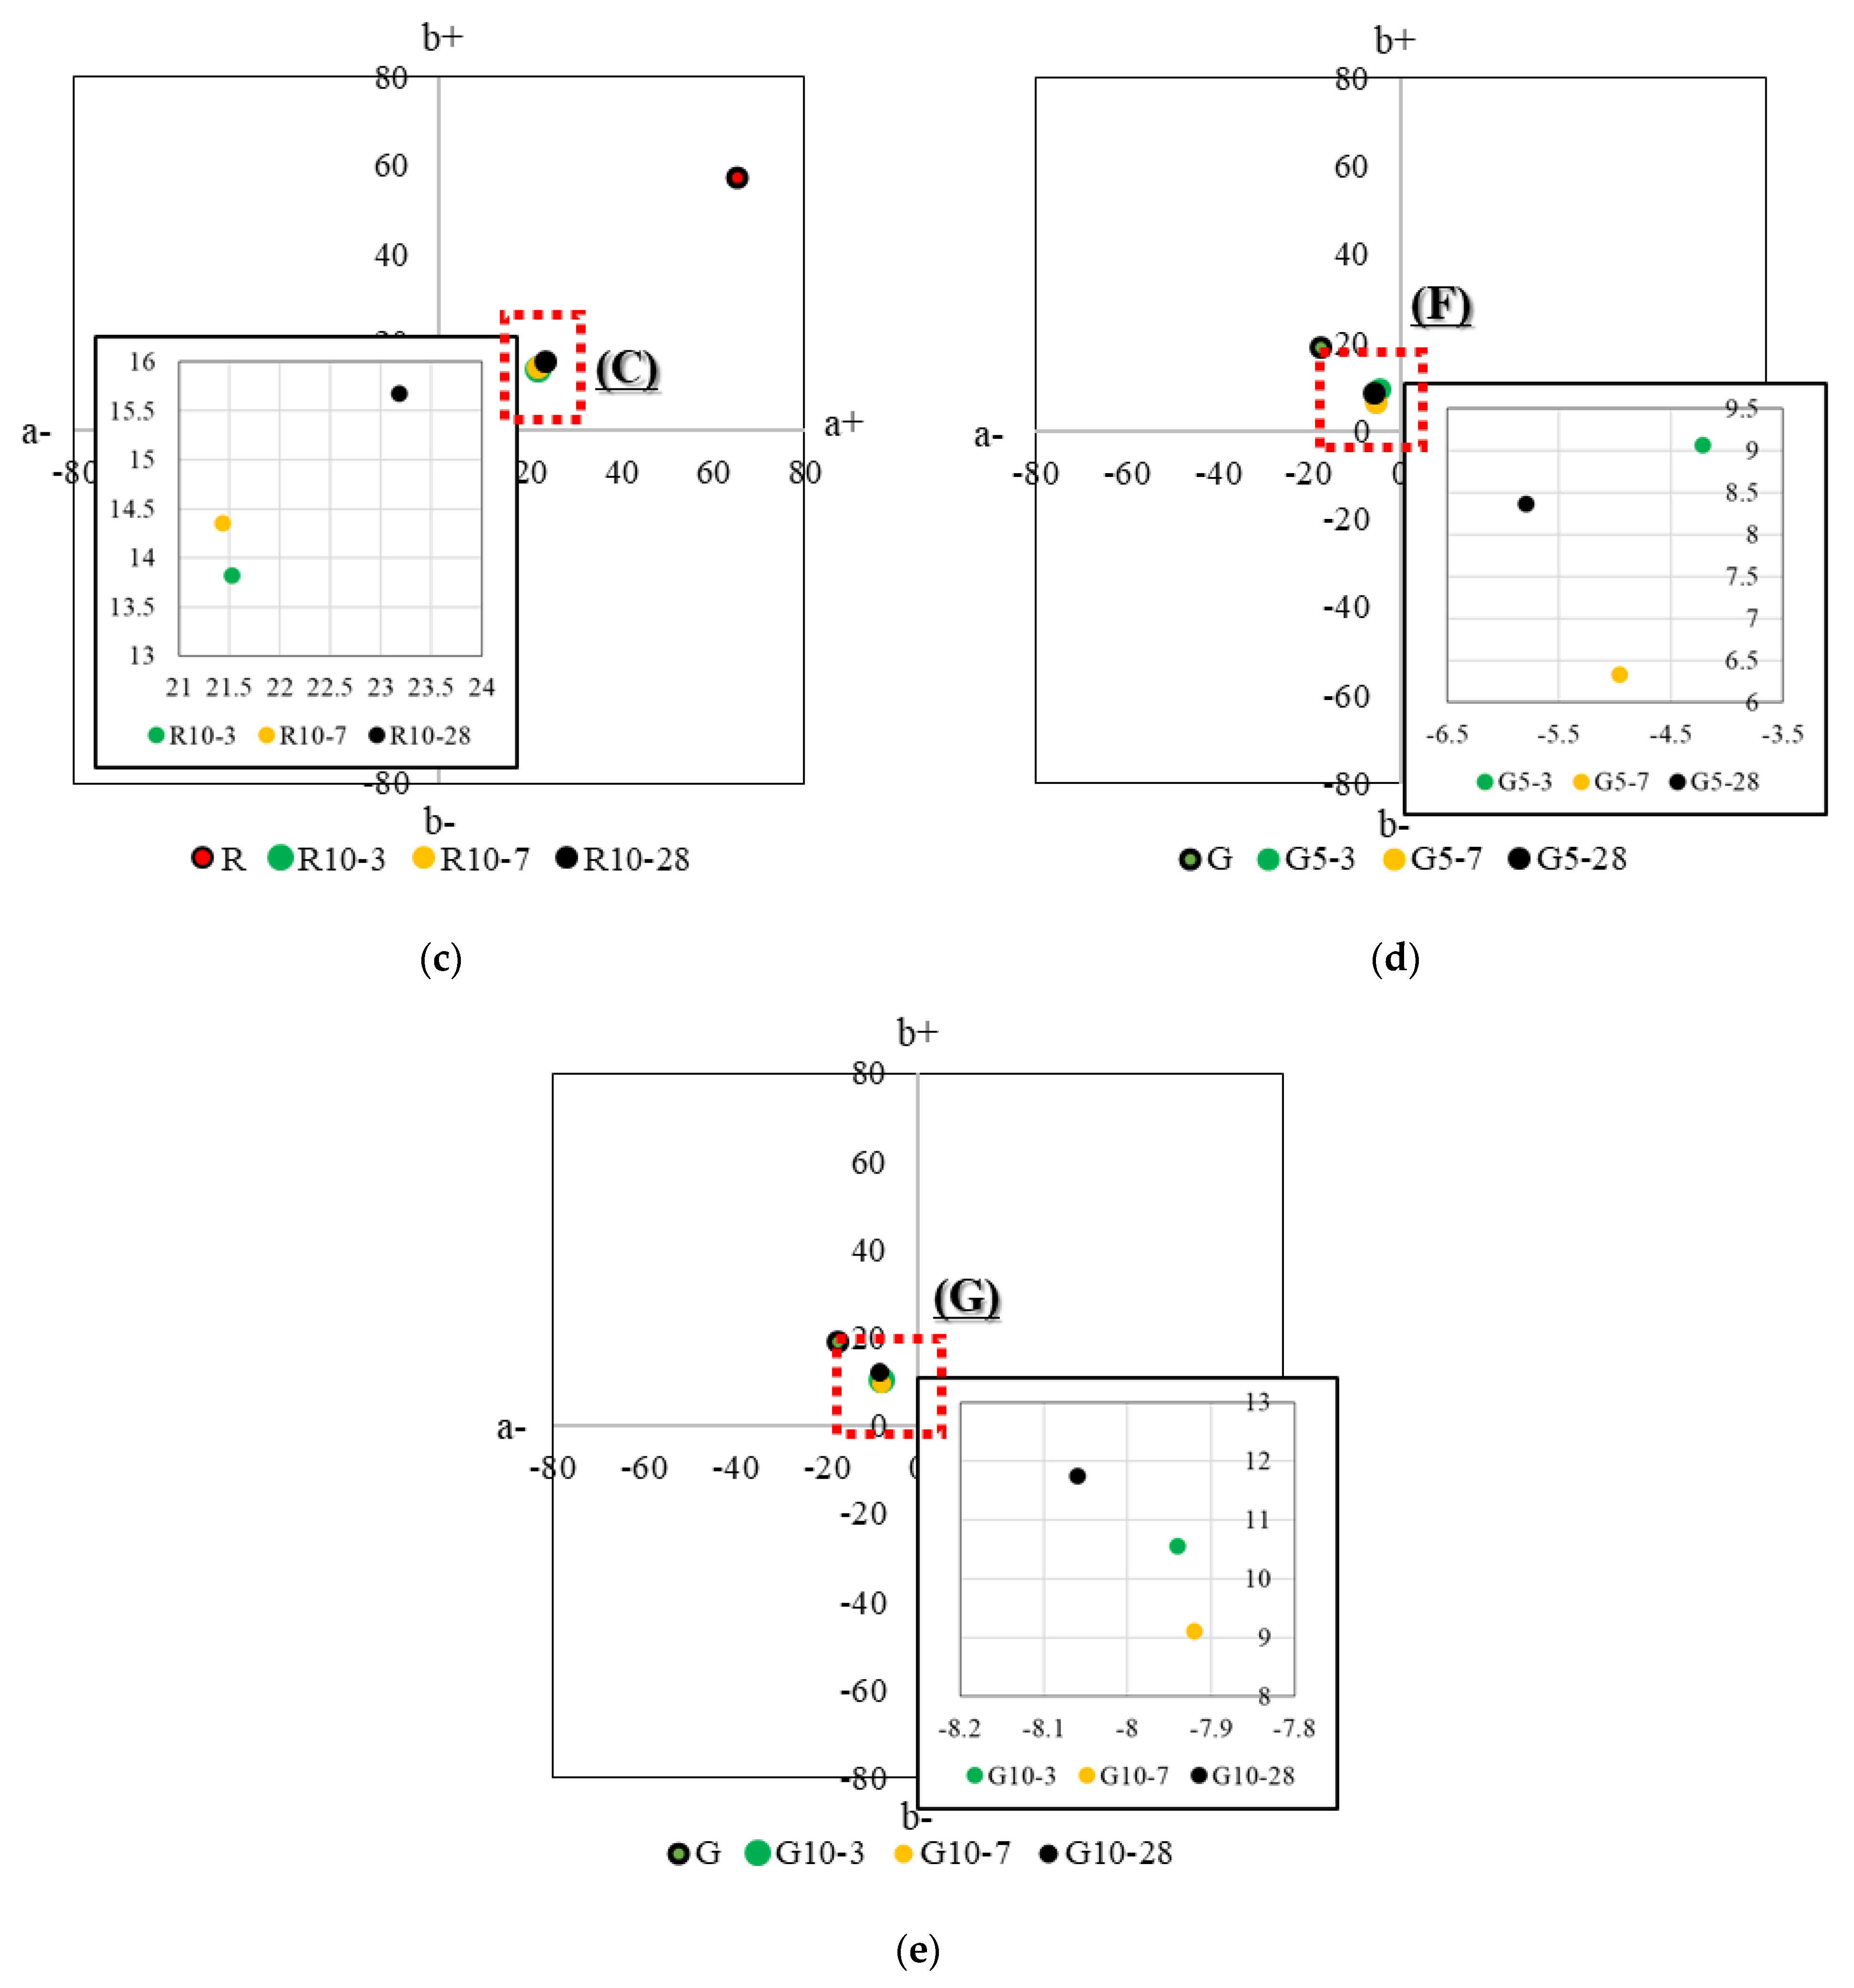
3.5. CIELAB Analysis

Color recognition by the human eye can be separated into three elements: brightness (luminance), hue, and saturation. These are the main elements of the universal system for defining colors that is set by the CIE [46]. In the color analysis experiment performed in this study, the CIELAB color space system was used, and the color difference (ΔE) was calculated using the following equation:
Δ E   = Δ L 2 + Δ a 2 + Δ b 2
where ΔL is the brightness difference, Δa is the difference between red and green, Δb is the difference between yellow and blue, and ΔE is the color difference. In the L*a*b color space, L* represents brightness (luminance) and a* and b* represent chromaticity [47,48]. CIELAB provides a perceptually linear color space or a result of the closest color space [49]. The Euclidean distance between coordinate points can be designated in the CIELAB color space to perceive the color difference of HSCCs according to age, and the color difference can be evaluated according to the stage [50]. Here, 16 points were selected on the surface of a 270 mm × 270 mm specimen, as shown in Figure 7, and the color difference and chromaticity were measured at these points at each day of age.
In this study, the color difference of each specimen at 3 days of age was set as the standard value, and the standard value and color difference (ΔE) were analyzed by age using ΔE as the sum of vectors of each element of the L*a*b color system, as expressed in Equation (1). When the color-difference range according to the age of HSCCs is calculated using Equation (1), the color-difference range suitable for the characteristics of the product can be designated by considering the matching color range of colored UHPC. The designated color-difference range can serve as a color-development specification in concrete products for the addition of pigments.
As presented in Table 3, the color difference of specimen P tended to increase with age, whereas the pigment content in each sample remained constant. However, for other samples, the color difference increased or decreased at 7 and 28 days of age. The color change with age was the smallest in the red-pigmented samples, followed by specimen G10. Specimen G5 exhibited the largest difference, and the color difference between 7 and 28 days was 4.5.
Figure 8 shows the results of analyzing the chromaticity of HSCCs by age, and Table 3 presents the results of analyzing the color of each sample by age. The x-axis of the subplots of Figure 8 represents the red–green axis, and the y-axis represents the yellow–blue axis, using a* and b* as color coordinate indices. The a+ direction is red, and the a− direction is green. Furthermore, the b+ direction is yellow, and the b− direction is blue [51]. Each pigment was located in a certain section (A to G) regardless of age. However, slight differences were observed depending on the age because of the humid environment during the standard curing. Furthermore, in the thermogravimetry results, when the pigment content was 10% for yellow and green in the range of 45–210 °C, which was the hydrate combustion and dehydration section, the proportion of Δm was lower than that at a pigment content of 5%. This result indicated that a slight difference occurred during the reaction between the pigment and the moisture content. In contrast, for the red pigment, the proportion of Δm was similar regardless of its content, confirming a tendency similar to that observed in the chromaticity analysis.
In the case of specimen P, the measurement results at 3 days of age were close to the median values for 7 days and 28 days of age. For the green pigment, the difference in chromaticity was not large for the samples with a pigment content of 10%. However, for the red pigment, the difference in chromaticity was small for samples with a pigment content of 5%. These results show the tinting strength of the pigments, and a small amount of red pigment did not exhibit a significant change in color. For the green pigment, the color did not change as the pigment content increased.

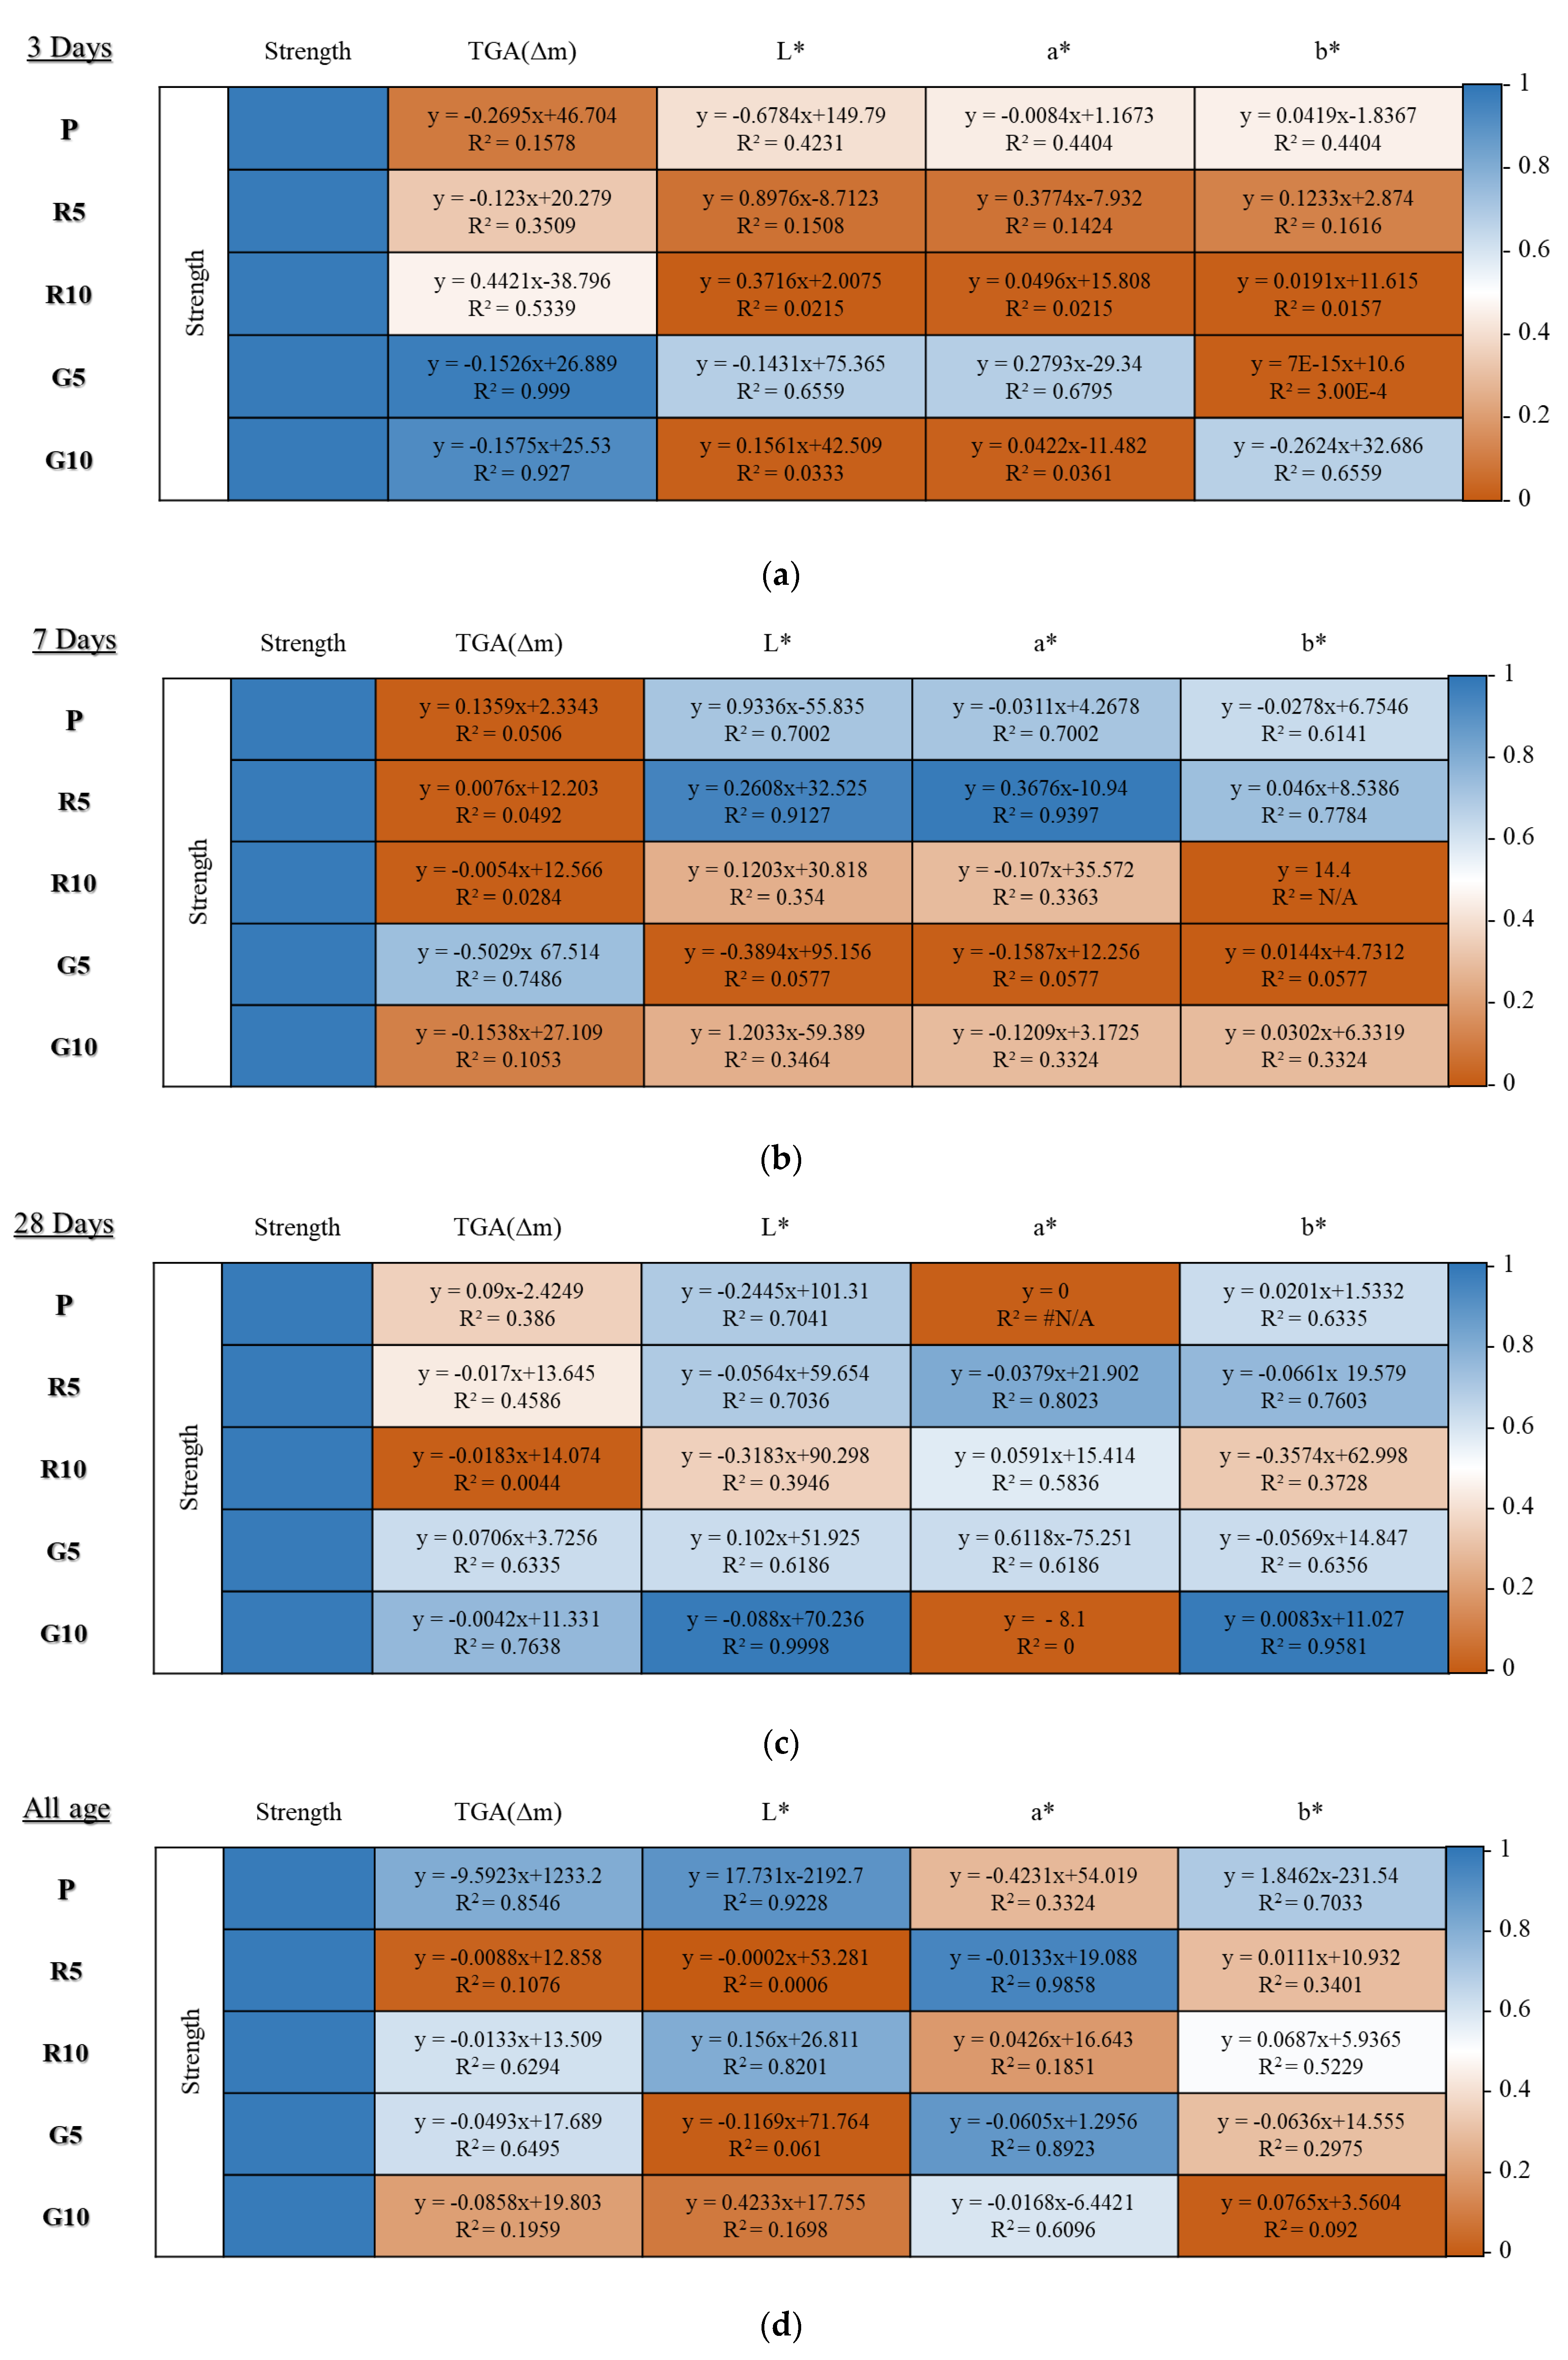
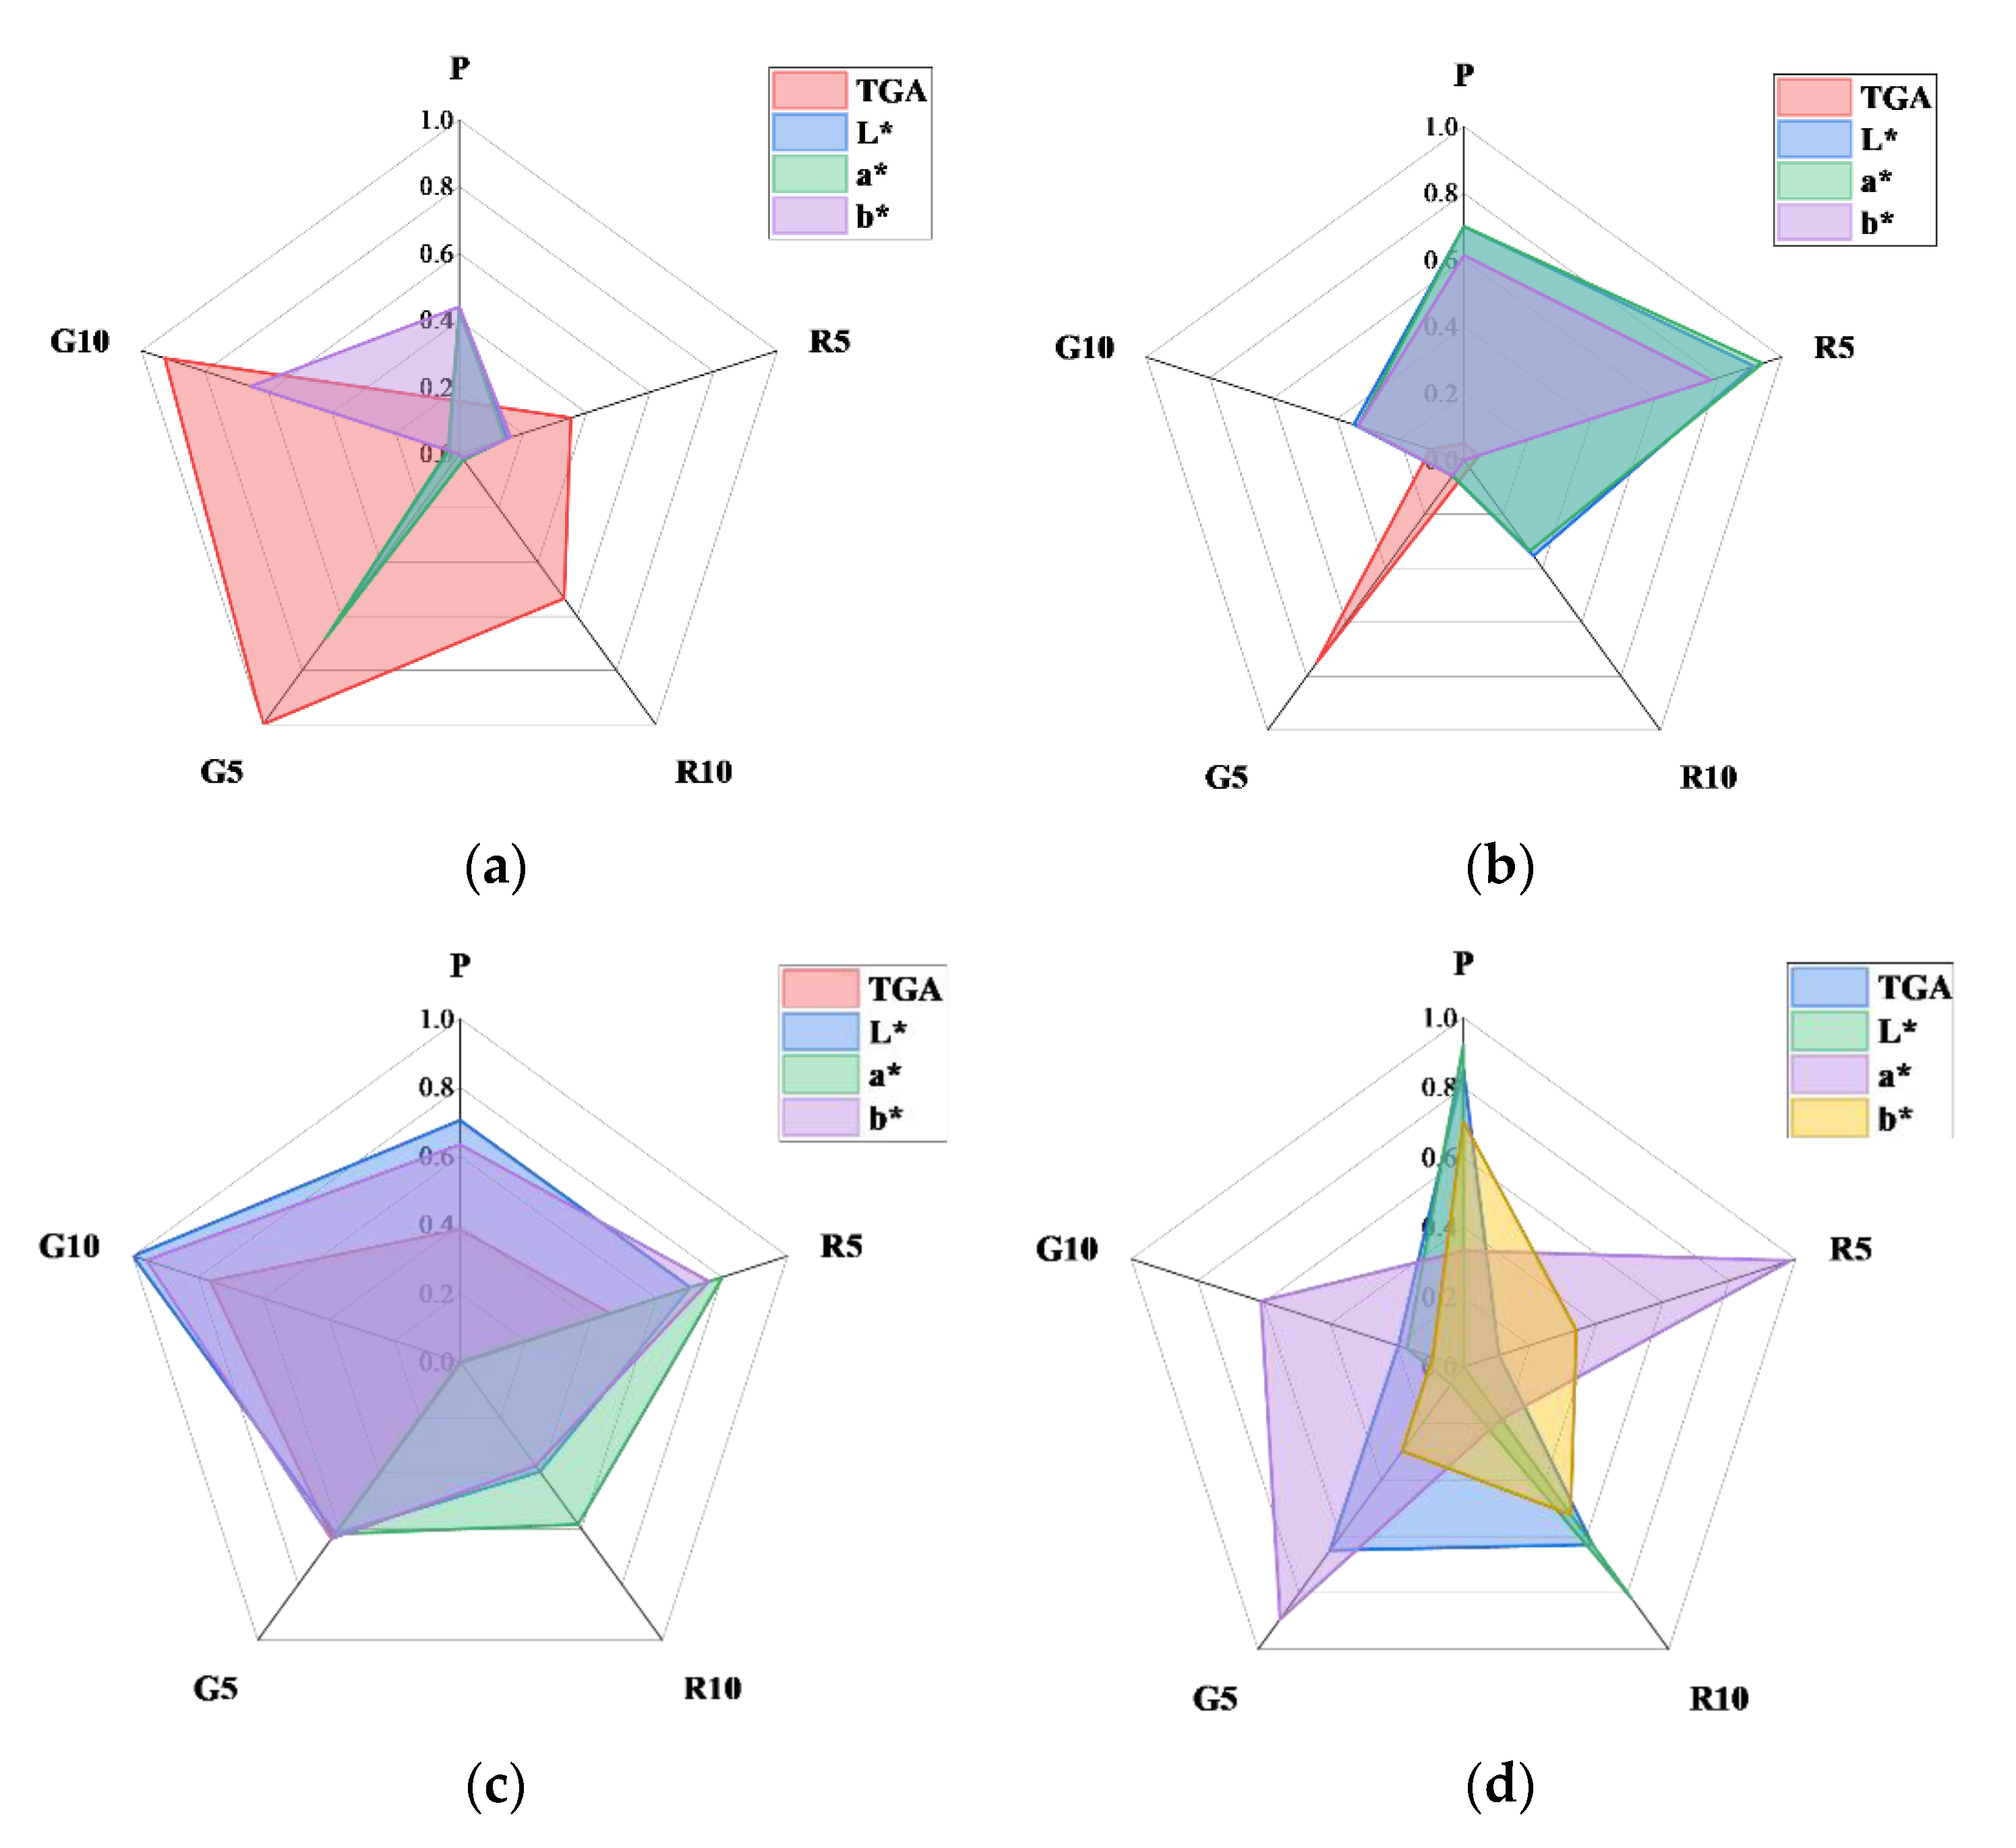
3.6. Coefficient of Determination Analysis of Strength with TGA and Color Difference

The strength, thermogravimetry, and color-difference results of HSCCs were subjected to simple linear regression analysis to find correlations based on the age of the HSCCs. For each model, a linear function formula was derived using a trend line between the strength and TGA (m) as well as color-difference analysis factors at each age. Here, the trend line for each relationship is associated with a coefficient of determination, R2. Figure 9a–d shows the linear functions that represent the correlations between the measurement results and the corresponding R2 values. Data points with R2 close to 1 are indicated in blue, whereas those with R2 close to 0 are indicated in orange. To show the color correlation between the existing pigments, techniques such as Huffman coding were used, and simultaneously, an image color-extraction algorithm using color correlation is being developed [52]. Most existing studies have verified only the relationship between the color-correlation factors, and several studies have been conducted to extract colors via verification analysis. To date, the characteristic factors of concrete and cement composites based on color correlation have not been reviewed in the construction field.
For each specimen aged 3 days, the R2 between strength and other factors was confirmed, and the strength–TGA (Δm) correlation coefficient of the green series showed the highest value. However, the initial intensity of the green series was rather low, and G5 recorded the highest value of m at the corresponding age.
In the case of the red series, the initial strength and Δm were lower than those of P and showed a similar trend even when the mixing rate was increased. If the initial intensity was low, the correlation between Δm and the color factors was judged to be low.
However, the 7-day-old specimen showed a different trend from the 3-day-old specimen. The strength of all specimens increased after the age of 3 days. However, the total Δm in G5 decreased at the age of 7 days. When correlating the strengths of the 7-day-old specimens and Δm, R2 was found to increase when Δm decreased and to decrease when Δm increased. The change in the total amount of hydrate in the specimen at the relevant age decreases as the strength increases. According to the previous analyses, as the strength increases, hydrates are generated, thereby changing the total amount of hydrates. However, in the correlation analysis, the reduction in the amount of hydrate at the time of strength expression was higher in R2. Therefore, this subject requires further analysis. R5 at 7 days of age was considered to have a high correlation between the intensity and color factors. It was judged that the R5 specimen shows color development relative to the initial color when the intensity is expressed.
The 28-day-old specimens showed higher correlations between the strength and analysis factors than the unaged specimens. Except for the a* of specimen P, TGA (Δm) of R10, and a* of G10, R2 was calculated to be 0.5 or higher. This is because trends of continuous increases and decreases in the intensity expression, TGA (Δm), and color factors appear as the age increases.
As observed from the R2 analysis of specimens at all ages, for specimens P, R10, and G5, which showed an approximately constant intensity expression, the R2 value for the correlation of strength with TGA (m) exceeded 0.5 at all ages. Among them, specimen P exhibited an R2 value of 0.8546. In the case of colored samples, a high R2 was measured at L* for P, a* for R5, L* for R10, and a* for the green series when the intensity was expressed. For the R series, a high correlation with the a* of the red–green series was calculated at a mixing rate of 5%, and the correlation with the brightness (L*) increased as the mixing rate increased. In the G series, the a* of the red–green series had the highest correlation with strength, irrespective of the change in the mixing rate. Therefore, it was possible to determine the correlation of factors partially related to strength expression in the specimens containing red and green pigments at all ages. Here, a* represents red–green color information and b* represents blue–yellow color information in such a manner that the strength is not affected by the pigments. Consequently, it would be effective to analyze the relationship between strength and color to understand the trend of L*, which indicates the brightness.
Figure 10 shows the R2 distributions between strength and the other factors at different ages. The distribution could be compared to the difference between the R2 of a specific factor and that of the other factors at a certain age, as shown in Figure 9.
The linear relationships between the experimental characteristics of the prepared HSCCs were identified. The correlation analysis matrices shown in Figure 9 and Figure 10 illustrate the relative experimental trends of HSCCs based on the pigment type and mixing rate and exhibit unique R2 values. This result could serve as a reference for determining the weight factors during the development of HSCCs in the future.
According to previous studies, the strength decreases when pigments absorb some amounts of the mixing water intended for the hydration of unhardened concrete, and this decrease depends on the components and types of pigments used [4]. Furthermore, in the case of red pigments, pigment contents of 4% or 3–6% and 6–8% yield the optimal performance [1,5]. In general, the green pigment shows a tendency of strength decrease with increasing mixing rate [1]. The results obtained in the present study show a similar trend. Existing studies have demonstrated the strength, fluidity, and slump results of mixing pigments in normal-strength concrete. However, these studies have not considered experimental formulations that could be used to determine the mechanical properties of high-strength concrete-containing pigments. Therefore, in the present study, we performed various analyses to develop an experimental formulation of the HSCCs and to identify correlations between strength and other experimental factors, except for fluidity and slump. Through the TGA estimation of the hydrate produced at different ages as well as the CIELAB analysis of the color development of pigments, we demonstrated that it is possible to verify the correlation distributions of the above factors in the intensity expression. In addition, for concrete structures and finishing materials that employ HSCCs, the findings of this study could be used as a reference for determining the trend of strength development based on factors other than fluidity.

4. Conclusions

In this study, the mechanical properties of HSCCs containing pigments were determined, and the changes in the physical properties of ultra-high-strength cement composites due to the addition of actual pigments were demonstrated via thermal and XRD analyses. In addition, the hydrates generated in the test samples were analyzed using TGA. The differences in color expression of HSCCs at different sample ages were identified via CIELAB analyses. R2 was evaluated from a correlation analysis, and the linear relationships between the obtained factors were determined. The following conclusions can be drawn from the results of this study:
  • The initial strengths of the specimens mixed with pigments were lower than those of the specimens without a pigment in a steam-curing environment. However, the strength development accelerated with specimen age. The highest strength development was observed in the specimens mixed with 10% red pigment. Specimens containing the red pigment exhibited higher strengths than specimen P (without pigments) because of the presence of nano-Fe2O3 particles in the former. This result shows the pore-filling effect of nano-Fe2O3 particles.
  • Because of the high internal density of HSCCs, the specimens mixed with pigments, except for R10, exhibited a lower shrinkage rate than specimen P. After the steam-curing process, the shrinkage of specimen R10 increased to 0.55% because of the accelerated internal hydration caused by the higher Fe2O3 content in the red pigment compared to that of the R5 specimen.
  • The results of the differential thermal analysis using the stepwise method revealed that most of the hydration was completed during the initial steam-curing process. Specimen G10 exhibited the highest combustion rate at approximately 300 °C because residual hydrates (Afm) were generated by the initial hydration delay. Furthermore, the hydration characteristics of the specimens that completed the steam-curing process were determined by calculating the residual mass (Δm) of calcium hydroxide.
  • In the analysis of the chromaticity and color difference of the specimens, the red-pigmented samples exhibited differences in chromaticity with increasing age, regardless of the pigment content, and the color difference exhibited a similar trend. For the green-pigmented specimens, the chromaticity remained constant with increasing pigment content, irrespective of the specimen age, but the color difference was considerable when the pigment content was approximately 5%.
  • The correlation of strength with the thermogravimetry, shrinkage, and color analysis results of C-UHSCC at different ages was analyzed, and R2 tended to increase as the total TGA (Δm) decreased. This was because strength developed at the initial stages of aging. The correlation between the TGA intensity (Δm) and color components tended to increase with age. From the R2 analysis at all ages, we observed the following. The lower the mixing rate, the higher the correlation between the intensity and L* in the R series. Furthermore, the higher the mixing rate, the higher the correlation between intensity and a*. The G series exhibited a high correlation with a* regardless of the incorporation rate.
This study analyzed the correlations of specific factors influencing the strength of colored cement composites. However, further research is required to determine whether these correlations are valid for UHPC mixing. The results of this study could serve as a guideline for future studies investigating the effect of pigment addition on the performance of cementitious composites.

Author Contributions

Conceptualization, S.P., G.K., D.J. and J.N.; Methodology, S.P., B.C. and M.K.; Supervision, S.P. and J.N.; Writing—original draft, S.P., G.K., G.C., N.P., D.J., B.C., M.K. and J.N.; Investigation, G.C. and N.P.; Visualization, G.C.; Methodology, B.C. and M.K. All authors have read and agreed to the published version of the manuscript.

Funding

This research was funded by the National Research Foundation of Korea, supported by the Ministry of Science and ICT of Korea in 2020 (grant number 2020R1C1C101403812).

Institutional Review Board Statement

Not applicable.

Informed Consent Statement

Not applicable.

Data Availability Statement

Not applicable.

Conflicts of Interest

The authors declare that they have no known competing financial interest or personal relationship that could have appeared to influence the work reported in this paper.

References

  1. Seo, S.G.; Yeon, G.W.; Jeon, C.G.; Kim, J.; Kim, J.B. Fundamental study on the engineering properties of colored concrete. J. Archit. Inst. Korea-Struct. Syst. 2009, 25, 107–114. [Google Scholar]
  2. Hatami, L.; Jamshidi, M. Influence of pigment content and cement type on appearance and performance of colored self-compacting mortars (C-SCMs). Int. J. Civ. Eng. 2017, 15, 727–736. [Google Scholar] [CrossRef]
  3. Oh, Y.H.; Lim, O.Y. Influence of inorganic pigments on physical properties and chromaticity of color concretes. J. Kor. Soc. Color Stud. 2014, 28, 133–142. [Google Scholar] [CrossRef]
  4. Lee, S.R.; Kim, J.S. The effects of coloring admixture on the material properties of color. Concrete 2000, 10, 157–168. [Google Scholar]
  5. Lee, H.-S.; Lee, J.-Y.; Yu, M.-Y. Influence of iron oxide pigments on the properties of concrete interlocking blocks. Cem. Concr. Res. 2003, 33, 1889–1896. [Google Scholar] [CrossRef]
  6. Kim, T.C.; Kim, J.; Jeon, C.G.; Yeon, G.W.; Shin, D.A.; Ryu, H.G. The study on the fundamental properties of the colored concrete according to the kinds of coloring agents and the variation of their admixture ratio. J. Reg. Assoc. Architect. Inst. Kor. 2010, 1, 509–512. [Google Scholar] [CrossRef] [Green Version]
  7. Jung, G.-H.; Im, N.-K.; Jung, J.-Y.; Jung, S.-J. Manufacturing and construction method of precast concrete. J. Kor. Inst. Build. Constr. 2002, 2, 67–74. [Google Scholar]
  8. Zurita Ares, M.C.; Villa González, E.; Torres Gómez, A.I.; Fernández, J.M. An easy method to estimate the concentration of mineral pigments in colored mortars. Dyes. Pig. 2014, 101, 29–337. [Google Scholar] [CrossRef]
  9. López, A.; Tobes, J.M.; Giaccio, G.; Zerbino, R. Advantages of mortar-based design for coloured self-compacting concrete. Cem. Concr. Compos. 2009, 31, 754–761. [Google Scholar] [CrossRef]
  10. Park, J.H.; Kim, J.B.; Jeong, Y. An experimental study on properties of color concrete with types and addition ratio of pigment. In Proceedings of the Korea Concrete Institute Conference, Korea Concrete Institute, Seoul, Korea, 16–19 October 2018; pp. 673–676. [Google Scholar]
  11. Chalangaran, N.; Farzampour, A.; Paslar, N. Nano silica and metakaolin effects on the behavior of concrete containing rubber crumbs. CivilEng 2020, 1, 264–274. [Google Scholar] [CrossRef]
  12. Mansouri, I.; Shahheidari, F.S.; Hashemi, S.M.A.; Farzampour, A. Investigation of steel fiber effects on concrete abrasion resistance. Adv. Concr. Constr. 2020, 9, 367–374. [Google Scholar] [CrossRef]
  13. Zhang, J.; Yu, R.; Shui, Z.; Liu, K. Hydration kinetics and microstructure development of ultra-high performance concrete (UHPC) subjected to microwave pre-curing. Cem. Concr. Compos. 2022, 129, 104484. [Google Scholar] [CrossRef]
  14. Khosravani, M.R.; Silani, M.; Weinberg, K. Fracture studies of ultra-high performance concrete using dynamic Brazilian tests. Theor. Appl. Fract. Mech. 2018, 93, 302–310. [Google Scholar] [CrossRef]
  15. Kazemian, M.; Shafei, B. Internal curing capabilities of natural zeolite to improve the hydration of ultra-high performance concrete. Constr. Build. Mater. 2022, 340, 127452. [Google Scholar] [CrossRef]
  16. Chen, Q.; Ma, R.; Li, H.; Jiang, Z.; Zhu, H.; Yan, Z. Effect of chloride attack on the bonded concrete system repaired by UHPC. Constr. Build. Mater. 2021, 272, 121971. [Google Scholar] [CrossRef]
  17. Gopinath, S.; Mouli, P.C.; Murthy, A.R.; Iyer, N.R.; Maheswaran, S. Effect of nano silica on mechanical properties and durability of normal strength concrete. Arch. Civ. Eng. 2012, 58, 433–444. [Google Scholar] [CrossRef]
  18. Schmidt, M.; Amrhein, K.; Braun, T.; Glotzbach, C.; Kamaruddin, S.; Tänzer, R. Nanotechnological improvement of structural materials–Impact on material performance and structural design. Cem. Concr. Compos. 2013, 36, 3–7. [Google Scholar] [CrossRef]
  19. Nazari, A.; Riahi, S. Computer-aided design of the effects of Fe2O3 nanoparticles on split tensile strength and water permeability of high strength concrete. Mater. Des. 2011, 32, 3966–3979. [Google Scholar] [CrossRef]
  20. Uysal, M. The use of waste maroon marble powder and iron oxide pigment in the production of coloured self-compacting concrete. Adv. Civ. Eng. 2018, 2018, 8093576. [Google Scholar] [CrossRef] [Green Version]
  21. Alcantara, P.S.X.; Nóbrega, A.C. Colored concrete interlocking blocks with addition of red ceramic waste for iron oxide pigments reduction. Proc. Constr. Sustain. Mater. Technol. Nocmat. 2015, 2015, 1–11. [Google Scholar]
  22. Lee, H.-S.; Lee, J.-Y.; Yu, M.-Y. Influence of inorganic pigments on the fluidity of cement mortars. Cem. Concr. Res. 2005, 35, 703–710. [Google Scholar] [CrossRef]
  23. Anwar, A.; Mohammed, B.S.; Wahab, M.A.; Liew, M.S. Enhanced properties of cementitious composite tailored with graphene oxide nanomaterial—A review. Dev. Built Environ. 2020, 1, 100002. [Google Scholar] [CrossRef]
  24. C109/C109M-16a; Standard Test Method for Compressive Strength Hydraulic Cement Mortars (Using 2-in, Or [50-mm] Cube Specimens). ASTM: West Conshohocken, PA, USA, 2021.
  25. Yoon, H.N.; Seo, J.; Kim, S.; Lee, H.K.; Park, S. Hydration of calcium sulfoaluminate cement blended with blast-furnace slag. Constr. Build. Mater. 2021, 268, 121214. [Google Scholar] [CrossRef]
  26. Seo, J.; Kim, S.; Park, S.; Yoon, H.N.; Lee, H.K. Carbonation of calcium sulfoaluminate cement blended with blast furnace slag. Cem. Concr. Compos. 2021, 118, 103918. [Google Scholar] [CrossRef]
  27. Park, S.; Jeong, Y.; Moon, J.; Lee, N. Hydration characteristics of calcium sulfoaluminate (CSA) cement/Portland cement blended pastes. J. Build. Eng. 2021, 34, 101880. [Google Scholar] [CrossRef]
  28. Park, S.M.; Jang, J.G.; Lee, N.K.; Lee, H.K. Physicochemical properties of binder gel in alkali-activated fly ash/slag exposed to high temperatures. Cem. Concr. Res. 2016, 89, 72–79. [Google Scholar] [CrossRef]
  29. Nurse, R.W. Steam curing of concrete. Mag. Concr. Res. 1949, 1, 79–88. [Google Scholar] [CrossRef]
  30. Du, J.; Meng, W.; Khayat, K.H.; Bao, Y.; Guo, P.; Lyu, Z.; Abu-obeidah, A.; Nassif, H.; Wang, H. New development of ultra-high-performance concrete (UHPC). Compos. B Eng. 2021, 224, 109220. [Google Scholar] [CrossRef]
  31. Baoju, L.; Youjun, X.; Shiqiong, Z.; Jian, L. Some factors affecting early compressive strength of steam-curing concrete with ultrafine fly ash. Cem. Concr. Res. 2001, 31, 1455–1458. [Google Scholar] [CrossRef]
  32. Liu, B.; Jiang, J.; Shen, S.; Zhou, F.; Shi, J.; He, Z. Effects of curing methods of concrete after steam curing on mechanical strength and permeability. Constr. Build. Mater. 2020, 256, 119441. [Google Scholar] [CrossRef]
  33. Zeyad, A.M.; Tayeh, B.A.; Adesina, A.; de Azevedo, A.R.; Amin, M.; Hadzima-Nyarko, M.; Agwa, I.S. Review on effect of steam curing on behavior of concrete. Clean. Mater. 2022, 3, 100042. [Google Scholar] [CrossRef]
  34. Farzampour, A. Temperature and humidity effects on behavior of grouts. Adv. Concr. Constr. 2017, 5, 659. [Google Scholar] [CrossRef]
  35. Nazari, A.; Riahi, S.; Riahi, S.; Shamekhi, S.F.; Khademno, A. Benefits of Fe2O3 nanoparticles in concrete mixing matrix. J. Am. Sci. 2010, 6, 102–106. [Google Scholar]
  36. Khoshakhlagh, A.; Nazari, A.; Khalaj, G. Effects of Fe2O3 nanoparticles on water permeability and strength assessments of high strength self-compacting concrete. J. Mater. Sci. Technol. 2012, 28, 73–82. [Google Scholar] [CrossRef]
  37. Seo, J.H.; Park, S.M.; Lee, H.K. Evolution of the binder gel in carbonation-cured Portland cement in an acidic medium. Cem. Concr. Res. 2018, 109, 81–89. [Google Scholar] [CrossRef]
  38. Wang, D.; Shi, C.; Wu, Z.; Xiao, J.; Huang, Z.; Fang, Z. A review on ultra high performance concrete: Part II. Hydration, microstructure and properties. Constr. Build. Mater. 2015, 96, 368–377. [Google Scholar] [CrossRef]
  39. Shi, Z.; Geiker, M.R.; Lothenbach, B.; De Weerdt, K.; Garzón, S.F.; Enemark-Rasmussen, K.; Skibsted, J. Friedel’s salt profiles from thermogravimetric analysis and thermodynamic modelling of Portland cement-based mortars exposed to sodium chloride solution. Cem. Concr. Compos. 2017, 78, 73–83. [Google Scholar] [CrossRef]
  40. Song, K.; Lee, B.Y.; Hong, G.H.; Gong, M.H.; Song, J.G. Effects of basicity on the carbonation characteristics of alkali-activated slag mortar. J. Korea Concr. Inst. 2012, 24, 577–584. [Google Scholar] [CrossRef]
  41. Scrivener, K.; Snellings, R.; Lothenbach, B. A Practical Guide to Microstructural Analysis of Cementitious Materials; CRC Press: Boca Raton, FL, USA, 2018. [Google Scholar]
  42. Criado, Y.A.; Alonso, M.; Abanades, J.C. Kinetics of the CaO/Ca (OH)2 hydration/dehydration reaction for thermochemical energy storage applications. Ind. Eng. Chem. Res. 2014, 53, 12594–12601. [Google Scholar] [CrossRef] [Green Version]
  43. Mo, Z.; Gao, X.; Su, A. Mechanical performances and microstructures of metakaolin contained UHPC matrix under steam curing conditions. Constr. Build. Mater. 2021, 268, 121112. [Google Scholar] [CrossRef]
  44. Huang, W.; Kazemi-Kamyab, H.; Sun, W.; Scrivener, K. Effect of cement substitution by limestone on the hydration and microstructural development of ultra-high performance concrete (UHPC). Cem. Concr. Compos. 2017, 77, 86–101. [Google Scholar] [CrossRef]
  45. Kang, S.H.; Moon, J.H.; Hong, S.G. Effect of internal curing by super-absorbent polymer (SAP) on hydration, autogenous shrinkage, durability and mechanical characteristics of ultra-high performance concrete (UHPC). J. Korea Concr. Inst. 2016, 28, 317–328. [Google Scholar] [CrossRef] [Green Version]
  46. Lemaire, G.; Escadeillas, G.; Ringot, E. Evaluating concrete surfaces using an image analysis process. Constr. Build. Mater. 2005, 19, 604–611. [Google Scholar] [CrossRef]
  47. Schanda, J. Colorimetry: Understanding the CIE Systems; John Wiley & Sons: Hoboken, NJ, USA, 2007. [Google Scholar]
  48. Hirschler, R.; Zwinkels, J. Use of CIE colorimetry in the pulp, paper, and textile industries. In Colorimetry: Understanding the CIE System; Wiley: New York, NY, USA, 2007; pp. 427–428. [Google Scholar]
  49. Ford, A.; Roberts, A. Colour Space Conversions; Westminster University: London, UK, 1998; pp. 1–31. [Google Scholar]
  50. Stone, M. A Field Guide to Digital Color; CRC Press: Boca Raton, FL, USA, 2016. [Google Scholar]
  51. Lee, J.Y.; Go, S.S. Effect Analysis of Inorganic Pigment on the Colors of Colored Cement Mortars Applying CIE L*a*b* Color System. J. Archit. Inst. Korea Struct. Constr. 2003, 19, 125–132. [Google Scholar]
  52. Shao, L.; Rehman, A.U. Image demosaicing using content and colour-correlation analysis. Sig. Process. 2014, 103, 84–91. [Google Scholar] [CrossRef]
Figure 1. Photographs of HSCCs. Top row: manufacturing process; bottom row: manufactured specimens with different pigment types.
Applsci 12 07667 g001
Figure 2. Compressive strength at each age and fracture images of specimens. The strengths at different ages are indicated in the bar diagram, and the error range is within the 95% confidence interval.
Applsci 12 07667 g002aApplsci 12 07667 g002b
Figure 3. TGA of samples at three days. (a) TGA results of specimen P at the age of three days, (b) TGA results of specimens R5 and R10 at the age of three days, and (c) TGA results of specimens G5 and G10 at the age of three days.
Applsci 12 07667 g003
Figure 4. TGA of samples at seven days. (a) TGA results of specimen P at the age of seven days, (b) TGA results of specimens R5 and R10 at the age of seven days, and (c) TGA results of specimens GR5 and G10 at the age of seven days.
Applsci 12 07667 g004aApplsci 12 07667 g004b
Figure 5. TGA of samples at 28 days. (a) TGA results of specimen P at the age of 28 days, (b) TGA results of specimens R5 and R10 at the age of 28 days, and (c) TGA results of specimens G5 and G10 at the age of 28 days.
Applsci 12 07667 g005aApplsci 12 07667 g005b
Figure 6. XRD patterns of samples showing the specimen powders produced at 28 days of age, where peaks B, C, and Q represent belite, calcite, and quartz, respectively.
Applsci 12 07667 g006
Figure 7. Chromaticity analysis points marked on a specimen.
Applsci 12 07667 g007
Figure 8. CIELAB analysis of HSCCs. The average coordinates of color measurement from (1) to (9) are presented in Figure 7. (a) Average value of the color-measurement section of specimen P at each age, (b) average value of the color-measurement section of specimen R5 at each age, (c) average value of the color-measurement section of specimen R10 at each age, (d) average value of the color-measurement section of specimen G5 at each age, and (e) average value of the color-measurement section of specimen G10 at each age.
Applsci 12 07667 g008aApplsci 12 07667 g008b
Figure 9. Correlation analysis matrices of HSCCs at different ages, showing the R2 of specific factors measured at (a) 3 days, (b) 7 days, (c) 28 days, and (d) all ages (3–28 days).
Applsci 12 07667 g009
Figure 10. Specialized matrices showing the R2 distribution of each HSCC specimen at different ages: (a) 3 days, (b) 7 days, (c) 28 days, and (d) 3–28 days.
Applsci 12 07667 g010
Table 1. Chemical compositions of binder and pigments.
Binder (wt. %)CaOSiO2Al2O3MgONa2OK2OSO3Fe2O3TiO2
White cement66.7916.144.402.470.081.183.233.830.34
Silica fume0.0299.00.300.010.050.020.050.050.06
Silica powder0.0599.00.300.050.050.050.050.050.06
Pigment (wt. %)AlCaTiCrFeCoZnAsSb
Red0.000.030.000.0026.400.000.010.020.05
Green0.000.000.0021.260.000.010.010.020.01
Table 2. Mix proportions of specimens (mass ratio).
Mixture ID.CementSilica FumeSilica PowderWaterSP AdmixturePigment
P10.230.330.260.040
R50.05
R100.1
G50.05
G100.1
Table 3. Color-difference analysis results of HSCCs.
IDCuring Times
(Days)
XYZΔXΔYΔZΔEL*a*b*ΔL*Δa*Δb*
P330.632.232.00.00.00.00.063.50.13.50.00.00.0
730.231.831.8−0.4−0.4−0.20.563.20.33.2−0.40.2−0.3
2838.740.840.38.18.68.36.670.00.04.16.5−0.20.6
R5324.221.417.0−6.3−10.8−15.022.253.418.211.4−10.118.17.9
723.921.116.4−6.7−11.1−15.622.453.118.012.2−10.417.88.7
2826.023.218.2−4.6−9.0−13.821.153.317.612.1−8.317.58.6
R10317.214.310.0−13.4−17.9−22.030.344.721.513.8−18.821.410.4
718.915.911.1−11.7−16.3−20.929.246.821.414.4−16.721.310.9
2820.517.011.5−10.1−15.2−20.530.348.223.215.7−15.323.112.2
G5328.230.927.0−2.3−2.3−5.17.262.5−4.29.1−1.1−4.35.6
718.820.919.0−11.8−11.8−13.012.252.8−5.06.3−10.7−5.12.9
2829.432.629.0−1.2−1.2−3.07.763.5−5.88.40.3−5.94.9
G10320.823.719.5−9.8−9.8−12.513.255.8−7.910.6−7.7−8.17.1
716.619.116.0−14.0−14.0−16.016.150.8−7.99.1−12.8−8.05.6
2826.630.224.6−4.0−4.0−7.411.861.8−8.111.8−1.7−8.28.3
Publisher’s Note: MDPI stays neutral with regard to jurisdictional claims in published maps and institutional affiliations.

