Article

Evaluation of Performance of Polyacrylamide-Modified Compacted Clay as a Gas Barrier: Water Retention and Gas Permeability and Diffusion Characteristics

1
Jiangsu Key Laboratory of Urban Underground Engineering & Environmental Safety, Institute of Geotechnical Engineering, Southeast University, Nanjing 210096, China
2
Zijin (Changsha) Engineering Technology Co., Ltd., Changsha 410006, China
3
School of Civil Engineering, Sun Yat-sen University, Guangzhou 510275, China
*
Author to whom correspondence should be addressed.
These authors contributed equally to this work.
Appl. Sci. 2022, 12(16), 8379; https://doi.org/10.3390/app12168379
Submission received: 2 May 2022 / Revised: 4 June 2022 / Accepted: 9 June 2022 / Published: 22 August 2022

Abstract

:
In this paper, the performance of a gas barrier that consisted of polyacrylamide (PAM)-modified compacted clayey soil was experimentally explored. The moisture content and water loss characteristics of the tested soils were adopted as indicative indices of water retention capacity (WRC). The gas permeability (Kp) and gas diffusion coefficient (Dp) of the modified compacted clays were evaluated via gas permeability and gas diffusion tests. The test results showed that the moisture content of the modified compacted clay samples subjected to drying tests increased with increasing polyacrylamide content. Kp and Dp decreased with increasing PAM content. Compared with 0.2% PAM content, the Kp of the sample with 1.0% PAM was reduced by ten times, and the Dp was reduced to ~35%. Compared to the unmodified clay, the liquid limit of the PAM-modified clay increased by 45~55%. Comparison of the liquid limit tests between this study and previous studies revealed that the liquid limit ratio of the zwitterionic polyacrylamide (ZP)-modified soil was much higher than the other material-modified soils. The results of this study are useful to facilitate the application of modified compacted clays as gas barrier materials at industrial contaminated sites.

1. Introduction

The compacted clay cover (CCC), as one of the main horizontal barriers, is widely applied in industrial organics contaminated sites to effectively control upward migration of volatile organic compound (VOC) and semi-volatile organic compound (SVOC) vapors or gases [1]. Studies reveal that gas migration through the CCC in landfills is predominated by diffusion [2]. Diffusion of VOC and SVOC gases through CCC may lead to the emission of toluene gas in landfills, migrating from pollution sources in deep soil to the air [3]. Upward migration of gas in clay occurs via advection [4] and diffusion [5]. Diffusion is the primary mechanism of VOC and SVOC gas migration in clayey soils on most occasions [6,7]. Advection can affect the migration of VOC or SVOC gas only when the temperature and vapor pressure in clays are relatively high, e.g., during the summer season [8,9]. In real projects, the CCC stays unsaturated on most occasions, except for relatively heavy rainfall infiltration. There are three indicators that quantify gas advection in clays when air pressure is high, gas permeability, air-water relative permeability, and moisture content [10]. A critical step in evaluating a CCC’s performance against VOCs or SVOCs is to measure the permeation and diffusion of gas while they change with the moisture contents of CCC.
The influence of moisture content in clay is significant for gas migration. In recent years, a geosynthetic clay liner (GCL) has been extensively used as the VOC/SVOC gas barrier in contaminated sites. However, the bentonite in GCL is usually sodium-activated calcium bentonite in China, and the barrier performance is not as good as sodium bentonite GCL. This is because the high-quality sodium bentonite resources in China are scarce. Previous studies [11,12] found that the gas permeability of the sodium bentonite GCL decreased with increasing moisture content under different pressures. Studies have shown that the gas permeability changes after hydration from 1.0 × 10⁻¹⁸ to 1.0 × 10⁻¹¹ m2 [13,14,15]. After drying, the gas permeability of the GCL can range between 0.03 and 0.21 m2 [16]. The VOC/SVOC gas migration from contaminated soil through GCL into the air is mainly controlled by pressure and concentration gradients. The advection governs gas flow caused by differential pressures, and the gas advection indicator is reflected by the gas permeability [17]. Gas migration due to a concentration gradient is controlled by the gas diffusion coefficient [18]. Rouf et al. [19] demonstrated that when the apparent degree of saturation (ADOS) of the sodium bentonite GCL increased greater than approximately 65%, both the gas diffusion coefficient and gas permeability of the GCL were considerably reduced. The ADOS is defined as the gravimetric water content (w) of a GCL at a given time, divided by the maximum gravimetric water content (wref) that the same GCL reaches during hydration under the same applied stress conditions [19]. It can be anticipated that the gas diffusion and gas permeability of CCC increase significantly with the decrease in both gravimetric water content and ADOS [20]. Extremely low moisture content will lead to VOC gas migration into clay by diffusion and advection more easily, thus impairing the CCC gas barrier efficacy. Low moisture contents in compacted clay can cause fissures due to water loss [21]. Ultimately, a crack network may develop from the fissures, becoming the preferential and dominant pathway for the upward advection of VOC or SVOC gas released from the unsaturated contaminated soils. Through laboratory tests, Drumm et al. [22] found that the hydraulic conductivity near soil cracks increased sharply as compared to intact soil that is not intact, confirming the existence of dominant flow paths after the soil cracked.
Adopting modified materials in CCC is one potential approach to suppress cracking caused by water loss and improve the gas barrier performance. Super absorbent polymers (SAP) are a type of polymers with strong water-absorbing capability, composed of many hydrophilic functional groups, such as carbonyls, hydroxyls, and quaternary ammonium salts. One of the most commonly used SAPs is polyacrylamide (PAM), which is usually adopted as a water retention agent in agriculture, due to its long-term water retention capabilities [23,24]. Studies [25,26,27] have shown that polymers are adsorbed on the surface of soil particles through physicochemical reactions. A polymer is one of the promising materials recently applied to soil stabilization. It has a long chain of monomers connected to each other by sufficiently strong and flexible Van der Waals forces. The polymer can encapsulate the soil particles and connect them through polymer chain expansion, thereby improving the soil’s water retention capacity (WRC). As a result, the hydraulic properties, erosion resistance, and gas impermeability of the modified soils can be improved. Qi et al. [28] researched the dried cracking of clay modified by PAM through a constant temperature evaporation test and image processing technology. They found that PAM is effective in mitigating soil cracking and even inhibiting crack formation. In addition, Yu et al. [29] conducted column tests to compare the cracking of the GCL before and after PAM modification at different temperatures. They demonstrated that the number of GCL cracks decreased after PAM modification at 40 °C. Therefore, using PAM to modify the CCC is promising, as it may improve the WRC and enhance the gas barrier performance. Nevertheless, previous studies mainly focused on polymer-modified clay’s WRC and hydraulic properties. The barrier performance of GCLs/CCCs containing VOC/SVOC gases should be evaluated not only by gas permeability and WRC, but also by the gas diffusion coefficient.
The primary purpose of this study was to investigate the gas barrier performance of PAM-modified CCCs. A series of laboratory tests were conducted, which included liquid limit, water retention, gas permeability, and gas diffusion tests. The results are useful in facilitating CCC design and its application as gas barriers in VOC and SVOC contaminated sites.

2. Materials and Methods

2.1. In-Site Clay

Sampling the in situ CCCs was based on ASTM D3441 [30], The Geotechnical Engineering Investigation Handbook [31] and other references [32,33]. The specific sampling procedure was displayed in the authors’ previous study [18]. A total of 40 sampling points were set up. Sampling depth was one-half of the CCC thickness. The GXY-1 engineering driller was adopted for rotary drilling sampling. The methods of the drilling operation were employed as per the Geotechnical Engineering Investigation Handbook [34], Standard practice for Classification of Soils for Engineering Purposes [35], and Geotechnical design, Part 2: Ground investigation and testing [36]. Samples should be wrapped in an impermeable material (plastic sealing bag) and stored in a shockproof box (filled with foam buffer) to prevent transport disturbance. The soil’s fundamental physical properties were tested based on the standards of GB/T 50145–2007 [37] and ASTM D2487 [38]. Test results were shown in Table 1. Figure 1 is the plasticity chart to identify the soil classification. As the organic content of the CCC sample is only 4.2%, the soil of the contaminated site can be classified as clay with low LL, based on Figure 1 and ASTM D2487.

2.2. Polyacrylamide

There are four kinds of PAM in the market, cationic PAM (CP), anionic PAM (AP), nonionic PAM (NP), and zwitterion PAM (ZP). According to the authors’ preliminary test results (see Supplementary Materials), the zwitterionic PAM worked best in inhibiting the cracking of CCCs. The modified clay had a much lower gas permeability (Kp) and gas diffusion coefficient (Dp) with good gas barrier performance than that modified by cationic, anionic, and nonionic polyacrylamide. Hence, zwitterionic polyacrylamide was selected as the tested modifier in this research, which was provided by Henan Zhengzhou Lvjie Environmental Protection Material Co., Ltd. (Zhengzhou, China), with a molecular weight of 12 million and solid content no less than 90%. The parameters of PAM were shown in Table 2.

2.3. CCC Sample Preparation

The compacted clay samples were prepared according to the wopt and ρdmax of the clay materials. The soil can reach the maximum degree of compaction only when it satisfies the wopt and ρdmax. This is because Ralph R. Proctor proposed a compaction test, where a soil sample is compacted by means of a set of blows of a hammer per lift, which prove that the maximum dry density (ρdmax) of soil is related to certain moisture, called the optimum moisture content (wopt) [45]. The soil samples with the size of 61.8 × 20 mm were prepared by the static compression method. The dry density and moisture content of all the compacted clay samples were 1.78 and 25.6%, respectively. The moisture content was in accordance with the optimum water content (wopt).
The degree of compaction was designed based on the authors’ previous study [46], which proved that compacted clays with 90% degree of compaction had superior gas barrier performance than those with lower degrees of compaction. The specific ZP-modified compacted samples were prepared as follows: (1) thoroughly mix the air-dried in-situ soils with a certain amount of ZP powder. The ZP dosage is shown in Table 2 (2) distilled water was added until the moisture content reached 25.6%, and the soil–water mixture was thoroughly stirred using a glass rod until uniform; (3) the above soil–water mixture was added into a rigid mold with a size of 61.8 × 20 mm, and it was statically compacted using a hydraulic jack to the designed degree of compaction of 90%; (4) CCC samples were sealed with plastic bags and cured in the curing room for 14 days until the samples reached the moisture balance.
The CCC samples used in the gas permeability and gas diffusion tests were prepared with the same method with that used in the WRC tests samples. It is noted that the samples were subjected to drying at various times of 0 h, 3.5 h, 7 h, 10.5 h, 14 h, and 17.5 h, respectively, and the drying temperature was 100 °C (see Table 2).

2.4. Test Methods

2.4.1. WRC Tests

After soil sample preparation, the compacted clay samples were placed in aluminum boxes. The opening percentage of the aluminum box was greater than 85%. The opening percentage is the ratio of hole area to the total lid area. Studies [47] show that PAM solutions can maintain at least half their original viscosity for more than 8 years at 100 °C and for approximately 2 years at 120 °C. Its backbone can remain stable at high temperatures. So, the soil samples were dried in an oven with a temperature of 100 °C in order to save time. The quality changes in the samples were recorded every 3.5 h, and Equations (1) and (2) were used to calculate the moisture content and water loss rates after drying.
The water loss rates of the clay samples after drying were calculated as follows:
W s = m 0 m m s × 25.6 % × 100 %
where w is the moisture content; ms is the sum of the mass of the clay and polyacrylamide (g); m0 is the mass of a compacted clay sample before being baked (g); mt is the mass of a compacted clay sample after drying for time t (g), and WS is the water loss rate (%).

2.4.2. Clay Gas Permeability Tests

The CCC samples used in the gas permeability tests were prepared with the same method as those used in the WRC samples. It is noted that the samples were subjected to drying at various times of 0 h, 3.5 h, 7 h, 10.5 h, 14 h, and 17.5 h, respectively, and the drying temperature was 100 °C. Gas permeability is defined according to Darcy’s equation as the factor of proportionality between the ratio of gas flow and the pressure gradient along the flow distance. The gas permeability of the CCC samples was measured immediately after drying for 10.5 h at 100 °C. The air permeability of soil was measured using the Eijkelkamp-type air permeability apparatus (model 08.07, Eijkelkamp Agrisearch Equipment, The Netherlands) with the following procedures: firstly, the instrument should be tested for tightness before the test. The preliminary test results revealed that it had good airtightness and no air leakage. Secondly, a thick rubber sealing ring (inside diameter: 50 mm, outside diameter: 70 mm, thickness: 10 mm), a perforated plate (diameter: 53 mm, thickness: 1 mm, the diameter of the hole: 1 mm), and a compacted soil sample were placed into a sample holder (inside diameter: 105 mm, outside diameter: 150 mm, height: 50 mm, material: stainless steel) in turn and fixed with a clamp for subsequent sealing. Finally, the flow meter (range: 0.1~10 L/min, accuracy: 1.25%) was switched on by turning the button counterclockwise to a vertical position to control the air pressure within an acceptable range for measurement. Each measurement was repeated for 5 replications within a max. of 10 min and enabled the quantification of pneumatic soil properties.
The testing time should be kept as short as possible during the experiments. This is because gas will dry out the soil sample. Three identical samples were prepared for testing. The air pressure was set as 10 kPa. It is noted that the gravimetric moisture content change in the samples before and after the tests was found to be insignificant, i.e., within 3%. This is attributed to the relatively low gas flow rate (0.5 L/min) and short testing time (10 min). Rouf et al. have proven that a maximum variation in gravimetric moisture content of ±5% was deemed acceptable during the gas permeability tests [48].
The gas permeability (Kp) of the compacted clay samples in the tests was derived in accordance with the published studies [49,50].
K p = k · ρ 1 · g μ
Q = k · A · P μ · L
Q = v · A = v t · A · A = v t
K p = ρ 1 · g · V · L t · P · A
where Kp is the gas permeability of a clay sample (m2); k is the permeability coefficient (m/s); ρl is the air density (kg/m3); t is the test time (s); V is the amount of air passing through the sample within time t (m3); L is the thickness of the compacted clay sample to be tested (m); p is the actual pressure value (MPa), and A is the bottom area of the sample (m2).

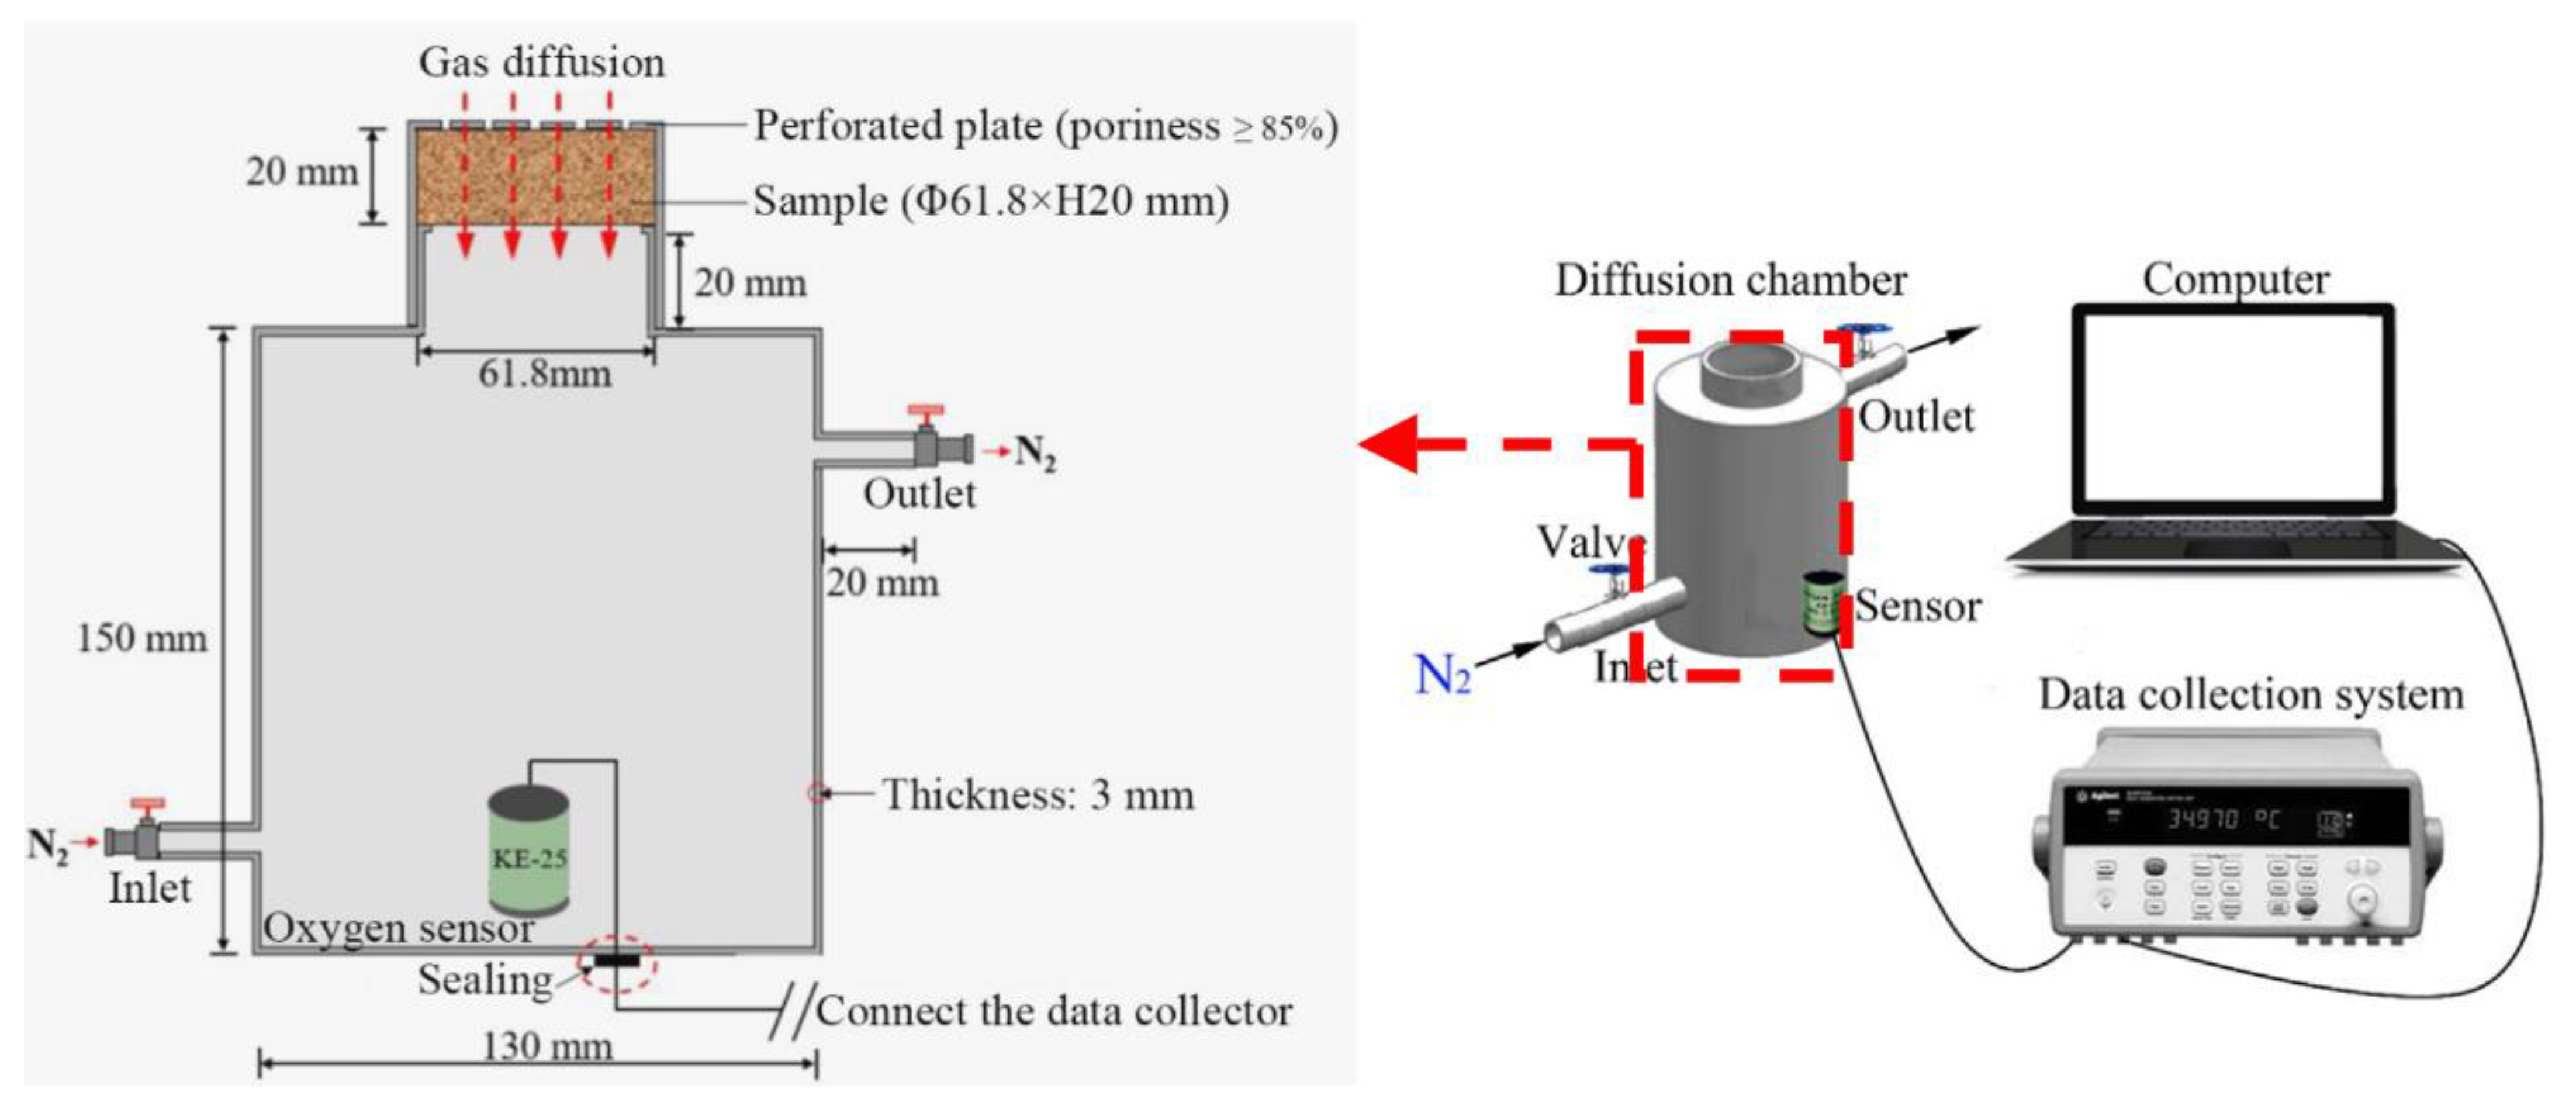
2.4.3. Gas Diffusion Tests

The CCC samples used in the gas permeability tests were prepared with the same method as that used in the WRC tests samples. It is noted that the samples were subjected to drying at various times of 0 h, 3.5 h, 7 h, 10.5 h, 14 h, and 17.5 h, respectively, and the drying temperature was 100 °C. The testing apparatus used for this study is schematically shown in Figure 2. The apparatus consisted of a 3D printing gas diffusion chamber, an oxygen sensor (KE-25, Figaro Inc., Tokyo, Japan) with the accuracy of ±1%, and a data-logger (CR1000, Campbell Scientific, Inc., Logan, UT, USA), and a computer. The oxygen sensor was used to measure the concentration of oxygen with a unit of % (the concentration defined based on the content of oxygen in the atmosphere, 21%). The location of this oxygen sensor is in the bottom of the diffusion chamber. The size of the diffusion chamber is shown in Figure 2. The soil sample is placed at the top of the diffusion chamber; thus, the oxygen gas can only migrate into the chamber through the soil sample. A soil sample can be rapidly inserted into the apparatus and sealed to prevent the loss of gases and water and can be removed without further soil disturbance. The steps of gas tightness self-tests were conducted as follows: (1) an air-tight PVC lib was covered on the top of the chamber, and (2) the nitrogen gaseous were released to fill the chamber. The oxygen concentration should be decreased to the threshold of 0.3~0.6%. (3) It can be considered that the chamber has good air tightness when the variation range of oxygen concentration is less than 0.3%. The specific practical steps were listed as follows: (1) the samples were placed at the top of the diffusion chamber; (2) the silicon grease was evenly applied to the contact part between the samples and the inner wall of the diffusion chamber. Applying the silicon grease was found to be effective in preventing gas migration through the gap in the contact part; (3) the air inlet and outlet valves were opened, and the nitrogen gas container was opened to introduce nitrogen into the diffusion chamber through the inlet. Furthermore, we adjusted the flow control valve to make nitrogen enter the diffusion chamber evenly and steadily through the inlet. The oxygen sensor was installed to monitor the oxygen concentration change in the diffusion chamber until all the oxygen was discharged, and (4) the oxygen was released when the oxygen concentration decreased to the threshold of 0.3–0.6%. The inlet was closed after injecting nitrogen for 5~15 s.
In this research, a data acquisition instrument was applied to record the oxygen concentration in the diffusion chamber (Ct) every 5 min until the concentration was equal to the oxygen in the atmosphere (C0), i.e., a steady state was reached.
The gas diffusion coefficients Dp of the compacted clay samples were calculated based on the previous studies [51,52] and combined with Fick’s first law.
D p = h s · h c · k
ln Δ C t Δ C 0 = k · t
K j = D p D p = ε α 1 2 · 1 h s · h c
ε = 1 ρ b ρ s θ V
where Dp is the correction gas diffusion coefficient (m2/s); Dp’ is the gas diffusion coefficient before calibration (m2/s); hs is the height of the compacted clay sample (m); hC is the height of the diffusion chamber (m); k is the slope of the straight line in the scatter diagram of ln( Δ Ct/ Δ C0) (dimensionless); Δ Ct is the difference between OC at both ends of the clay sample at time t (g/cm3); Δ C0 is the difference between OC at both ends of the clay sample at time t0 (t0 means initial stage); Kj is the corrected coefficient introduced with changes in the storage capacity of OC; α1 is the first solution of the equation (α × hS)tan(α × hS) = (hS × ε)/hC greater than 0; ε is the gas-filled porosity [53]; ρb is the bulk density of the soil sample (g/cm3); ρs is the particle density of the clay (g/cm3); and θv is the volumetric moisture content of the clay sample.

2.4.4. Liquid Limit Test

The liquid limit test was conducted according to ASTM D4318 [39]. The liquid limit and plastic limit data were obtained from a liquid–plastic combined tester according to the standard test method SL237-007-1999 [54].

3. Results and Discussion
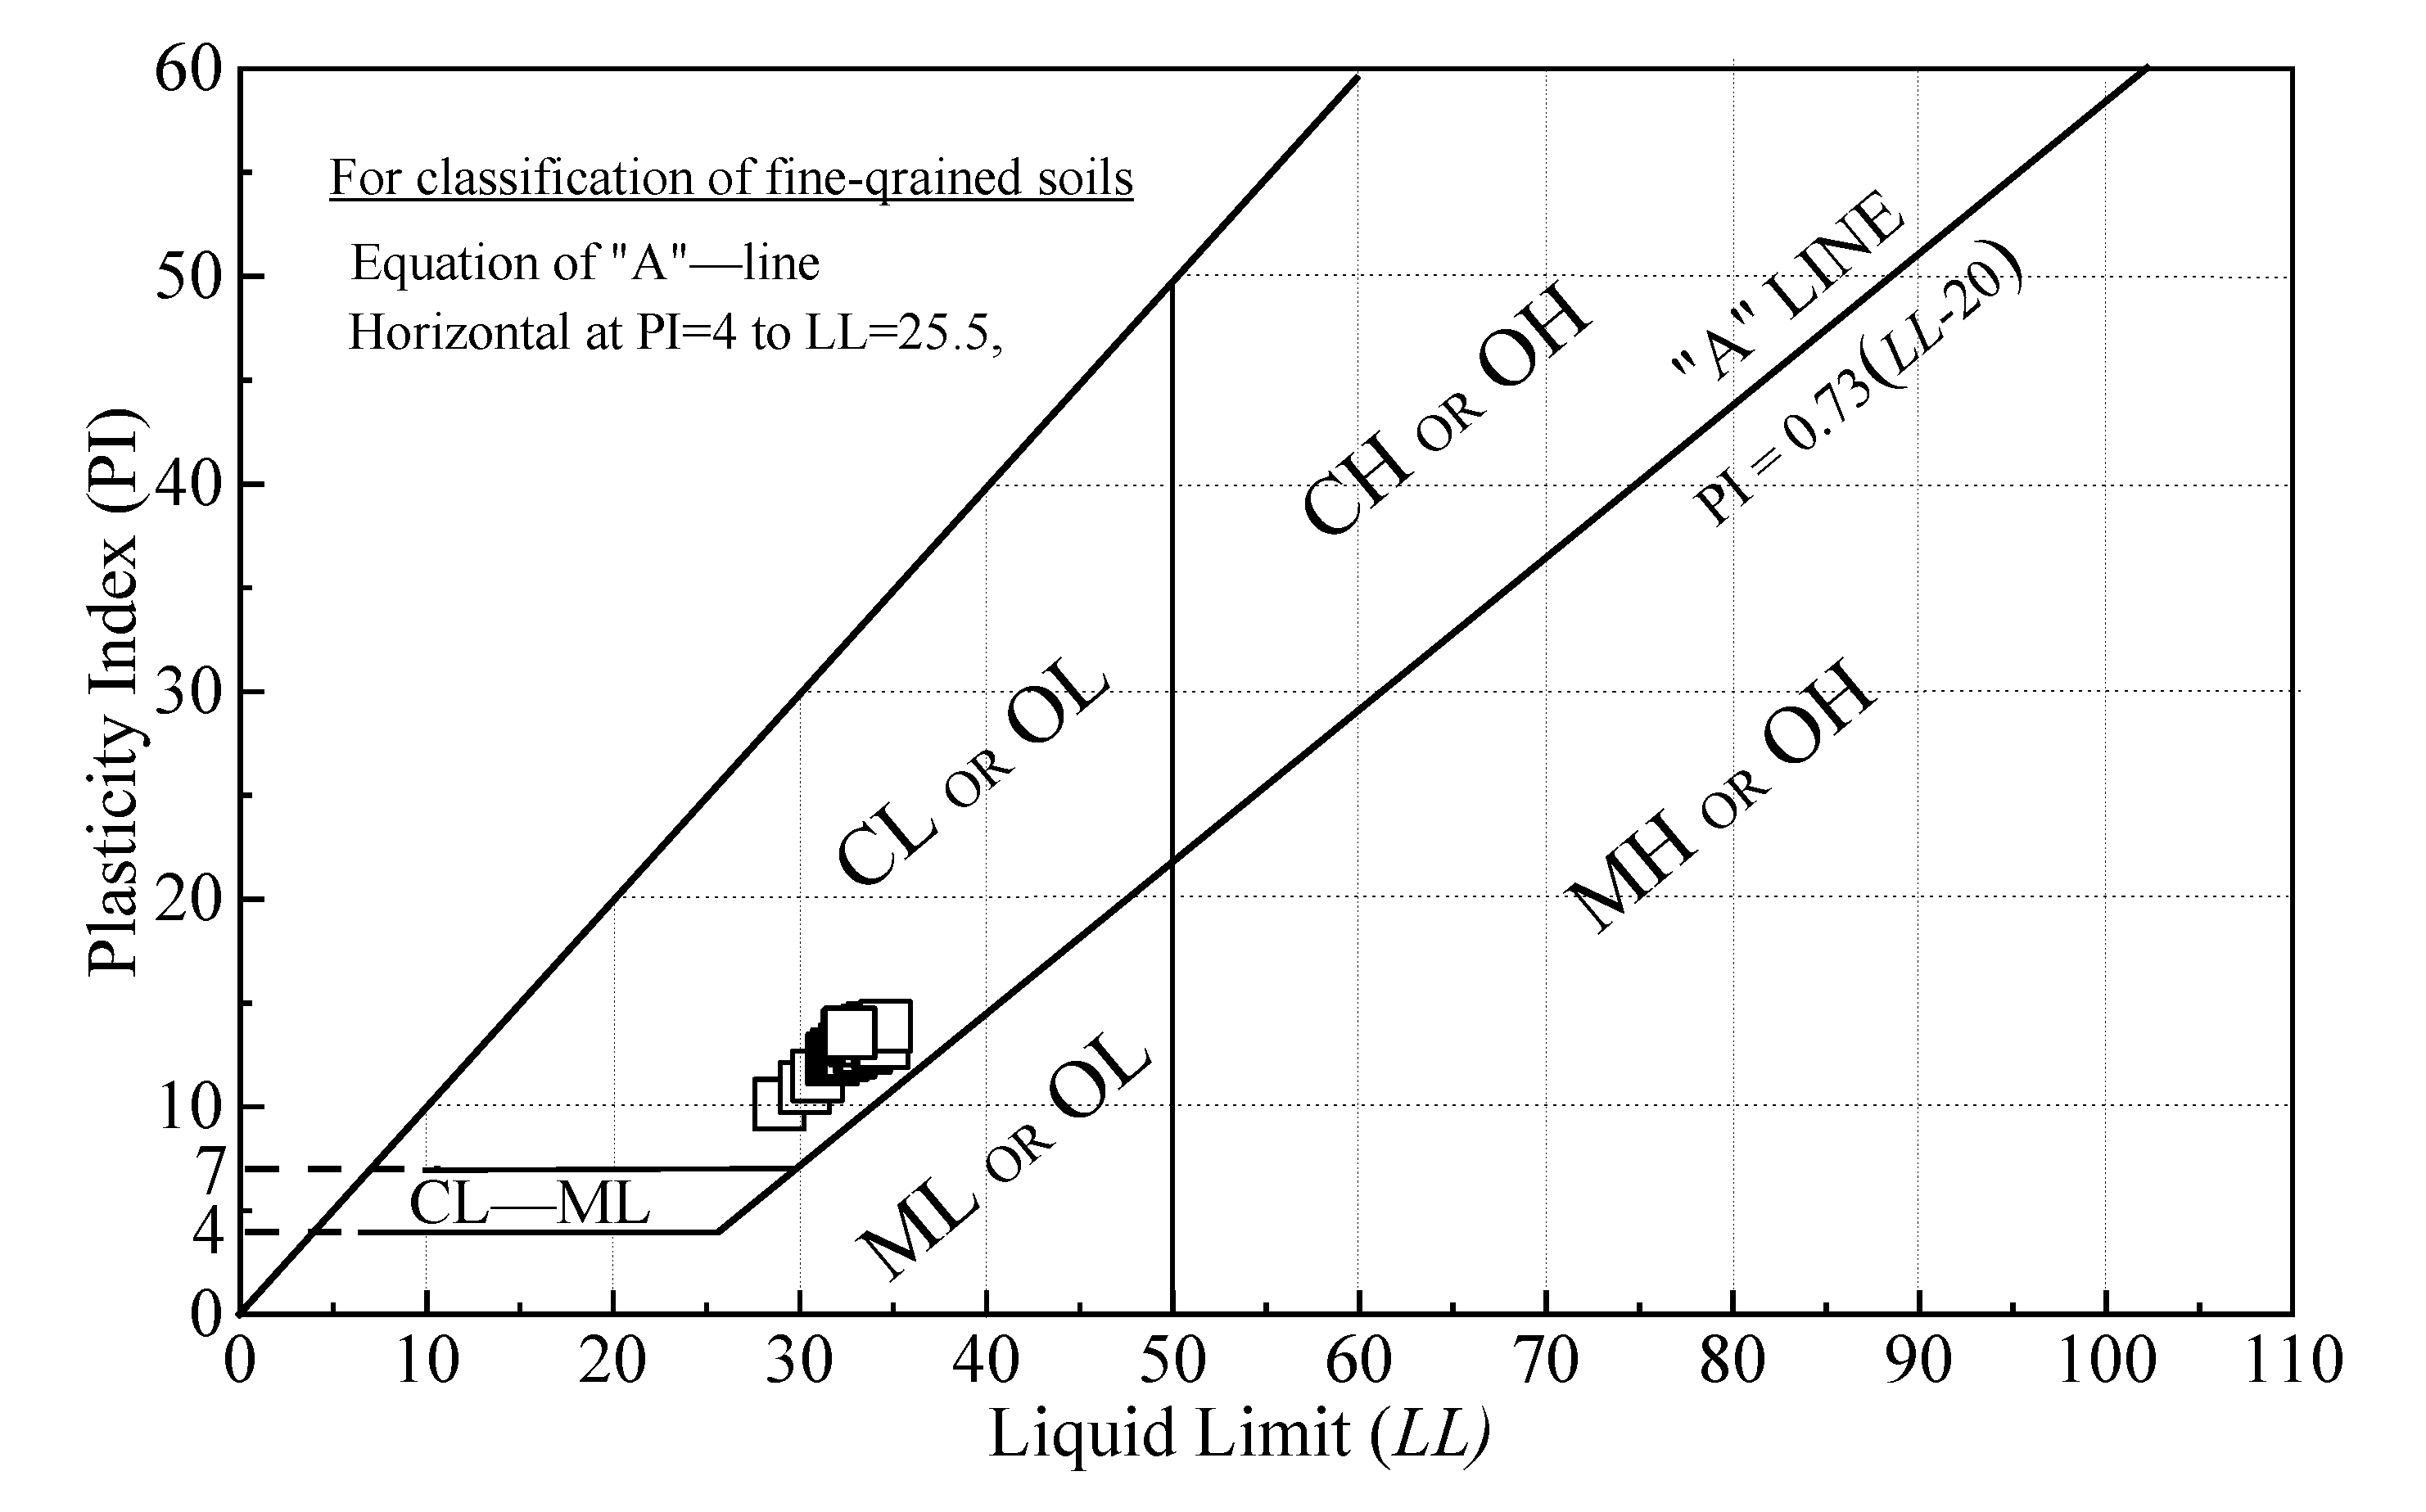
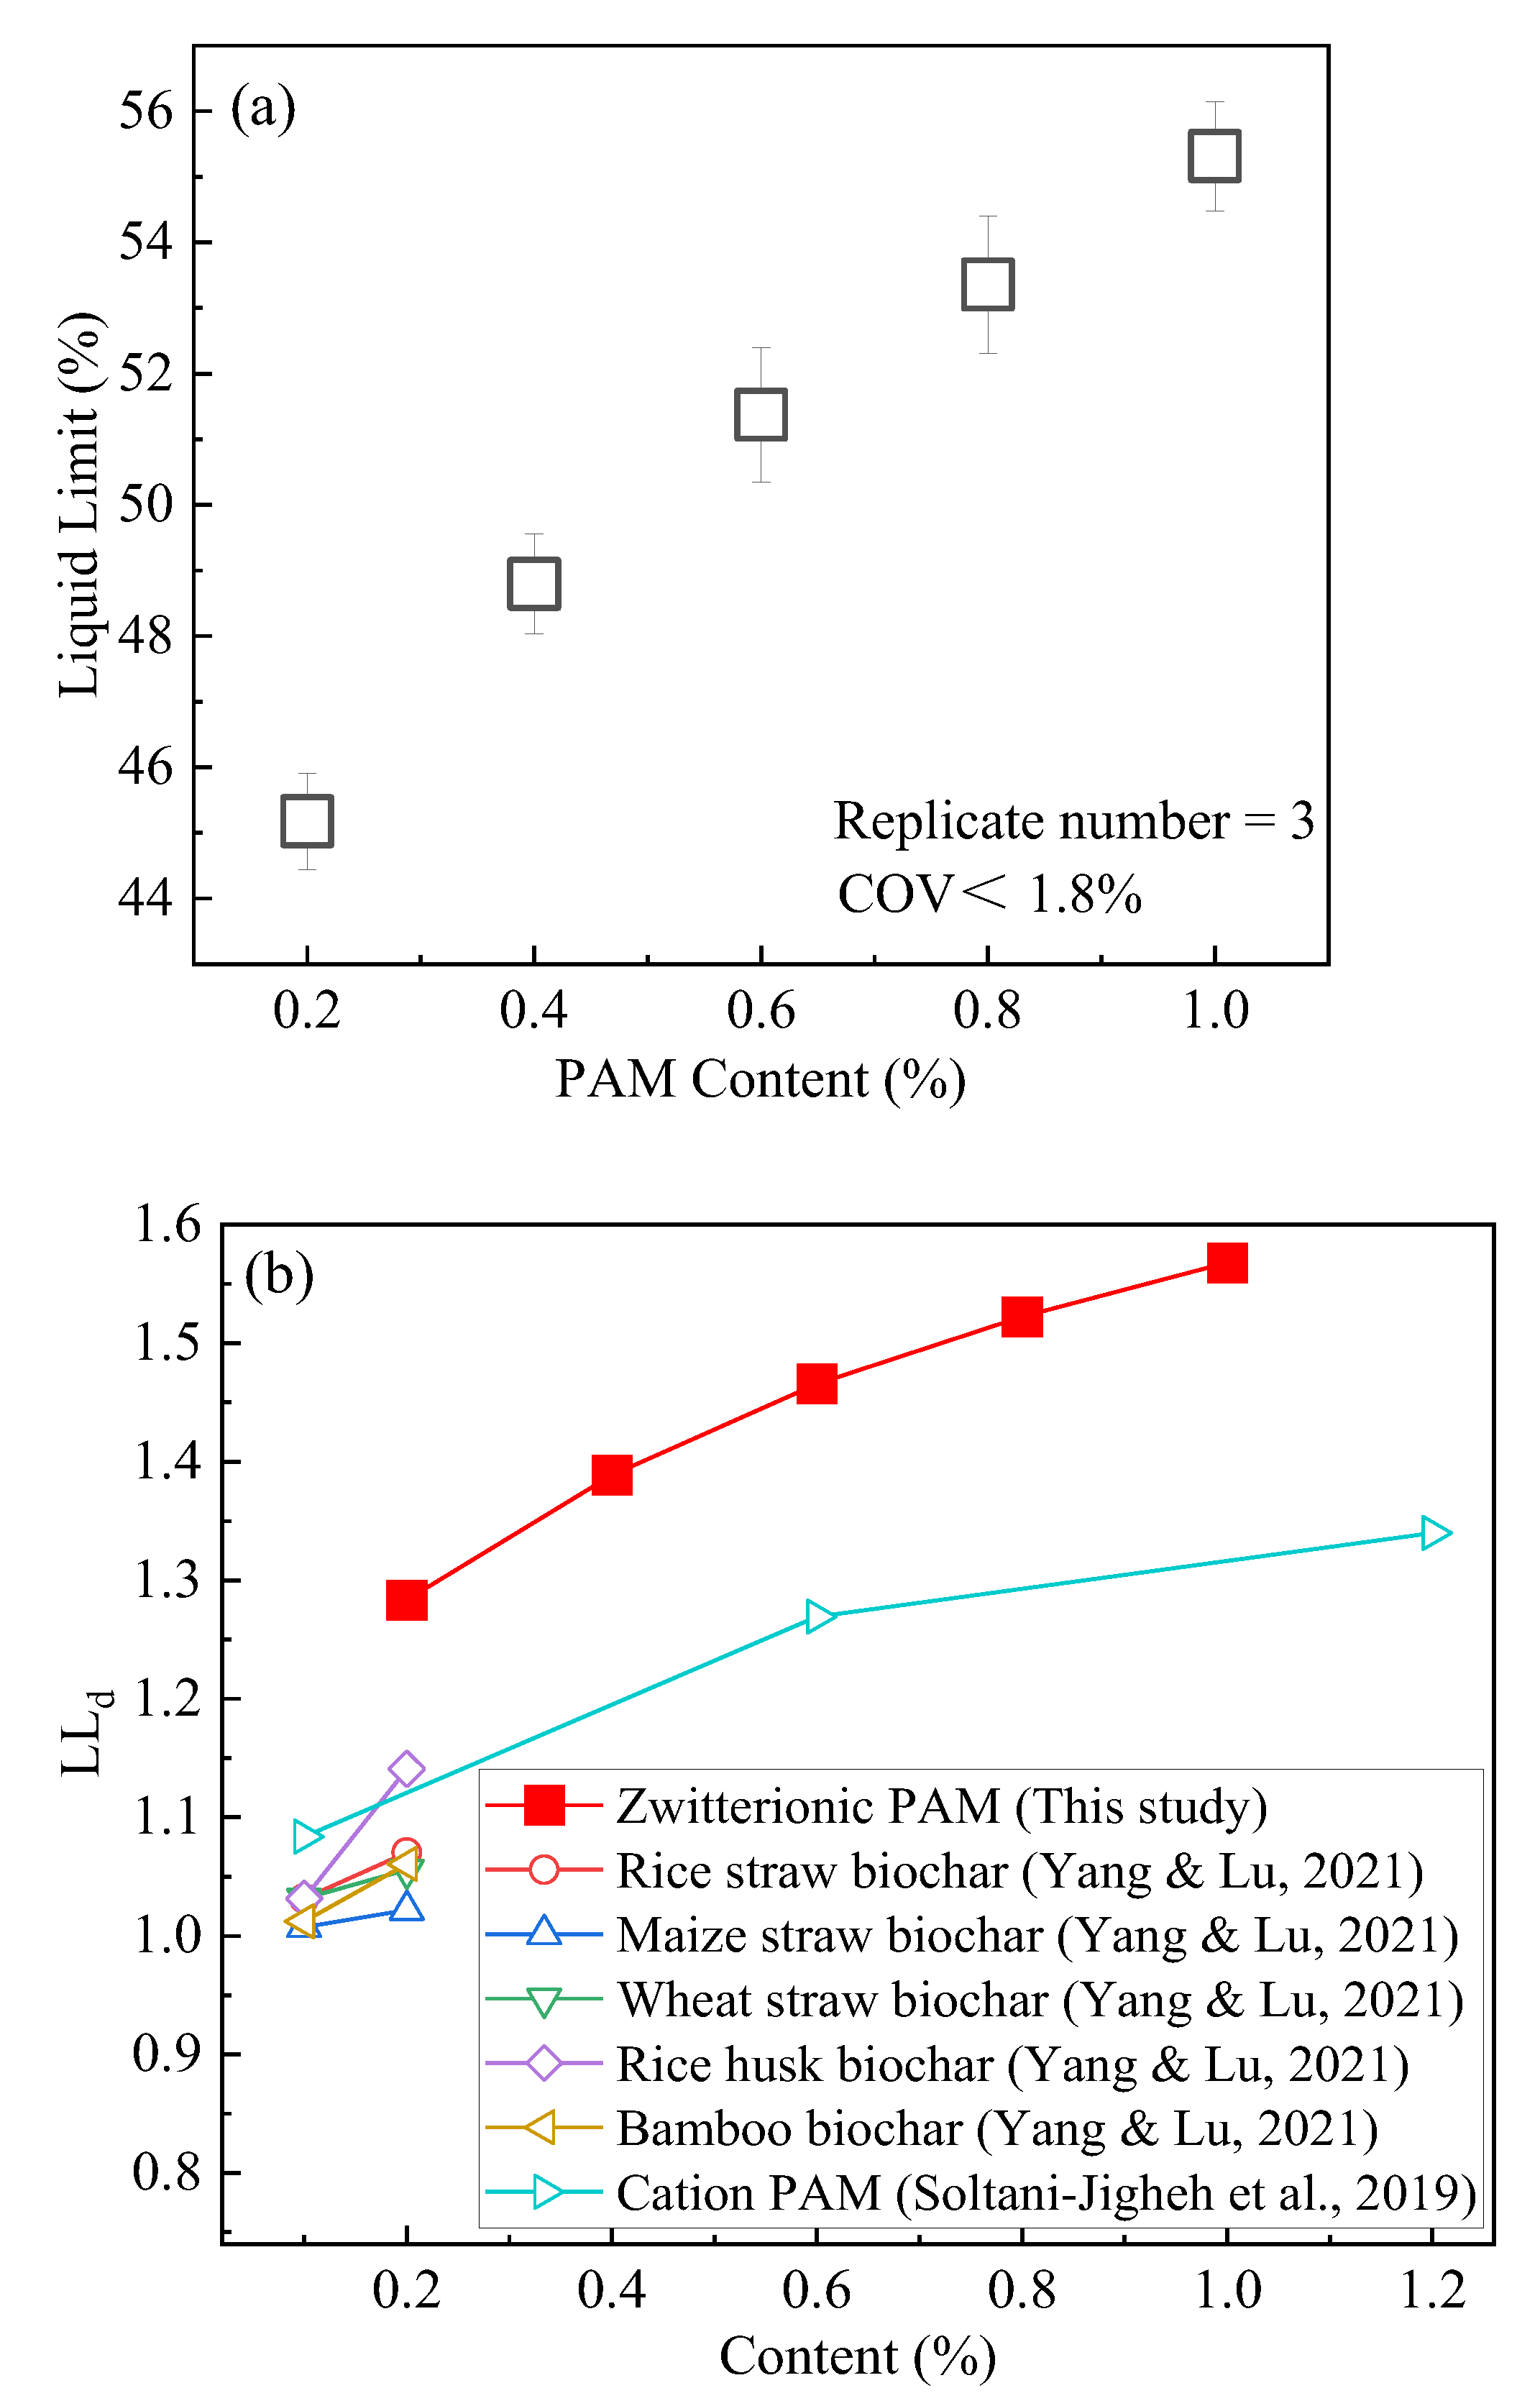
3.1. Liquid Limit

Figure 3 shows the relationship between the liquid limit of the modified compacted clay and the content of ZP. The liquid limit increases with the increasing ZP, which is higher than the unmodified clay (in Table 1). The liquid limits of the compacted clay were 45%, 49%, 52%, 54%, and 55%, when the corresponding ZP content ranged from 0.2 to 1%. Previous studies have demonstrated [55,56,57] that the WRC of clay increases with LL values. This is because clay with high LL can retain more content of water in the soil pore, which in turn can reduce gas permeability.
To compare the effects of different modification materials on LL, a dimensionless parameter, LLd, is proposed, which was defined as the ratio of LL to LLck, where LLck is the liquid limit of un-treated clay. The comparison results of LLd are shown in Figure 3b. The results show that the ZP-modified soil has higher LLd values when compared with other modifiers.

3.2. WRC

The evolution of the moisture content with various ZP contents is shown in Figure 4. For the untreated samples, the initial moisture content was 25.6%. It decreased significantly with the increase in drying time from 0 h to 7 h; the moisture significantly decreased from 9% to 13%. After 17.5 h of drying, the moisture content of the compacted clay mixed with ZP of 0.2%, 0.4%, 0.6%, 0.8%, and 1.0% were 4%, 7%, 8%, 9%, and 12%, respectively. The moisture of the soil treated with 1.0% ZP content was 193% higher as compared to the soil with 0.2% ZP. Studies have proven [37] that ZP has a large specific surface area with many hydrophilic groups. Due to the electrostatic attraction between the anions and the penetration disparity induced by the differing concentrations of cations inside and outside, PAM expands linearly to form a three-dimensional network structure [25,26]. Thus, the polymer network of ZP has a strong physical adsorption effect on water molecules. Accordingly, ZP can effectively improve the WRC of compacted clay and inhibit the evaporation of clay moisture during the drying process. After drying, the moisture content of the clay increased with increasing ZP content, and the modification was the most prominent when the ZP content was 1%.
Figure 5 reflects the influence of ZP content on the water loss of the compacted clay after drying. After 17.5 h of drying at 100 °C, the water loss rates of the compacted clay mixed with different contents of ZP were 84%, 71%, 66%, 64%, and 54%, as the ZP content ranged from 0.2% to 1.0%. Therefore, increasing the content of modifier ZP can effectively reduce the water loss rate of clay and improve its WRC. Studies have indicated that the water loss of the clay mixed with various ordinary agricultural and forestry water-retaining agents varies from 55% to 63%, after they are dried for 360 min with a temperature of 60 °C [53]. However, when our research used 0.8% and 1.0% ZP for modification, the water loss rates of the clay after drying at 100 °C for 17.5 h were 64% and 54%. Furthermore, field monitoring results in the Changzhou contaminated site showed that [18] the highest atmospheric temperature was 45 °C, which was much lower than the test temperature of 100 °C in this paper. As a result, ZP plays a more prominent role in enhancing the WRC of CCC under low temperatures of 45 °C rather than 100 °C.
Based on the preliminary test results, when the ZP content was than 1%, the clay with the same initial moisture content was too viscous to be blended homogeneously. Therefore, we did not test the soils with ZP content higher than 1.0%.

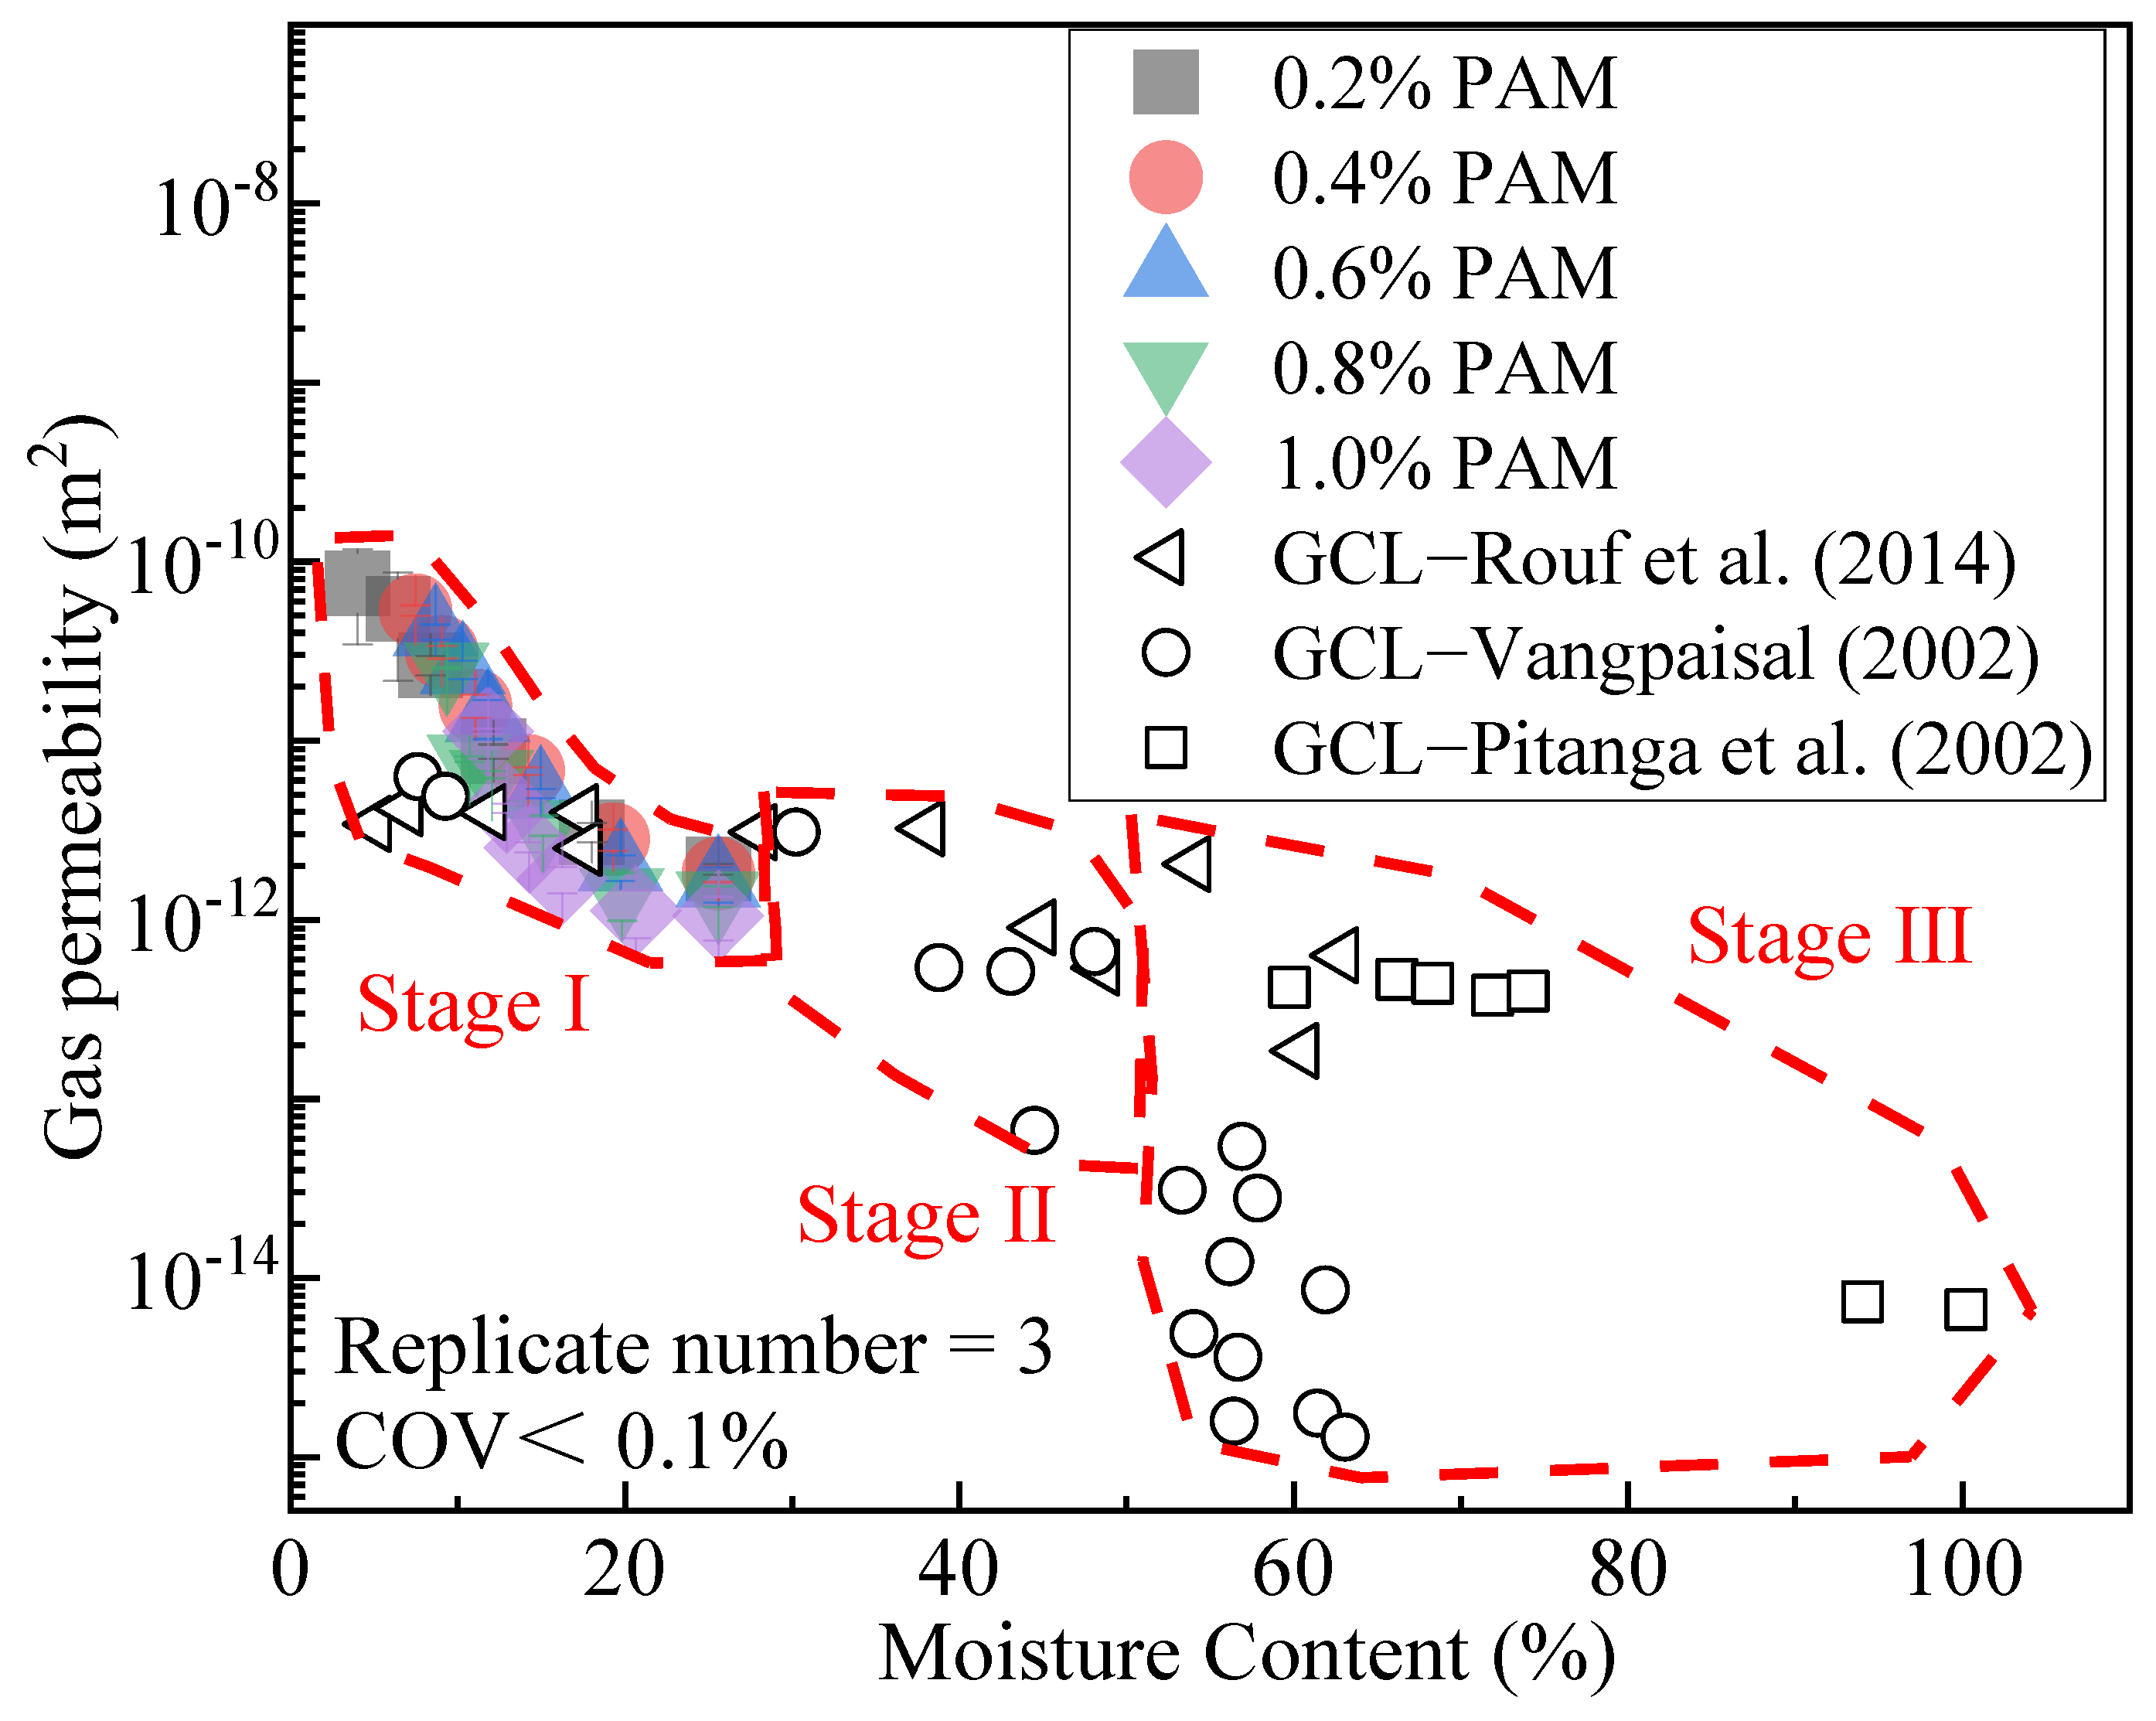
3.3. Gas Permeability

Figure 6 shows the relationship between the gas permeability and moisture content. It is noted that the gas permeability of the soils was measured immediately after drying for various times. It is observed the gas permeability of compacted clay increased with the rise in moisture. The relationship of GCL Kp and moisture content can be reflected in three stages in Figure 6. The first trend in stage I represents Kp decreasing sharply with increasing moisture content ranging from 4% to 30%. The second trend in stage II shows Kp very slightly decreasing with the increasing moisture content of 30~50%. The third trend in stage III represents Kp decreasing sharply with the increasing moisture content of 50~100%. According to the comparison between this study and geosynthetic clay liners in previous studies, as shown in Figure 6, the gas permeability of both CCC and GCL decreases with the rise in moisture content. In addition, the test results of Rouf et al. [11] showed that when the moisture content of the GCL was 5~100%, the gas permeability at 20 kPa overburden pressure varied from 10−13 m2 to 10−16 m2, much lower than that of compacted clay. Only when the ZP content reached 1.0% was the gas permeability of ZP-modified compacted clay lower than that of the GCL, with moisture content in the range of 20% to 28%.
The CCC sample total drying time is 17.5 h. The CCC’s final state after drying can be compared to unveil the barrier performance under different ZP contents. Figure 7 shows the influence of ZP content on the gas permeability of the compacted clay after 17.5 h of drying. It can be observed that the moisture content of the clay enhanced as the content of ZP increased, while the gas permeability Kp gradually decreased. The moisture content and gas permeability showed an apparent negative correlation, meaning that gas permeability decreased with the rise in moisture content [11,12,13]. When the ZP content was 1.0%, the gas permeability of the clay after drying was 1.12 × 10¹¹ m2, which was 97% lower than that of the ZP admixture content of 0.2%. As proved, ZP can increase the moisture content of clay after drying, thereby reducing its gas permeability. When the PAM content is 1%, the gas barrier performance of clay can be effectively improved by about one order of magnitude.

3.4. Gas Diffusion Coefficient

Figure 8 displays the relationship between the gas diffusion coefficient and moisture content (after different times of drying with the initial moisture content of 25.6%) of the compacted clay after ZP modification. The relationship of GCL Dp and moisture content can be divided into two stages in Figure 8. The first trend in stage I represents Dp, which has no changes with the increasing moisture content, ranging from 8% to 42%. The second trend in stage II shows Dp, which decreases sharply with the increasing moisture content of 58~100%. The relationship between CCC Dp and moisture content follows the linear decreasing law; Dp decreases sharply with the increasing moisture content of 0~25.6%.
As the content of ZP ranged from 0.2% to 1.0%, the gas diffusion coefficient decreased with the rise in moisture. According to the analyses of the gas diffusion test results of Rouf and Bouazza [19,56] on the GCL, when the moisture content of the GCL was 8~100%, the gas diffusion coefficient was between 10−6 and 10−9 m2/s, much smaller than that of compacted clay with the same moisture content.
As shown in Figure 8, when the moisture content was 25.6%, the gas diffusion coefficients of clay mixed with ZP at the contents of 0.2%, 0.4%, 0.6%, 0.8%, and 1.0% remained in the same order of magnitude, which was 4.56 × 10⁻⁶ m2/s, 5.05 × 10⁻⁶ m2/s, 4.72 × 10⁻⁶ m2/s, 4.56 × 10⁻⁶ m2/s, and 4.51 × 10⁻⁶ m2/s, respectively. When the drying starts, the CCC samples present different gas barrier properties. The Dp of the CCC sample with 0.2% ZP content after 17.5 h drying is 1.37 × 10⁻⁴ m2/s, while the Dp of the 1.0% ZP content sample is 3.06 × 10⁻⁵ m2/s. This is because the CCC samples mixed with high content ZP have high WRC, which can reduce the microstructure of clay particles and enhance the barrier property of CCC.
The CCC sample’s total drying time is 17.5 h. After drying, the CCC’s final state can be compared to unveil the barrier performance under different ZP contents. Figure 9 presents the relationship between the gas diffusion coefficient and moisture content of the compacted clay after drying for 17.5 h with the change in ZP content. It can be observed that the Dp decreased with increasing moisture content. When the ZP content was 1%, the gas diffusion coefficient of the clay was 3.06 × 10⁻⁵ m2/s, which was only 35% of that at the ZP content of 0.2%. Hence, ZP can effectively improve compacted clay’s gas-barrier and anti-diffusion performance, and its modification effect increases with the rise in ZP admixture content.

4. Conclusions

This study investigated the gas barrier performance of CCC of an industrial contaminated site that was modified by zwitterion polyacrylamide (ZP). The water retention capacity (WRC) test, liquid limit (LL) test, gas permeability test, and gas diffusion test were conducted to unveil the barrier mechanism. Based on the results, the following conclusions can be drawn:
(1)
ZP could increase the moisture content of the compacted clay. The WRC is related to the linear expansion of polymer molecules after water adsorption. The moisture content of the clay after drying increases with the rise in the ZP admixture content. The modification had a prominent effect at a ZP content of 1%, and the moisture content after drying increased by 193% more than at the ZP content of 0.2%.
(2)
The WRC of compacted clay significantly improves after adding ZP. When the admixture content is 0.8% and 1.0%, the water loss rate after the clay is dried for 17.5 h at 100 °C is 64% and 54%. Its WRC is better than ordinary water-retention agents for agriculture and forestry.
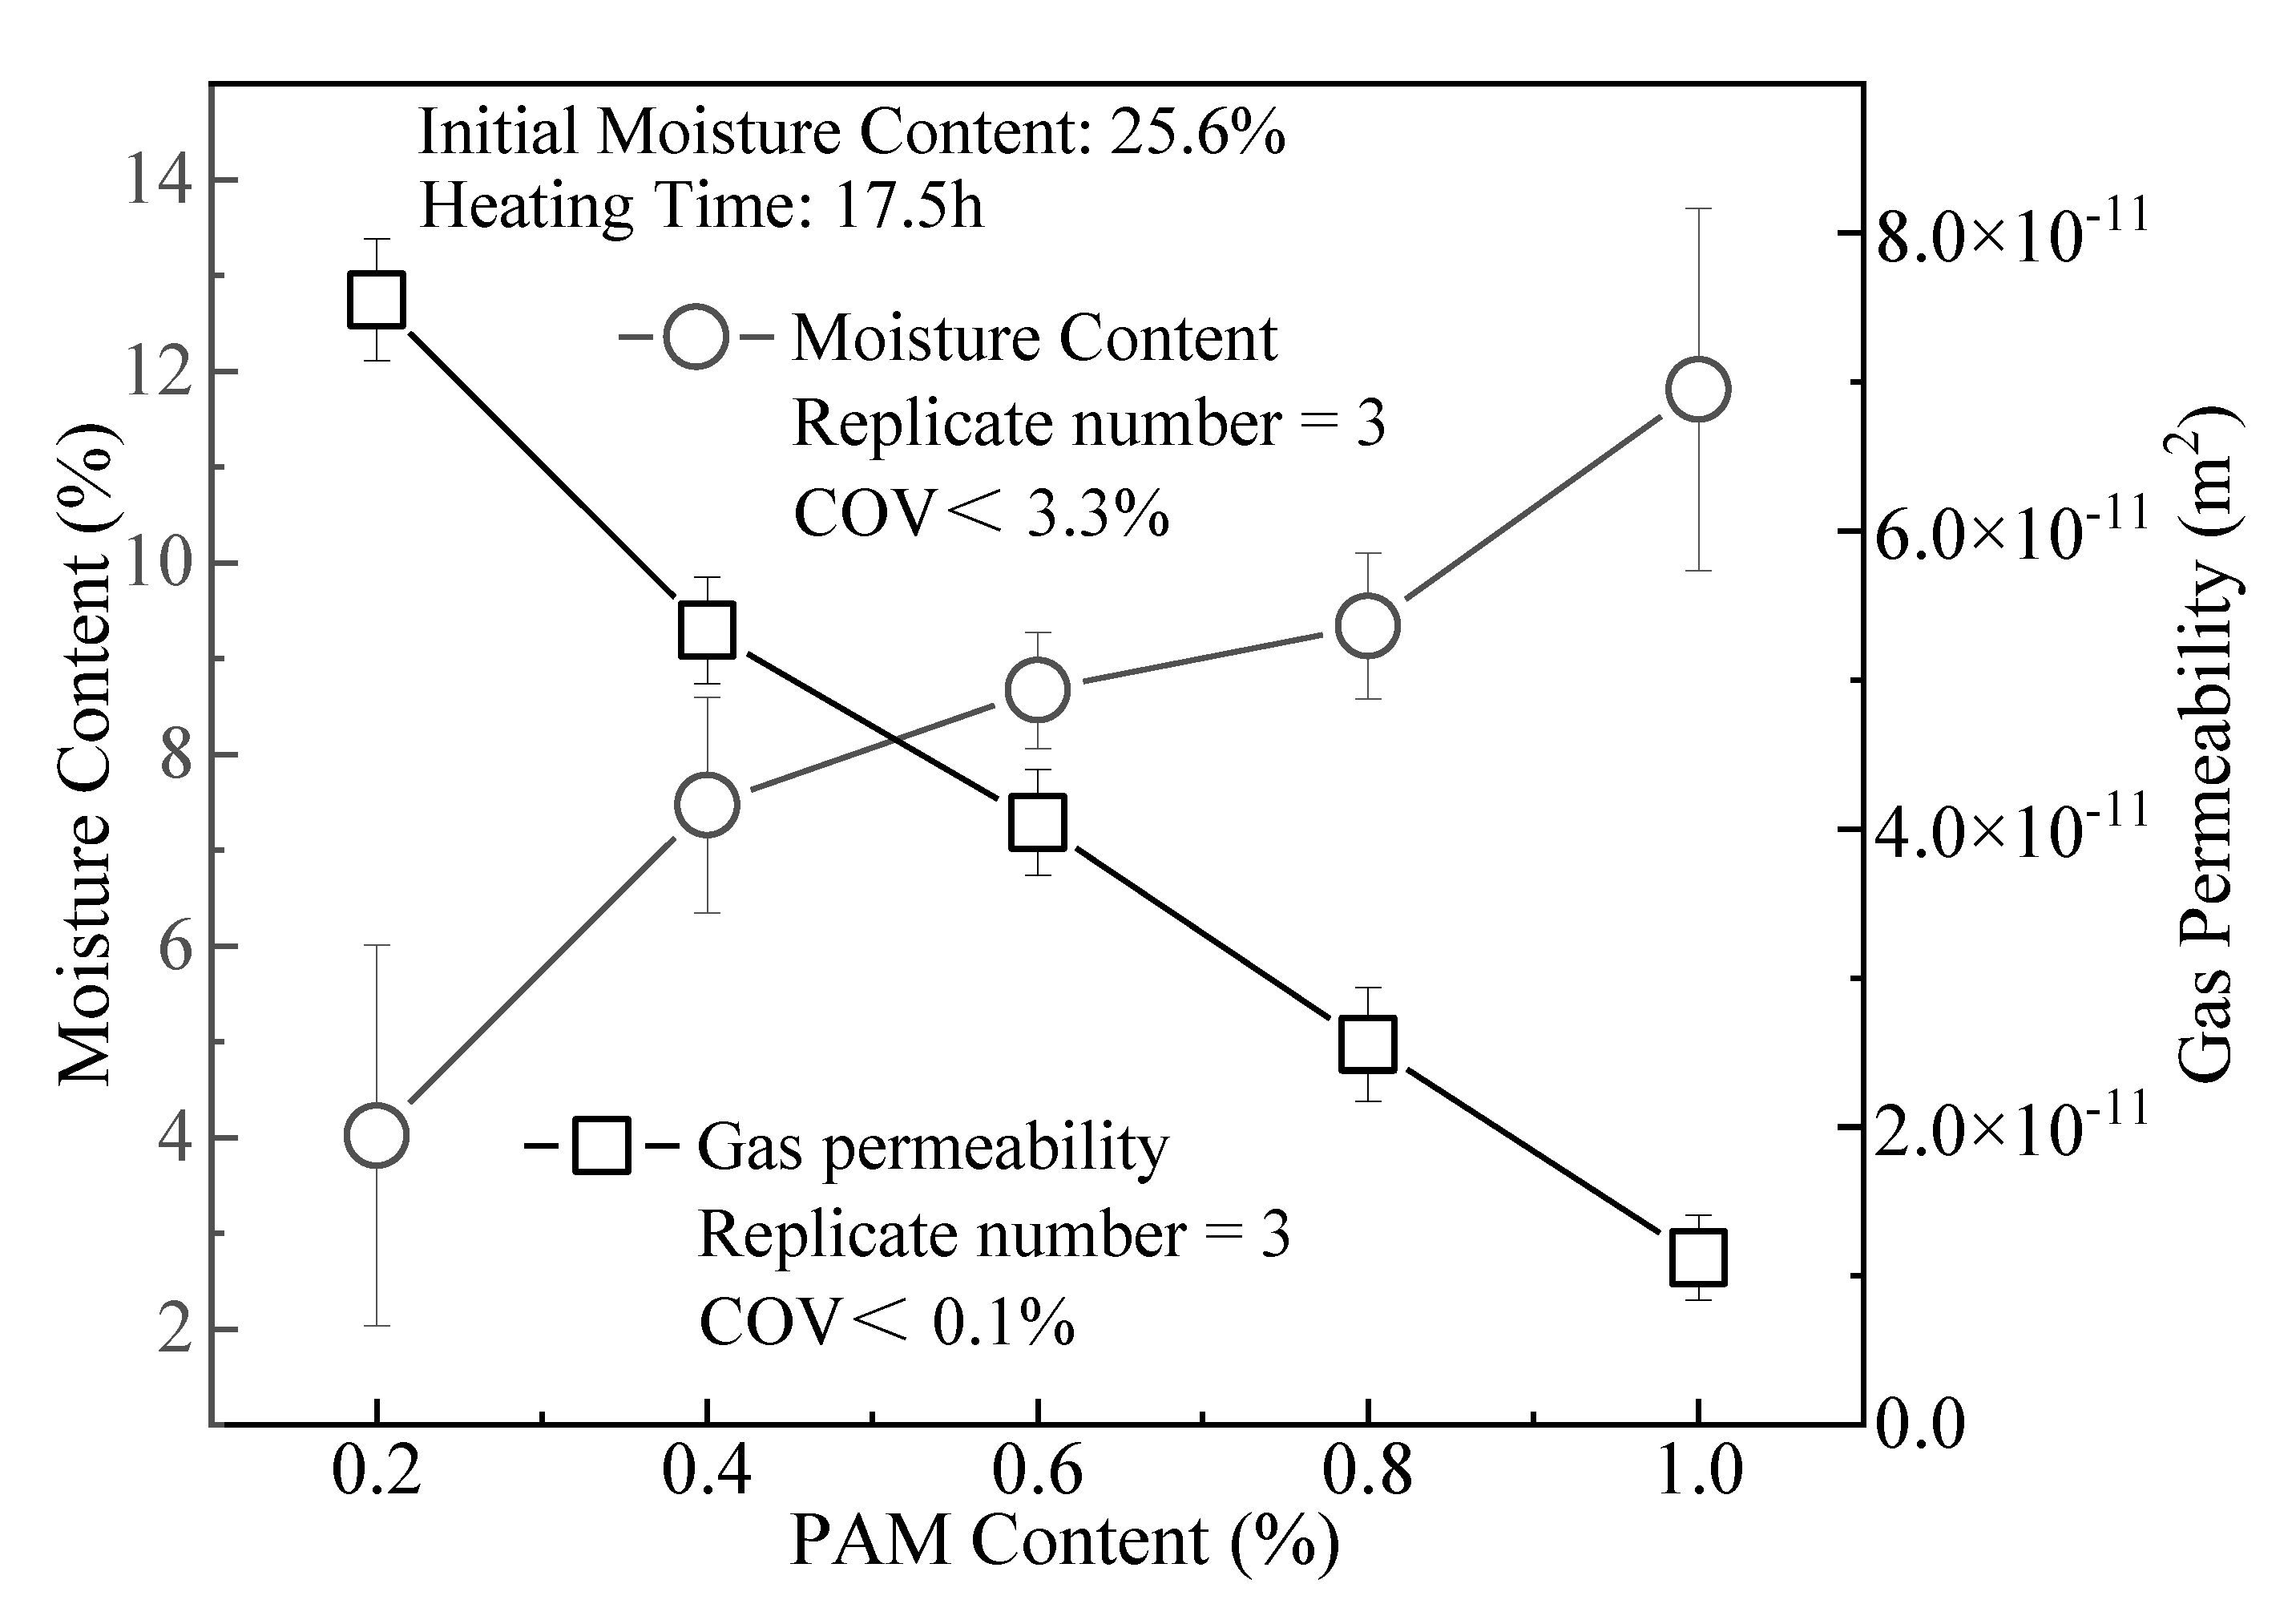
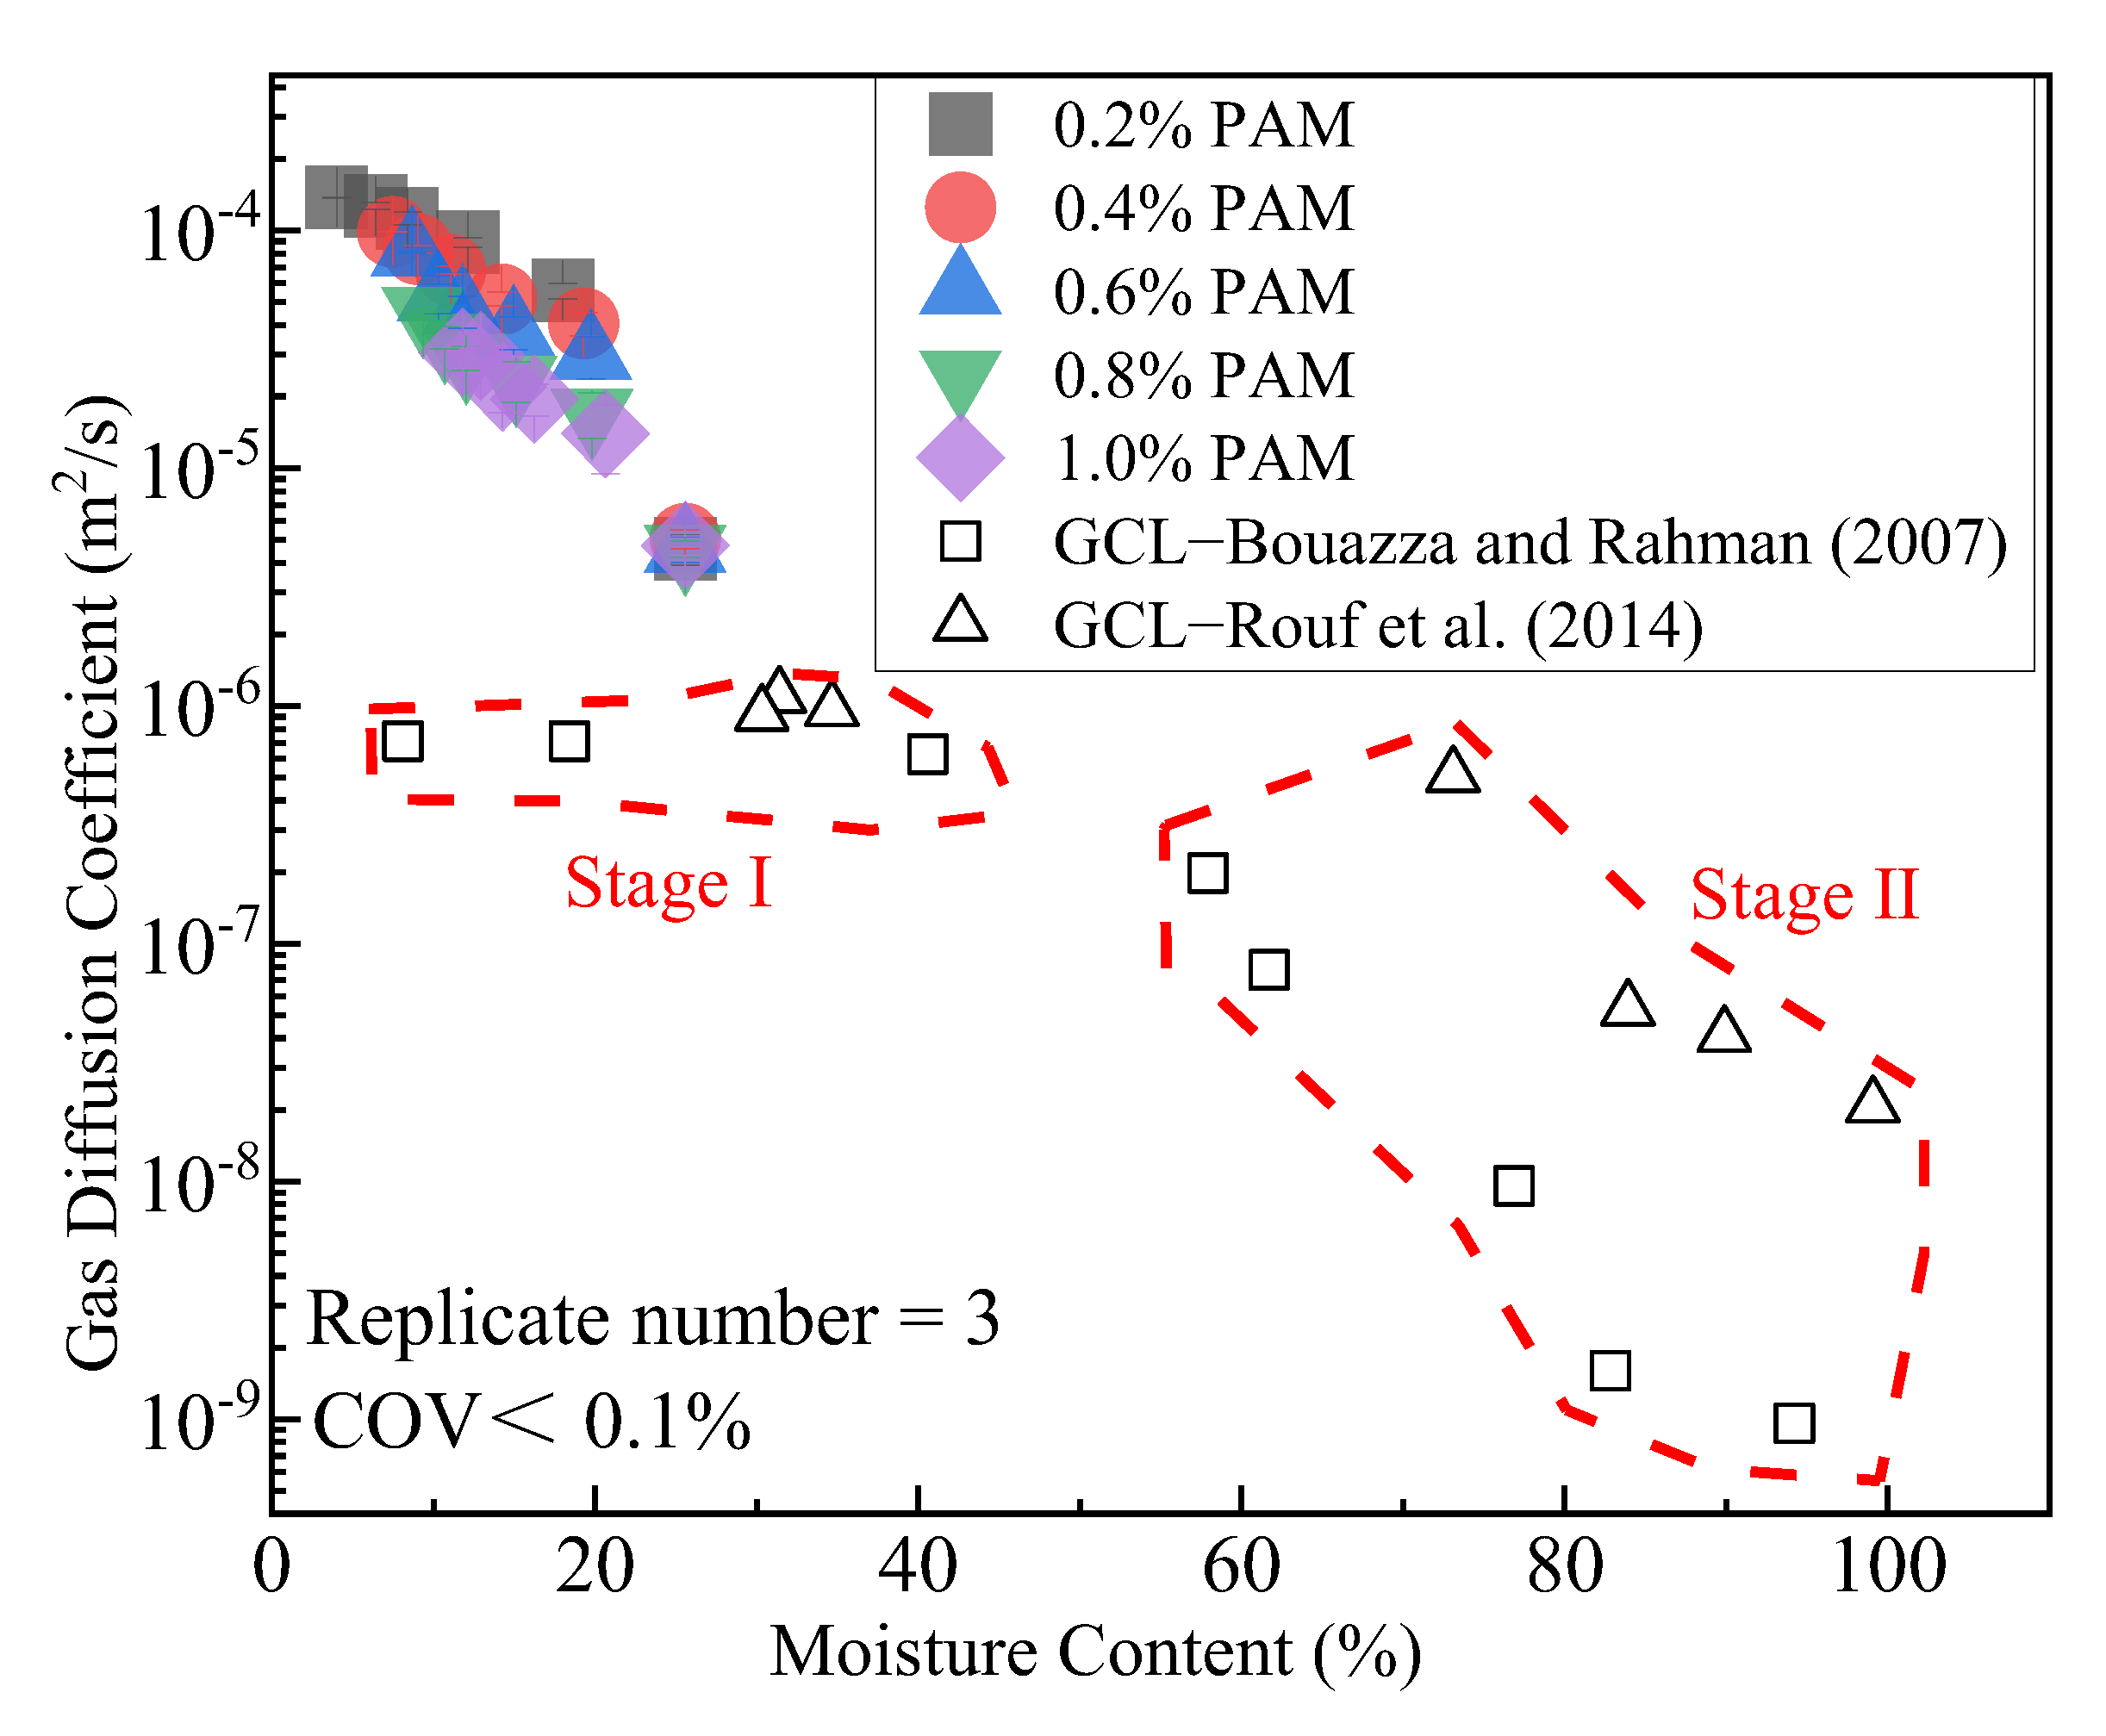
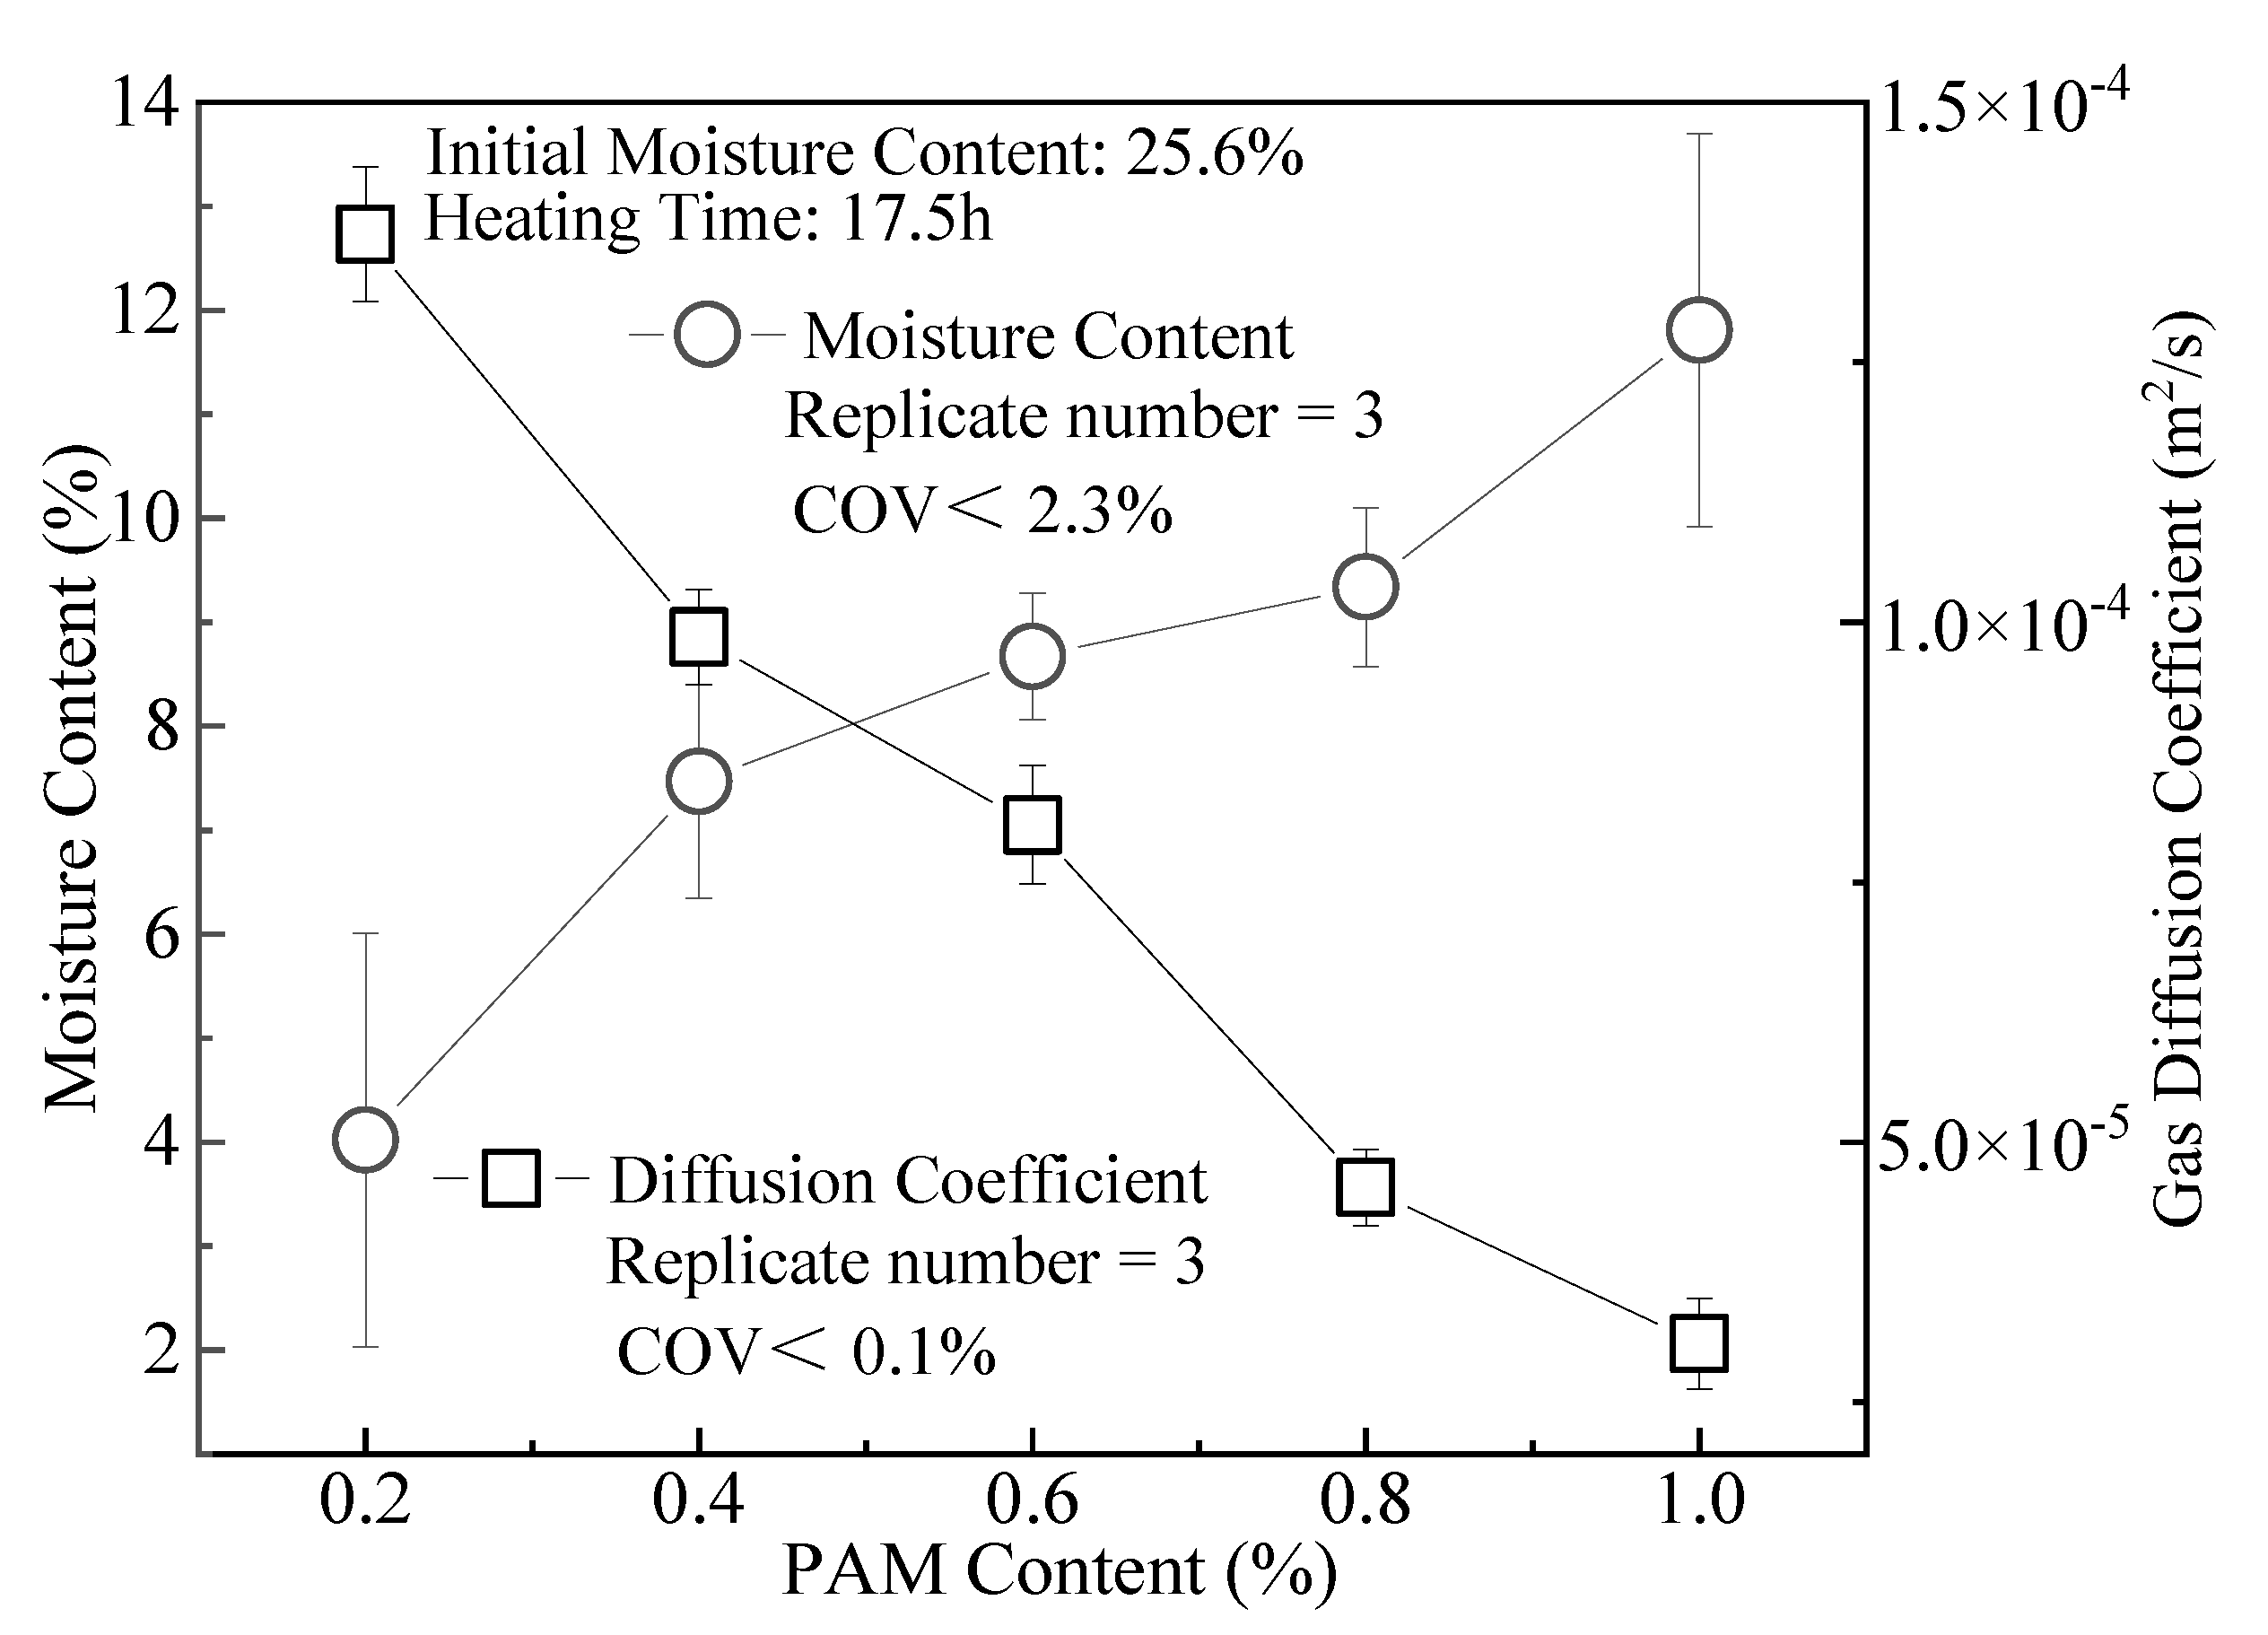
(3)
The effects of ZP, i.e., reducing the clay gas permeability Kp and gas diffusion coefficient Dp, are not obvious. When the content is 1.0%, the Kp of CCC is about one order of magnitude lower than that at the ZP content of 0.2%. Its Dp is only 35% at the admixture content of 0.2%. For CCC with the same moisture content, the Kp and Dp decrease with the rise in ZP content.
(4)
The reasons for the slight improvement in the gas barrier performance of modified clay are as follows. ZP modification enhances the WRC of CCC after drying, thereby reducing the Kp and Dp.
(5)
ZP can increase the LL of compacted clay. When the admixture content varies from 0.2 to 1.0%, LL increases by 45~55% more than unmodified clay.
Further studies are warranted to explore the economic efficiency and long-term stability of ZP-modified CCCs. The data in this study offer modified materials as gas barriers in applying geotechnical engineering.

Supplementary Materials

The supporting information can be downloaded at: https://www.mdpi.com/article/10.3390/app12168379/s1. Figure S1: Clay cracking with different PAMs. Figure S2: Gas permeability and gas diffusion coefficient of clay under different PAMs. Table S1: The results of each sample.

Author Contributions

Data curation, Y.-Z.B., J.-M.W. and H.-L.W.; Funding acquisition, Y.-J.D. and Y.-Z.B.; Investigation, Y.-Z.B., J.-M.W. and H.-L.W.; Supervision, Y.-J.D. All authors have read and agreed to the published version of the manuscript.

Funding

This study was financially supported by the National Key Research and Development Program (Grant Nos. 2018YFC1803100), Jiangsu Province Key Research and Development Program of China (SBE2022740941), National Natural Science Foundation of China (Grant Nos. 41877248 and 42177133), Scientific Research Foundation of Graduate School of Southeast University (Grant No. YBJJ 1844), and Postgraduate Research and Practice Innovation Program of Jiangsu Province (Grant No. KYCX17_0130).

Institutional Review Board Statement

Not applicable.

Informed Consent Statement

Not applicable.

Data Availability Statement

The data that support the findings of this study are available from the first author, Yuzhang Bi, upon reasonable request.

Acknowledgments

We thank the anonymous referee for their careful reading and for providing insightful comments to improve the initial version of this paper. The corresponding author (Yan-Jun Du) would like to acknowledge the Jiangsu Province Key Research and Development Program of China (project name: Key Technology Research on Multi-Coordinated Low Carbon Cover Barrier for VOC Sites in Yangtze River Delta).

Conflicts of Interest

The authors declare no competing interests.

Nomenclature

WRCWater retention capacity
LLLiquid limit
LLdThe dimensionless results of LL
LLckThe LL of soil without any additive
CCCCompacted clay cover
ADOSApparent degree of saturation
IpPlasticity index
CLClay with low LL
CHClay with high LL
MLSilt with low LL
MHSilt with high LL
OLLow liquid limit organic clay or silt
OHHigh liquid limit organic clay or silt
VOCVolatile organic compound
PAMPolyacrylamide
ZPZwitterion polyacrylamide
GCLGeosynthetic clay liner
CKControl blank
COVCovariance (it is a measure of the joint variability of two random variables)
OCOxygen concentration
msSum of the mass of the clay and polyacrylamide (g)
m0The mass of a compacted clay sample before drying (g)
mtThe mass of a compacted clay sample after drying for time t (g)
WSThe water loss rate (%)
KpThe gas permeability of a clay sample
kThe permeability coefficient (m2)
ρlThe air density (kg/m3)
tThe test time (s)
VThe amount of air passing through the sample within time t (m3)
LThe thickness of the compacted clay sample to be tested (m)
pThe actual pressure value (hPa)
AThe bottom area of the sample (m2)
DpThe correction gas diffusion coefficient (m2/s)
DpThe gas diffusion coefficient before calibration (m2/s)
hsThe height of the compacted clay sample
hCThe height of the diffusion chamber (cm)
kThe slope of the straight line in the scatter diagram of ln(△Ct/△C0) (t)
ΔCtThe difference between OC at both ends of the clay sample at time t
ΔC0The difference between OC at both ends of the clay sample at time t0
FPFilter paper
SSSMSaturated salt solution method
RHRelative humidity

References

  1. Mahmoodlu, M.G.; Hassanizadeh, S.M.; Hartog, N.; Raoof, A.; van Genuchten, M.T. Evaluation of a horizontal permeable reactive barrier for preventing upward diffusion of volatile organic compounds through the unsaturated zone. J. Environ. Manag. 2015, 163, 204–213. [Google Scholar] [CrossRef] [PubMed]
  2. Xie, H.-J.; Wang, Q.; Yan, H.; Chen, Y.-M. Steady-state analytical model for vapour-phase volatile organic compound (VOC) diffusion in layered landfill composite cover systems. Can. Geotech. J. 2017, 54, 1567–1579. [Google Scholar] [CrossRef] [Green Version]
  3. Su, Y.; Pei, J.; Tian, B.; Fan, F.; Tang, M.; Li, W.; He, R. Potential application of biocover soils to landfills for mitigating toluene emission. J. Hazard. Mater. 2015, 299, 18–26. [Google Scholar] [CrossRef] [PubMed]
  4. Brusseau, M.L. Transport of organic chemicals by gas advection in structured or heterogeneous porous media: Development of a model and application to column experiments. Water Resour. Res. 1991, 27, 3189–3199. [Google Scholar] [CrossRef]
  5. Moldrup, P.; Olesen, T.; Gamst, J.; Schjønning, P.; Yamaguchi, T.; Rolston, D. Predicting the Gas Diffusion Coefficient in Repacked Soil Water-Induced Linear Reduction Model. Soil Sci. Soc. Am. J. 2000, 64, 1588–1594. [Google Scholar] [CrossRef]
  6. Foose, G.J.; Benson, C.H.; Edil, T.B. Comparison of solute transport in three composite liners. J. Geotech. Geoenviron. Eng. 2002, 128, 391–403. [Google Scholar] [CrossRef]
  7. You, K.; Zhan, H. Comparisons of diffusive and advective fluxes of gas phase volatile organic compounds (VOCs) in unsaturated zones under natural conditions. Adv. Water Resour. 2013, 52, 221–231. [Google Scholar] [CrossRef]
  8. Falta, R.W.; Javandel, I.; Pruess, K.; Witherspoon, P.A. Density-driven flow of gas in the unsaturated zone due to the evaporation of volatile organic compounds. Water Resour. Res. 1989, 25, 2159–2169. [Google Scholar] [CrossRef] [Green Version]
  9. Mendoza, C.A.; Frind, E.O. Advective-dispersive transport of dense organic vapors in the unsaturated zone: 2. Sensitivity analysis. Water Resour. Res. 1990, 26, 388–398. [Google Scholar] [CrossRef]
  10. Conant, B.H.; Gillham, R.W.; Mendoza, C.A. Vapor transport of trichloroethylene in the unsaturated zone: Field and numerical modeling investigations. Water Resour. Res. 1996, 32, 9–22. [Google Scholar] [CrossRef] [Green Version]
  11. Rouf, M.A.; Singh, R.M.; Bouazza, A.; Rowe, R.K.; Gates, W.P. Gas permeability of partially hydrated geosynthetic clay liner under two stress conditions. Environ. Geotech. 2016, 3, 325–333. [Google Scholar] [CrossRef] [Green Version]
  12. Mendes, M.; Pierson, P.; Touze-Foltz, N.; Mora, H.; Palmeira, E. Characterisation of permeability to gas of geosynthetic clay liners in unsaturated conditions. Geosynth. Int. 2010, 17, 344–354. [Google Scholar] [CrossRef]
  13. Suits, L.D.; Sheahan, T.C.; Pitanga, H.N.; Pierson, P.; Vilar, O. Measurement of Gas Permeability in Geosynthetic Clay Liners in Transient Flow Mode. Geotech. Test. J. 2011, 34, GTJ103000. [Google Scholar] [CrossRef]
  14. Bouazza, A.; Vangpaisal, T. Gas Advective Flux of Partially Saturated Geosynthetic Clay Liners. Advances in Transportation and Geoenvironmental Systems Using Geosynthetics. Geotech. Spec. Publ. 2000, 103, 54–67. [Google Scholar]
  15. Shan, H.-Y.; Yao, J.-T. Measurement of air permeability of geosynthetic clay liners. Geotext. Geomembr. 2000, 18, 251–261. [Google Scholar] [CrossRef] [Green Version]
  16. Smith, J.A.; Tisdale, A.K.; Cho, H.J. Quantification of natural vapor fluxes of trichloroethene in the unsaturated zone at Pi-catinny Arsenal, New Jersey. Environ. Sci. Technol. 1996, 30, 2243–2250. [Google Scholar] [CrossRef]
  17. Bouazza, A.; Vangpaisal, T. An apparatus to measure gas permeability of geosynthetic clay liners. Geotext. Geomembr. 2003, 21, 85–101. [Google Scholar] [CrossRef]
  18. Bi, Y.Z.; Fu, X.L.; Zhou, S.J.; Ni, J.; Du, Y. Field Investigation of Effect of Plants on Cracks of Compacted Clay Covers at a Contaminated Site. Int. J. Environ. Res. Public Health 2022, 19, 7248. [Google Scholar] [CrossRef]
  19. Rouf, A.; Bouazza, A.; Singh, R.M.; Gates, W.P.; Rowe, R.K. Gas flow unified measurement system for sequential measurement of gas diffusion and gas permeability of partially hydrated geosynthetic clay liners. Can. Geotech. J. 2016, 53, 1000–1012. [Google Scholar] [CrossRef] [Green Version]
  20. Kerry Rowe, R.; Rayhani, M.T.; Take, W.A. GCL hydration under simulated daily thermal cycles. Geosynth. Int. 2011, 18, 196–205. [Google Scholar] [CrossRef]
  21. Sjökvist, T.; Niklewski, J.; Blom, Å. Effect of wood density and cracks on the moisture content of coated Norway spruce (Picea abies (L.) Karst). Wood Fiber Sci. 2019, 51, 160–172. [Google Scholar] [CrossRef] [Green Version]
  22. Drumm, E.C.; Boles, D.R.; Wilson, G.V. Desiccation cracks result in preferential flow. Geotech. News-Vanc. 1997, 15, 22–26. [Google Scholar]
  23. Friedrich, S. Superabsorbent polymers (SAP). In Application of Super Absorbent Polymers (sap) in Concrete Construction; Springer: Dordrecht, The Netherlands, 2012; pp. 13–19. [Google Scholar]
  24. Mo, C.; Zhu, S.; Li, H.; Huang, Z. Synthesis of poly (acrylic acid)/sodium humate superabsorbent composite for agricultural use. J. Appl. Polym. Sci. 2006, 102, 5137–5143. [Google Scholar] [CrossRef]
  25. Theng, B.K.G. Interactions of clay minerals with organic polymers. Some practical applications. Clays Clay Miner. 1970, 18, 357–362. [Google Scholar] [CrossRef]
  26. Li, Y.; Shao, M.; Horton, R. Effect of Polyacrylamide Applications on Soil Hydraulic Characteristics and Sediment Yield of Sloping Land. Procedia Environ. Sci. 2011, 11, 763–773. [Google Scholar] [CrossRef] [Green Version]
  27. Liu, J.; Chen, Z.; Kanungo, D.P.; Song, Z.; Bai, Y.; Wang, Y.; Li, D.; Qian, W. Topsoil reinforcement of sandy slope for preventing erosion using water-based polyurethane soil stabilizer. Eng. Geol. 2019, 252, 125–135. [Google Scholar] [CrossRef]
  28. Qi, C.; Bai, Y.; Liu, J.; Bu, F.; Kanungo, D.P.; Song, Z.; He, X. Desiccation Cracking Behavior of Polyurethane and Polyacrylamide Admixed Clayey Soils. Polymers 2020, 12, 2398. [Google Scholar] [CrossRef]
  29. Yu, B.; El-Zein, A.; Rowe, R.K. Effect of added polymer on the desiccation and healing of a geosynthetic clay liner subject to thermal gradients. Geotext. Geomembr. 2020, 48, 928–939. [Google Scholar] [CrossRef]
  30. ASTM D3441-05; Standard Test Method for Mechanical Cone Penetration Tests of Soil. American Society for Testing and Materials: West Conshohocken, PA, USA, 2005.
  31. Hunt, R.E. Geotechnical Engineering Investigation Handbook; CRC Press: Boca Raton, FL, USA, 2005. [Google Scholar]
  32. Moore, J.E. Field Hydrogeology: A Guide for Site Investigations and Report Preparation; CRC Press: Boca Raton, FL, USA, 2016. [Google Scholar]
  33. Hess-Kosa, K. Environmental Site Assessment Phase I: A Basic Guide; CRC Press: Boca Raton, FL, USA, 2007. [Google Scholar]
  34. CJJ-2008; Code for Construction and Quality Acceptance of Road Works in City and Town. China Communications Press: Beijing, China, 2008.
  35. Kaneko, K.; Nohara, S. Review of effective vegetation mapping using the UAV (Unmanned Aerial Vehicle) method. J. Geogr. Inf. Syst. 2014, 6, 733. [Google Scholar] [CrossRef] [Green Version]
  36. Wong, W.S.D.; Lee, L. Statistical Analysis of Geographic Information with ArcView GIS and ArcGIS; Wiley: Hoboken, NJ, USA, 2005. [Google Scholar]
  37. Mechtcherine, V.; Gorges, M.; Schroefl, C.; Assmann, A.; Brameshuber, W.; Ribeiro, A.B.; Cusson, D.; Custódio, J.; Da Silva, E.F.; Ichimiya, K.; et al. Effect of internal curing by using superabsorbent polymers (SAP) on autogenous shrinkage and other properties of a high-performance fine-grained concrete: Results of a RILEM round-robin test. Mater. Struct. 2013, 47, 541–562. [Google Scholar] [CrossRef]
  38. Koerner, G.R.; Koerner, R.M. Long-term temperature monitoring of geomembranes at dry and wet landfills. Geotext. Geomembr. 2006, 24, 72–77. [Google Scholar] [CrossRef]
  39. ASTM D2216-19; Standard Test Methods for Laboratory Determination of Water (Moisture) Content of Soil and Rock by Mass. American Society for Testing and Materials: West Conshohocken, PA, USA, 2019.
  40. ASTM D854-14; Standard Test Methods for Specific Gravity of Soil Solids by Water Pycnometer. American Society for Testing and Materials: West Conshohocken, PA, USA, 2016.
  41. ASTM D4318-17e1; Standard Test Methods for Liquid Limit, Plastic Limit, and Plasticity Index of Soils. American Society for Testing and Materials: West Conshohocken, PA, USA, 2018.
  42. ASTM D7382-20; Standard Test Methods for Determination of Maximum Dry Unit Weight of Granular Soils Using a Vibrating Hammer. American Society for Testing and Materials: West Conshohocken, PA, USA, 2020.
  43. ASTM D4253-16e1; Standard Test Methods for Maximum Index Density and Unit Weight of Soils Using a Vibratory Table. American Society for Testing and Materials: West Conshohocken, PA, USA, 2019.
  44. Koerner, G.R.; Koerner, R.M. In-Situ Temperature Monitoring of Geomembranes. In Proceedings of the GRI-18 Conference on Geosynthetics Research and Development In-Progress, GeoFrontiers, ASCE, Austin, TX, USA, 24–26 January 2005; pp. 318–323. [Google Scholar]
  45. Dantas, G.H.S.; Furlan, A.P.; Fabbri, G.T.P. On gyratory compaction of a clayey soil. EJGE 2016, 21, 5725–5733. [Google Scholar]
  46. ASTM D2974-20e1; Standard Test Methods for Determining the Water (Moisture) Content, Ash Content, and Organic Material of Peat and Other Organic Soils. American Society for Testing and Materials: West Conshohocken, PA, USA, 2020.
  47. Seright, R.S.; Campbell, A.R.; Mozley, P.S.; Han, P. Stability of partially hydrolyzed polyacrylamides at elevated temperatures in the absence of divalent cations. SPE J. 2010, 15, 341–348. [Google Scholar] [CrossRef]
  48. Shackelford, C.D.; Benson, C.H.; Katsumi, T.; Edil, T.B.; Lin, L. Evaluating the hydraulic conductivity of GCLs permeated with non-standard liquids. Geotext. Geomembr. 2000, 18, 133–161. [Google Scholar] [CrossRef]
  49. Moldrup, P.; Poulsen, T.G.; Schjønning, P.; Olesen, T.; Yamaguchi, T. Gas Permeability in Undisturbed Soils: Measurements and Predictive Models. Soil Sci. 1998, 163, 180–189. [Google Scholar] [CrossRef]
  50. McCarthy, K.P.; Brown, K.W. Soil gas permeability as influenced by soil gas-filled porosity. Soil Sci. Soc. Am. J. 1992, 56, 997–1003. [Google Scholar] [CrossRef]
  51. Taylor, S.A. Oxygen diffusion in porous media as a measure of soil aeration. Proc. Soil Sci. Soc. Am. 1949, 14, 55–61. [Google Scholar] [CrossRef] [Green Version]
  52. Su, Z. Using Gradient Method to Estimate Soil Surface CO2 Flux in Crop and Grass Field; China Agricultural University: Beijing, China, 2016. (In Chinese) [Google Scholar]
  53. Zhang, J. Comparative Analysis of Basic Properties to 11 Kind of Super-Absorbent-Polymers; Northwest Sci-Tech University of Agricultural and Forestry: Xianyang, China, 2009. (In Chinese) [Google Scholar]
  54. Republic of China. Specification of Soil Test; SL237-1999; China Architecture and Building Press: Beijing, China, 1999. [Google Scholar]
  55. Scalia, I.V.J.; Benson, C.H.; Bohnhoff, G.L. Long-term hydraulic conductivity of a bentonite-polymer composite permeated with aggressive inorganic solutions. J. Geotech. Geoenviron. Eng. 2014, 140, 04013025. [Google Scholar] [CrossRef]
  56. Lee, J.M.; Shackelford, C.D.; Benson, C.H.; Jo, H. Correlating index properties and hydraulic conductivity of geosynthetic clay liners. J. Geotech. Geoenviron. Eng. 2005, 131, 1319–1329. [Google Scholar] [CrossRef] [Green Version]
  57. Bouazza, A.; Rahman, F. Oxygen diffusion through partially hydrated geosynthetic clay liners. Civ. Eng. 2007, 57, 767–772. [Google Scholar] [CrossRef]
  58. Yang, C.D.; Lu, S.G. Effects of five different biochars on aggregation, water retention and mechanical properties of paddy soil: A field experiment of three-season crops. Soil Tillage Res. 2021, 205, 104798. [Google Scholar] [CrossRef]
  59. Soltani-Jigheh, H.; Bagheri, M.; Amani-Ghadim, A.R. Use of hydrophilic polymeric stabilizer to improve strength and durability of fine-grained soils. Cold Regions Sci. Technol. 2019, 157, 187–195. [Google Scholar] [CrossRef]
  60. Vangpaisal, T. Gas Permeability of Geosynthetic Clay Liners under Various Conditions. Ph.D. Thesis, Monash University, Melbourne, Australia, 2002. [Google Scholar]
Figure 1. Plasticity chart for classification of fine-grained soils.
Applsci 12 08379 g001
Figure 2. The 3D printing gas diffusion chamber.
Applsci 12 08379 g002
Figure 3. Liquid limit of CCC mixed with ZP. (a) Influence of PAM content on the LL of the compacted clay; (b) effect of different materials mixed with clay on LL/LLck of the compacted clay [58,59].
Applsci 12 08379 g003
Figure 4. The moisture content of the compacted clay mixed with different PAM contents.
Applsci 12 08379 g004
Figure 5. Water loss percentage of the compacted clay mixed with different contents of ZP.
Applsci 12 08379 g005
Figure 6. Relationship between the gas permeability and moisture content of compacted clay after ZP modification [11,13,60].
Applsci 12 08379 g006
Figure 7. Influence of ZP content on gas permeability of the compacted clay.
Applsci 12 08379 g007
Figure 8. Relationship between the gas diffusion coefficient and moisture content of the compacted clay after PAM modification [11,57].
Applsci 12 08379 g008
Figure 9. Influence of ZP content on the gas diffusion coefficient of the compacted clay.
Applsci 12 08379 g009
Table 1. Basic physical indicators of the clay used in the test.
ParametersNumber of SamplesMeanTest Method
Natural moisture content (%)4022.5ASTM D2216 [31,39]
Specific gravity, Gs402.72ASTM D854 [40]
Liquid limit, LL (%)4038.14ASTM D4318 [41]
Plastic limit, PI (%)4014.90
Optimal moisture content (%)625.6ASTM D7382 [42]
Maximum dry density (g/cm3)61.78ASTM D4253 [43]
Organic content, Coc (%)64.2ASTM D2974 [44]
Table 2. Testing program and parameters of this study.
Testing ParametersValues
Polymer typeZwitterionic polyacrylamide (ZP)
Molecular weight12 million
Admixture amount (%)0, 0.2, 0.4, 0.6, 0.8, 1.0
Drying time (h)0, 3.5, 7, 10.5, 14, 17.5
Testing programMoisture content, water loss, gas permeability, gas diffusion, liquid limit
Publisher’s Note: MDPI stays neutral with regard to jurisdictional claims in published maps and institutional affiliations.

