1. Introduction
Undoubtedly, the COVID-19 pandemic is the biggest public-health crisis human beings have ever seen in a century [
1,
2,
3]. The pandemic disrupted the livelihoods and a traumatic global depression loomed [
4,
5]. Every walk of life is unprecedentedly ruined, and academic research has been no exception [
6,
7,
8]. A myriad of public spaces including labs, libraries, etc., were shuttered. Research and development processes therefore have been somewhat compromised. The wide spread of the COVID-19 pandemic has spurred a growing meditation for the way in which research activities should be conducted [
9,
10,
11]. As an outcome, two successful yet essential paradigms, viz., work-from-home strategy and online education/learning, have been conceived and adopted worldwide. Consequently, onsite education/learning activities such as indoor classes, face-to-face meetings, hands-on tutorials, etc., have been turned into online mode. Countless employees are forced to work from home [
12]. As the pandemic is subsiding, scientists are moving back to the labs. However, they are faced with shift work, masks, distancing protocols and other precaution initiatives, which not only reduce significant work efficiency but also elicit other issues [
13,
14]. Albeit these stopgap paradigms, scientists are yet to tolerate diverse subpar conditions in hopes of making their own contributions as well as sacrifices to revolt against the pandemic, thereby obtaining a coveted normalcy of academia [
15,
16,
17].
Academic conferences are an indispensable component of research. Conferences provide the opportunities for gathering scientists all over the world for sharing state-of-the-art research and disseminating research ideas, thereby achieving innovations and inspirations for research. Conference attendees not only can meet friends whom they have not seen for a long time due to geographical issues but also can make new friends. The last but not least merit is that conference attendees can have the chance for sightseeing in the host venues of the conferences. However, due to the outbreak of the COVID-19 pandemic, many conferences have gone virtual to mitigate the propagation of the virus [
18,
19,
20,
21]. As compared to onsite conferences, virtual conferences do not require long-distance travel. Virtual conferences are preferred by some scientists as they claim that traveling for over ten hours just to give a ten-minute presentation to an exhausted audience is annoying. Virtual conferences are prevailing in 2020 and 2021, especially in the face of the pandemic.
It is not new that conferences will charge the attendees for registration fees which will be disposed for expenditures such as article publishing charge, banquet, conference propaganda hand-outs, conference souvenirs, excursion costs, etc. Conference registration fees vary and are normally at the organizers’ discretion. Nevertheless, a couple of enigmas such as how the certain amount of registration fee is determined, how the money is appropriated, and where the residual money has gone are all non-transparent to the public. Before the outbreak of the pandemic, onsite conferences were taking place all over the world for scientists to brainstorm ideas for addressing academic and industrial bottlenecks. Ever since its outbreak in early 2020, many conferences have been turned into virtual due to stringent precaution measures or even lockdowns [
11,
22]. Although the move to virtual conferences has been a tough decision over the pandemic, the attendees experience prodigious differences from physical conferences. Some attendees yearn for onsite conferences, as they argue that virtual conferences do not make them feel the sense of togetherness. Meanwhile, virtual conferences throttle the opportunities for sharing anecdotes among the attendees, which is one of the treasures of onsite conferences. On the contrary, other attendees prefer the virtual mode, as they justify that virtual conferences have multiple merits. First, virtual conferences lower the probability of exposure to the contagious virus. Second, online interactions help young researchers reduce social awkwardness when faced with a group of senior researchers. Third, virtual conferences exempt attendees from exhausting long-distance travel and save a considerable amount of commuting fees for young researchers who earn a meager salary.
On its face, virtual conferences economize on logistics. However, virtual conferences still cost attendees a lot. Note that when holding virtual conferences, the organization committees are exempt from tedious affairs such as renting venues, preparing banquets, etc. Therefore, attendees may wish to expect an enormous waiver of the registration fees or even free attendance. Here, we collect the registration fee information for international conferences across 2019, 2020 and 2021. These conferences span through 10 disciplines. We analyze the registration fees of those conferences and discover that most of the virtual conferences still charge high registration fees for attendees, irrespective of the fact that the conference committees merely cater to the attendees. Although some of the virtual conferences reduce the registration fees as compared to their former on-site events, we discover that the fee deduction is still small. We advocate here that academic conference organizations should make virtual conferences as an option in the future, and mixed-mode conferences should be the normalcy. We also advocate here that flexible conference registration fee packages should be allocated to cater to different requirements of attendees. In addition, we also advocate that, if possible, the expenditure of conference registration fees can be open to the public to achieve academic transparency.
2. Materials and Methods
2.1. Original Research Data
The conferences considered in this research were based on multiple sources which include the conference list released by Tsinghua University (version 2020) and several websites (see
Appendix A). For a focal conference, its basic information had been manually retrieved using Google. If the focal conference had been held in 2019, then its basic information (see
Appendix B.1) was collected from its corresponding official website. The preceding operations applied to the years 2020 and 2021 as well. Consequently, there were three maximum entries for a given conference. The final collected data recorded information for 502 unique conferences with 1452 records that span through 10 disciplines (see
Appendix B.1).
2.2. Data Preprocessing
Note that some conferences deleted the original websites for their past events. As a consequence, their basic information especially the registration fees cannot be retrieved. After obtaining the original data, data preprocessing (see
Appendix B.2 and
Appendix B.3) with respect to several assumptions was implemented for data imputation to infer the missing registration fee information as well as for removing unfavorable conference records. After the data preprocessing, 479 unique conferences with concrete information remained for subsequent analysis.
2.3. Data Analysis
After the data preprocessing process, data analysis was carried out to explore answers to the following research questions:
(1) What are the distributions of the venues of conferences held in the past three years?
(2) What are the activity levels of different disciplines in terms of conference holding for the past three years?
(3) What are the distributions of the registration fees of conferences held in the past three years?
(4) How do the registration fees of academic conferences evolve during and after the COVID-19 pandemic?
The answers to the above research questions were achieved by the following key steps. First, the rankings of the countries as well as the disciplines in terms of the number of conferences occurred were carried out. This step provided answers to the first two research questions. Then, the distributions of four types of registration fees with respect to the years, countries and disciplines involved were analyzed. This step answered the third question. Finally, the comparisons between the registration fees for onsite and virtual conferences were made (see
Appendix B.4). This step answered the last question.
3. Results
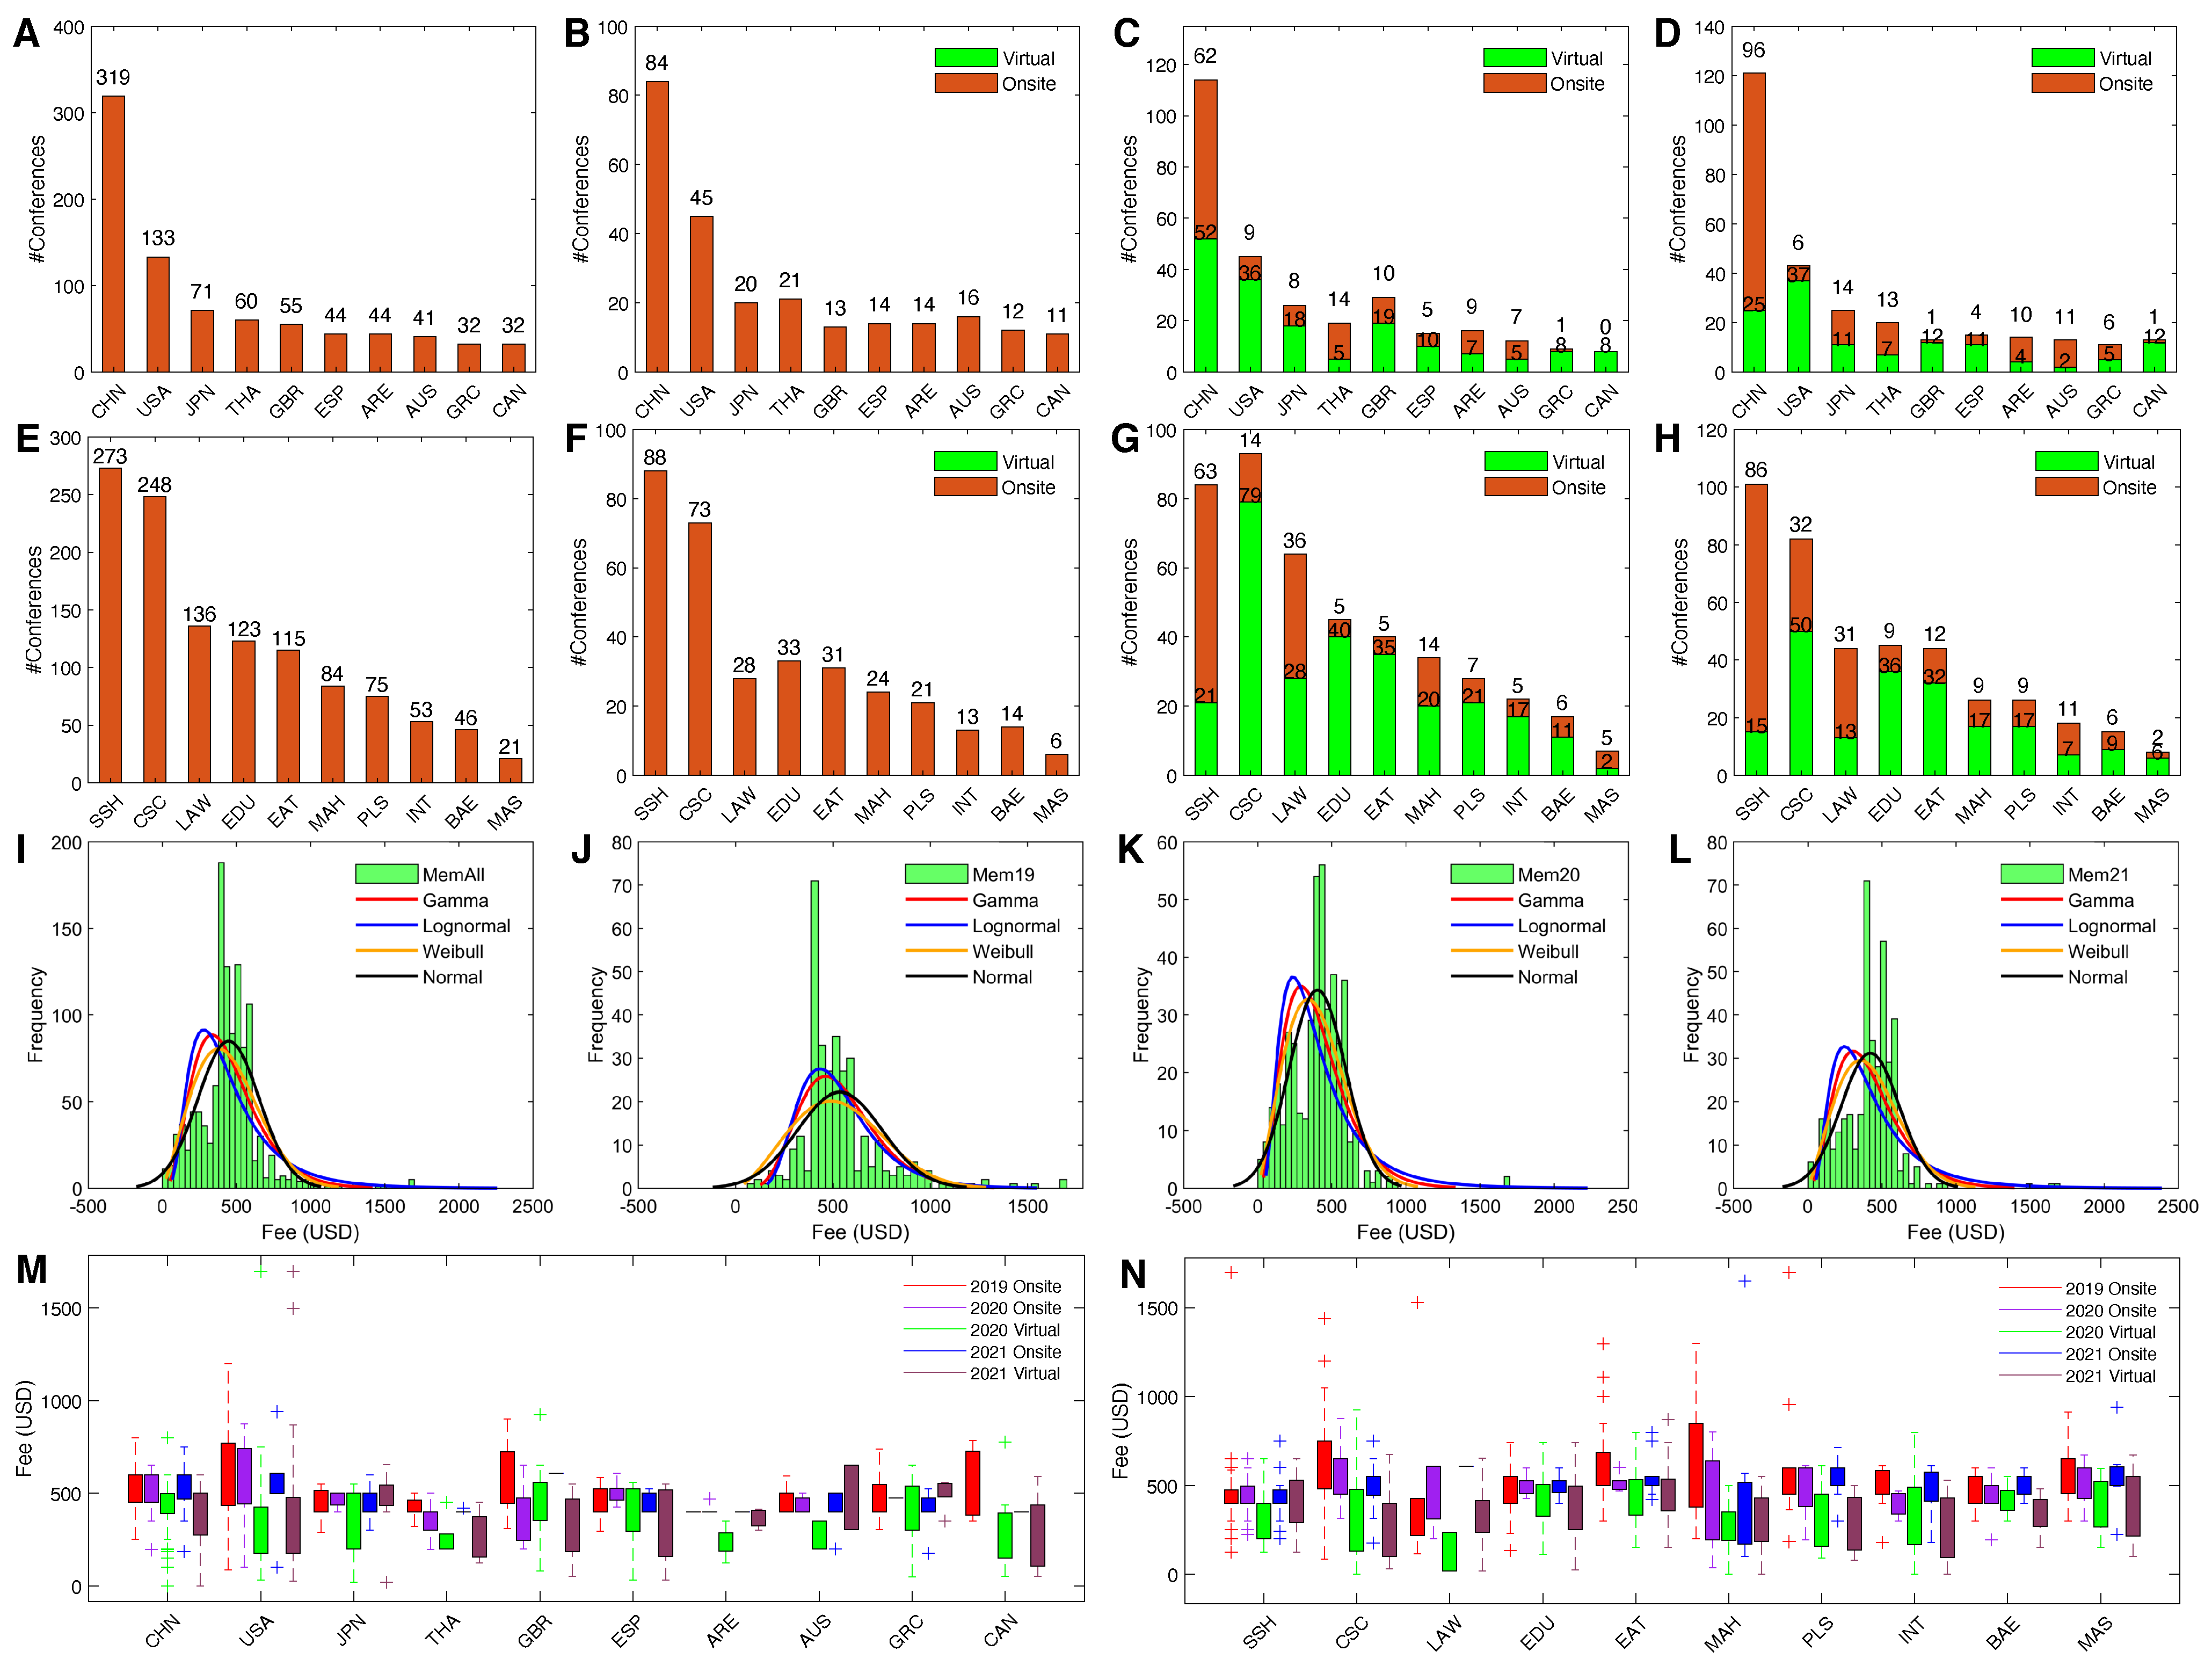
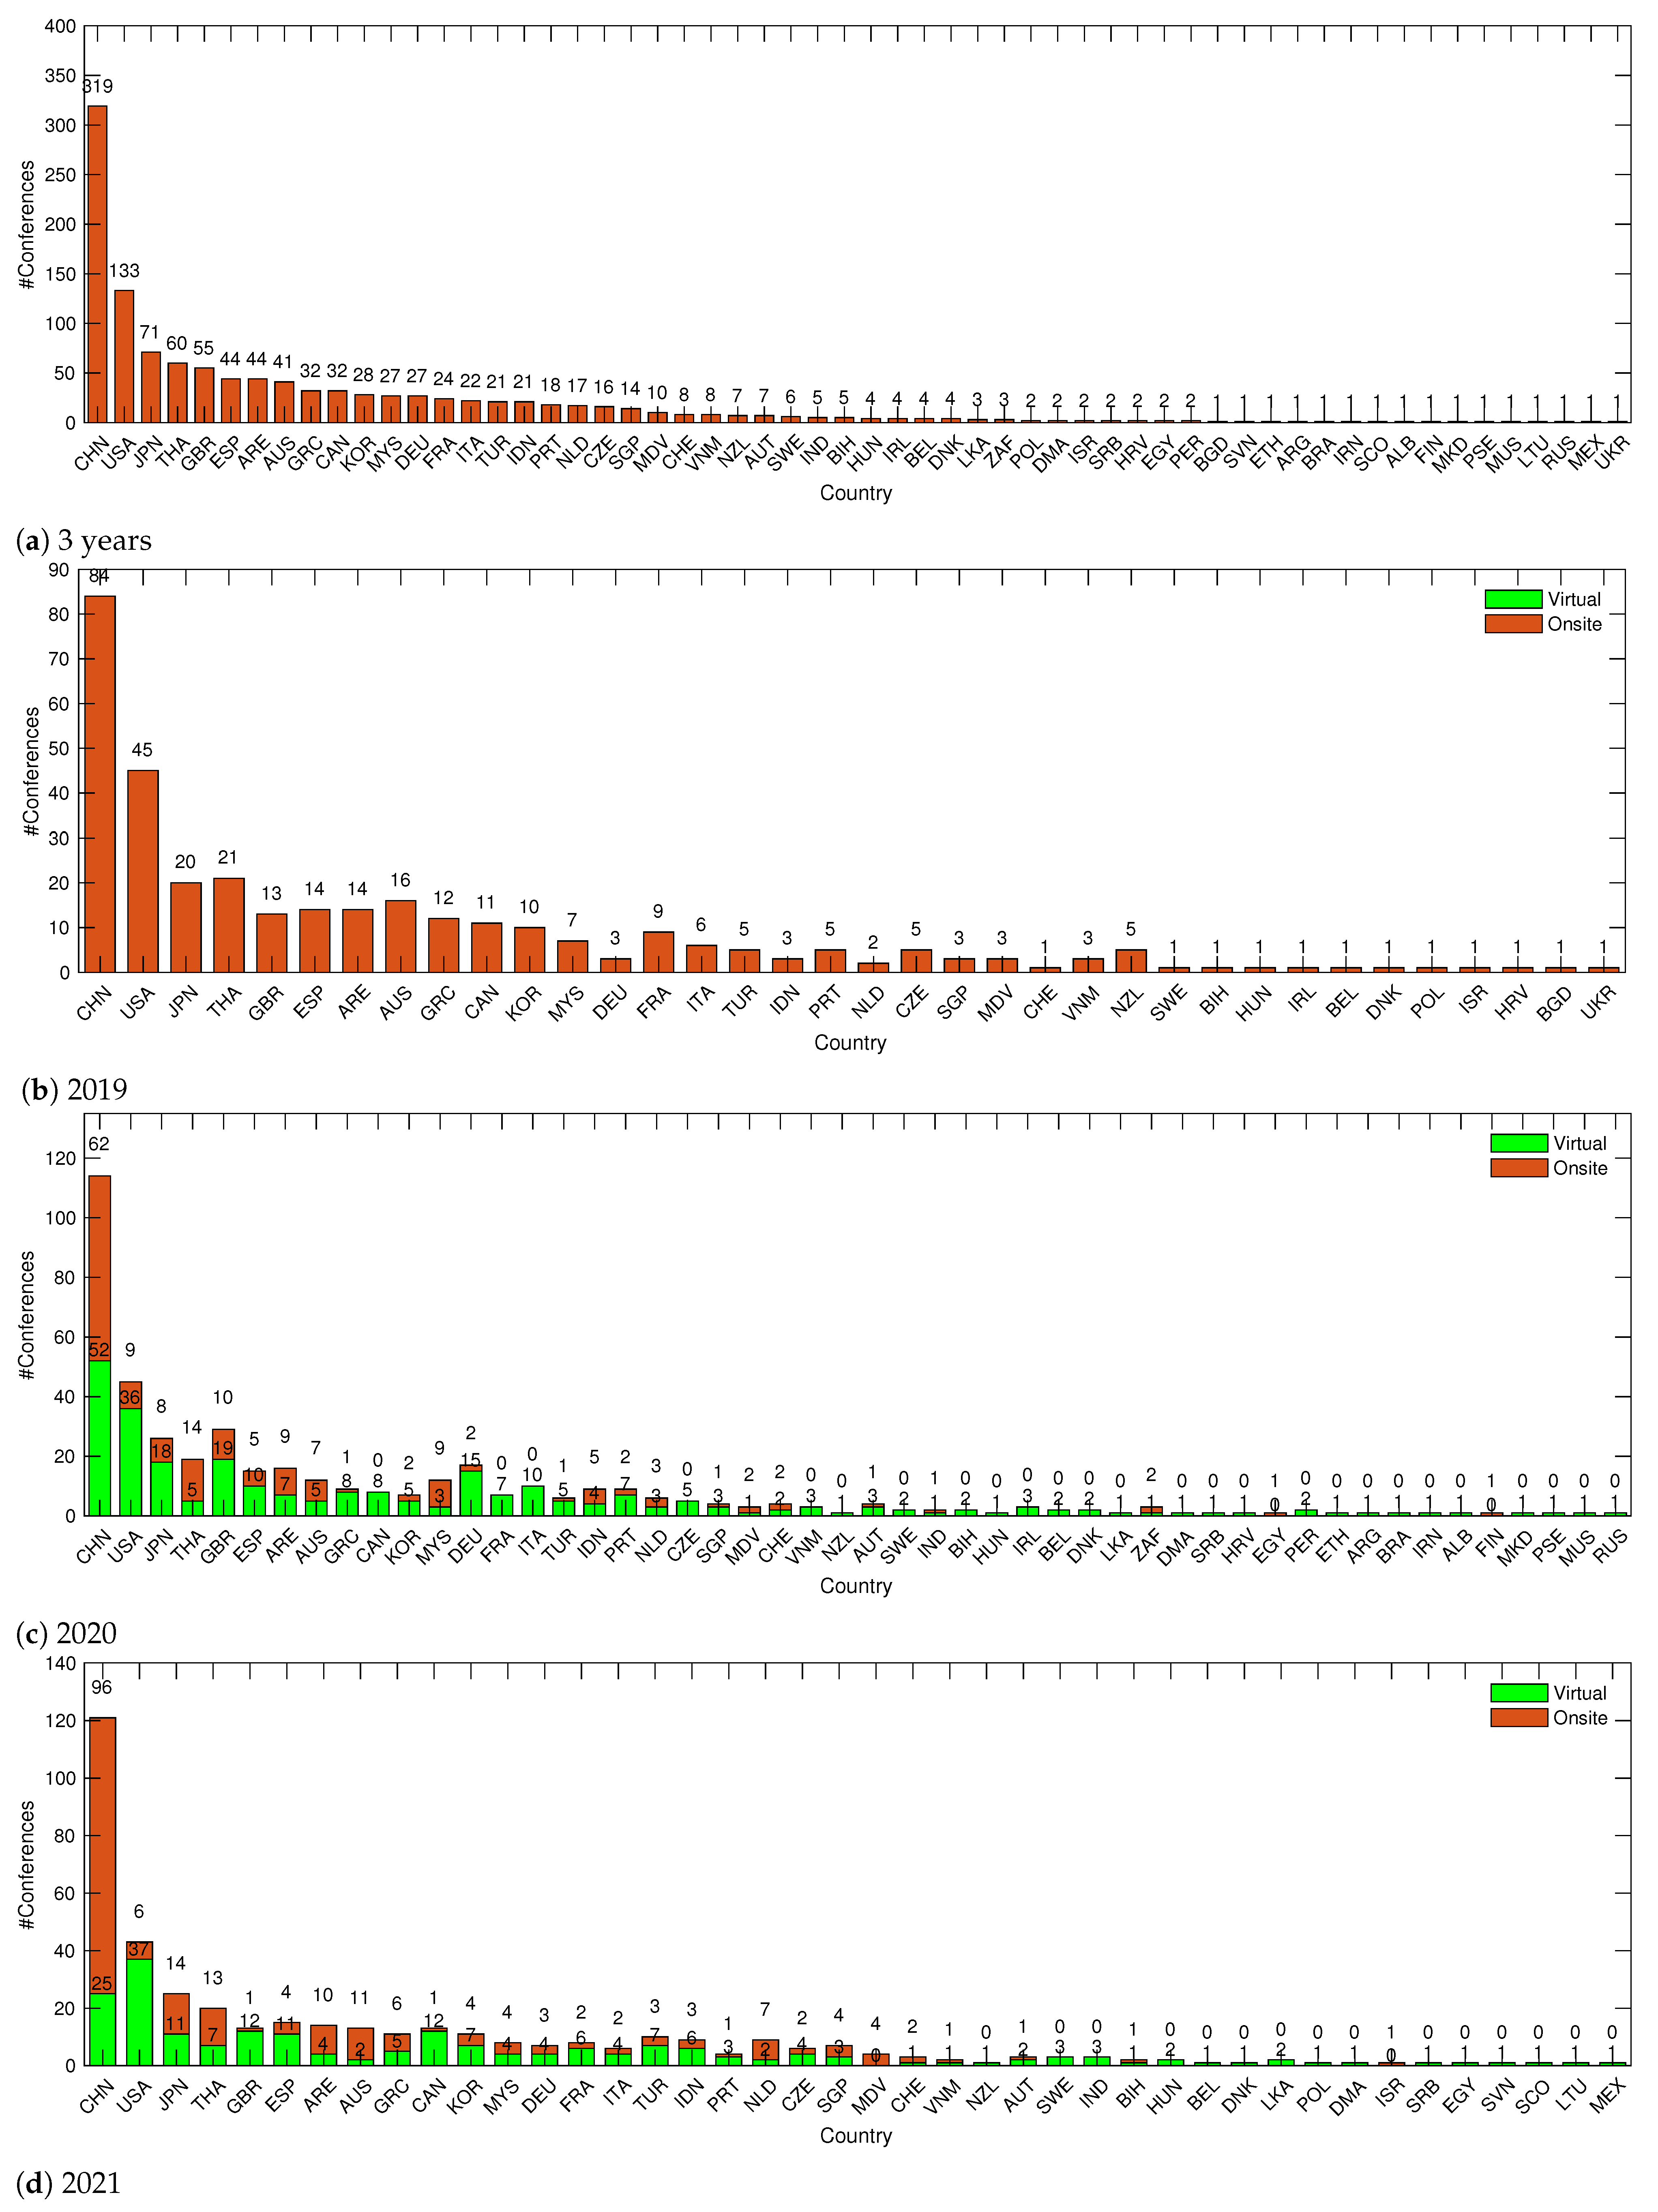
We discovered that China passed the USA as the country that held the most conferences (
Figure 1A). Although the COVID-19 pandemic already started to propagate in 2019, there were no virtual conferences in 2019 (
Figure 1B). We also observed from the data that 274 out of 434 conferences held in 2020 were virtual, while 202 out 409 conferences were virtual in 2021.
Figure A1 in
Appendix B.4 shows the detailed number of conferences held by each country. In 2020, 47% of the conferences held in China had been moved to online, while 80% of the conferences held in the USA went virtual, and conferences held in countries such as Canada had entirely been shifted to online mode (
Figure 1C). After the Chinese government took a series of effective and stringent control measures to revolt against the pandemic, the COVID situation in China subsided in 2021. On the contrary, the USA government faced huge opposition from its fellow citizens regarding the implementation of circuit breakers or border restrictions. That is accountable for the considerable decline and a slight increase in the number of virtual conferences held in China and the USA, respectively, in 2021 (
Figure 1D).
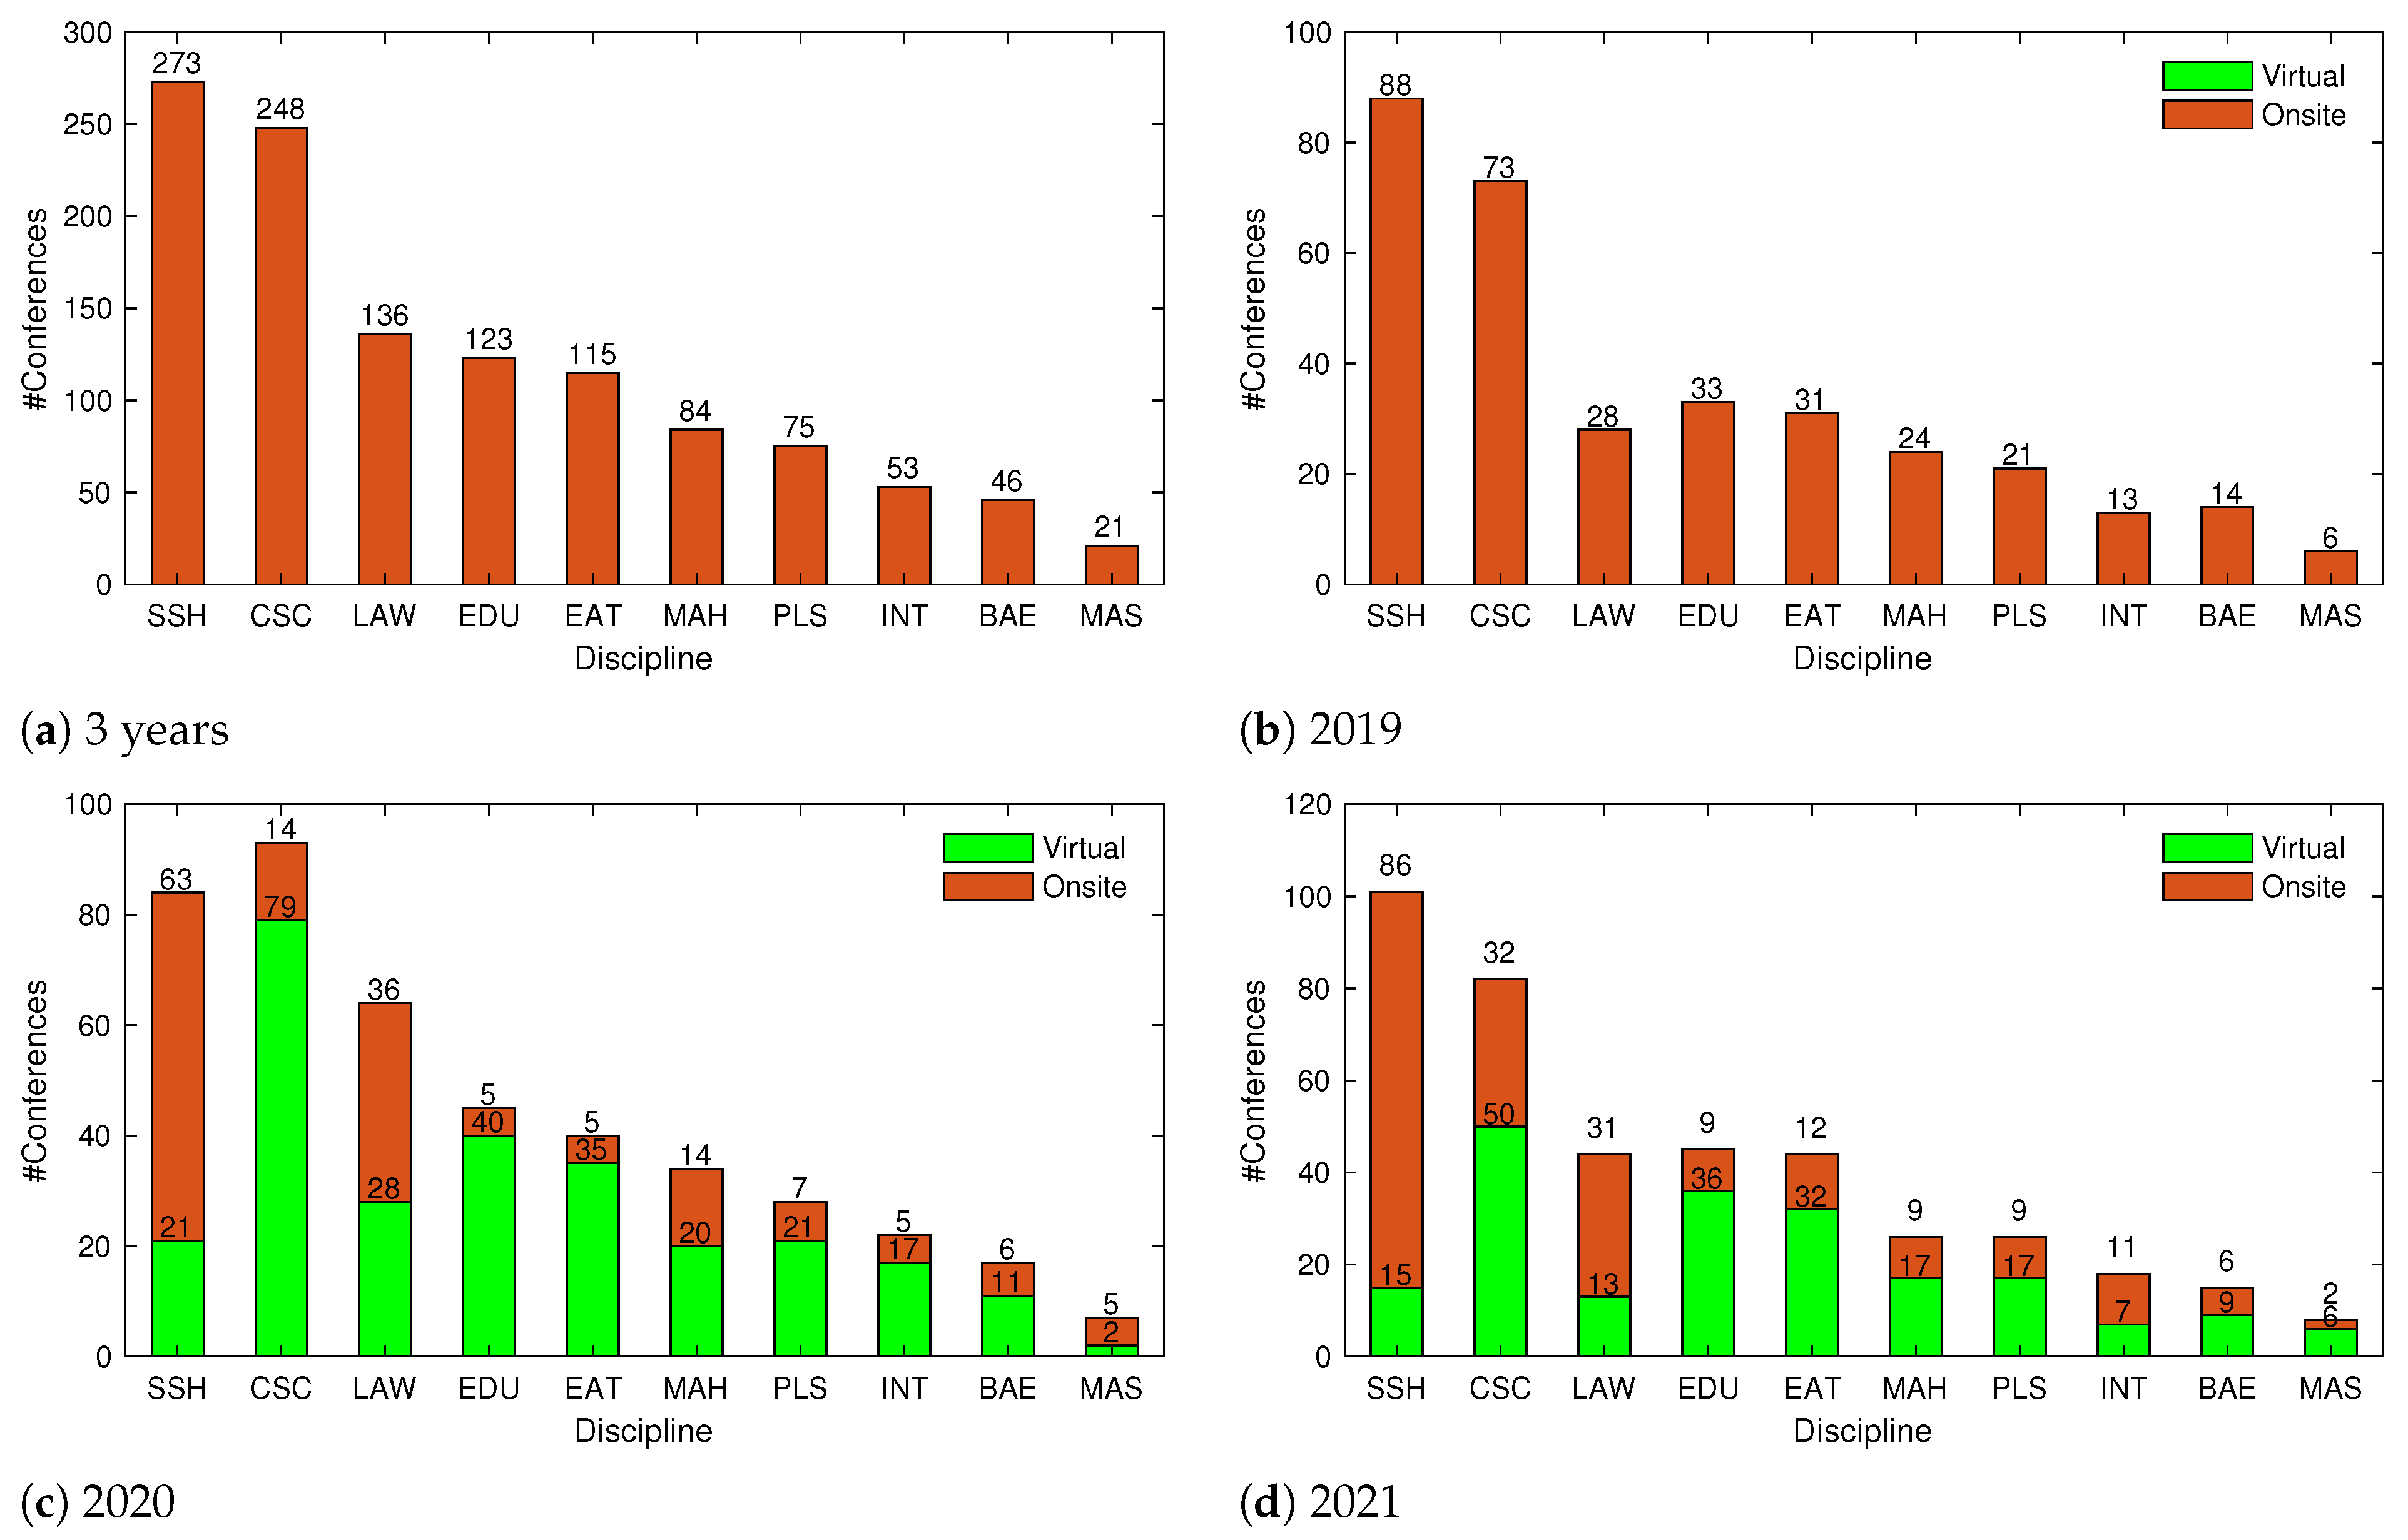
As for the 10 disciplines, we recorded the number of conferences with respect to each discipline. The detailed results are shown in
Figure A2 in
Appendix B.4. We discovered that the discipline of Social Sciences and Humanities held the largest number of conferences, while the Computer Sciences community was the second most active discipline (
Figure 1E,F). Ever since the outbreak of the pandemic, we discovered that the Computer Sciences domain was keener on virtual conferences, and the two successors were the Education and Engineering & Technology disciplines (
Figure 1G,H). China and the USA, respectively, held 26 and 18 conferences within the Computer Sciences domain in 2020, and those numbers became 32 and 10, respectively, in 2021, given the fact that China still put in place stringent border control measures.
Regarding the distributions of the registration fees,
Figure A3 in
Appendix C.1 demonstrates the histograms of the four types of registration fees for each year, while
Figure A4 in
Appendix C.2 presents the detailed curve fitting results of the histograms. As shown in
Figure 1I–L as well as
Table A6 in
Appendix C.2, we found that the overall distributions and the distributions of the fees for each year follow the normal distributions. In 2019, the average registration fee for members was circa 500 USD (
Figure 1J). Because of the pandemic, the average fee was circa 400 USD in 2020 and 2021. In order to investigate the impact of the pandemic on the conference registration fees, the distributions of the registration fees for members of conferences held in each of the top 10 countries and the discipline were analyzed. We discovered that the conferences held in the USA charged higher than conferences held in other countries (
Figure 1M). We also observed that conferences belonging to the disciplines of Medicine and Health and Computer Sciences charged relatively higher than conferences belonging to other disciplines did (
Figure 1N). By looking into the data, we observed that three conferences within the discipline of Physical and Life Sciences and two conferences within the discipline of Social Sciences and Humanities charged attendees more than 1500 USD for attending the conferences, while there are a total of 38 conferences that charged attendees more than 1000 USD (see the detailed results shown in
Figure A5 and
Figure A6 in
Appendix C.3 and
Appendix D.1). The distributions of the registration fees for virtual and onsite conferences with respect to the 10 countries and disciplines over the three years were compared. Interestingly, the statistical results do not indicate a big gap between the registration fees of virtual and onsite conferences (
Figure 1M,N).
For all the conferences recorded over the three years, we counted the corresponding number of conferences with respect to different member fee categories (
Table 1). Under the sway of the pandemic, many conferences moved online. For virtual conferences, the majority of them charged a member fee between 400 and 500 USD, which was also preferred by onsite conferences. We observed that the number of both virtual and onsite conferences whose member fees were higher than 700 USD decreased in 2020 and 2021, while the number of virtual conferences whose member fees were lower than 300 USD increased in the presence of the pandemic. We also noticed that only three and two virtual conferences held, respectively, in 2020 and 2021 charged nil.
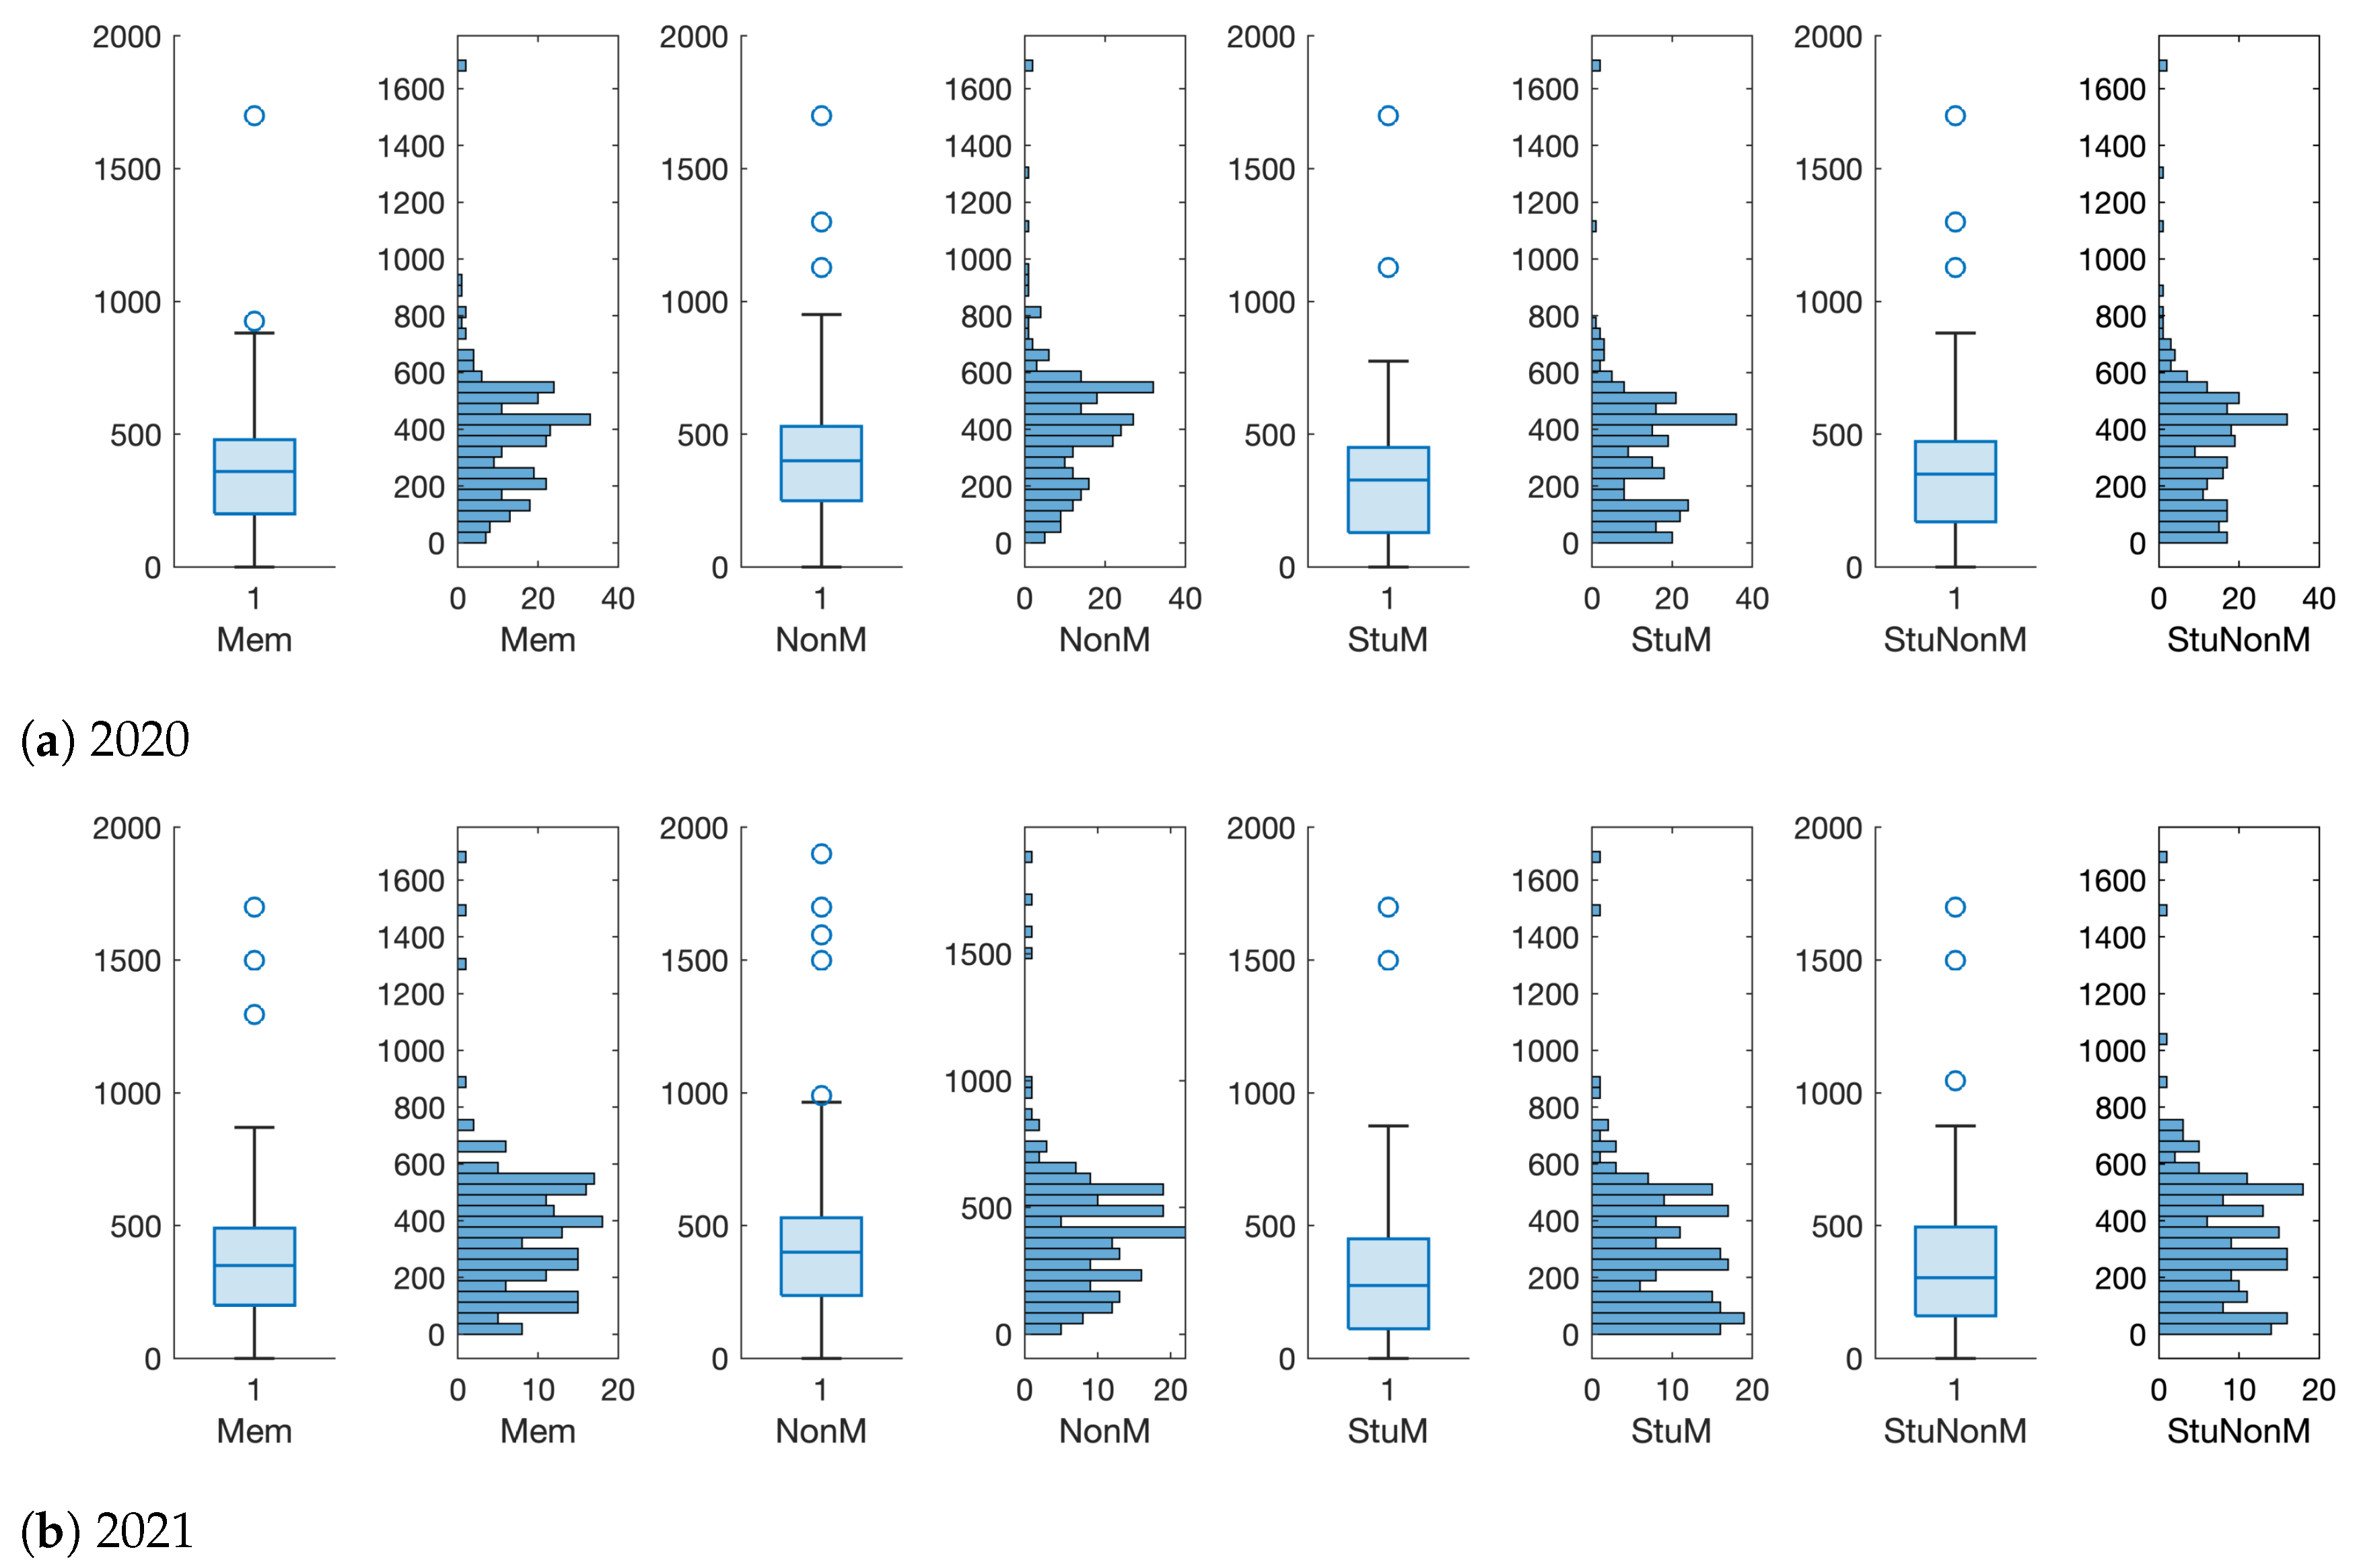
The distributions of the registration fees of members for the virtual conferences held in 2020 and 2021 were found to follow the normal distributions (
Figure 2A,B). For a given conference, if it has been turned into a virtual conference either in 2020 or 2021, then its registration fee was compared against that of the onsite one. The discounts of member fees for virtual conferences held in the top 10 countries and the 10 disciplines were derived. The detailed results are shown in
Figure A7 and
Figure A8 in
Appendix D.2. Surprisingly, we noticed that as compared to their predecessor onsite events, some virtual conferences increased the registration fees (discount > 0), while some of them did not make any discount (discount = 0,
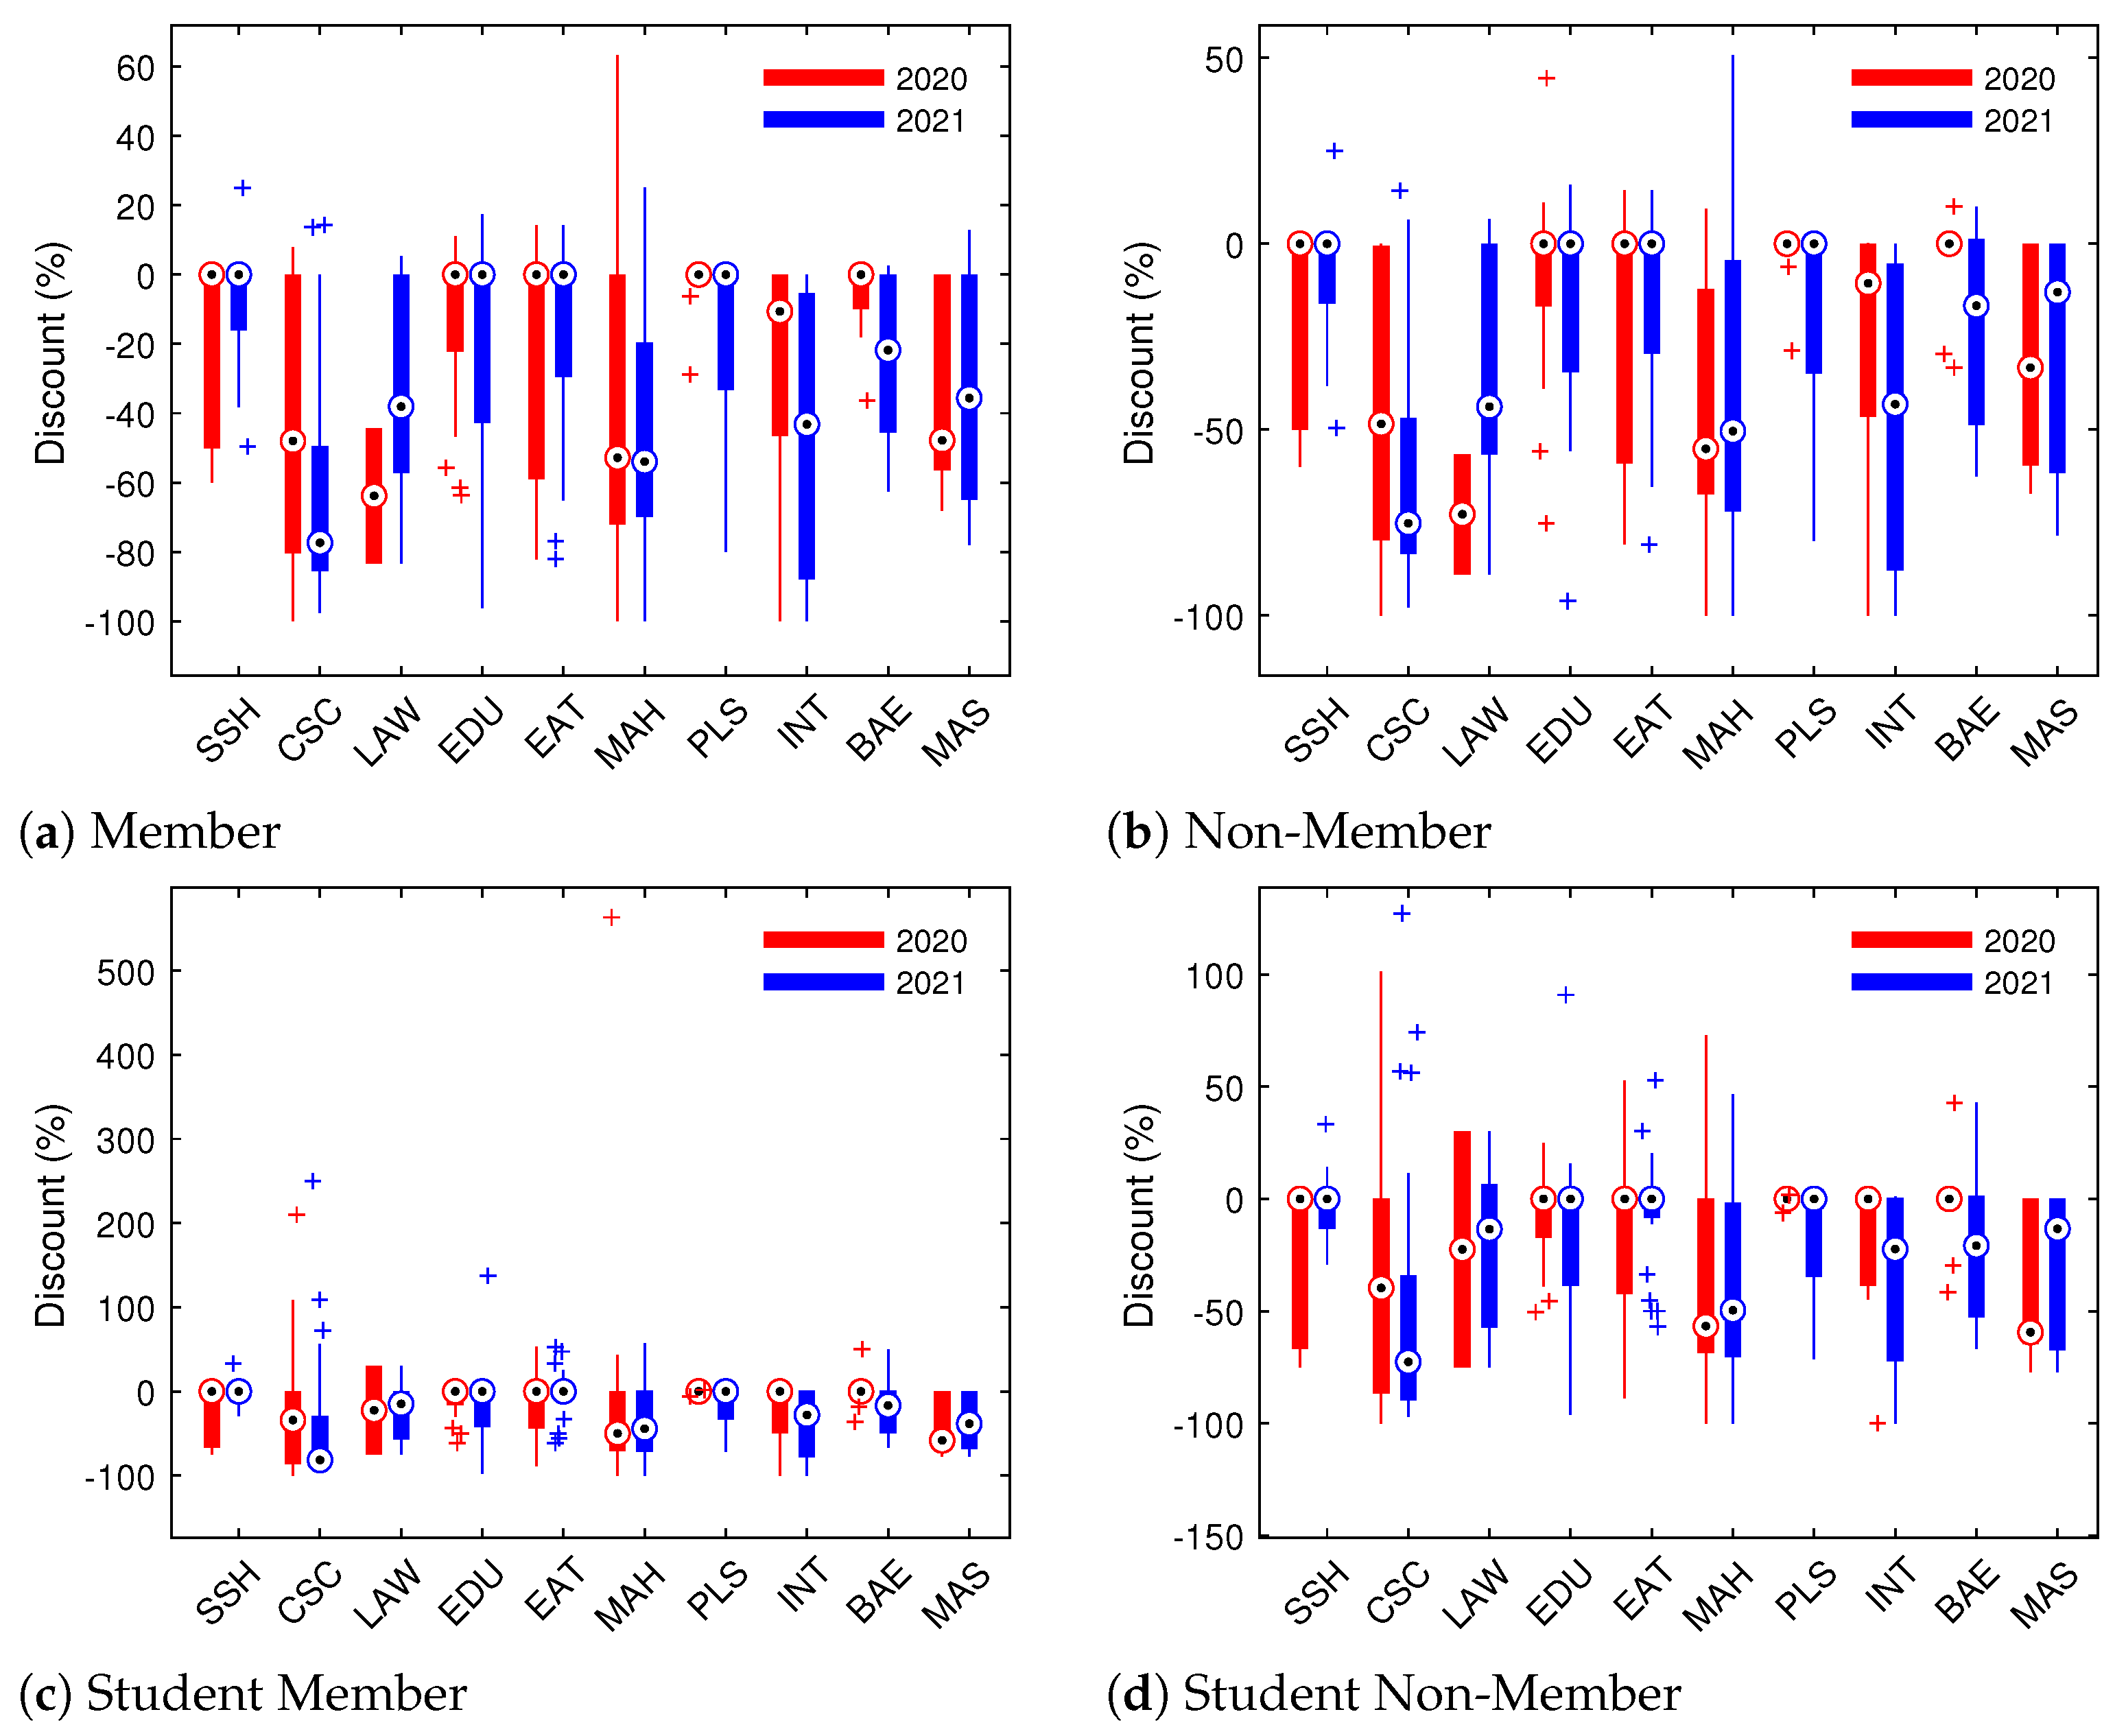
Figure 2C,D). On average, the discounts for the four types of registration fees were found to be −31.47%, −30.58%, −24.06%, and −26.45%, respectively.
4. Discussion
Given the length of time that may be required to continue practicing precaution measures in response to the COVID-19 pandemic, there will undoubtedly be far more deleterious impacts of the pandemic on academic research. Apart from the COVID-19 pandemic, other pandemics such as monkeypox also may hit academic conferences. Holding onsite conferences could be risky in the face of the pandemic. Therefore, orchestrating virtual academic conferences could be a common way for scientists to brainstorm research ideas, although there are increasing negative voices toward virtual conferences. There could be three major reasons that scientists do not support virtual conferences. First, as principal investigators of research funds, they cannot use the traveling budget. Second, they lose the chance for meeting and making friends as well as enjoying the leisure time in the conference venues. Third, they more or less feel themselves not to be part of a research community, as togetherness is gone due to the virtuality of the conferences. The last but not least is that not only scientists but also ordinary people just want to travel for the sake of their mental well-being.
Note that the pros and cons of academic virtual conferences are still in dispute. However, the COVID-19 pandemic should not be the only thing to blame for virtual conferences. Going virtual should be considered as an alternative for future academic conferences regardless of whether a pandemic is prevailing or not. Young scientists, especially students, could be the major attendees of academic conferences. Not all young scientists are lucky enough to receive financial support for conference registrations. Meanwhile, most, if not all, conferences require registrations as well as paper presentations, either orally or by the poster. For attendees who registered for the conferences but cannot travel to present their conference papers due to unexpected issues such as visa application rejection and flight cancellation, as stated on the websites of many conferences, the authors may have risk having their accepted papers rejected by the conference organization committees. For scientists who cannot attend conferences in person, they are appealing to virtual conferences. For scientists who have limited financial support, even though virtual conferences charge the same amount of money as onsite conferences do, they are still appealing as virtual conferences as travel and accommodation expenditures, can be avoided.
Considering the current situation of the COVID-19 pandemic, virtual conferences are still necessary in some places. However, the pandemic should not be the shield for conference organization committees to make money from the attendees. Academic conferences have existed for decades. The COVID-19 pandemic provides us an opportunity to contemplate the possible revisions to academic conferences. Here, we suggest the following major initiatives.
(1) Virtual conferences should always be an option in the future for conference attendees regardless of whether there is a pandemic or not. A mixed-mode can provide flexibilities both for attendees and the conference organization committees. Attendees can save both time and money if these issues are their concerns, while organization committees can exempt themselves from tedious and laborious efforts in conference logistics.
(2) Virtual conferences should charge much less than onsite conferences do. This initiative not only puts an end to any commercial purposes in the name of hosting academic conferences but also avoids unnecessary project budgets and expenditures. When conferences become less profitable, then conferences could come back more to their academic values.
(3) Details of the budgeting and disposition of conference registration fees should be open to the public. As attendees of a conference, it is their rights to know how the registration fee comes out. Meanwhile, how the money is utilized and how the surplus money is managed should also be open to the public.
(4) Multiple packages of conference registration fees should be considered for attendees to choose. Conferences at the present day set monotonous standards for the registration fees, and the committees never consider attendees’ will such as whether they are willing or not to take conference souvenirs such as pen drive, bags, etc., as they may already have an abundance of them.
Apart from the above propositions, there could be more innovative procedures pertaining to future conferences. Although some of the procedures may not be that easy to implement, we do hope that authorities can at least contemplate the future of academic conferences.
Author Contributions
Conceptualization, Q.C. and Z.D.; methodology, Q.C.; validation, Q.C., Z.D., Y.W. and X.X.; formal analysis, Q.C.; investigation, Q.C., Z.D., Y.W. and X.X.; resources, Q.C.; data curation, Q.C., Z.D., Y.W. and X.X.; writing—original draft preparation, Q.C.; writing—review and editing, Q.C.; visualization, Q.C.; supervision, Q.C., Z.D., Y.W. and X.X.; project administration, Q.C., Z.D., Y.W. and X.X.; funding acquisition, Y.W. and X.X. All authors have read and agreed to the published version of the manuscript.
Funding
This research was funded by the National Natural Science Foundation of China, grant numbers 61773091, 62173065, and 11875005.
Institutional Review Board Statement
Not applicable.
Informed Consent Statement
Not applicable.
Conflicts of Interest
The authors declare no conflict of interest.
Appendix A. Sources for Conference Retrieving
There are many public websites gathering information for academic conferences. In this work, we first refer to the conference list released by Tsinghua University, China, in 2020. This list collects names of conferences recognized by the Chinese academia. The conferences collected in the list are categorized by disciplines, and a total of 10 disciplines are considered in the list. Apart from the above-mentioned list, we also refer to several websites where conferences information can be retrieved.
Table A1 summarizes the resources with which we acquired the conferences that were considered in this work.
Table A1.
Resources for acquiring basic information of academic conferences.
Table A1.
Resources for acquiring basic information of academic conferences.
Conference names are gathered by referring to the multiple resources listed in
Table A1. After obtaining the names of the concerned conferences, we then organized manpower to search the Internet to go through the websites of the conferences and collect the basic information, especially the registration fee of the conferences.
Appendix B. Conference Information Collection and Preprocessing
Appendix B.1. Data Properties
The data entries that were used to collect the conference information are shown in
Table A2. The conferences investigated span through 10 disciplines which are summarized in
Table A3, while the conference venues (country) together with their country codes are recorded in
Table A4. Note that in this work, we are only interested in conferences that span through the calendar years of 2019, 2020 and 2021.
Table A2.
Data entries used to collect the conference information.
Table A2.
Data entries used to collect the conference information.
| Field | Definition |
|---|
| Year | The year in which the conference is held |
| Homepage | Homepage of the conference |
| FullName | Full name of the conference |
| Discipline | The discipline to which the conference belongs to |
| FeeMember | Registration fee for non-student with membership |
| FeeNonMember | Registration fee for non-student without membership |
| FeeStudentMember | Registration fee for student with membership |
| FeeNonStudentMember | Registration fee for student without membership |
| VirtualConf | A binary variable indicating a virtual (1) or an on-site (0) conference |
| VenueCity | The city in which the conference is held |
| VenueCountry | The country in which the conference is held |
| StartDate | The starting date of the conference |
| EndDate | The ending date of the conference |
Table A3.
The 10 disciplines that the conferences span through.
Table A3.
The 10 disciplines that the conferences span through.
| Number | Abbreviation | Discipline |
|---|
| 1 | BAE | Business and Economics |
| 2 | CSC | Computer Science |
| 3 | EDU | Education |
| 4 | EAT | Engineering and Technology |
| 5 | INT | Interdisciplinary |
| 6 | LAW | Law |
| 7 | MAS | Mathematics and Statistics |
| 8 | MAH | Medicine and Health |
| 9 | PLS | Physical and Life Sciences |
| 10 | SSH | Social Sciences and Humanities |
Table A4.
The codes of the countries in which the conferences are held.
Table A4.
The codes of the countries in which the conferences are held.
| Code | Country | Code | Country | Code | Country |
|---|
| CHN | China | CZE | Czech Republic | ISR | Israel |
| USA | USA | SGP | Singapore | HRV | The Republic of Croatia |
| JPN | Japan | MDV | Republic of Maldives | EGY | Egypt |
| THA | Thailand | IND | India | PER | Peru |
| GBR | UK | NZL | New Zealand | UKR | Ukraine |
| ESP | Spain | AUT | Austria | BGD | Bangladesh |
| ARE | UAE | CHE | Switzerland | SVN | Slovenia |
| AUS | Australia | VNM | Vietnam | ETH | Ethiopia |
| GRC | Greece | SWE | Sweden | ARG | Argentina |
| CAN | Canada | BIH | Bosnia and Herzegovina | BRA | Brazil |
| KOR | South Korea | IRL | Ireland | IRN | Iran |
| DEU | Germany | BEL | Belgium | SCO | Scotland |
| MYS | Malaysia | HUN | Hungary | ALB | Albania |
| FRA | France | DNK | Denmark | FIN | Finland |
| ITA | Italy | LKA | Sri Lanka | MKD | Macedonia |
| TUR | Turkey | ZAF | South Africa | PSE | Palestinian Territory |
| IDN | Indonesia | SRB | Serbia | MUS | Mauritius |
| NLD | Netherlands | POL | Poland | LTU | Lithuania |
| PRT | Portugal | DMA | Dominican | RUS | Russia |
| MEX | Mexico | | | | |
Appendix B.2. Notes for Fee Information Collection
Note 1: The classification or discipline of the conferences is based on the conference list released by Tsinghua University.
Note 2: All the fees are measured in US dollars. If a fee of a conference is given in another currency unit, then it is converted into USD using the Xe Currency Converter based on the exchange rate of the day the conference data are collected. We hypothesize that the economic inflation is not significant over the past three years.
Note 3: In case a conference organization does not release membership, then the four types of fees are taken as the fees for the ordinary attendees.
Note 4: For some conferences, they do not distinguish student and non-student attendees. Therefore, the student registration fees are set to be the same as the fees for non-students.
Note 5: For some conferences, due to the lockdown or border control, they undergo a mixed mode of the conferences, i.e., they hold onsite and online conferences simultaneously. As a consequence, they set two fees, i.e., fees for onsite conferences and fees for virtual conferences. In this case, only the registration fees for virtual conferences are collected.
Appendix B.3. Data Preprocessing
After acquiring the original data, we obtain the basic information for 1255 conferences. We noticed several issues with the original data. First, for some conferences, the venues cannot be retrieved from the Internet. Second, some conferences removed the official websites for past events, and consequently, the corresponding registration fees are unknown. With regard to this, data preprocessing was adopted. Specifically, the following procedures were implemented.
For conferences whose venues are missing, we move those records. For conferences whose registration fee information is missing, we set up the following fee imputation mechanism.
If a conference is held only once over the three years, then the record of the conference is removed. If a conference is held twice over the three years, then the following situations are considered. (1) If both of them are missing the registration fee information, then they are removed. (2) If only one of them is missing the fee information, then if both of them are onsite or virtual conferences, then the missing information is set to be the same as that of the conference with fee information; otherwise, the conference without fee information is removed.
If a conference is held thrice over the three years, then the following situations are considered. (1) If all of them are missing the fee information, then they are removed. (2) If one of them is missing the information, then its fee information is set to be the same as that of its past event which has the same nature (both are virtual or on-site) of the focal conference; otherwise, its record is removed. (3) If two of them are missing the information, then we do the same as that of situation 2.
Appendix B.4. Basic Data Statistics
After the data preprocessing process, 1174 conference records remained and were used for subsequent analysis.
Table A5 gives a basic summarization of the cleaned data. The number of conferences with respect to the countries and disciplines are presented in
Figure A1 and
Figure A2.
Table A5.
Basic statistics of the conference data after data preprocessing.
Table A5.
Basic statistics of the conference data after data preprocessing.
| Fee Type | All | 2019 | 2020 | 2021 |
|---|
| Onsite | All | Virtual | Onsite | All | Virtual | Onsite |
| #Conference | 1174 | 331 | 434 | 274 | 160 | 409 | 202 | 207 |
| #Country | 58 | 36 | 50 | 48 | 24 | 42 | 40 | 27 |
| 1699 | 1699 | 1699 | 1699 | 875 | 1699 | 1699 | 1649 |
| 1913.6 | 1913.6 | 1699 | 1699 | 1525 | 1900 | 1900 | 1649 |
| 1699 | 1699 | 1699 | 1699 | 651 | 1699 | 1699 | 1649 |
| 1699 | 1699 | 1699 | 1699 | 1525 | 1699 | 1699 | 1649 |
| 0 | 85 | 0 | 0 | 36 | 0 | 0 | 100 |
| 0 | 125 | 0 | 0 | 36 | 0 | 0 | 122 |
| 0 | 49 | 0 | 0 | 36 | 0 | 0 | 100 |
| 0 | 70 | 0 | 0 | 36 | 0 | 0 | 100 |
| 444.9 | 535.7 | 399.6 | 361.5 | 465.0 | 419.3 | 353.3 | 483.7 |
| 485.2 | 584.2 | 435.8 | 400.6 | 496.0 | 457.6 | 403.6 | 510.4 |
| 375.7 | 416.8 | 353.5 | 319.1 | 412.4 | 366.1 | 300.7 | 429.9 |
| 402.5 | 450.1 | 375.3 | 341.8 | 432.6 | 392.9 | 336.3 | 448.2 |
| 209.7 | 217.6 | 191.8 | 212.3 | 126.3 | 198.9 | 228.4 | 137.7 |
| 240.0 | 262.1 | 208.2 | 226.4 | 155.8 | 229.6 | 268.9 | 168.0 |
| 201.0 | 188.1 | 201.2 | 224.1 | 135.9 | 206.4 | 231.6 | 154.0 |
| 212.3 | 193.1 | 213.4 | 232.3 | 161.4 | 219.9 | 237.8 | 185.4 |
Figure A1.
Number of conferences held by each country. (a) Ranking of the countries by the number of conferences they held over the three years. (b–d) Number of virtual and onsite conferences held by each country in 2019, 2020 and 2021, respectively.
Figure A1.
Number of conferences held by each country. (a) Ranking of the countries by the number of conferences they held over the three years. (b–d) Number of virtual and onsite conferences held by each country in 2019, 2020 and 2021, respectively.
Figure A2.
Number of conferences belonging to each discipline. (a) Ranking of the disciplines by the number of conferences they covered over the three years. (b–d) Number of virtual and onsite conferences covered by each discipline in 2019, 2020 and 2021, respectively.
Figure A2.
Number of conferences belonging to each discipline. (a) Ranking of the disciplines by the number of conferences they covered over the three years. (b–d) Number of virtual and onsite conferences covered by each discipline in 2019, 2020 and 2021, respectively.
Appendix C. Distributions of Registration Fees
Appendix C.1. Overall Fee Distributions by Year
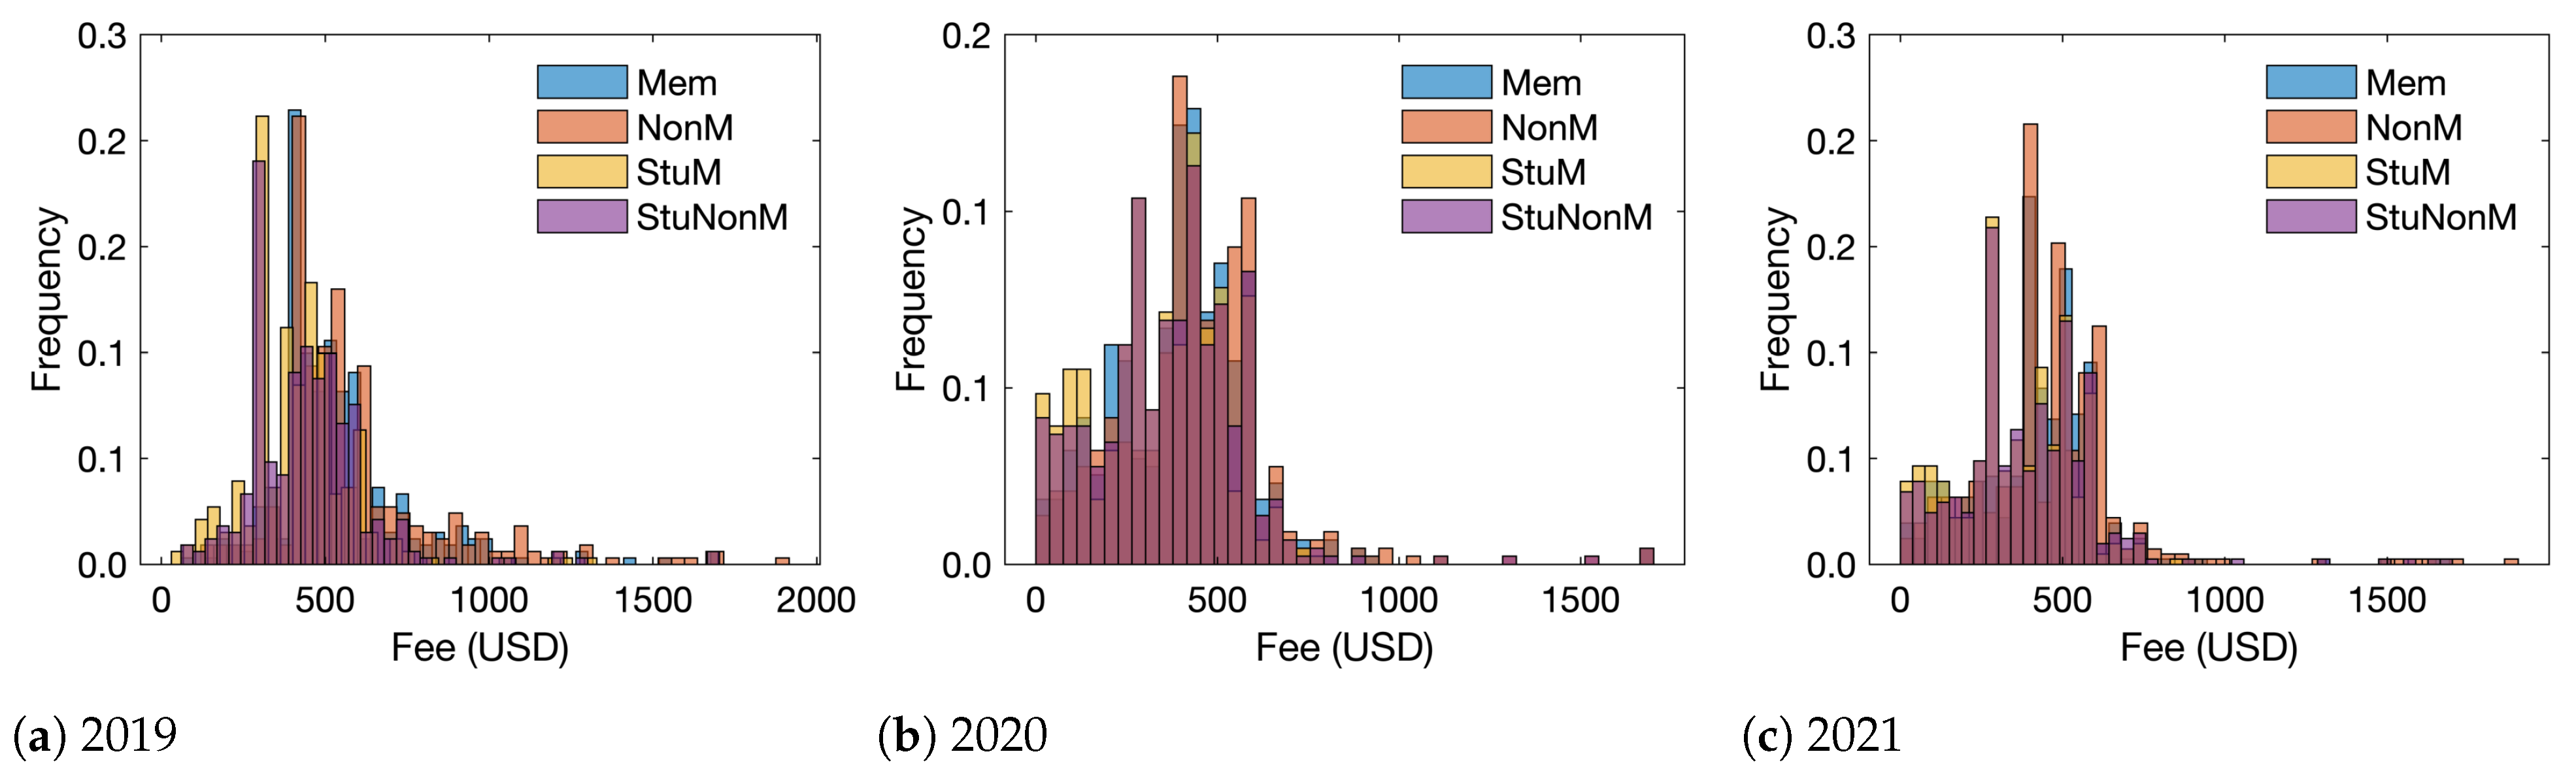
The histograms of the registration fees of members (Mem), non-members (NonM), student members (StuM), and student non-members (StuNonM) for conferences, respectively, held in 2019, 2020 and 2021 are visualized in
Figure A3.
Figure A3.
Histograms of the conference registration fees. The number of bins is set to be 45. (a) Histograms of the four types of registration fees for conferences held in 2019. (b) Histograms of the four types of registration fees for conferences held in 2020. (c) Histograms of the four types of registration fees for conferences held in 2021.
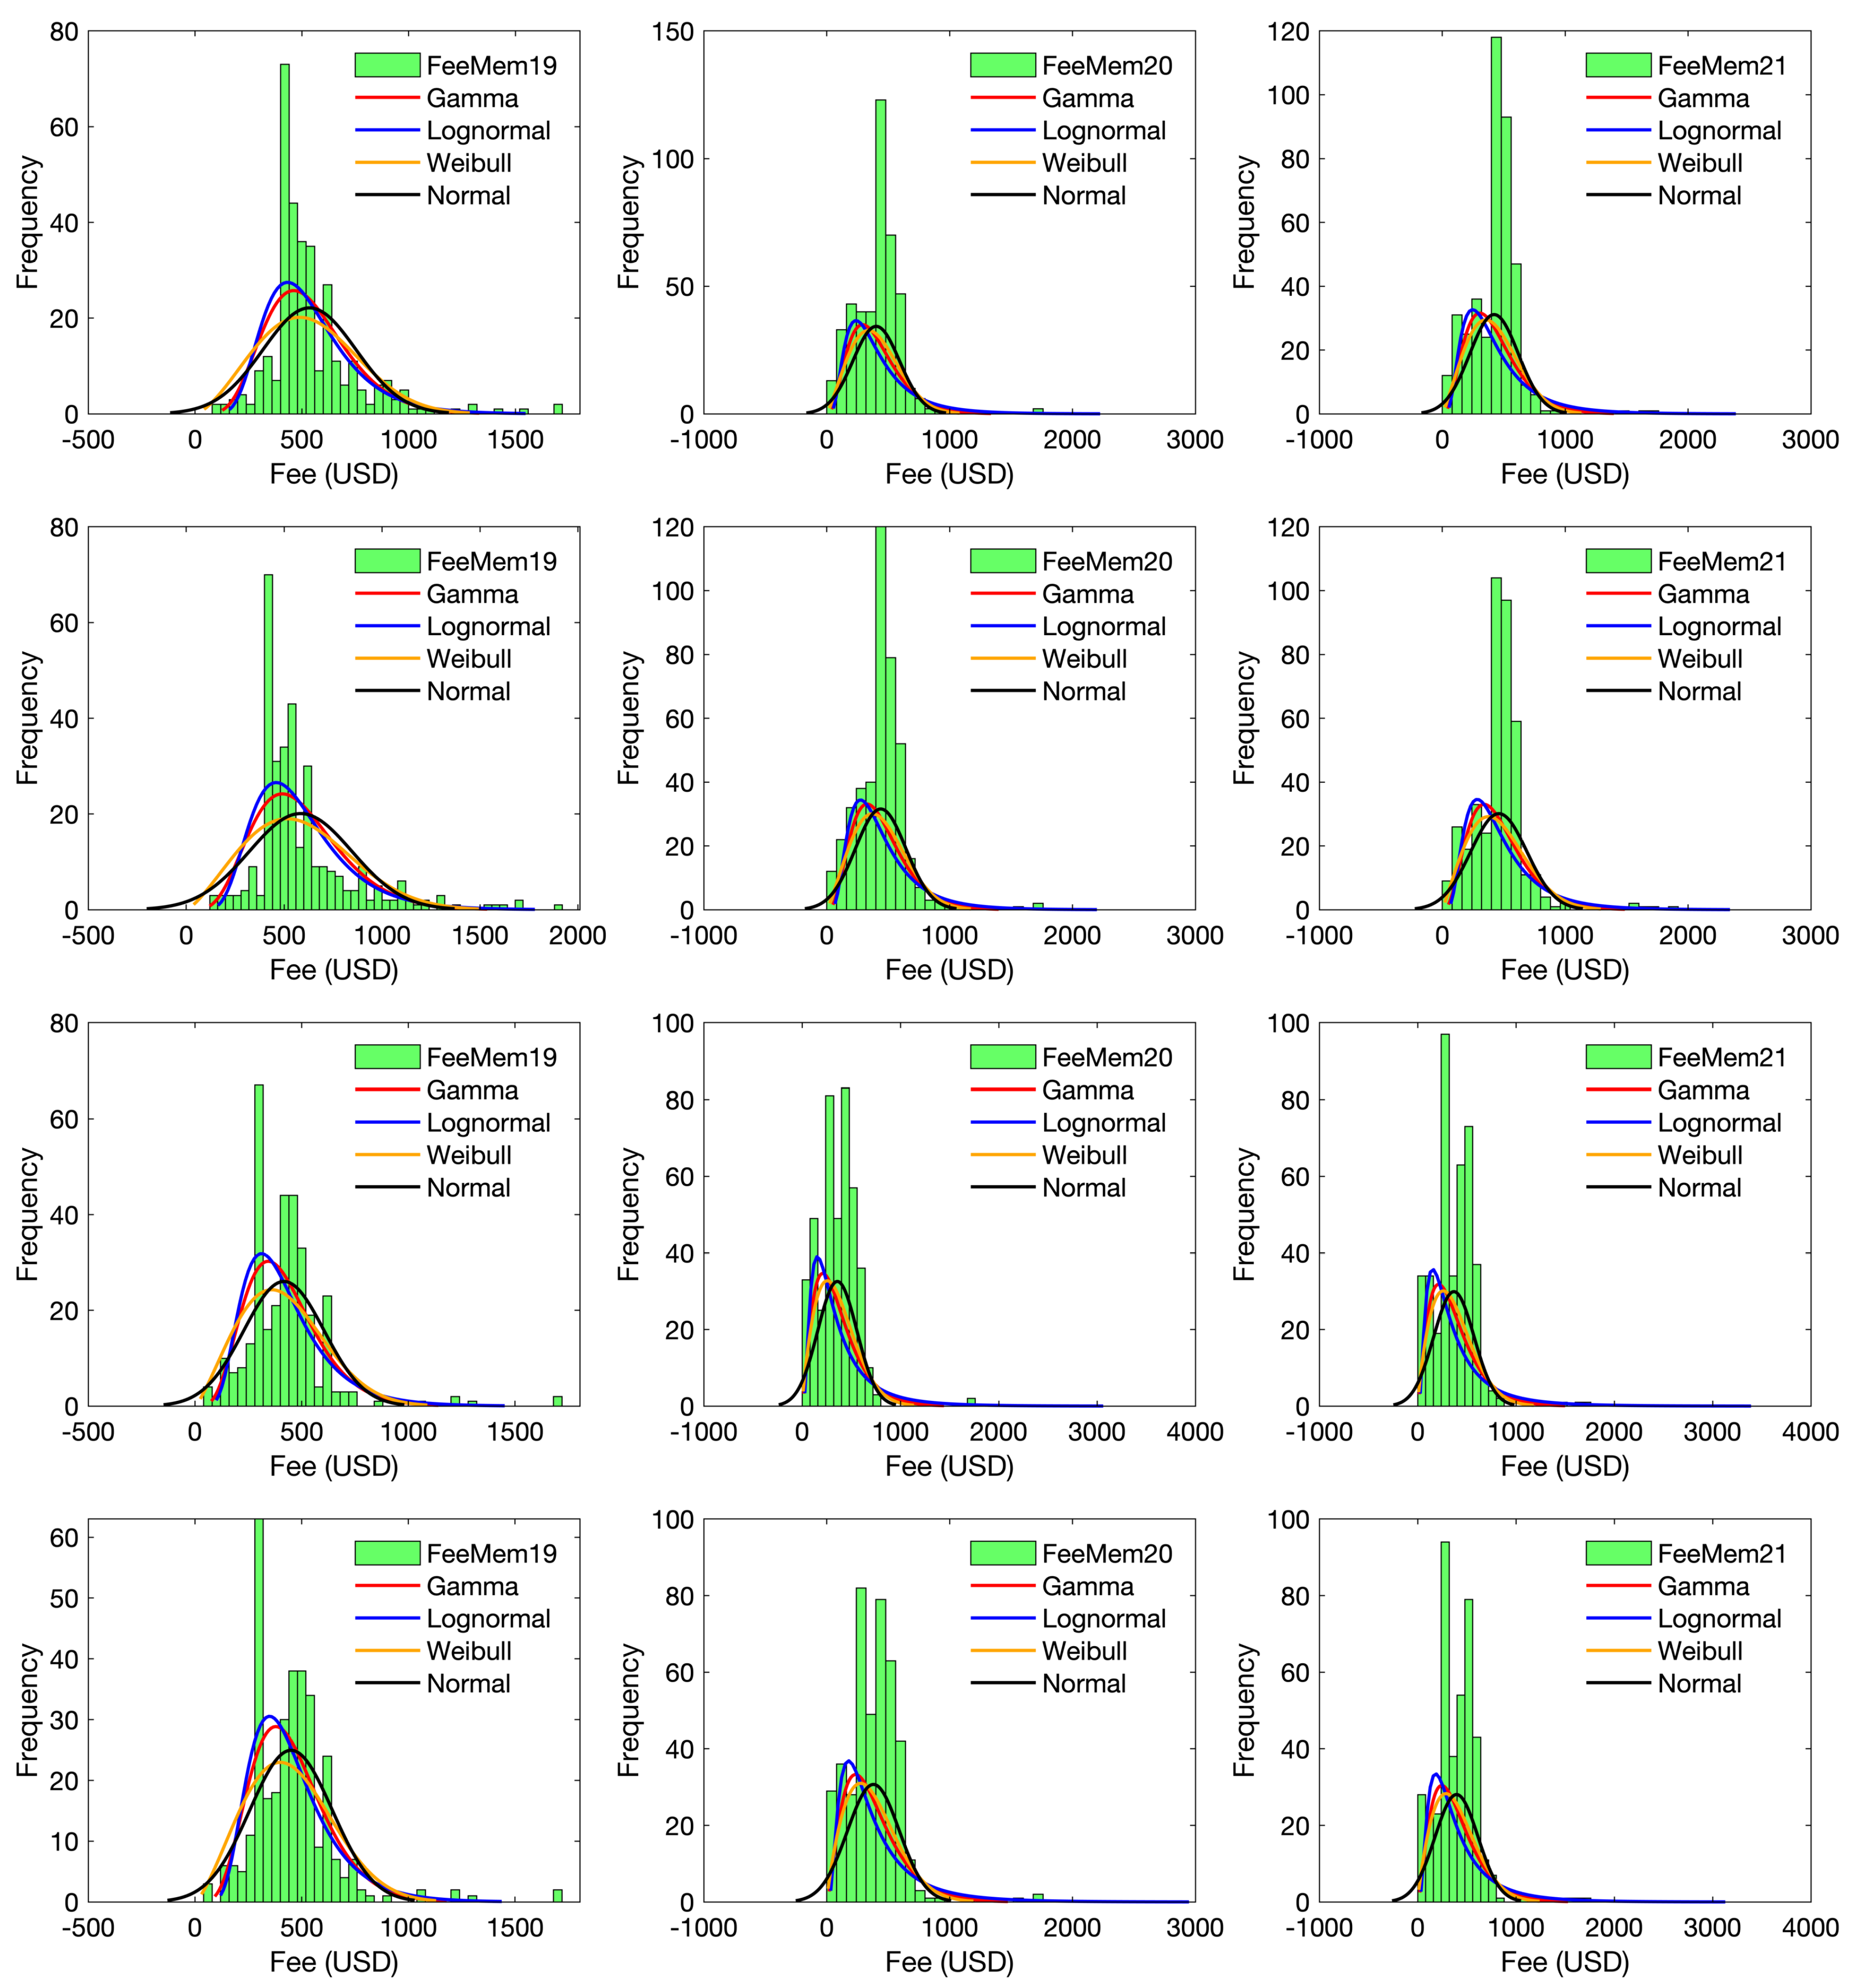
Appendix C.2. Curve Fittings of Fee Distributions by Year
The histograms of each type of the registration fees for conferences respectively held in 2019, 2020 and 2021, and together with the curve fitting results are visualized in
Figure A4.
Figure A4.
Histograms and curve fittings for the distributions of the four types of registration fees of conferences held in each year. The number of bins is set to be 45.
Figure A4.
Histograms and curve fittings for the distributions of the four types of registration fees of conferences held in each year. The number of bins is set to be 45.
For the curve fittings, the following four probability distribution functions are used.
The parameters for the fitted probability distribution functions are summarized in
Table A6.
Table A6.
Parameters for the fitted probability distribution functions. R2 is the r-square metric.
Table A6.
Parameters for the fitted probability distribution functions. R2 is the r-square metric.
| | Gamma | LogNormal | Weibull | Normal |
|---|
| 2019 Mem | | | | |
| b = 73.7431 | | | |
| R2 = 0.5939 | R2 = 0.6103 | R2 = 0.4936 | R2 = 0.4994 |
| 2019 NonM | | | | |
| | | |
| R2 = 0.5380 | R2 = 0.5726 | R2 = 0.4367 | R2 = 0.4191 |
| 2019 StuM | | | | |
| | | |
| R2 = 0.6154 | R2 = 0.5770 | R2 = 0.5727 | R2 = 0.6062 |
| 2019 StuNonM | | | | |
| | | |
| R2 = 0.6727 | R2 = 0.6583 | R2 = 0.6251 | R2 = 0.6433 |
| 2020 Mem | | | | |
| | | |
| R2 = 0.6192 | R2 = 0.4989 | R2 = 0.7049 | R2 = 0.7803 |
| 2020 NonM | | | | |
| | | |
| R2 = 0.6164 | R2 = 0.4944 | R2 = 0.6778 | R2 = 0.7506 |
| 2020 StuMem | | | | |
| | | |
| R2 = 0.5831 | R2 = 0.4402 | R2 = 0.6651 | R2 = 0.7573 |
| 2020 StuNonM | | | | |
| | | |
| R2 = 0.6409 | R2 = 0.4828 | R2 = 0.7203 | R2 = 0.8104 |
| 2021 Mem | | | | |
| | | |
| R2 = 0.4758 | R2 = 0.3563 | R2 = 0.5561 | R2 = 0.6452 |
| 2021 NonM | | | | |
| | | |
| R2 = 0.4606 | R2 = 0.3678 | R2 = 0.4917 | R2 = 0.5499 |
| 2021 StuMem | | | | |
| | | |
| R2 = 0.4784 | R2 = 0.3446 | R2 = 0.5473 | R2 = 0.6232 |
| 2021 StuNonM | | | | |
| | | |
| R2 = 0.5254 | R2 = 0.3882 | R2 = 0.5832 | R2 = 0.6462 |
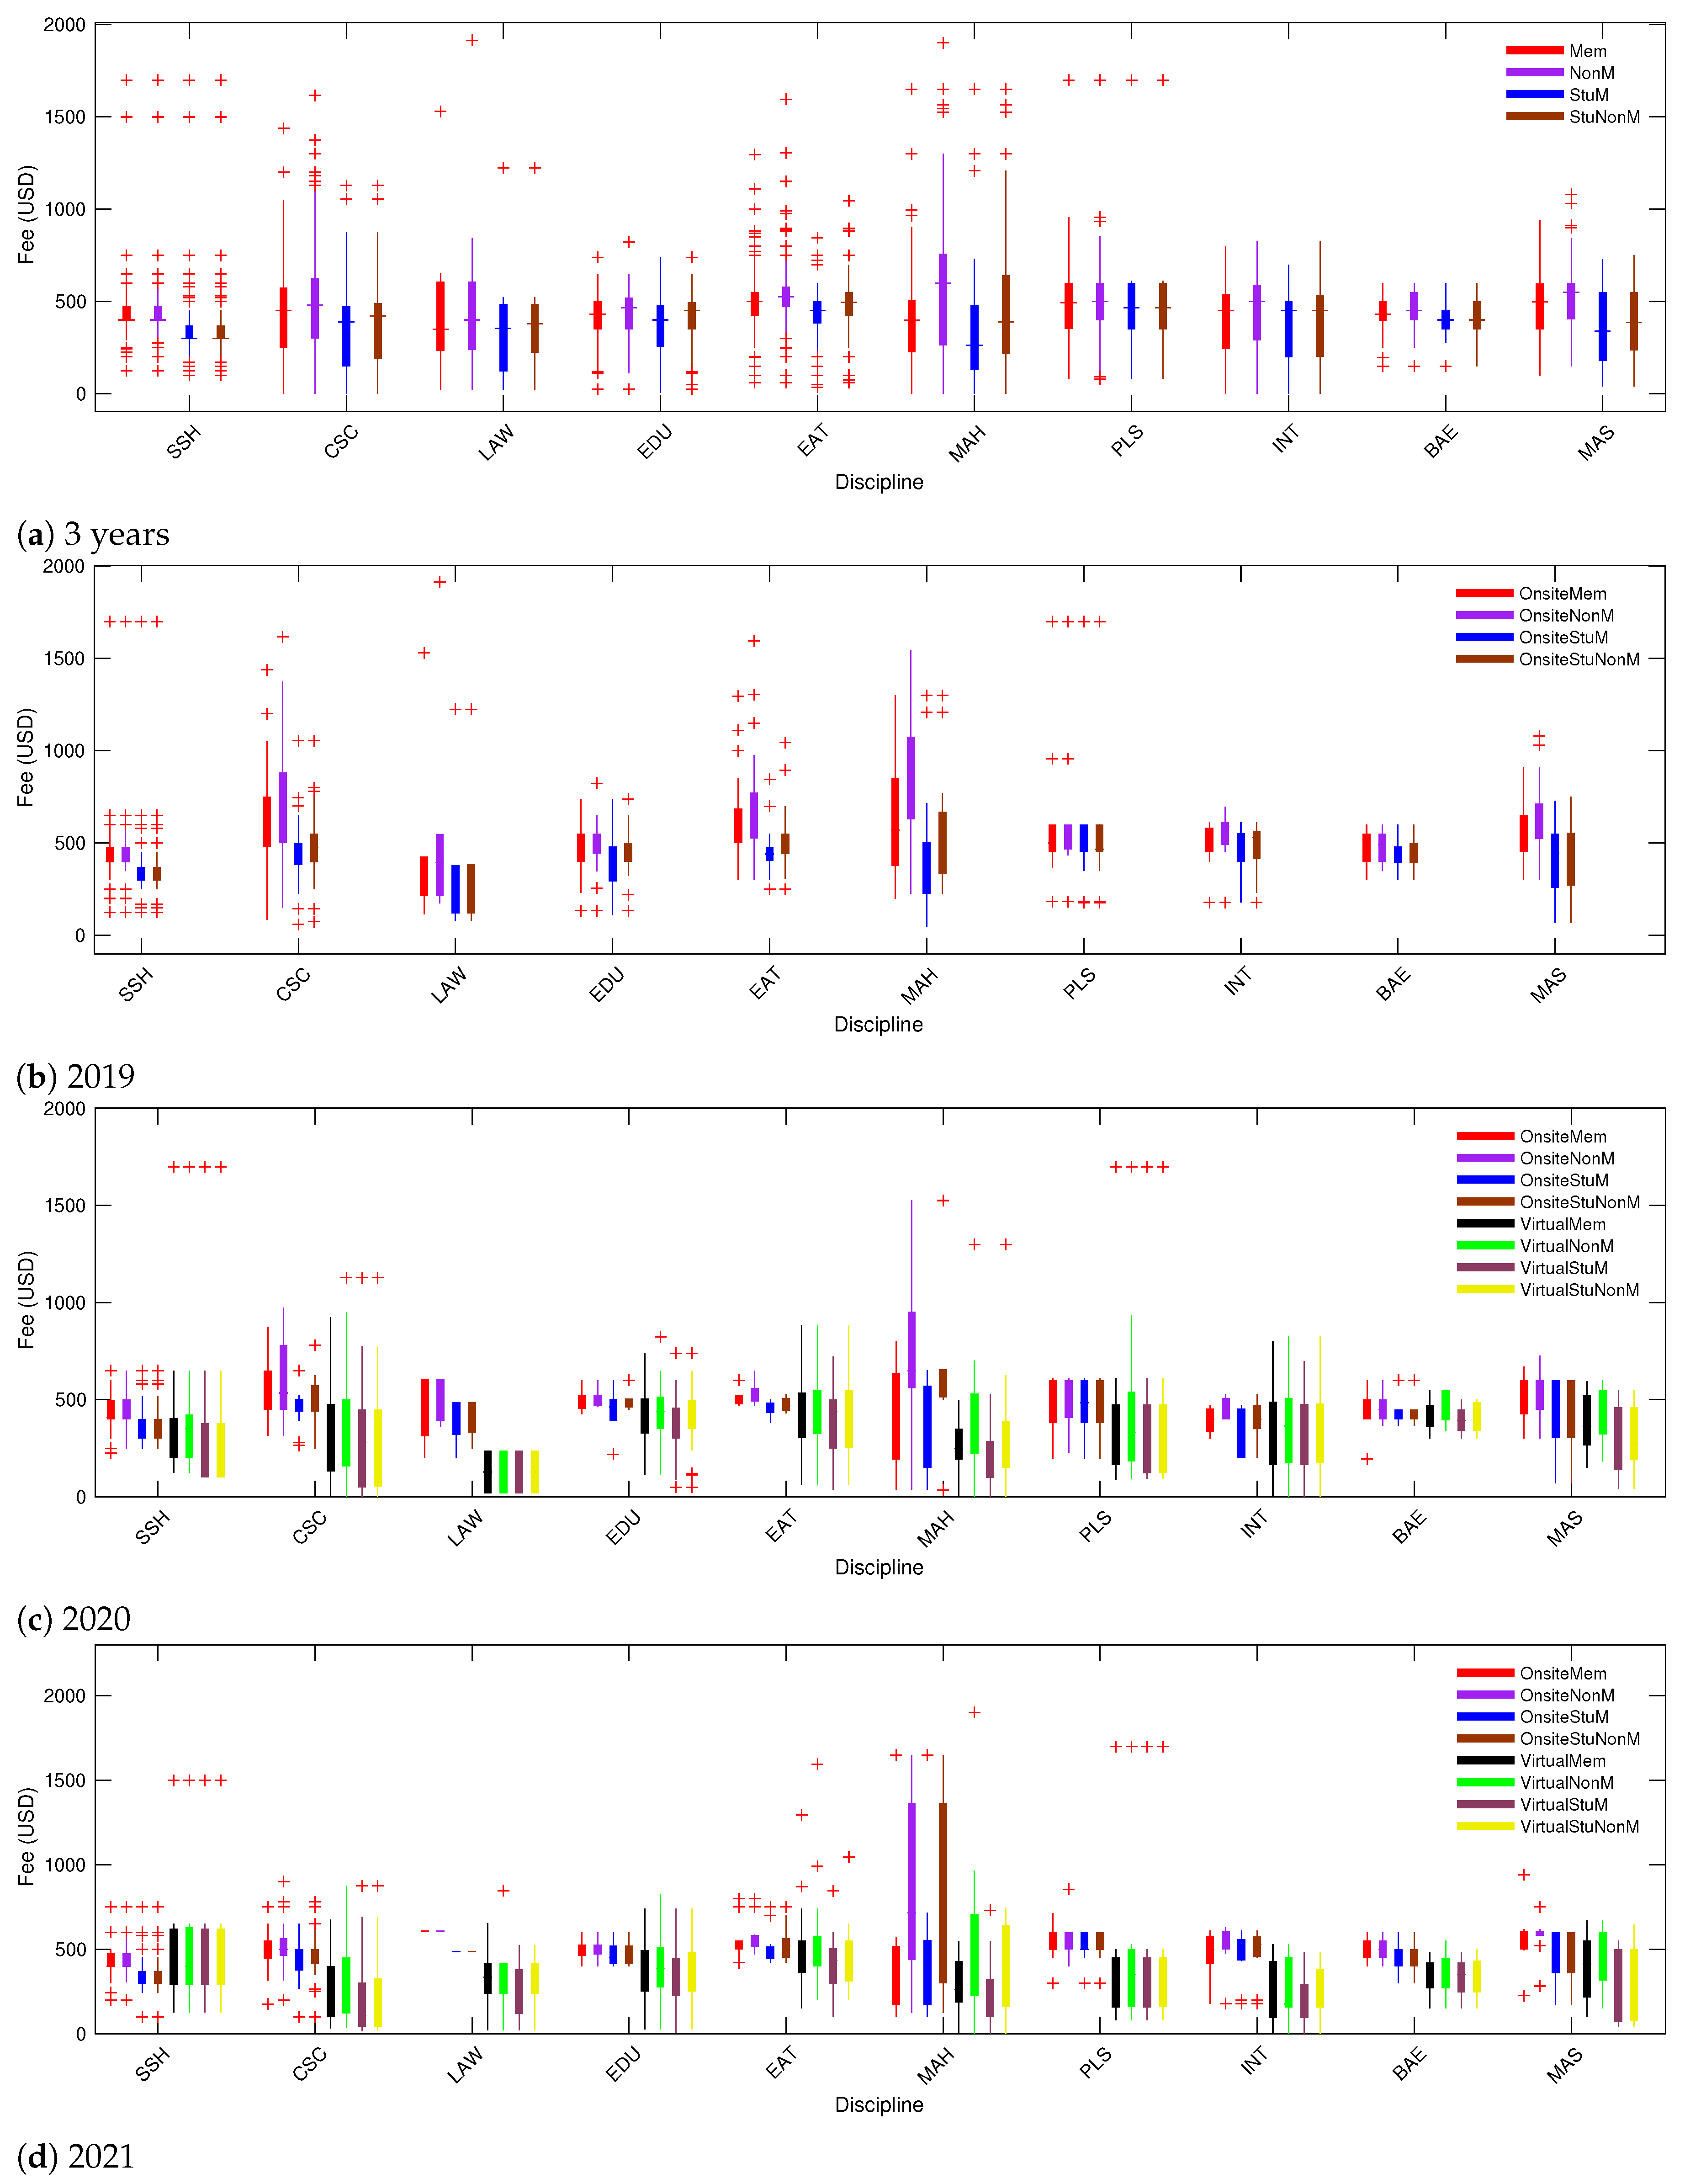
Appendix C.3. Fee Distribution by Discipline
The boxplots of the four types of registration fees for conferences with respect to the disciplines to which they belong are presented in
Figure A5. In
Figure A5, fees for onsite and virtual conferences are compared.
Figure A5.
Boxplot of conference registration fees by disciplines. (a) Distribution for the three years. (b–d) Distribution for 2019, 2020, 2021, respectively.
Figure A5.
Boxplot of conference registration fees by disciplines. (a) Distribution for the three years. (b–d) Distribution for 2019, 2020, 2021, respectively.
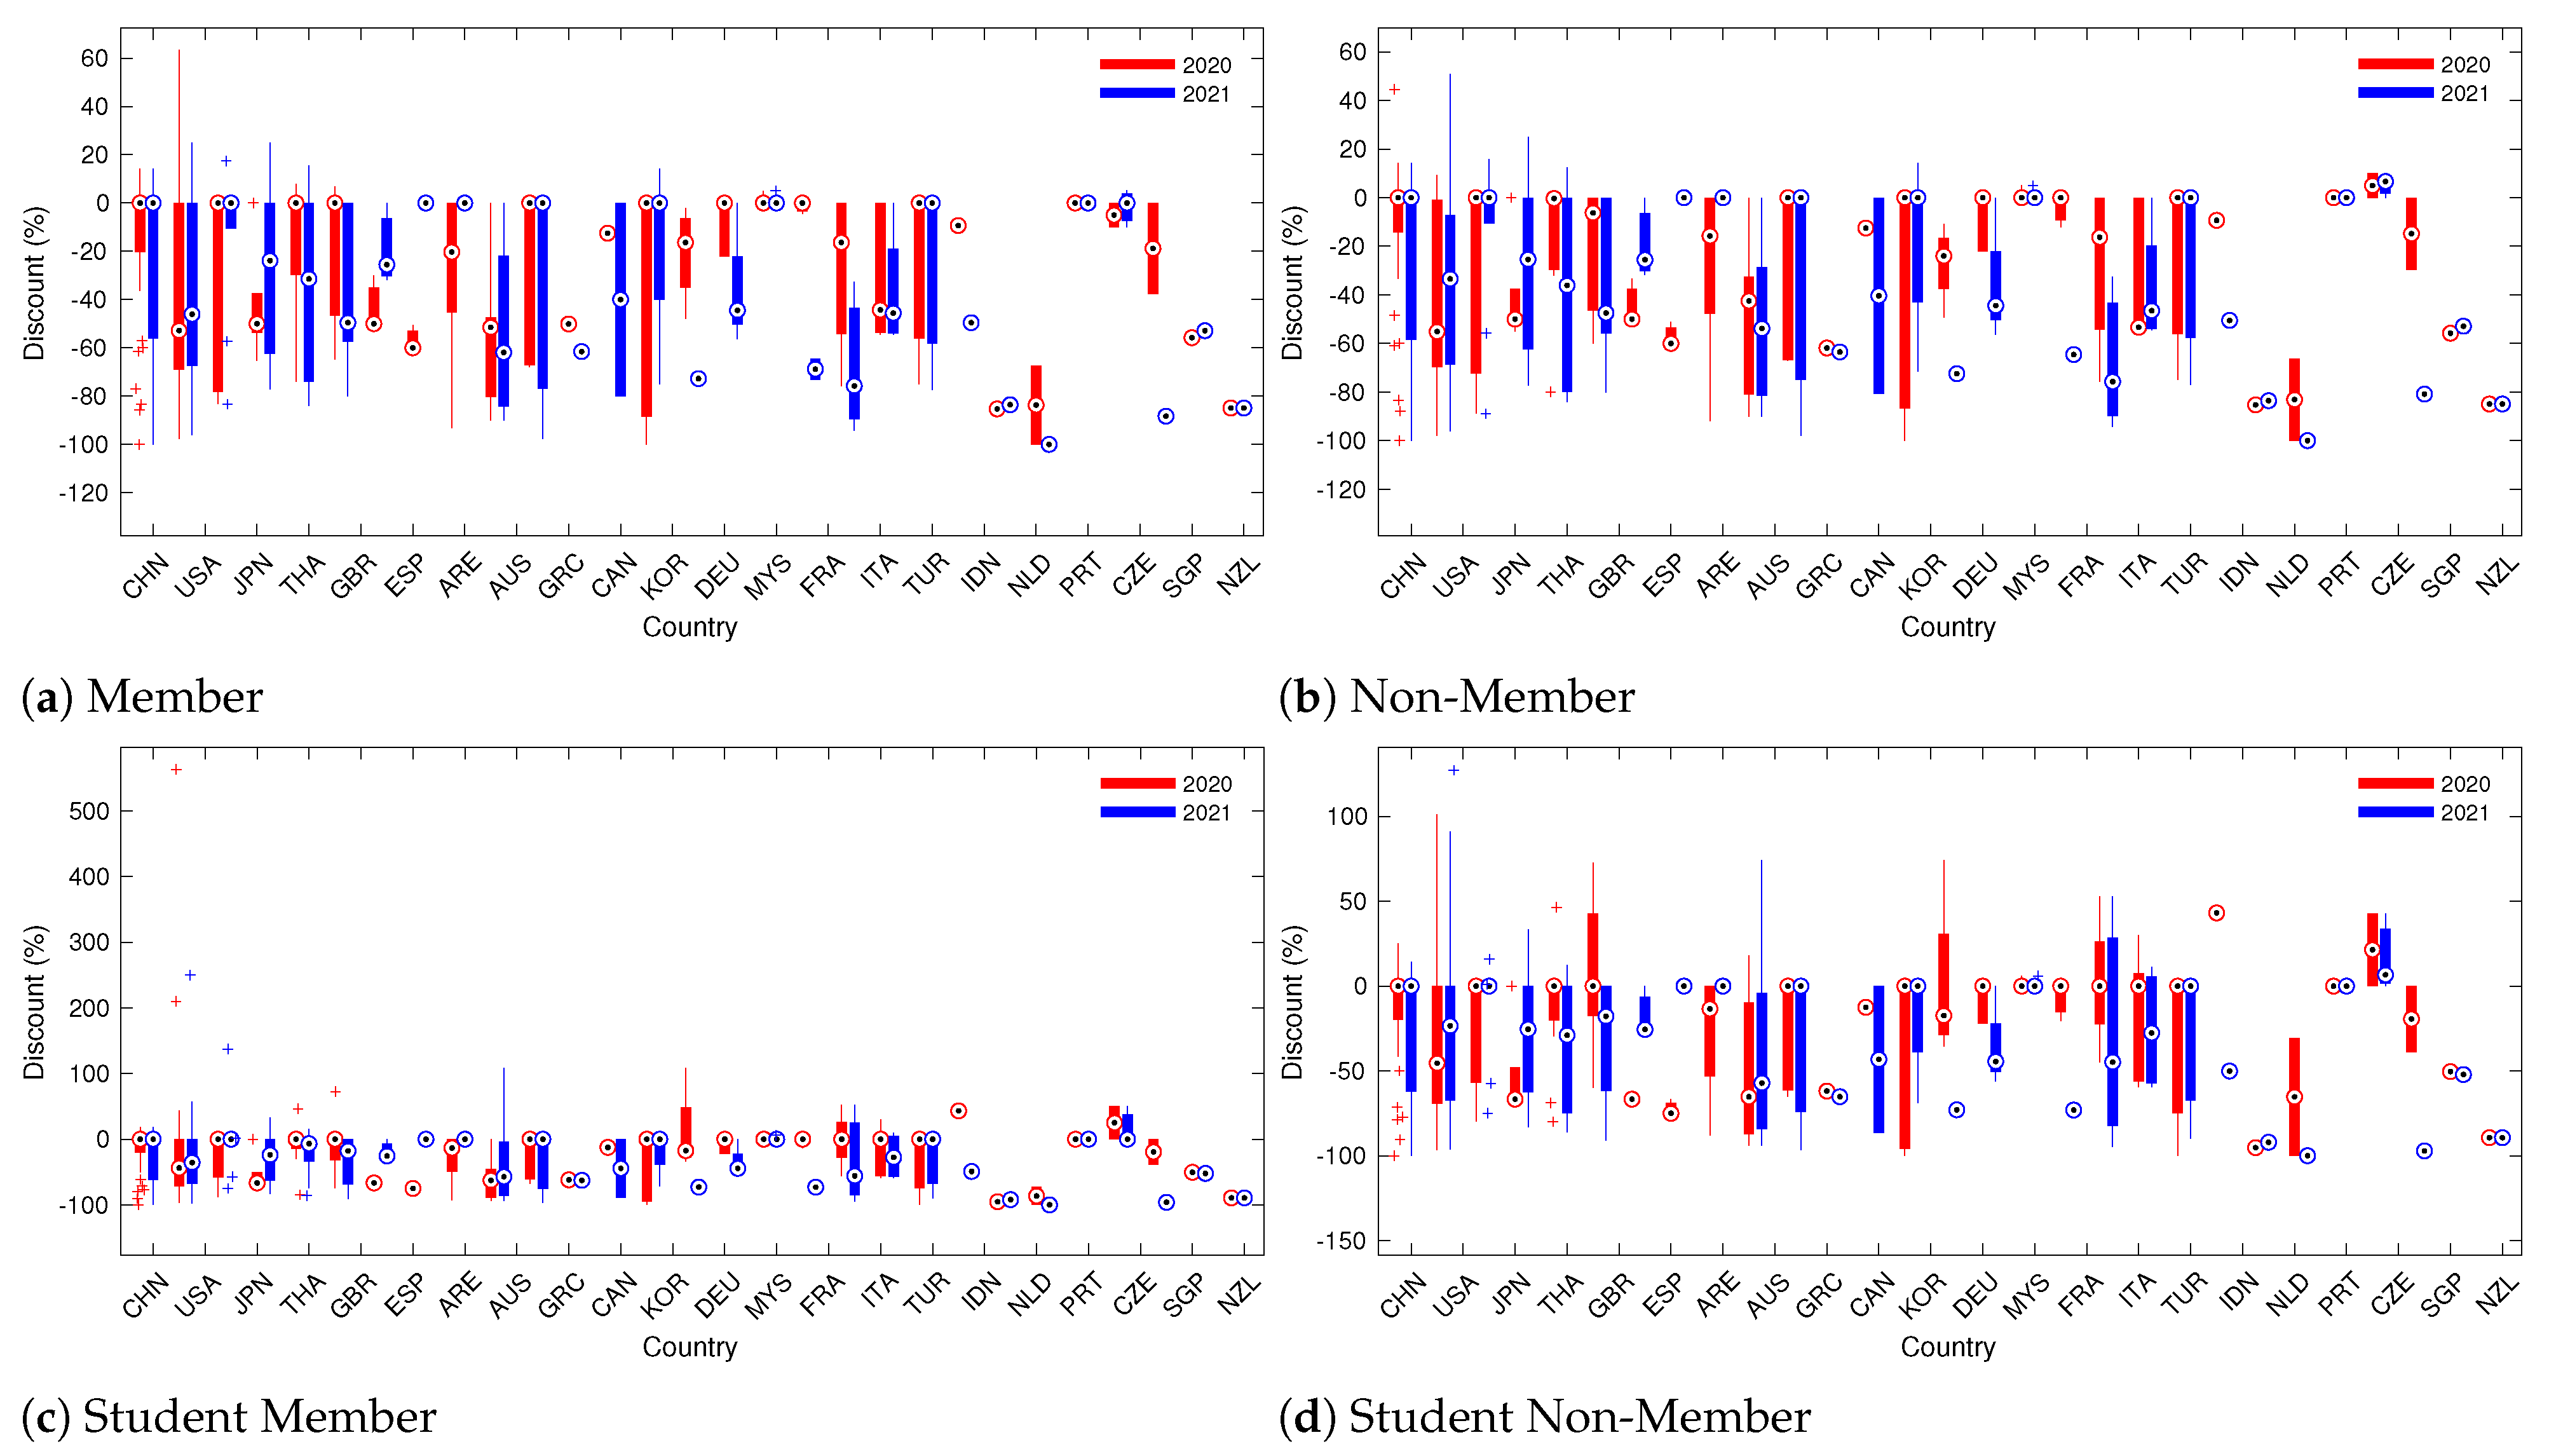
Appendix D. Registration Fees of Virtual Conferences
Appendix D.1. Distribution of Registration Fee of Virtual Conferences
The distributions of the four types of registration fees of virtual conferences held in 2020 and 2021 are shown in
Figure A6.
Figure A6.
Distributions of the four types of registration fees of virtual conferences held in (a) 2020 and (b) 2021.
Figure A6.
Distributions of the four types of registration fees of virtual conferences held in (a) 2020 and (b) 2021.
Appendix D.2. Distributions of Registration Fee Discounts
The fee discount rates are further calculated. For a specific conference, the fee discount rate is generally calculated as (FeeVirtual − FeeOnsite)/FeeOnsite ∗ 100%.
Figure A7 and
Figure A8, respectively, demonstrate the boxplot of the discount rates for the virtual conferences with respect to the countries and disciplines.
Figure A7.
Distributions of the discount rates of registration fees of virtual conferences held in 2020 and 2021 with respect to the countries.
Figure A7.
Distributions of the discount rates of registration fees of virtual conferences held in 2020 and 2021 with respect to the countries.
Figure A8.
Distributions of the discount rates of registration fees of virtual conferences held in 2020 and 2021 with respect to the disciplines.
Figure A8.
Distributions of the discount rates of registration fees of virtual conferences held in 2020 and 2021 with respect to the disciplines.
References
- Naidoo, R.; Fisher, B. Reset sustainable development goals for a pandemic world. Nature 2020, 583, 198–201. [Google Scholar] [CrossRef] [PubMed]
- Remuzzi, A.; Remuzzi, G. COVID-19 and Italy: What next? Lancet 2020, 395, 1225–1228. [Google Scholar] [CrossRef]
- Hartley, D.M.; Perencevich, E.N. Public health interventions for COVID-19: Emerging evidence and implications for an evolving public health crisis. JAMA 2020, 323, 1908–1909. [Google Scholar] [CrossRef]
- Karatayev, V.A.; Anand, M.; Bauch, C.T. Local lockdowns outperform global lockdown on the far side of the COVID-19 epidemic curve. Proc. Natl. Acad. Sci. USA 2020, 117, 24575–24580. [Google Scholar] [CrossRef]
- Fisher, D.; Teo, Y.Y.; Nabarro, D. Assessing national performance in response to COVID-19. Lancet 2020, 396, 653–655. [Google Scholar] [CrossRef]
- Pokhrel, S.; Chhetri, R. A literature review on impact of COVID-19 pandemic on teaching and learning. High. Educ. Future 2021, 8, 133–141. [Google Scholar] [CrossRef]
- Carr, R.M.; Lane-Fall, M.B.; South, E.; Brady, D.; Momplaisir, F.; Guerra, C.E.; Montoya-Williams, D.; Dalembert, G.; Lavizzo-Mourey, R.; Hamilton, R. Academic careers and the COVID-19 pandemic: Reversing the tide. Sci. Transl. Med. 2021, 13, eabe7189. [Google Scholar] [CrossRef]
- Viglione, G. A year without conferences? How the coronavirus pandemic could change research. Nature 2020, 579, 327–329. [Google Scholar] [CrossRef]
- Corbera, E.; Anguelovski, I.; Honey-Rosés, J.; Ruiz-Mallén, I. Academia in the Time of COVID-19: Towards an Ethics of Care. Plan. Theory Pract. 2020, 21, 191–199. [Google Scholar] [CrossRef]
- Lessing, J.N.; Anderson, L.R.; Mark, N.M.; Maggio, L.A.; Durning, S.J. Academics in absentia: An opportunity to rethink conferences in the age of coronavirus cancellations. Acad. Med. 2020, 95, 1834–1837. [Google Scholar] [CrossRef]
- Donlon, E. Lost and found: The academic conference in pandemic and post-pandemic times. Ir. Educ. Stud. 2021, 40, 367–373. [Google Scholar] [CrossRef]
- Kaushik, M.; Guleria, N. The impact of pandemic COVID-19 in workplace. Eur. J. Bus. Manag. 2020, 12, 1–10. [Google Scholar]
- London, A.J.; Kimmelman, J. Against pandemic research exceptionalism. Science 2020, 368, 476–477. [Google Scholar] [CrossRef] [PubMed]
- Rzymski, P.; Nowicki, M. Preventing COVID-19 prejudice in academia. Science 2020, 367, 1313. [Google Scholar] [CrossRef]
- Gabster, B.P.; van Daalen, K.; Dhatt, R.; Barry, M. Challenges for the female academic during the COVID-19 pandemic. Lancet 2020, 395, 1968–1970. [Google Scholar] [CrossRef]
- Cardel, M.I.; Dean, N.; Montoya-Williams, D. Preventing a secondary epidemic of lost early career scientists. Effects of COVID-19 pandemic on women with children. Ann. Am. Thorac. Soc. 2020, 17, 1366–1370. [Google Scholar] [CrossRef]
- Malisch, J.L.; Harris, B.N.; Sherrer, S.M.; Lewis, K.A.; Shepherd, S.L.; McCarthy, P.C.; Spott, J.L.; Karam, E.P.; Moustaid-Moussa, N.; Calarco, J.M.; et al. Opinion: In the wake of COVID-19, academia needs new solutions to ensure gender equity. Proc. Natl. Acad. Sci. USA 2020, 117, 15378–15381. [Google Scholar] [CrossRef]
- Bonifati, A.; Guerrini, G.; Lutz, C.; Martens, W.; Mazilu, L.; Paton, N.W.; Vaz Salles, M.A.; Scholl, M.H.; Zhou, Y. Holding a conference online and live due to COVID-19: Experiences and lessons learned from EDBT/ICDT 2020. ACM SIGMOD Record 2021, 49, 28–32. [Google Scholar] [CrossRef]
- Mubin, O.; Alnajjar, F.; Shamail, A.; Shahid, S.; Simoff, S. The new norm: Computer Science conferences respond to COVID-19. Scientometrics 2021, 126, 1813–1827. [Google Scholar] [CrossRef]
- Rundle, C.W.; Husayn, S.S.; Dellavalle, R.P. Orchestrating a virtual conference amidst the COVID-19 pandemic. Dermatol. Online J. 2020, 26, 13030. [Google Scholar] [CrossRef]
- Gottlieb, M.; Landry, A.; Egan, D.J.; Shappell, E.; Bailitz, J.; Horowitz, R.; Fix, M. Rethinking residency conferences in the era of COVID-19. AEM Educ. Train. 2020, 4, 313–317. [Google Scholar] [CrossRef] [PubMed]
- Woolston, C. Learning to love virtual conferences in the coronavirus era. Nature 2020, 582, 135–137. [Google Scholar] [CrossRef] [PubMed]
| Publisher’s Note: MDPI stays neutral with regard to jurisdictional claims in published maps and institutional affiliations. |
© 2022 by the authors. Licensee MDPI, Basel, Switzerland. This article is an open access article distributed under the terms and conditions of the Creative Commons Attribution (CC BY) license (https://creativecommons.org/licenses/by/4.0/).


