Article

Development of Deformation Bands and Deformation Induced Weathering in a Forearc Coal-Bearing Paleogene Fold Belt, Northern Japan

1
Energy Business Division, OYO Corporation, 2-10-9 Daitakubo, Minami-ku, Saitama 336-0015, Japan
2
The Division of Academic Resources and Specimens, The Hokkaido University Museum, Hokkaido University, N10 W8 Kita-Ku, Sapporo 060-0810, Japan
*
Author to whom correspondence should be addressed.
Appl. Sci. 2022, 12(16), 8348; https://doi.org/10.3390/app12168348
Submission received: 25 July 2022 / Revised: 16 August 2022 / Accepted: 18 August 2022 / Published: 21 August 2022
(This article belongs to the Special Issue Applied Structural Geology and Tectonics)

Abstract

:
We conducted microstructural and microchemical analyses of deformation bands in a forearc fold belt consisting of the Eocene Urahoro Group located in northern Japan. In the study area, there was one flexure (or monocline) developed where deformation bands pervasively occurred in arkosic sandstone intercalated with mudstone and coal layers. Deformation bands formed at the maximum burial depth of c. 1.5–2.5 km; this was inferred from both the thickness of the overlying strata and vitrinite reflectance values (%RO) of the coal layers (c. 0.5). These bands were inferred to have originated as phyllosilicate bands, which developed into cataclastic bands with increasing strain on sandstones with up to c. 10% volume of phyllosilicate. In the cataclastic bands, the detrital grains in the host parts were crushed into sizes less than one-half to one-fifth of the original ones, and the long axis of the fractured grains tended to align parallel to the deformation bands. It was found that the deformation bands became a site of intense weathering at later stages, where not only detrital biotite grains were altered to vermiculite and kaolinite, but also authigenic clay minerals such as smectite grew in pore spaces created by the fracturing of detrital grains.

1. Introduction

Many studies have been conducted on deformation bands in sandstones or other types of rocks to unravel the structural development and conditions in deformed zones at shallow levels of the continental crust ([1,2,3] for a review). Deformation bands have also attracted the interest of petroleum geologists because permeability, which is key for exploring oil reservoirs, is modified by the development of deformation bands [4,5]. One interesting aspect of deformation bands is that they form at places of strain localization. In fact, many deformation bands have been reported from fold-and-thrust belts in association with thrusts or blind thrusts [4,5,6,7,8,9]. Further, from the viewpoint of the development of fault zones, they develop at the tip of faults in so-called “process zones” [2,10] and in the damage zones of fault zones [11,12]. This is because deformation bands formed under slightly lower stresses below the critical stresses for faulting and thus can be considered as precursory structures to faults [13], where only a small amount of displacement occurred.
Water–rock interactions (i.e., dissolution–precipitation reactions) are enhanced at fracture interfaces [14,15,16,17]. However, this aspect of so-called structural diagenesis [18] has been little explored in the studies of deformation bands [19]. Such interactions among fluid flow, alteration and deformation in deformation bands and surrounding host parts have recently been shown in the fault damage zones of a few sedimentary basins: e.g., near the Dombjerg Fault, in the NE Greenland rift system [20,21,22]; near the Eisenstadt Fault in the Vienna Basin (Austria) [23]. Further, once a significant amount of clay minerals forms at the fracture interfaces in rocks, not only is the frictional strength significantly reduced (e.g., the internal coefficient of friction is 0.1 for smectite [24,25], typical authigenic clay minerals formed by weathering), but the permeability is decreased by the swelling of such clay minerals [25]. Therefore, a landslide could be triggered by a large amount of rainfall due to the buildup of pore fluid pressure as well as low frictional strength in such weathered rocks [26].
In the present study, we investigated microstructures in deformation bands in sandstones, which occurred in forearc coal-bearing Paleogene strata located in eastern Hokkaido in northern Japan. We first documented these deformation bands in sandstones developed under a special structural setting, where almost vertical strata suddenly become horizontal (i.e., flexure or monocline, referred to as flexure in the present paper). We then conducted detailed microstructural analyses of deformation bands in core and outcrop sandstone samples. We found that the deformation bands were characterized by cataclasis and alignment of phyllosilicate, which plays a key role in the formation of deformation bands in the sandstones. We further showed that alteration (i.e., weathering) was induced in phyllosilicate grains by the formation of deformation bands, which was enhanced by water–rock interactions.

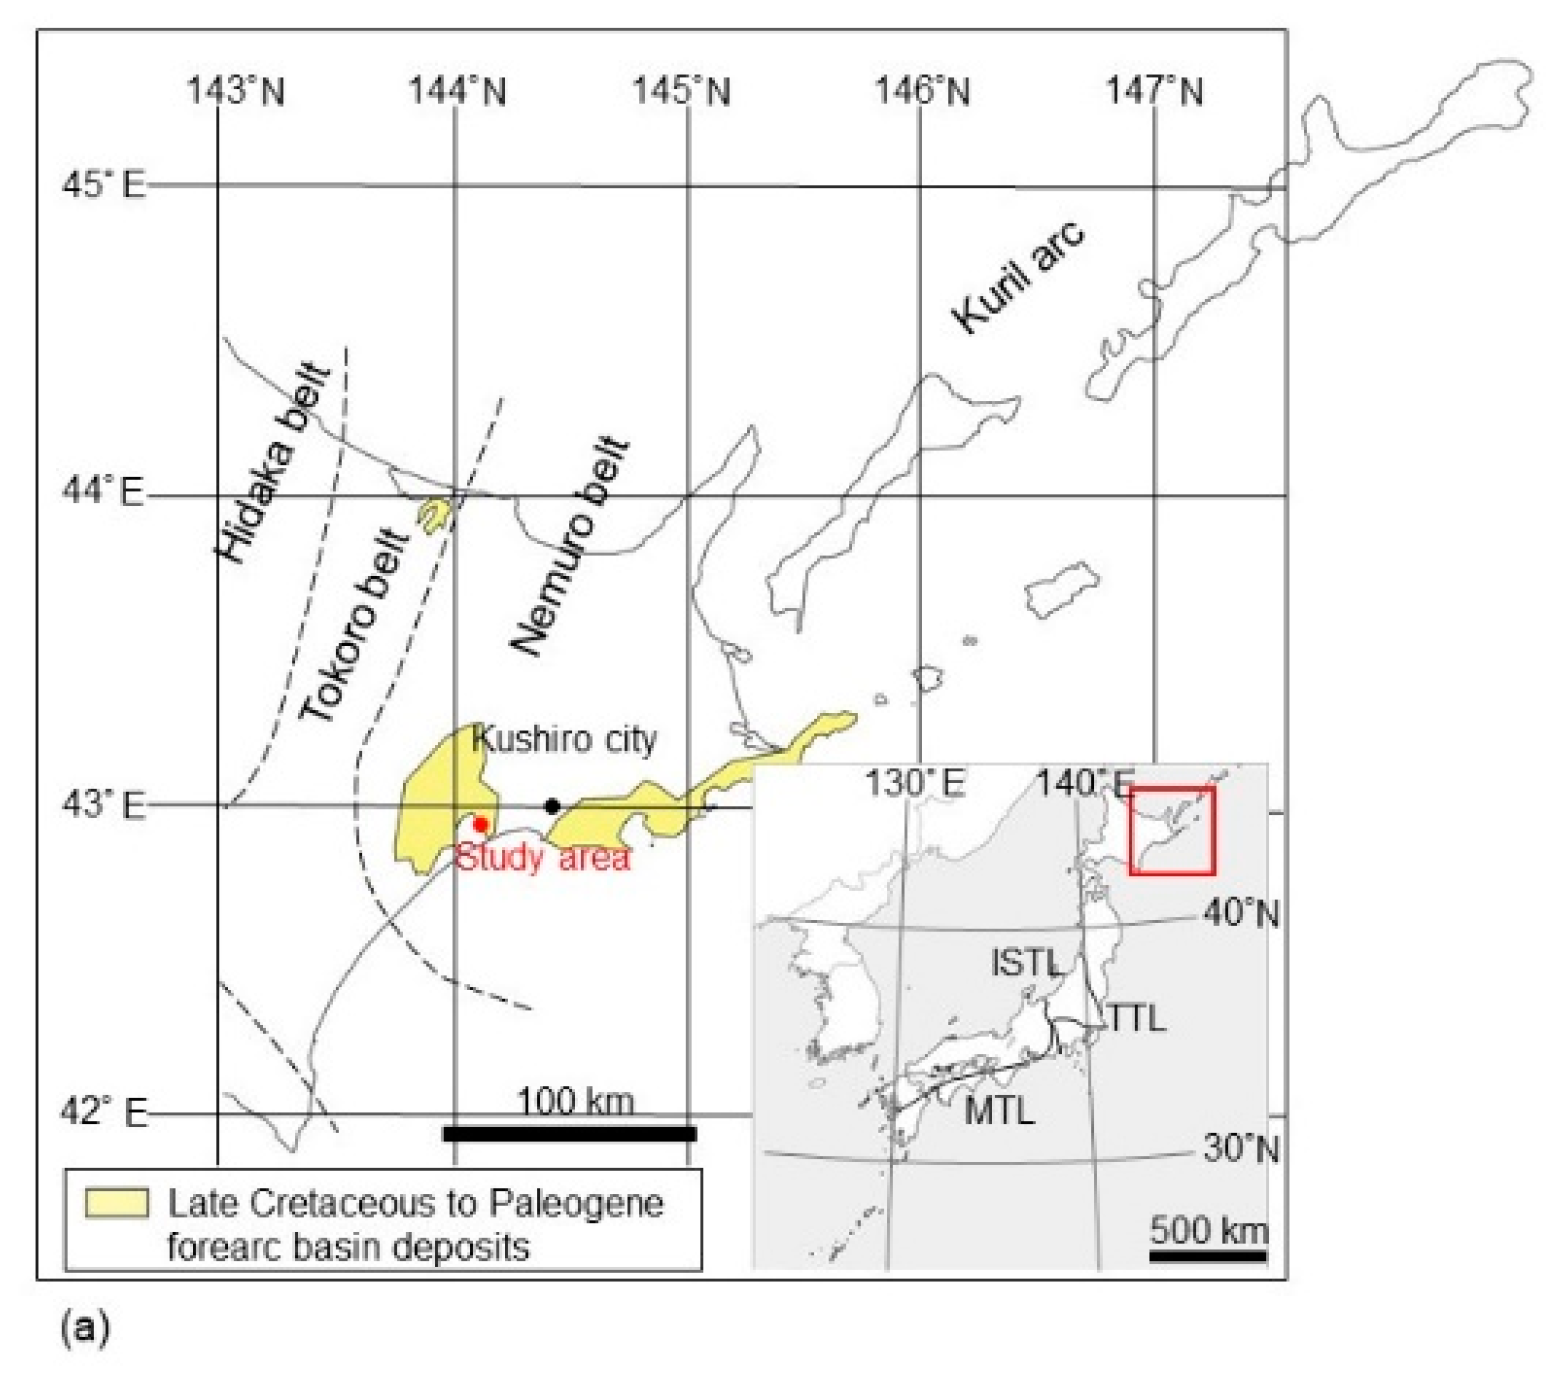
2. Geological Setting

The study area mostly consisted of the Eocene Urahoro Group, which is unconformably covered by the Upper Miocene Atsunai Group (Figure 1, Table 1). The Urahoro Group consists of shallow marine to brackish water sediments intercalated with non-marine sediments and contains many coal layers, which were exploited in the past and are known as the Kushiro coal field [27]. The Eocene Urahoro Group consists of the Beppo, Harutori, Tenneru, Yubetsu, Shitakara and Shakubetsu formations in ascending order (Table 1, [28,29]). The basement of the Urahoro Group is not exposed in the study area but unconformably underlain by the uppermost Cretaceous sandstone and mudstone in the area c. 30 km west (1:50,000 Geological Maps of Japan, Onbetsu by [30] and Tokomuro by [31]). Further, since the sandstones of the Urahoro Group are arkosic and contain many plagioclase, K-feldspar, quartz and biotite detrital grains, the basement was inferred to have been composed of mostly granitic rocks pre-Eocene in age.
The sedimentary age of the Urahoro Group, which was previously inferred to be from the Late Eocene from shell, plant [28] and foraminifera fossils [32,33], has recently been determined to be from c. 39 Ma (Middle Eocene) based on the U-Pb age of detrital zircon grains from tuff beds [34]. The Middle Eocene Urahoro Group is overlain by the Onbetsu Group from the latest Late Eocene to the earliest Early Oligocene (Table 1, [32,33,35]) and consists of sandstone and mudstone deposited in a shallow marine environment with a very slight unconformity [30].
The Atsunai Group is also mostly shallow marine sediments, consisting of the Chokubetsu, Atsunai and Shiranuka formations in ascending order (Table 1, [30,36]), including many tuff beds. In the study area, only the Atsunai Formation is distributed, consisting of lapilli tuff (or tuffaceous sandstone), including many pumices and tuffaceous mudstones [37]. While the age of the Atsunai Group has previously been inferred to be the Late Miocene based on diatom fossils [38], the U-Pb age of detrital zircon grains from lapilli tuff of the Atsunai Formation has yielded c. 7 Ma for the sedimentation ages (personal communication with H. Ito).
Table 1. Stratigraphy of the study area after [36,37].
AgeGroup and FormationLithologyThickness (m)Remarks
Late MioceneAtsunai G.Shiranuka F.tuffaceous mudst.700–750Not exposed in the study area.
Atsunai F.pumice tuff, tuffaceous mudst.450–480Zircon U-Pb age of c. 7 Ma after H. Ito (Personal communication)
Chokubetsu F.tuffaceous mudst, sandst.1000–1060Not exposed in the study area.
Late Eocene to Early OligoceneOnbetsu G.mudst, sandst.290–440Not exposed in the study area.
Middle EoceneUrahoro G.Shakubetsu F.sandst. mudst. coal layers260–290
Shitakara F.sandst, mudst.240–270
Yubetsu F.
Tenneru F.,
Harutori F.,
Beppo F.
congromerate, sandst, mudst390Not exposed in the study area. Zircon U-Pb age of c. 39 Ma in the Tenneru F. after Katagiri et al. (2016) [34]
Late Cretaceous Not exposed in the study area.
Figure 1. (a) Index map showing the Late Cretaceous and Paleogene forearc basin deposits in eastern Hokkaido, northern Japan, and the study area. The location of index map is shown by a red frame in the inset diagram. MTL, median tectonic line; ISTL, Itoigawa-Shizuoka tectonic line; TTL, Tanakura tectonic line. (b) Geological map modified after the previous literature [37], and results from our field survey are shown with circles (see legends). (c) Cross section; the traverse line for the cross section (A–A′) is shown in (b).
Applsci 12 08348 g001aApplsci 12 08348 g001b
In the studied and surrounding areas, the structure of the Urahoro Group is characterized by fold-and-thrust belts, where the orientations of the fold axes and thrust faults trend NNE–SSW [30,31,37]. The fold-and-thrust belts were possibly formed by the collision of the forearc sliver of the E–W trending Paleo-Kuril arc against the northeast Japanese arc trending N–S represented by the Hidaka belt in Hokkaido (Figure 1a, [39,40]). The overlying Upper Miocene Atsunai Group is concordantly folded together with the Middle Eocene Urahoro Group based on the geological maps of the previous studies [30,31,37,41]. However, the degree of folding of the Upper Miocene Atsunai Group compared to that of the Paleogene groups has not been precisely known. Whether the former group rests on the latter groups with parallel unconformity or clino-unconformity has been debated [36]. Therefore, if the deformation (folding) occurred at a single-phase or polyphase and their timing remains to be investigated.
In the study area, only the uppermost unit of the Shitakara Formation and the Shakubetsu Formation of the Urahoro Group and the Atsunai Formation of the Atsunai Group are distributed (Table 1, Figure 1b), and the Onbetsu Group is not distributed. The uppermost unit of the Shitakara Formation solely consists of fine- to medium-grained arkosic sandstones. While the Shakubetsu Formation also consists of fine- to medium-grained arkosic sandstones, which are intercalated with mudstones and many thin coal layers up to a few tens of a centimeter thick.
The structure of the study area is characterized by a fold belt called the Sashiusu-Shiranuka-gawa folded belt with a wavelength of 1–2 km [37], which trends in the NNE–SSW direction (Figure 1b). The strata mostly gently dip towards either an SSE or WNW direction up to 30 to 45 degrees. Along the very narrow zone in the eastern part of the study area, the strata dip steeply at angles more than 75 degrees towards the ESE direction, which has been interpreted to indicate the fault between the uppermost unit of the Shitakara Formation and Shakubetsu Formation [37].

3. Methods

In the present study, we conducted not only a detailed field survey but also microstructural image analysis in thin sections of sandstones with deformation bands under an optical microscope. In addition, we conducted microchemical analyses using a scanning electron microscope (SEM) energy dispersive X-ray spectrometry (EDS) and electron probe micro analyzer (EPMA). The SEM-EDS analysis was conducted using an SEM (JEOL JSM-IT200, made by Japan Electron Optics Laboratory (JEOL) Ltd., Tokyo, Japan) with an EDS system operating in the backscattered electron (BSE) mode with 20 kV installed at Hokkaido University. The EPMA analysis was conducted using a wavelength dispersive electron-probe microanalyzer (JEOL JXA-8800R, made by JEOL Ltd., Tokyo, Japan) installed at Hokkaido University. The analysis was performed at an acceleration voltage of 15 kV and at a specimen current of 20 nA for point analyses with ZAF correction. Natural and synthetic silicates and oxides are used as standards. Furthermore, we measured the vitrinite reflectance of coal layer samples from the Shakubetsu Formation to infer the maximum temperatures which they experienced. The measurement was conducted at Japan Petroleum Exploration Co., Ltd. (Tokyo, Japan).
Below, we briefly described the method of image analysis, which we used for microstructural analyses in sandstones with deformation bands. First, images of thin sections were captured by GNU Image Manipulation Program [42], and outlines of detrital grains were traced. Manual tracing of grain boundaries was also used. Then, the microstructures of detrital grains were analyzed by ImageJ [43]. The followings were analyzed by ImageJ: area (A), perimeter (P), length of long (a) and short (b) axes of grains and angle (q) between the long axis and the reference orientation. Here, the long (a) and short (b) axes of grains were those of a fitted ellipse matching the grain shape by ImageJ. The data for each analyzed area was copied and pasted on an Excel spreadsheet, and then the equivalent diameter of a circle (D, grain size), aspect ratio (R), and circularity (C) (e.g., [44]) were calculated using the following equations.
D = 2√(A/π)
R = a/b
C = 4pA/P2

4. Results

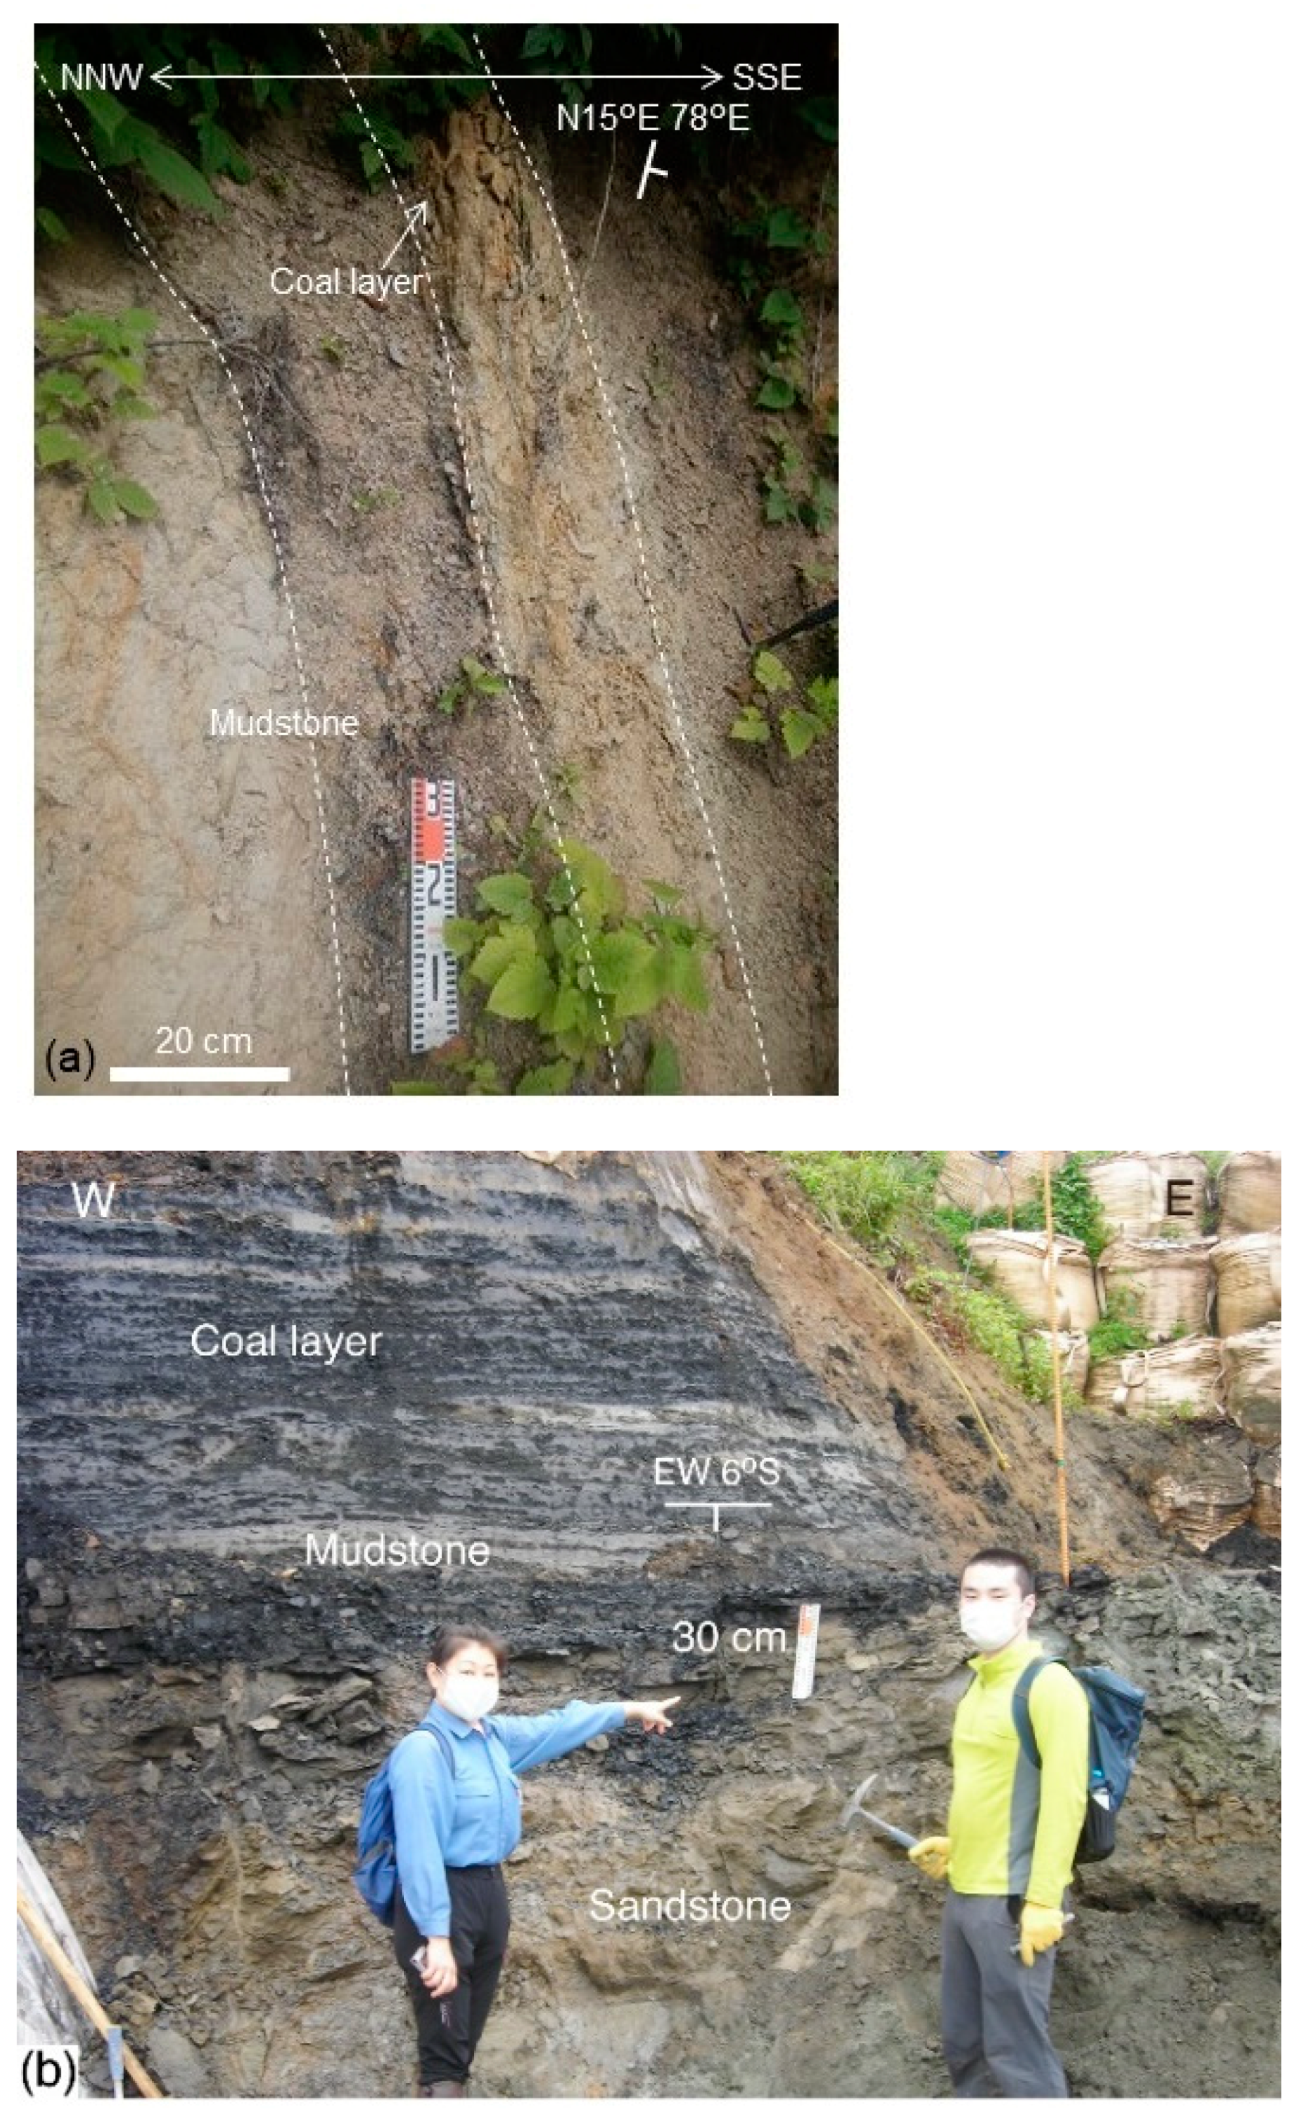
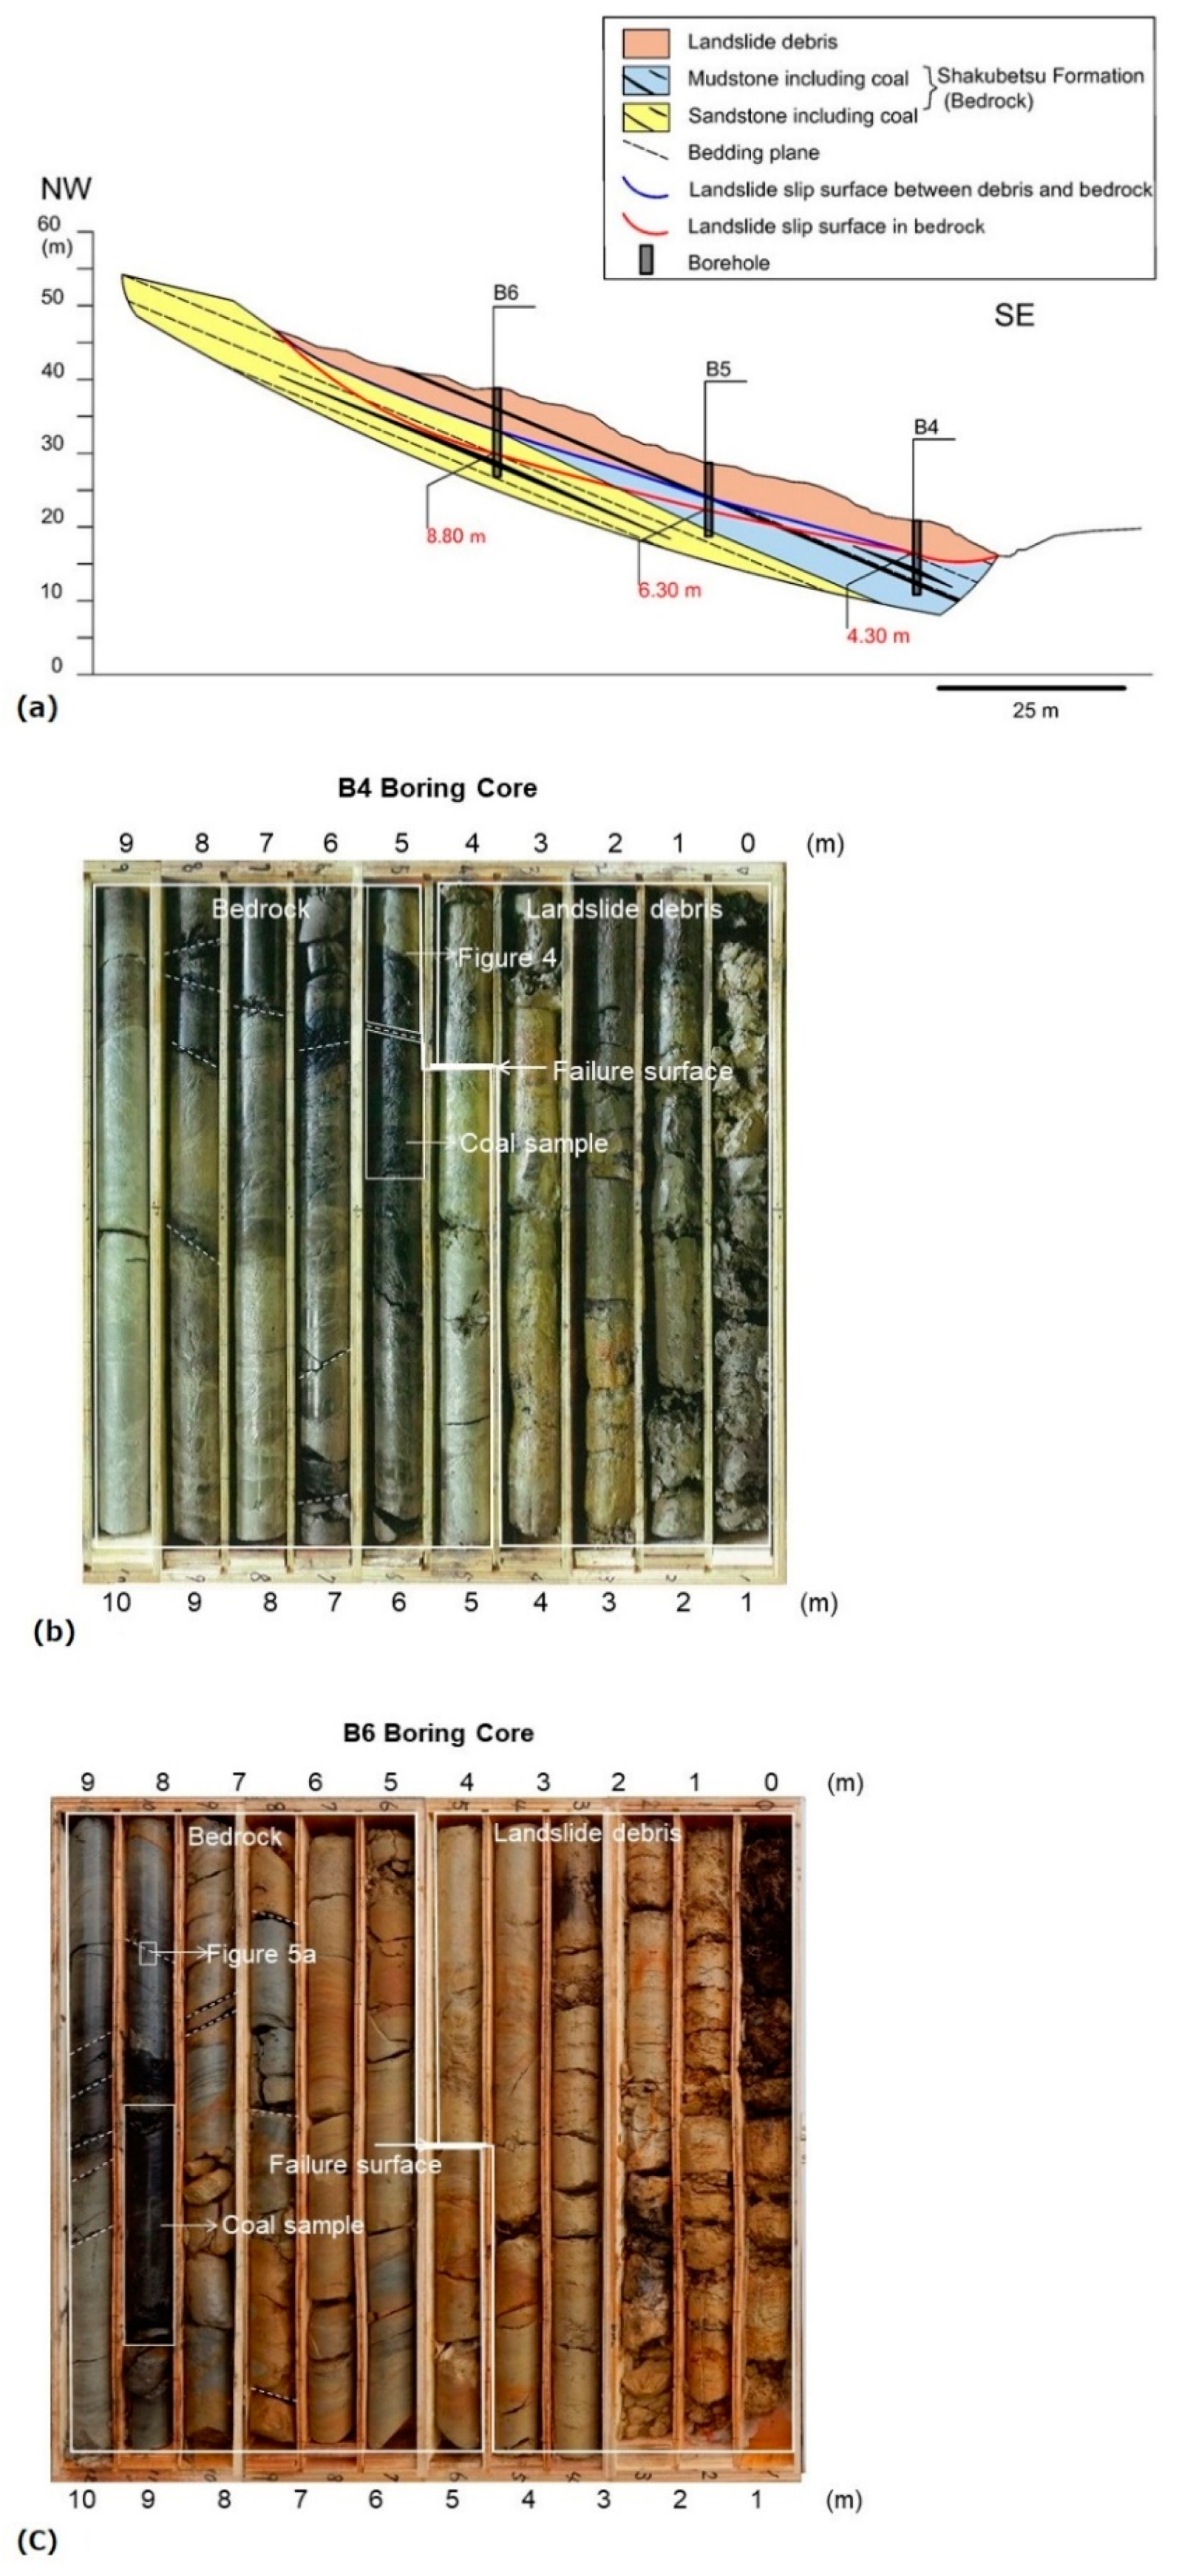
4.1. Field Data and Sample Description

Deformation bands developed in the borehole core and outcrop samples as mentioned below. The geological route map which we constructed incorporating the previous results [37] is shown in Figure 1b, where the lithology and strike-and-dip of the strata are indicated. The cross-section was constructed based on the geological map (Figure 1c). The basic features of the geological structure are the same as those described by the previous study [37]. An important structure revealed by both studies is the steeply dipping zone in the Shakubetsu Formation, which was interpreted as a large-scale fault between the Shitakara and Shakubetsu formations ,as mentioned above [37]. However, the present study interpreted the zone without any fault gouge or breccia as a flexure (Figure 1c, represented as an overturned syncline in Figure 1b). Here, the northwestern limb trended NNE–SSW to NE–SW and dipped southeast at 75° to vertically (Figure 1b and Figure 2a), while the southeastern limb trended E–W and dipped south at 6° (almost horizontally, Figure 1b and Figure 2b). Further, the boreholes (B4, 5 and 6), which are located at a position between the steeply and horizontally inclined strata of the Shakubetsu Formation (Figure 1b,c), were drilled by Meiji Consultant Co. Ltd, Sapporo, Japan. to monitor the ongoing landslide. The strata below the landslide slip surface dipped SE at c. 20° (Figure 3a), which can be inferred from the bedding in the borehole core samples as explained below, indicating that the flexure axis is located directly below it (compare Figure 1c and Figure 3a).
Deformation bands were developed in core samples from the three boreholes (B4, 5 and 6 in Figure 3a). In the borehole core samples, very-fine- to fine-grained sandstones and mudstones alternated with many thin coal layers (Figure 3b,c), the thickness of which ranged between a millimeter to 20 cm. The deformation bands are clearly recognized as black seams in the core samples (Figure 3b,c). Deformation bands are also developed in very-fine- to medium-grained sandstones from outcrops (KT1, 2 and 3, Figure 1b) of the Shakubetsu Formation constituting the northwestern (KT3) and southeastern (KT1 and 2) limbs of the flexure, where coal layers up to 30 cm thick are intercalated (Figure 2b). Although the deformation bands are barely seen by naked eyes at the outcrops, they could be recognized in the chips of sandstone as faint seams. Deformation bands only occurred in the flexure consisting of the Shakubetsu Formation, not in other areas consisting of the uppermost unit of the Shitakara Formation (e.g., KT4, Figure 1b). In this study, microstructural and microchemical analyses were conducted for sandstones with deformation bands in not only one core sample from borehole B6 but also three samples from outcrops (KT1, 2 and 3). In the borehole core sample B4, gouges also developed other than deformation bands, the microstructures of which are described below. Further, microstructures in one outcrop sample (KT4, Figure 1b) from the uppermost unit of the Shitakara Formation were analyzed for reference, which is a fine- to medium-grained sandstone without deformation bands. All these analyzed samples are summarized in Table 2.

4.2. Microstructural Analysis

4.2.1. Microstructure

In the B4 core sample, a c. 20 cm thick gouge (see [45,46] for definition) developed at the depth interval between 5.0 and 5.2 m. In this gouge sample (B4_5.1 m, Table 2), the original sandstone layers were pervasively fractured, and anastomosing cracks developed along which detrital chlorite and illite grains were aligned (Figure 4). The anastomosing cracks were mostly oriented in two different directions, which could be correlated with composite planar structures R-Y-P (e.g., [47]). However, since it is difficult to identify which of these cracks can be correlated with the R, Y or P plane, the sense of shear along this gouge zone cannot be clearly inferred. The detrital chlorite grains with a very elongated shape aligned along the anastomosing cracks which were possibly formed by fracturing along cleavages from the original large detrital chlorite grains. Adjacent to this gouge zone, a weakly sheared sandstone occurred. This sandstone contained many detrital biotite grains, some of which were fractured and peeled off from the host biotite grains along cleavages. The same microstructures occurred in detrital biotite grains in the host parts of the deformation bands in borehole core sample B6 which will be described below.
The deformation bands developed in borehole core sample B6 (B6_8.2 m) are typical deformation bands (Figure 5), where very-fine fractured detrital grains constitute thin bands up to 1 mm (mostly a few hundreds of microns) wide. These deformation bands are surrounded by undeformed or weakly deformed very-fine- to fine-grained sandstones consisting of detrital grains with diameters varying between 50–150 mm (Host, Figure 5a). Another interesting feature is that very thin coal layers (less than 1 mm) were separated by many extension fractures, which are reminiscent of a coal cleat [48]. Further, these coal layers peeled off parallel to the bedding and were incorporated into the deformation bands as very-thin coal seams (Figure 5b). The coal seams were flowing in the deformation bands, showing an irregularly curved shape, which suggested that fractured detrital grains flowed in the deformation bands (i.e., granular-particulate flow, e.g., [44]). Also, there were many fractured very-fine-grained detrital biotite grains embedded in the deformation bands, which were aligned slightly oblique to the deformation band boundary forming a foliation (Figure 5c). In addition, there are kinked and extended detrital biotite grains in host parts, which were caused by sliding along the cleavage plane (cleavage fracturing, Figure 5d). Further, authigenic clay minerals, which were identified as smectite, grew in pore spaces created by fracturing in deformation bands (Table 3, Figure 5e).
In the fine-grained sandstone from outcrop sample KT1 of the Shakubetsu Formation, although no cataclasic bands developed, detrital biotite grains were aligned, forming phyllosilicate bands (Figure 6a). These detrital biotite grains were bent (kinked) by sliding along cleavages as they occurred in the borehole core sample B6_8.2 m. Furthermore, the SEM-BSE photomicrograph revealed that not only detrital biotite grains were altered to vermiculite and further to kaolinite, but smectite grew in the pore space created by cleavage fracturing (Figure 6c,d, Table 3, chemical analysis). The vermiculite had an intermediate composition between pure vermiculite and biotite, where K was not completely lost (Table 3).
In the fine- to medium-grained sandstone from the outcrop sample KT2 of the Shakubetsu Formation, deformation bands (Figure 7) were barely seen as faint streaks in hand samples by naked eyes. In this sandstone, the matrix was entirely cemented by dolomite (Figure 7c). However, thin polished sections of this sample revealed that spaced deformation bands developed, which were defined by the alignment of detrital chlorite or biotite grains (phyllosilicate bands, Figure 7a). These deformation bands were oriented nearly parallel or slightly oblique to the bedding plane. Also, these phyllosilicate grains were again kinked due to the slipping along cleavages (Figure 7a). In one case, a conjugate set of deformation bands developed, where the dihedral angle between the two deformation bands is c. 60° (Figure 7b,c). The fact indicates that the conjugate deformation bands could have been formed by the σ1 oriented at a low angle to the bedding plane. Also, the conjugate phyllosilicate bands were accompanied by cataclasis of detrital grains (Figure 7b,c). It should also be noted that composite veins consisting of pyrite (Fe1.0S1.9 from the SEM-EDS analysis) and dolomite intruded into detrital biotite grains (Figure 7b–d, Table 3). These detrital biotite grains were also altered to vermiculite (Figure 7d, Table 3). Again, the vermiculite has an intermediate composition between pure vermiculite and biotite, where K is not completely lost (Table 3).
In the fine-grained sandstone from outcrop sample KT3 of the Shakubetsu Formation, although no cataclasic bands developed, detrital chlorite grains were aligned, forming phyllosilicate bands (Figure 8a). Also, iron oxide or hydroxide grains showing the mineral composition exclusively containing iron identified by SEM-EDS analysis (Table 3) were aligned parallel to the phyllosilicate bands (Figure 8a). The mineral is most probably limonite based on its slightly reddish color and round shape. The preferential alignment of limonite grains could indicate that these grains precipitated from the fluid which percolated through the pore space created along the phyllosilicate bands. In fact, the limonite grains are often included in detrital chlorite grains, which were further altered to kaolinite (SEM-BSE microphotograph, Figure 8b, Table 3). Similar occurrences (limonite gravel) have been reported in rocks located along the failure surfaces of landslides [49].

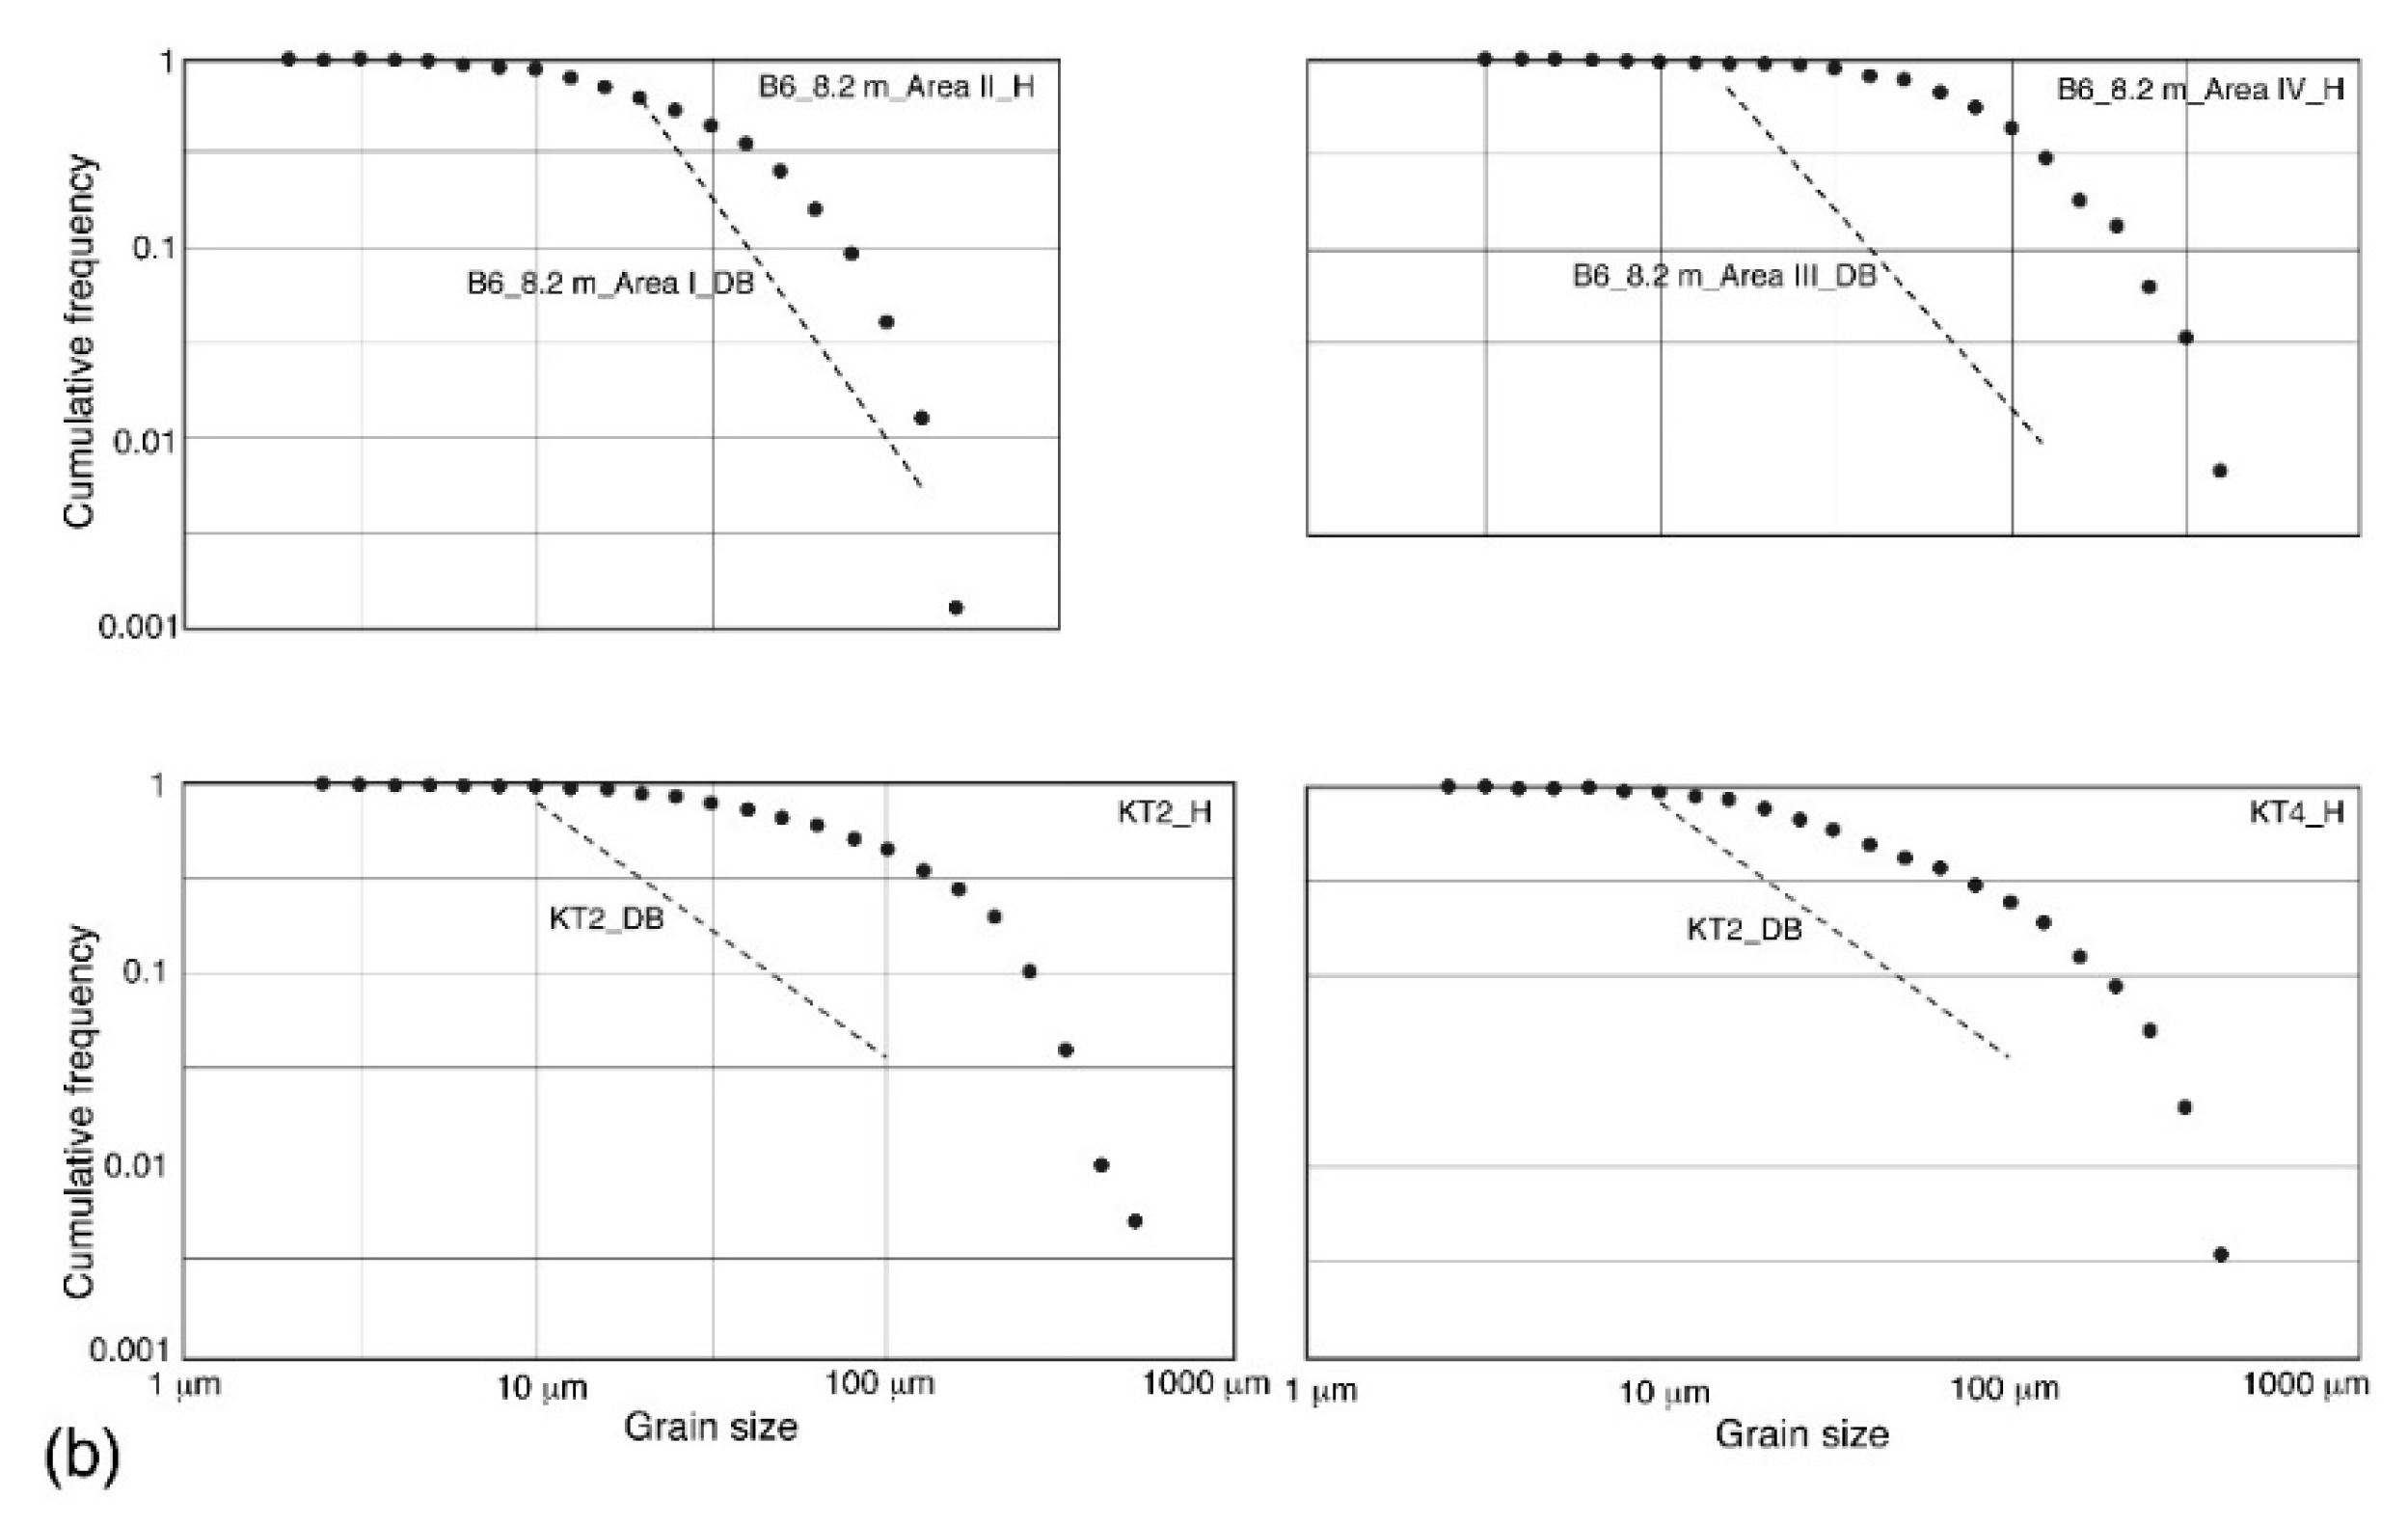
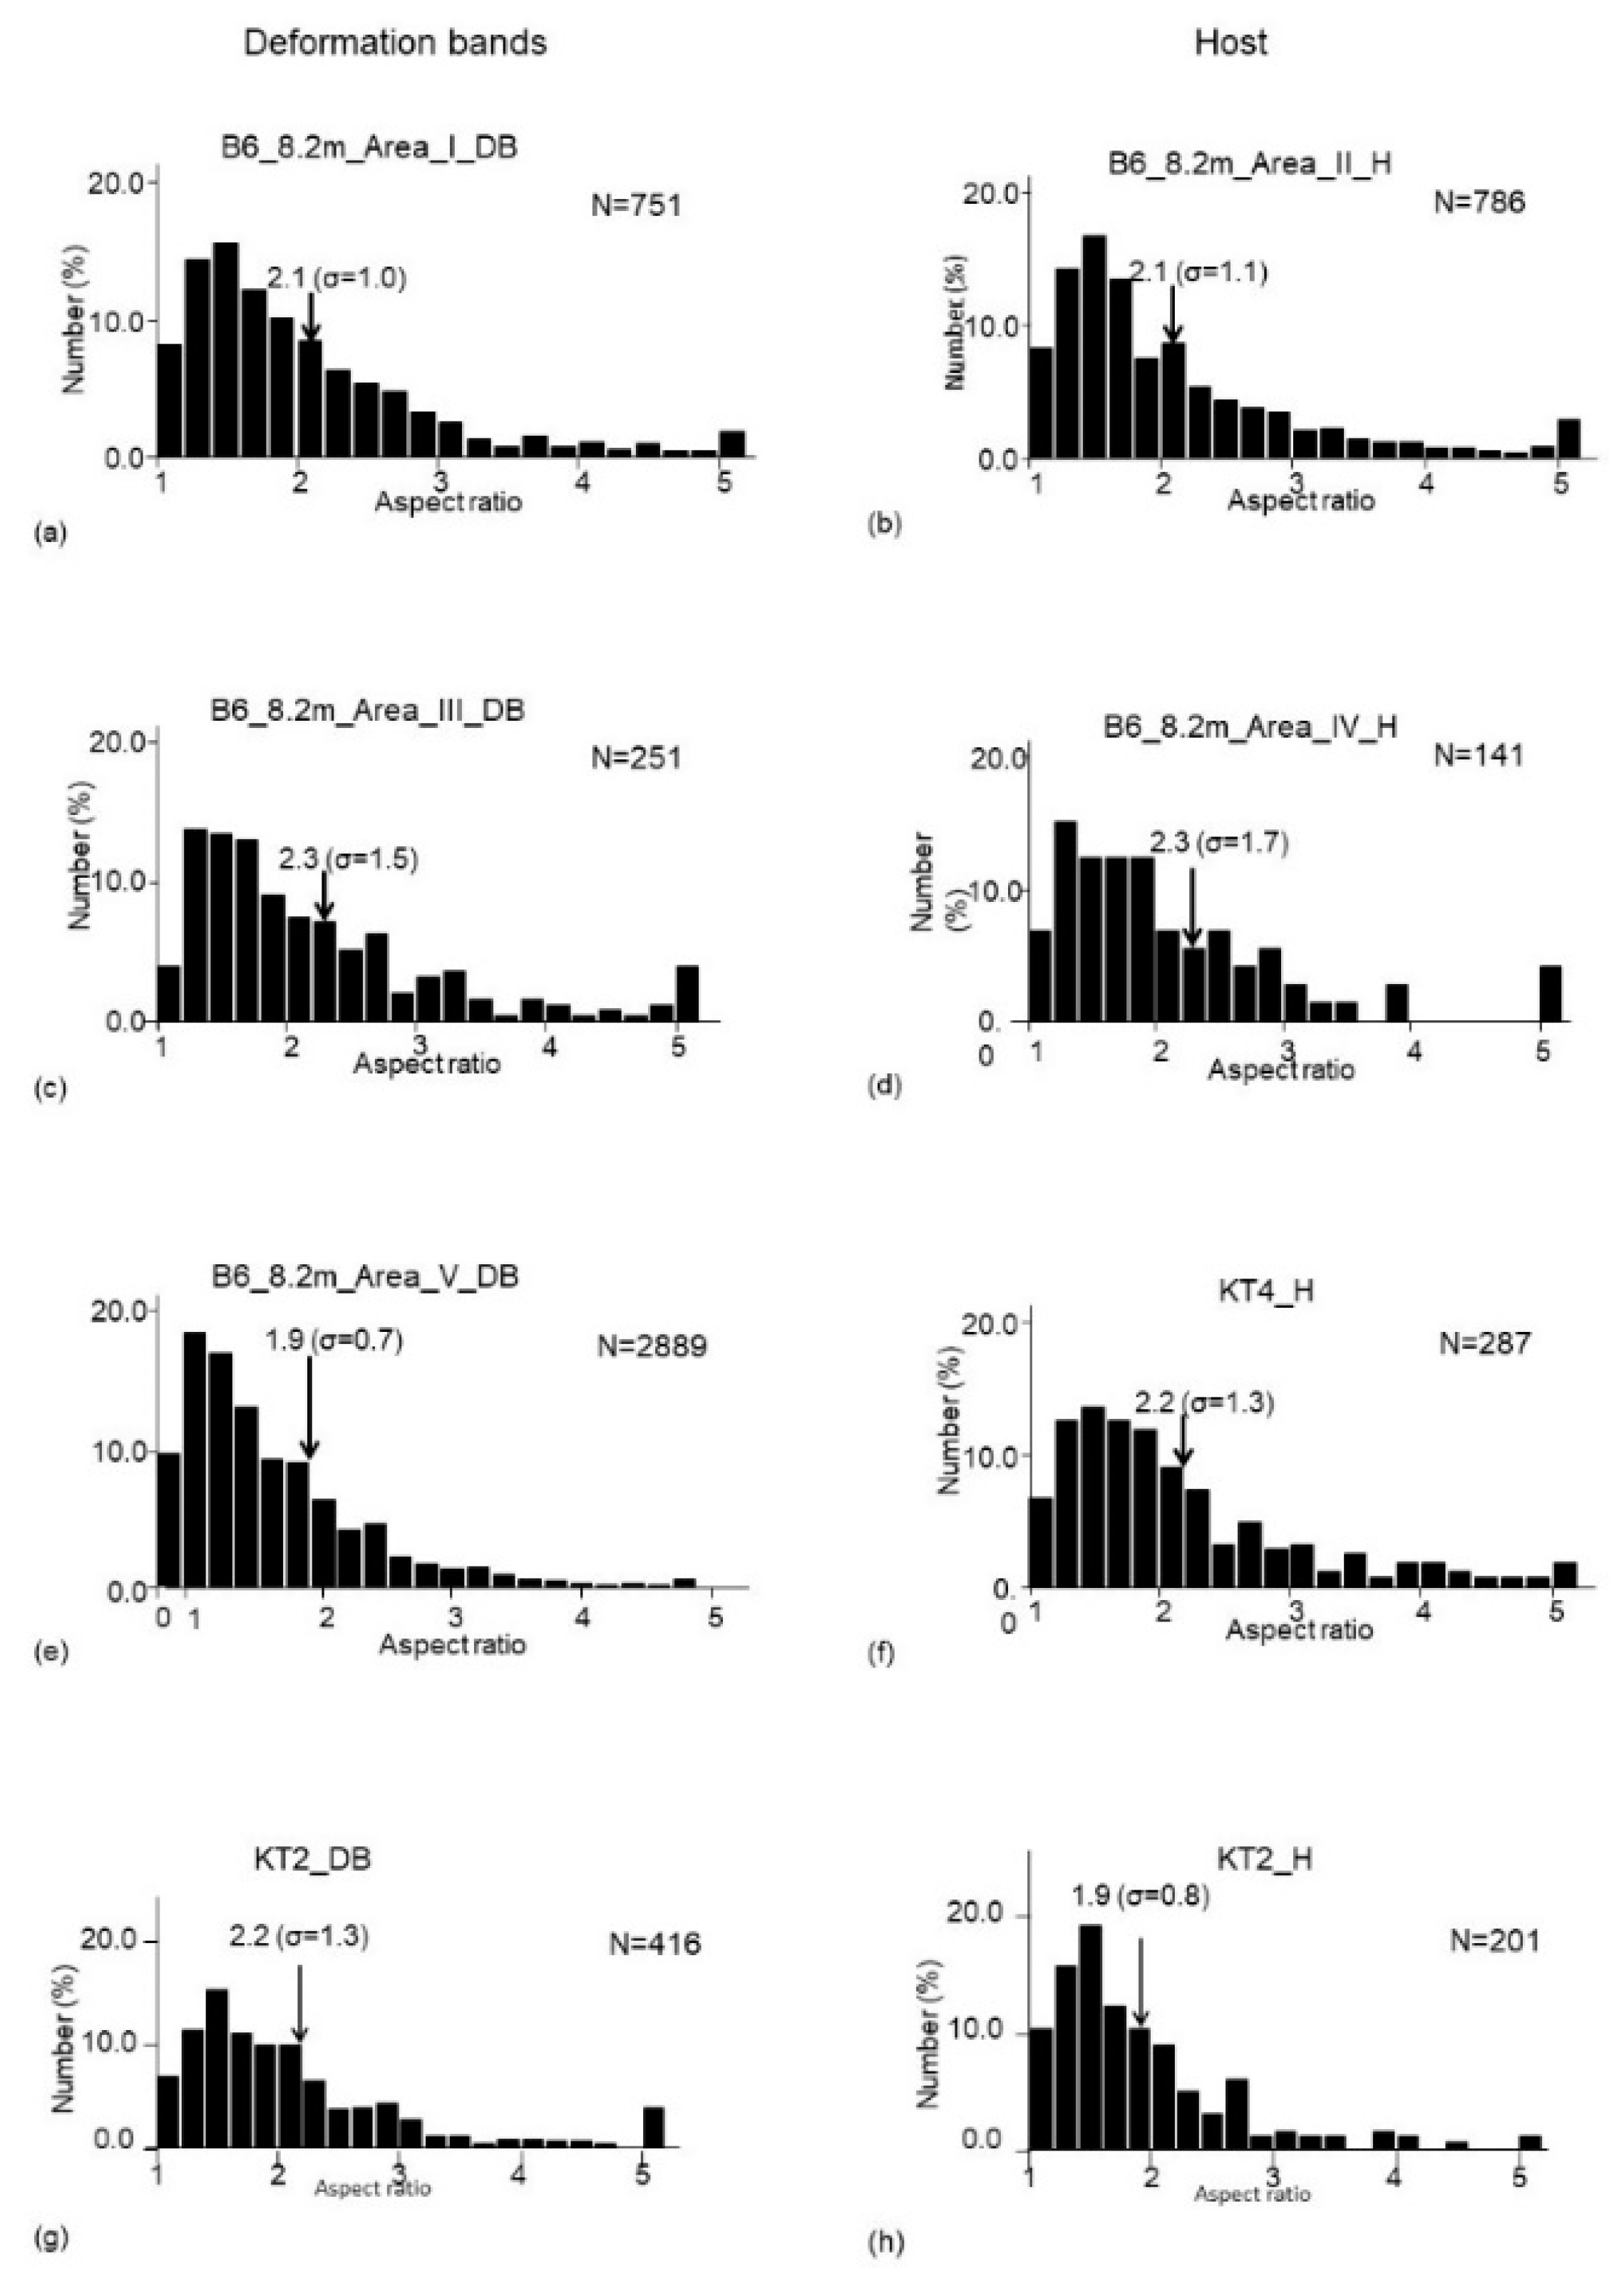
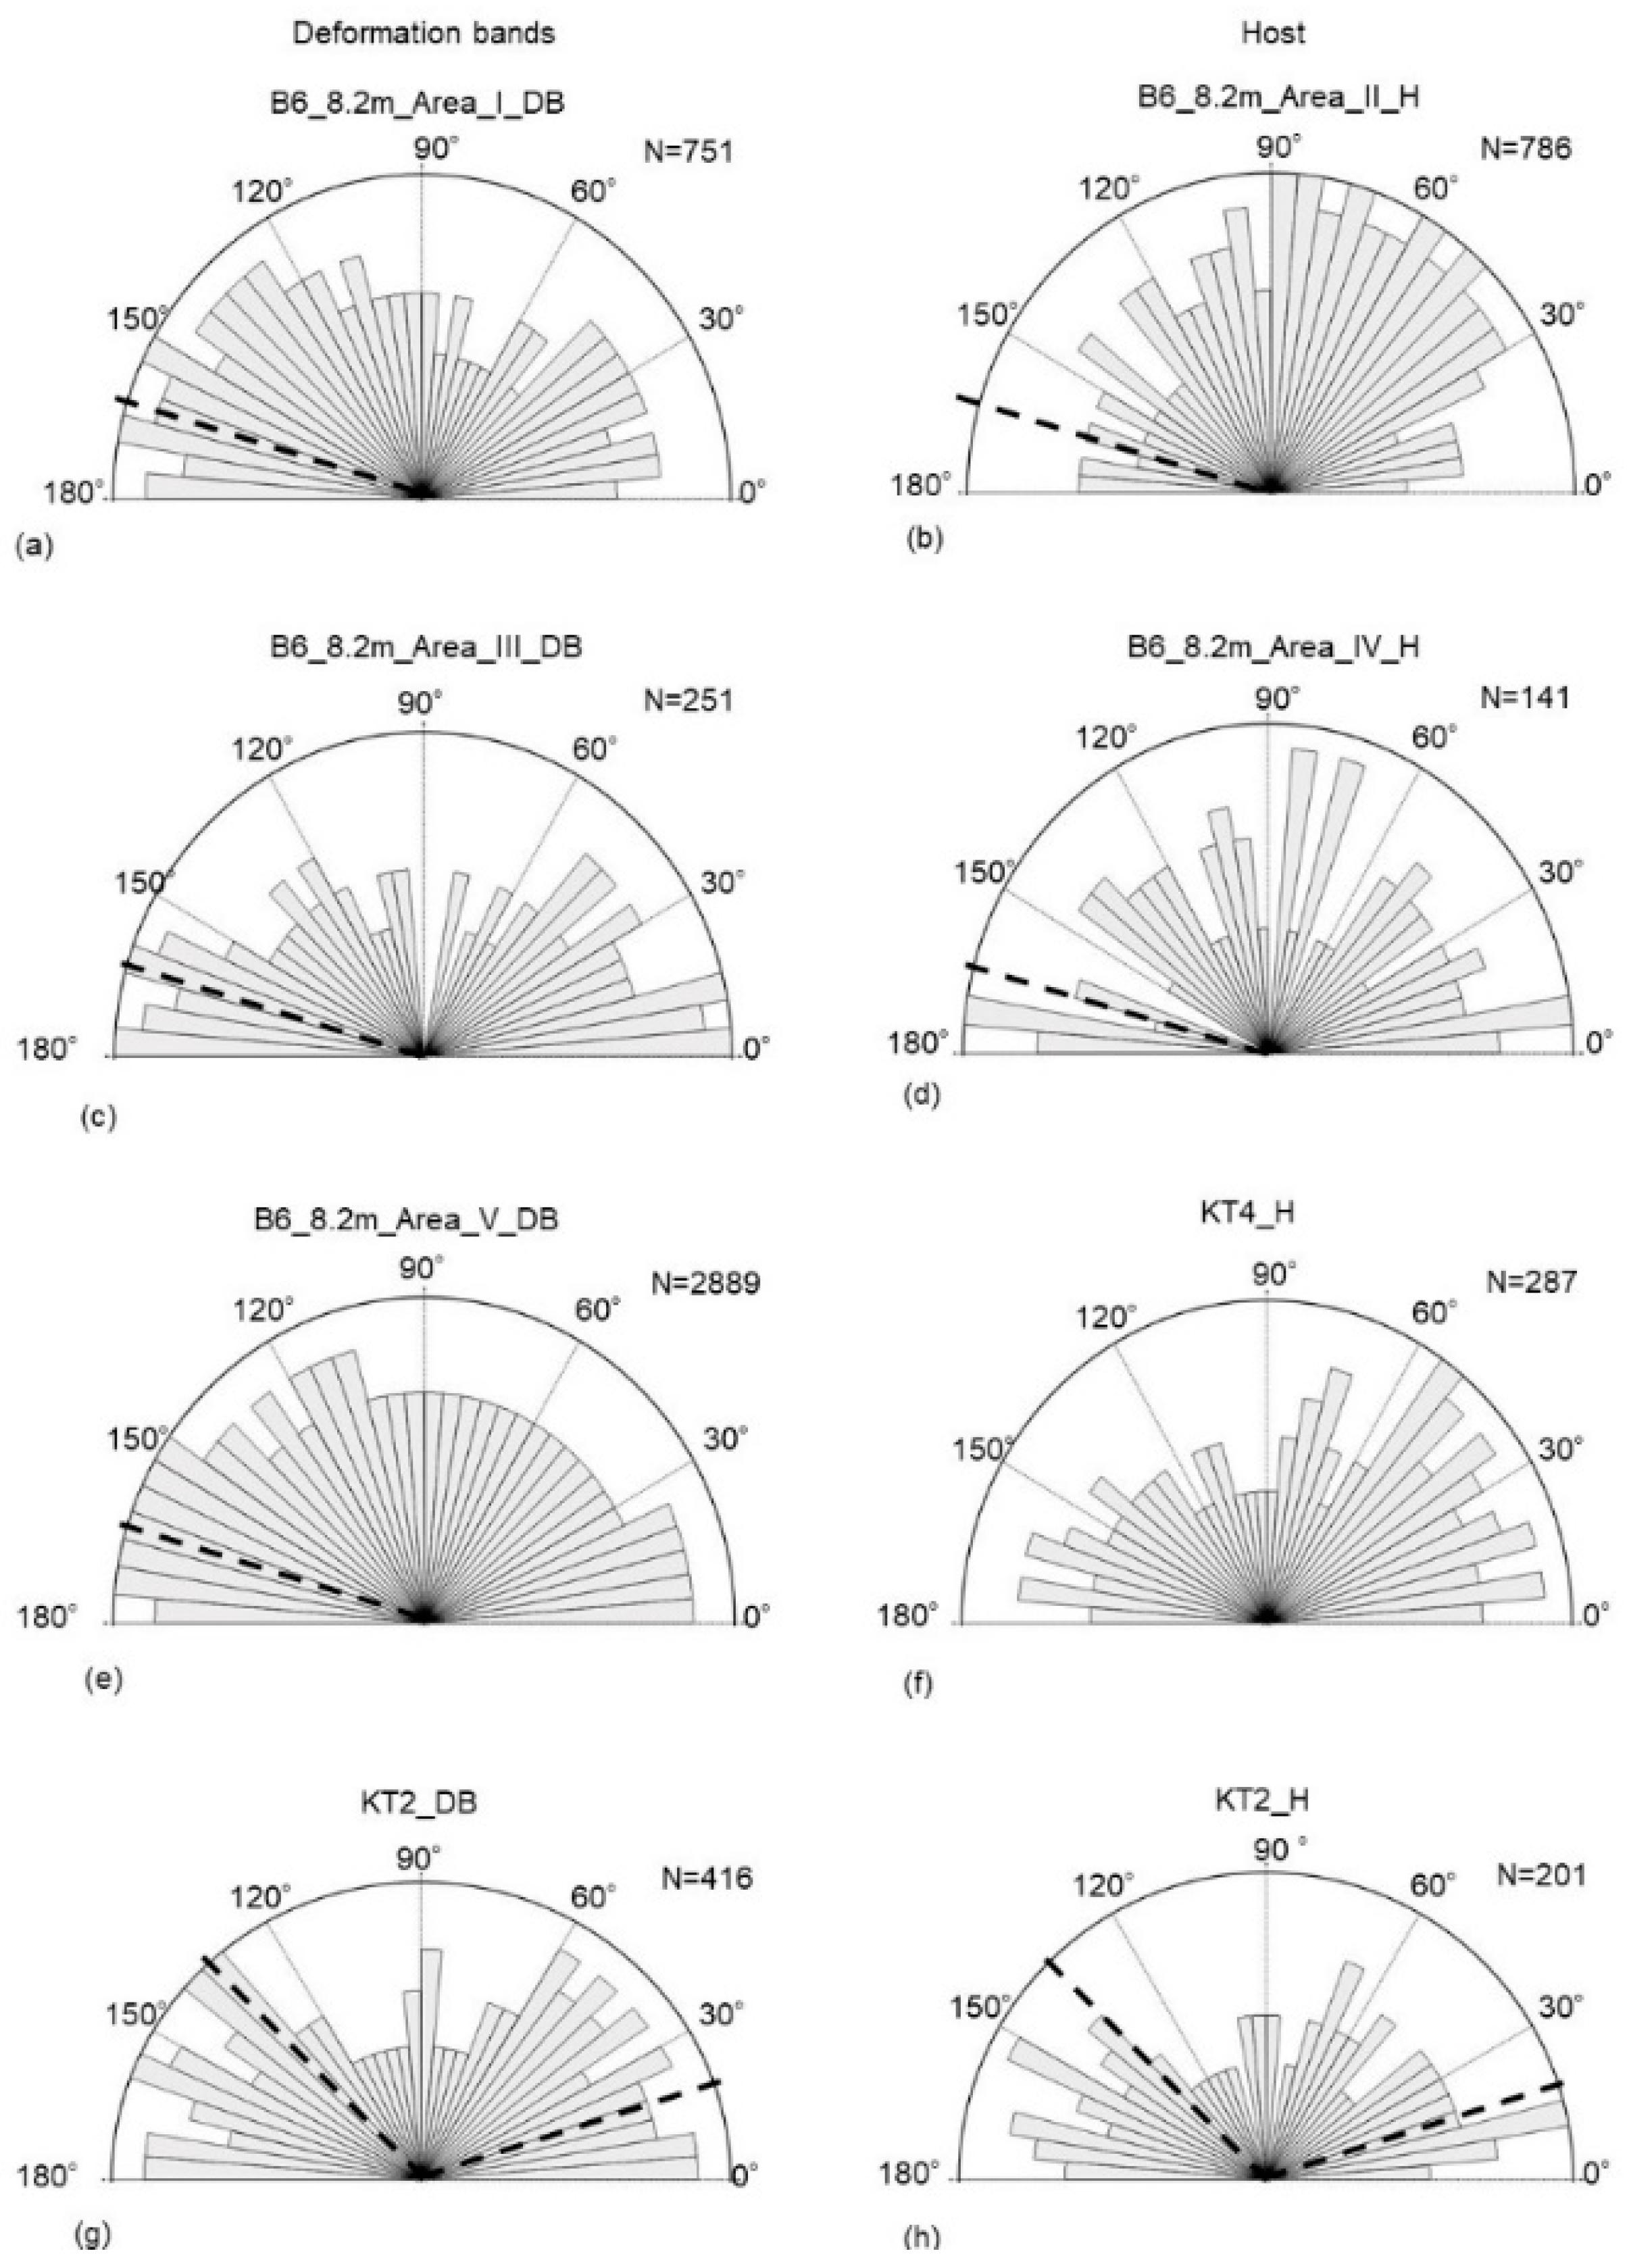
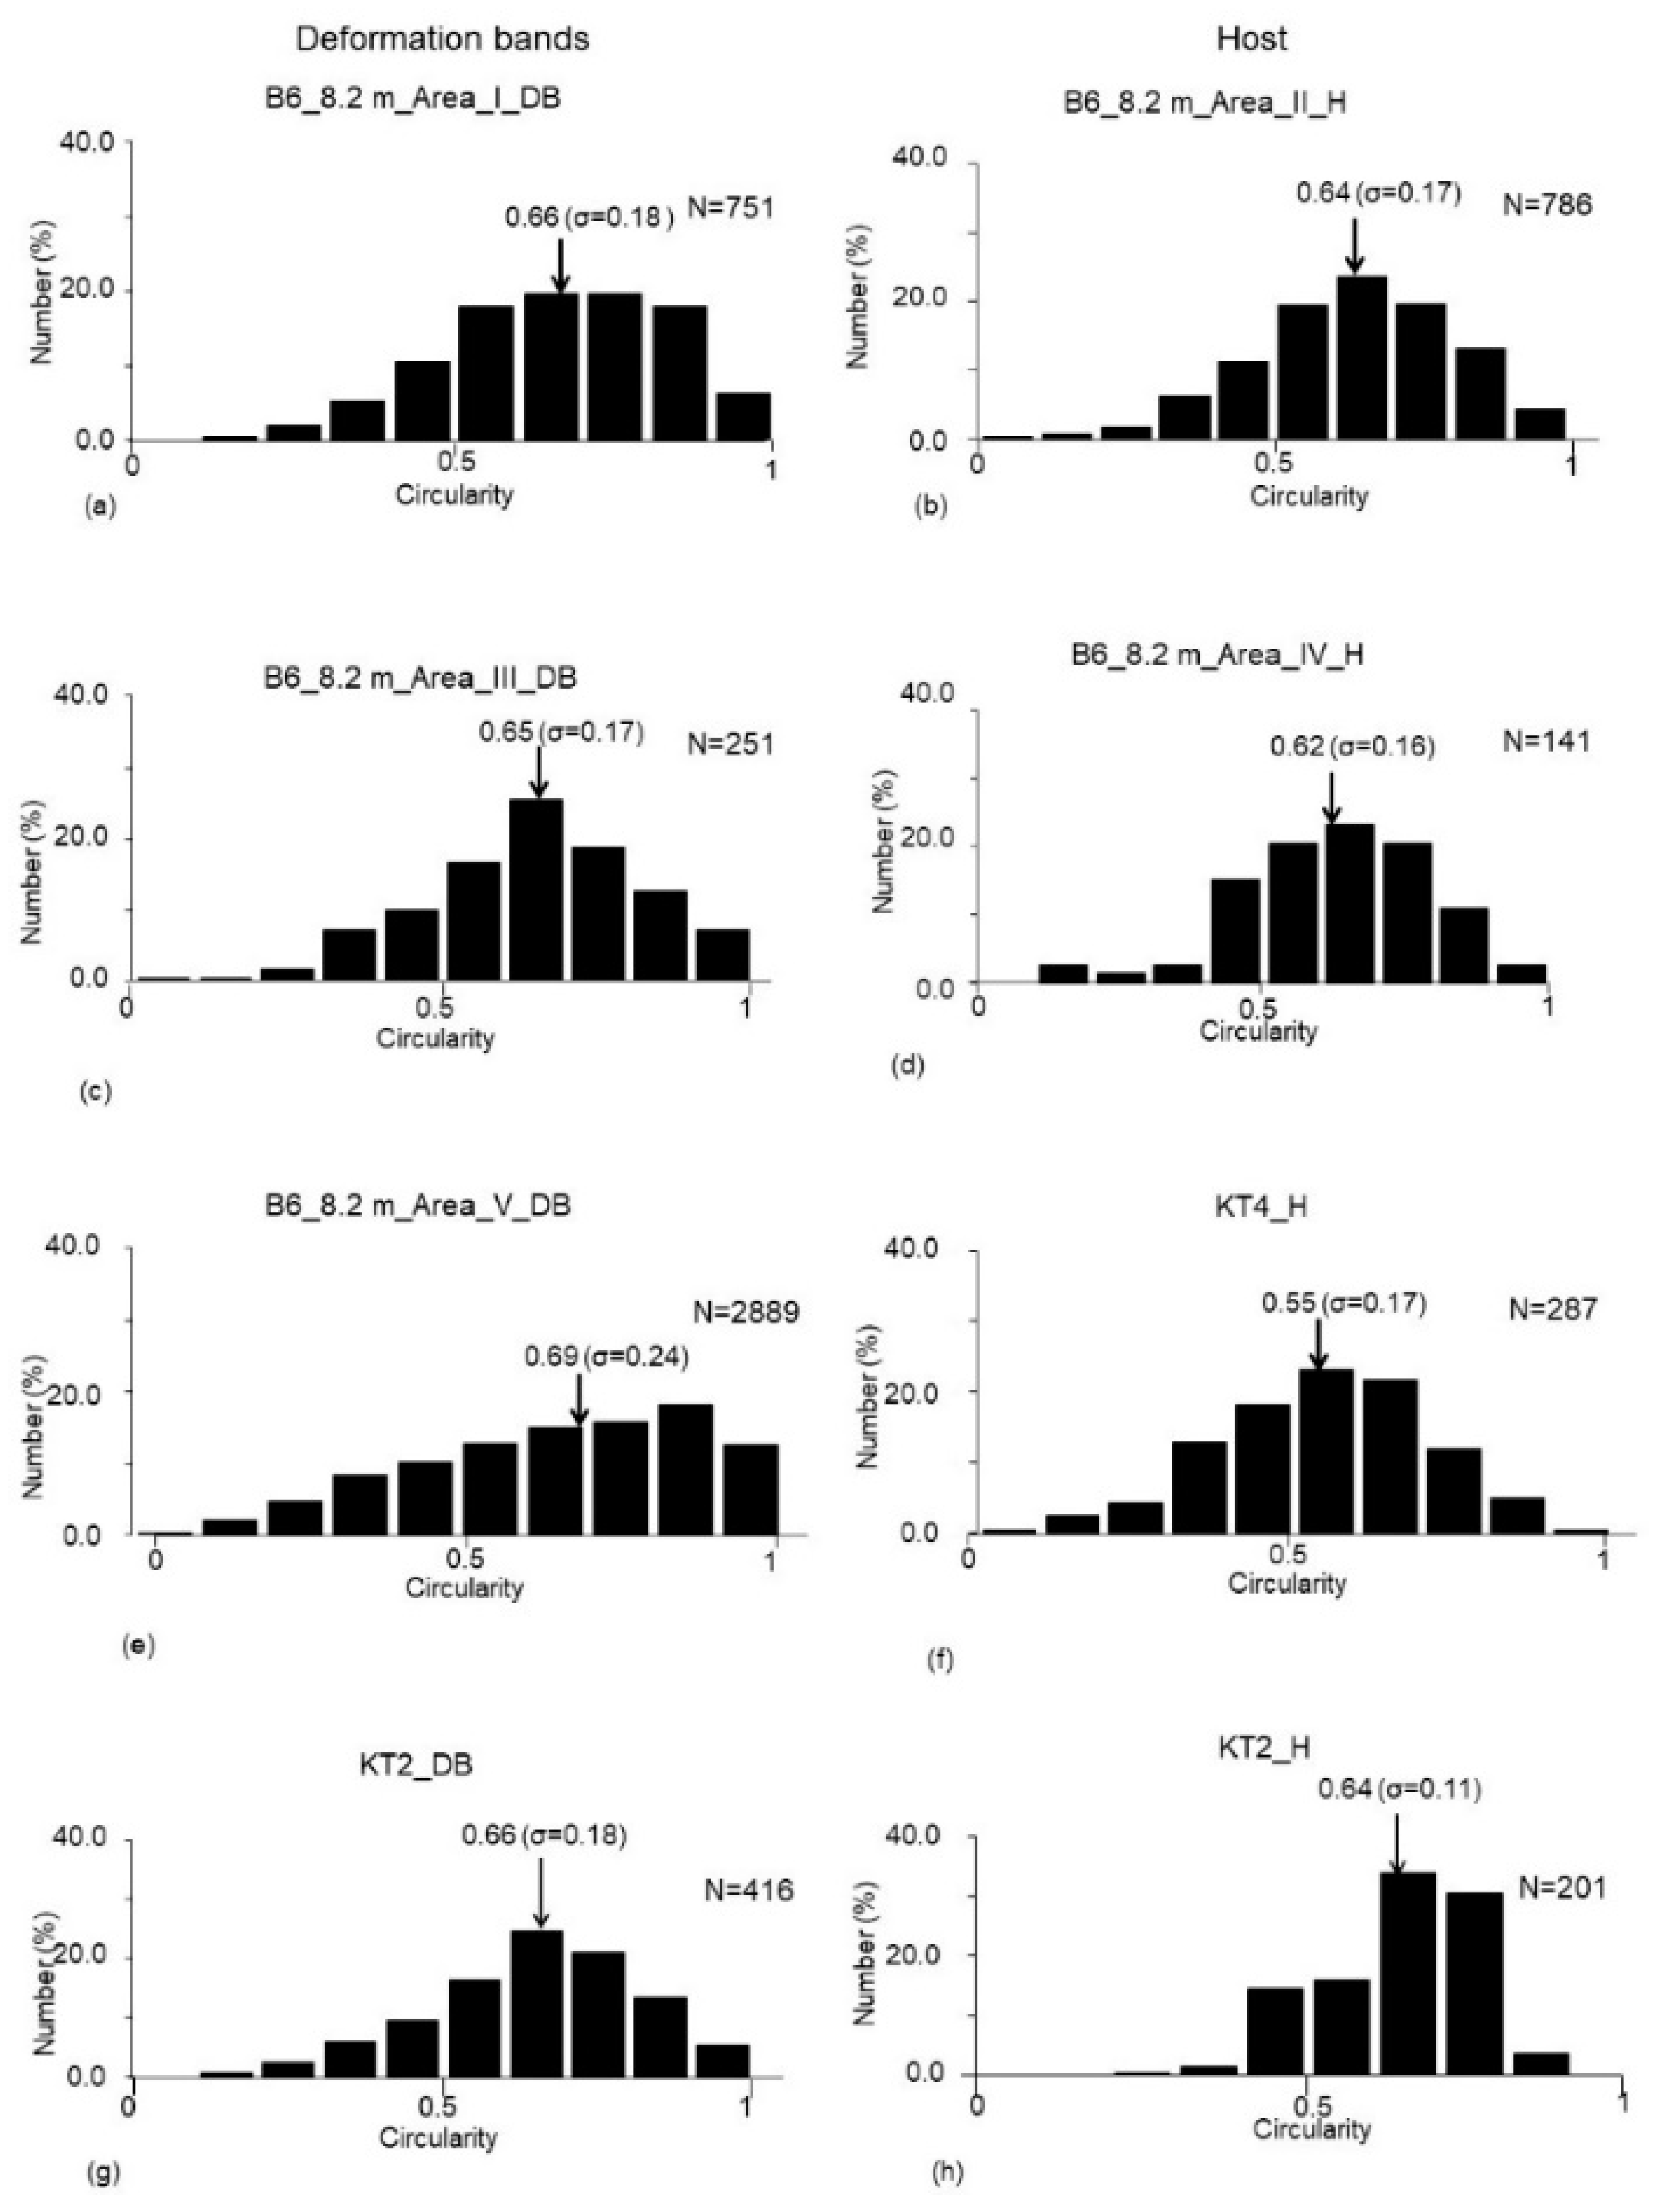
4.2.2. Image Analysis

Image analyses have been conducted for three areas in deformation bands (B6_8.2 m_ Area I _DB, B6_8.2 m_Area III_DB and B6_8.2 m_Area V_DB), and two areas in host grains (B6_8.2 m_Area II_H and B6_8.2 m_Area IV_H) from borehole core sample B6 (Figure 5a). In addition, one area for each host part and deformation band in a fine- to medium-grained sandstone from the Shakubetsu Formation (KT2) was analyzed. Further, one area in host parts of a fine- to medium-sandstone sample from an outcrop of the Shitakara Formation (KT4), where no deformation bands developed, was analyzed for a reference to host parts.
First, an example of data acquisition with GIMP for the image analysis was shown for one area in deformation bands (B6_8.2 m_Area V_DB, Figure 9). The outline of detrital grains was relatively well acquired based on the comparison between the microphotographs (Figure 9a) and images processed by GIMP (Figure 9b). The diagram of the area frequency versus logarithmic grain size (D) was subsequently constructed for all the areas of host parts and deformation bands in different samples (Figure 10). In addition, the diagram of cumulative logarithmic frequency versus logarithmic grain size (D) was constructed for all areas in the different samples (Figure 11). Further, the histogram of aspect ratio R (Figure 12), the orientation distribution of the long axis of detrital grains (Figure 13), and the histogram of the circularity C (Figure 14) was obtained for all areas in the different samples.
The average grain sizes in the deformation bands were significantly smaller, which are 29 μm, 30 μm and 24 μm for the deformation bands areas I, III and V, than those in the host parts, which were 47 μm and 135 μm for the areas II and IV of borehole core sample B6 (Figure 10). In outcrop sample KT2, while the average grain size in the host area was 148 μm, that in the deformation band was 33 μm. In outcrop sample KT4, the average grain size was 109 μm. The logarithmic grain size distribution in outcrop sample KT4 was similar to that in the host area in outcrop sample KT2, which was also like that in one host area (B6_8.2 m_Area IV_H) from borehole core sample B6 (Figure 10). However, the average grain size in another host area (B6_8.2 m_Area II_H) was significantly smaller than that in the area B6_8.2 m_Area IV_H. Therefore, the grain sizes of undeformed sandstones were reduced to sizes less than one-half to one-fifth of the original ones by cataclasis to form deformation bands. It should also be noted that the frequency distributions of these grain sizes in the host areas generally showed a log-normal distribution, while those in the deformation band areas are negatively skewed (Figure 10).
The cumulative logarithmic frequency (N) of logarithmic grain size (D) clearly indicated that the distribution follows a power law (i.e., fractal distribution) in deformation bands areas, while it is exponential in host areas (Figure 11). Here, the power law distribution is expressed as N = cD−n, where c is constant, and n is the fractal dimension. Comparable results have been reported in deformation bands from the ancient accretionary sediments in southwest Japan [50], where the deformation bands are a cataclastic web. The negative slope of the cumulative frequency (i.e., fractal dimension, n) varies between 2.1 to 2.7 for deformation bands in borehole core sample B6 and 1.3 for that in outcrop sample KT2. These n-values were comparable to a natural one (2.5) by [50] and those for naturally and experimentally fractured rocks (0.8 to 2.5) summarized by [51]. The reasons for the cause of the difference in n-value between the core and outcrop samples are unknown.
The average aspect ratios in the deformation bands varying between 1.9 to 2.3 were nearly equal to those in the host areas varying between 2.1 to 2.3 for B6 core samples (Figure 12). Also, the shape of the histogram was not very different between the deformation bands and host areas. The aspect ratio was significantly smaller (1.9) only in the area B6_8.2 m_Area V_DB than those in the host areas, where fracturing of detrital grains was most pervasive based on the grain size distribution (Figure 10). This fact was consistent with the results by [44]. The average aspect ratio (2.1) was slightly higher in the deformation band area (1.9) than that in the host area for outcrop sample KT2. The result was not consistent with that of [44]. This could have been caused by the replacement of detrital grains with lower R-values (less than 1.6) by the fractured grains with higher R-values to form deformation bands (Figure 12).
In the host areas of both B6 core and outcrop samples, the overall distributions of grain long-axis were generally random (Figure 13, rose diagrams). The grain long-axis tended to be more parallel oriented to the deformation bands in the deformation band areas than in the host areas for both B6 core and outcrop samples, consistent with the results from [44]. This fact could indicate that the fractured grains became reoriented to be parallel to the deformation bands by compaction and shear during the formation.
The average circularities (Cs) in the deformation bands varying between 0.65 to 0.69 were slightly higher than those in the host areas varying between 0.55 and 0.64 in both borehole B6 core and outcrop samples (Figure 14), consistent with [44]. Further, it is important to note that the histograms showing a normal distribution in the host areas become not only flattened, but also negatively skewed in the deformation bands areas. The tendency was most significant in the most pervasively fractured area B6_8.2 m_Area V_DB. The increase in the average circularity might be caused by the flaking of asperities of detrital grains [44].

4.3. Vitrinite Reflectance

The vitrinite reflectance of coal layers from two borehole core samples (B4_5.3 m and B6_8.6 m, Figure 3b,c) and one outcrop sample (KT5, see Figure 1b and Figure 2a for the locality) was measured. Results of vitrinite reflectance (%RO) measurements are shown in Table 4, which was around 0.5 for all the analyzed three samples. Many authors have calibrated the maximum temperatures (T) using vitrinite reflectance (%RO), from which we adopted the following calibration—Equation (4)—created in [52], which yielded the inferred temperatures around 50 °C for all the analyzed three samples (Table 4).
T = 9.7 × ln (%RO) + 54.1

5. Discussion

5.1. Types and Conditions for the Formation of Deformation Bands

Deformation bands can be classified into categories: kinematics and deformation mechanisms [2,3]. The two classifications are not completely independent but rather related in some cases. For example, compactional shear bands (CSBs [4,53]), shear-enhanced compaction bands (SECBs [6,54,55]) and pure compaction bands (PCBs [54]) could only form as cataclastic deformation bands [3,53,55]. Since the formation of cataclastic deformation bands is accompanied by volume reduction of the pore space in deformation bands, the cataclastic bands are considered as CSBs, SECB or PCBs formed under contractional settings [3]. In some of the present deformation bands, since the grain sizes of the host sandstones are significantly reduced by cataclasis, they could be considered as cataclastic deformation bands. Hence, these deformation bands could be classified as CSBs, SECBs or even PCBs.
Some shear bands from outcrop sample KT2 occurred as conjugate sets. This fact precluded these deformation bands from pure compaction bands (PCBs). The difference between the CSBs and SECBs is in the shear versus compaction ratio (S/C): when the S/C is greater than one, it is called as CSBs, while it is called as SECBs when it is around one [4,6]. The S/C ratio can be inferred from the shear strain inferred from the direct measurements of displacement along deformation bands and the compaction ratio from the difference in porosity between the host and deformation bands (e.g., [6]). In the present study, we have not made any such analyses to infer the ratio of S/C. On the other hand, the dihedral angle between conjugate deformation bands could be used to distinguish the types of deformation bands. According to a review of the dihedral angle between conjugate deformation bands [3], it varies between 40 to 75° for CSBs, while it is in the range of 70 to 100° for SECBs. Therefore, the present conjugate deformation bands with the dihedral angle of c. 60° are most reasonably interpreted as CSBs.
Although the present deformation bands formed in the borehole core sample B6_8.2 m can be classified as cataclasic bands, almost all of the deformation bands in outcrop samples KT1, 2 and 3 could be classified as phyllosilicate bands with little cataclasis [2]. We could not interpret why cataclastic bands formed in the borehole core samples while phyllosilicate bands formed in the outcrop samples. However, it could be ascribed to the difference in the amount of strain as mentioned below (i.e., higher strain in the borehole core samples than in the outcrop samples). In sample KT2, cataclasis occurred in the conjugate deformation bands (Figure 7b,c), while it little occurred in other deformation bands, which are only defined by the preferential orientation of altered biotite grains (phyllosilicate bands, Figure 7a). Therefore, it seems that the phyllosilicate bands could have developed into the cataclastic conjugate bands due to strain hardening associated with grain interlocking with increasing strain (e.g., [2]). In fact, altered biotite grains were also preferentially orientated along the cataclastic conjugate bands (Figure 7b,c), which perhaps occurred before the onset of cataclasis.
To discuss the mechanism for the formation of deformation bands, we investigated the formation conditions and phyllosilicate contents because the mechanisms were dependent on the two factors [2]. The temperature and pressure (i.e., depth) conditions could be first inferred from the burial depth of the strata, where the deformation bands were inferred to have been formed. Although the timing of the formation of deformation bands was not well constrained, it could be inferred that they formed after the Late Miocene (c. 7 Ma) when both Eocene Urahoro Group and Upper Miocene (c. 7 Ma) Atsunai Formation were folded together. If we assumed that the deformation bands formed at the maximum burial depth, the formation depth could be calculated as much as c. 2.7 km, which is the total thickness of the Shakubetsu Formation of the Urahoro Group (c. 0.3 km), Onbetsu Group (c. 0.4 km) and the Upper Miocene Atsunai Formation (c. 2 km) (see Table 1). Here, the unknown eroded overlying strata were neglected. From the paleotemperature c. 50 °C inferred from the vitrinite reflectance values (%RO) of the coal layers (c. 0.5), the burial depth could be inferred to be 1.5–2.5 km, assuming a geothermal gradient of 20 °C in the forearc region and a surface temperature of 0 to 20 °C. Therefore, the buried depth inferred from the thickness of the overlying sediments was consistent with that inferred from the vitrinite reflectance values within error. The volume fractions of phyllosilicate in borehole core sample B6_8.2 m and outcrop samples KT 1, 2 and 3 vary around 10%. Therefore, according to the mechanism diagram for the formation of deformation bands as a function of the burial depth and phyllosilicate content [2], the present conditions corresponded to the boundary region between the formations of phyllosilicate and cataclastic bands, consistent with the present observations.

5.2. Strain Localization in the Flexure and Implications in Tectonics

We have not found any occurrence of deformation bands in the study area other than the boreholes (B4, 5 and 6) and outcrops where samples KT1, 2 and 3 were collected. Therefore, these deformation bands only occurred in the sandstones of the Shakubetsu Formation, which includes mudstones and coal layers other than sandstones, not in sandstones from the uppermost unit of the Shitakara Formation, which solely consists of sandstones. It should be noted that these deformation bands are oriented nearly parallel or slightly oblique to the bedding of strata, and they are also considered to be CSBs or SECBs formed in the flexure under the setting of a strong contraction. Therefore, these deformation bands could have formed by overall layer-parallel shortening, which also yielded a component of layer-parallel shearing (samples B6_8.2 m, KT1 and 3) and the conjugate shear plane (sample KT2) during the initial stage of flexure formation, as schematically illustrated in Figure 15. It has also been shown by [7] that bedding-parallel deformation bands formed during the initial stage of folding in the Jurassic Navajo Sandstone, San Rafael monocline, Utah, USA, when the dip of forelimb was around 25°.
It has been shown that deformation bands were localized around a regional thrust, and conjugate sets of SECBs formed at an early stage of buckling in the stress concentration area at the thrust tip [4,56]. In the present case, fault gouges in borehole sample B4_5.1 m could be interpreted to constitute the fault core, which was surrounded by a damage zone characterized by the pervasive development of deformation bands in the borehole core sample B6_8.2 m and outcrop samples KT1, 2 and 3. This fact suggested that the present deformation bands also developed in relation to thrusting, although the sense of shear in the gouge from borehole core sample B4_5.1 m could not be constrained. It has been recently described that the layer parallel deformation bands could have formed as R-bands in combination with the formation of Y- and P-bands in the initial stage of folding in a monocline consisting of the Upper Triassic to Lower Jurassic sandstones in the western United States [9]. The composite planar structures could be compared with those found in B4_5.1 m (Figure 4) and B6_8.2 m (Figure 5c) core samples. If this is correct, the present gouge and deformation bands could have also formed in the early stage of flexure formation. Accordingly, the composite planar structures in gouge in core sample B4_5.1 m (Figure 4) and layer parallel deformation bands (Figure 5a,b) and oblique foliation (Figure 5c) in core sample B6_8.2 m could be correlated with R- and Y- or P-bands (Figure 15, [9]).
It could be inferred that this flexure, which perhaps accompanies a blind thrust (Figure 15), developed in the Shakubetsu Formation because this formation containing mudstones and coal layers other than sandstones could be much weaker than the sandstone unit of the Shitakara Formation. Therefore, the weakest part in the studied Urahoro Group could have been selected for the development of flexure accompanied by the formation of deformation bands and gouge.
Finally, we would like to emphasize the following points. As far as we know, this study first reported that deformation bands developed in arkosic sandstones from forearc fold-and-thrust belts in the Japanese Islands. Although deformation bands have been reported from the accretionary prism in the Nankai Trough region off Shikoku [57] and the Miura-Boso Peninsula, central Japan [58], the host materials are argillaceous or volcaniclastic sediments, and thus these deformation bands are not comparable to the present ones formed in arkosic sandstones. Furthermore, microstructures of fractured grains constituting the deformation bands have not been reported in these studies. On the other hand, the deformation bands reported in sandstones from the Cretaceous Shimanto Belt (accretionary prism), Japan [50] could be comparable to the present one, as mentioned above. However, in these deformation bands, pressure solutions were developed, indicating that these bands formed at higher temperatures than 100 °C and thus deeper levels than the present ones. We believe that deformation bands could have developed in other fold-and-thrust belts in both forearc and back-arc basin deposits in the Japanese islands and hope that such studies on the occurrences and microstructures of deformation bands could also become popular in Japan.

5.3. Structural Diagenesis

In the end, we would emphasize that weathering (i.e., alteration reaction) in the sandstones was enhanced by the cataclasis which formed deformation bands (reactive transport by [14]; structural diagenesis by [18]). For the case of phyllosilicate bands developed in outcrop samples KT1, 2 and 3, although cataclasis was not so apparent in detrital quartz and feldspar grains, cleavage fracturing in altered biotite grains indicated that cataclasis was significant, at least in detrital biotite grains. As described above, the alteration of biotite to vermiculite and further to kaolinite was certainly enhanced by the fluid percolation along cleavage fractures in detrital biotite grains. Also, the formation of authigenic clay minerals such as smectite occurred in the pore space created by fracturing in both detrital quartz and biotite grains (Figure 5e and Figure 6d). Although the influence of structural diagenesis on the potential causes of landslides in the study area was thoroughly discussed elsewhere, there was no doubt that the weathering (alteration) induced by the formation of deformation bands led to the occurrence of landslides. In particular, the formation of vermiculite and smectite was favorable for the formation of landslides [26], not only because it reduced the internal coefficient of friction [24,25], but because the swelling of these clay minerals reduced permeability by absorbing water [25], and thus led to pore-fluid pressure buildup in rocks.

6. Conclusions

From the field structural analyses at outcrops and microstructural and microchemical analyses of deformation bands that occurred in the study area, we have reached the following conclusions.
(1)
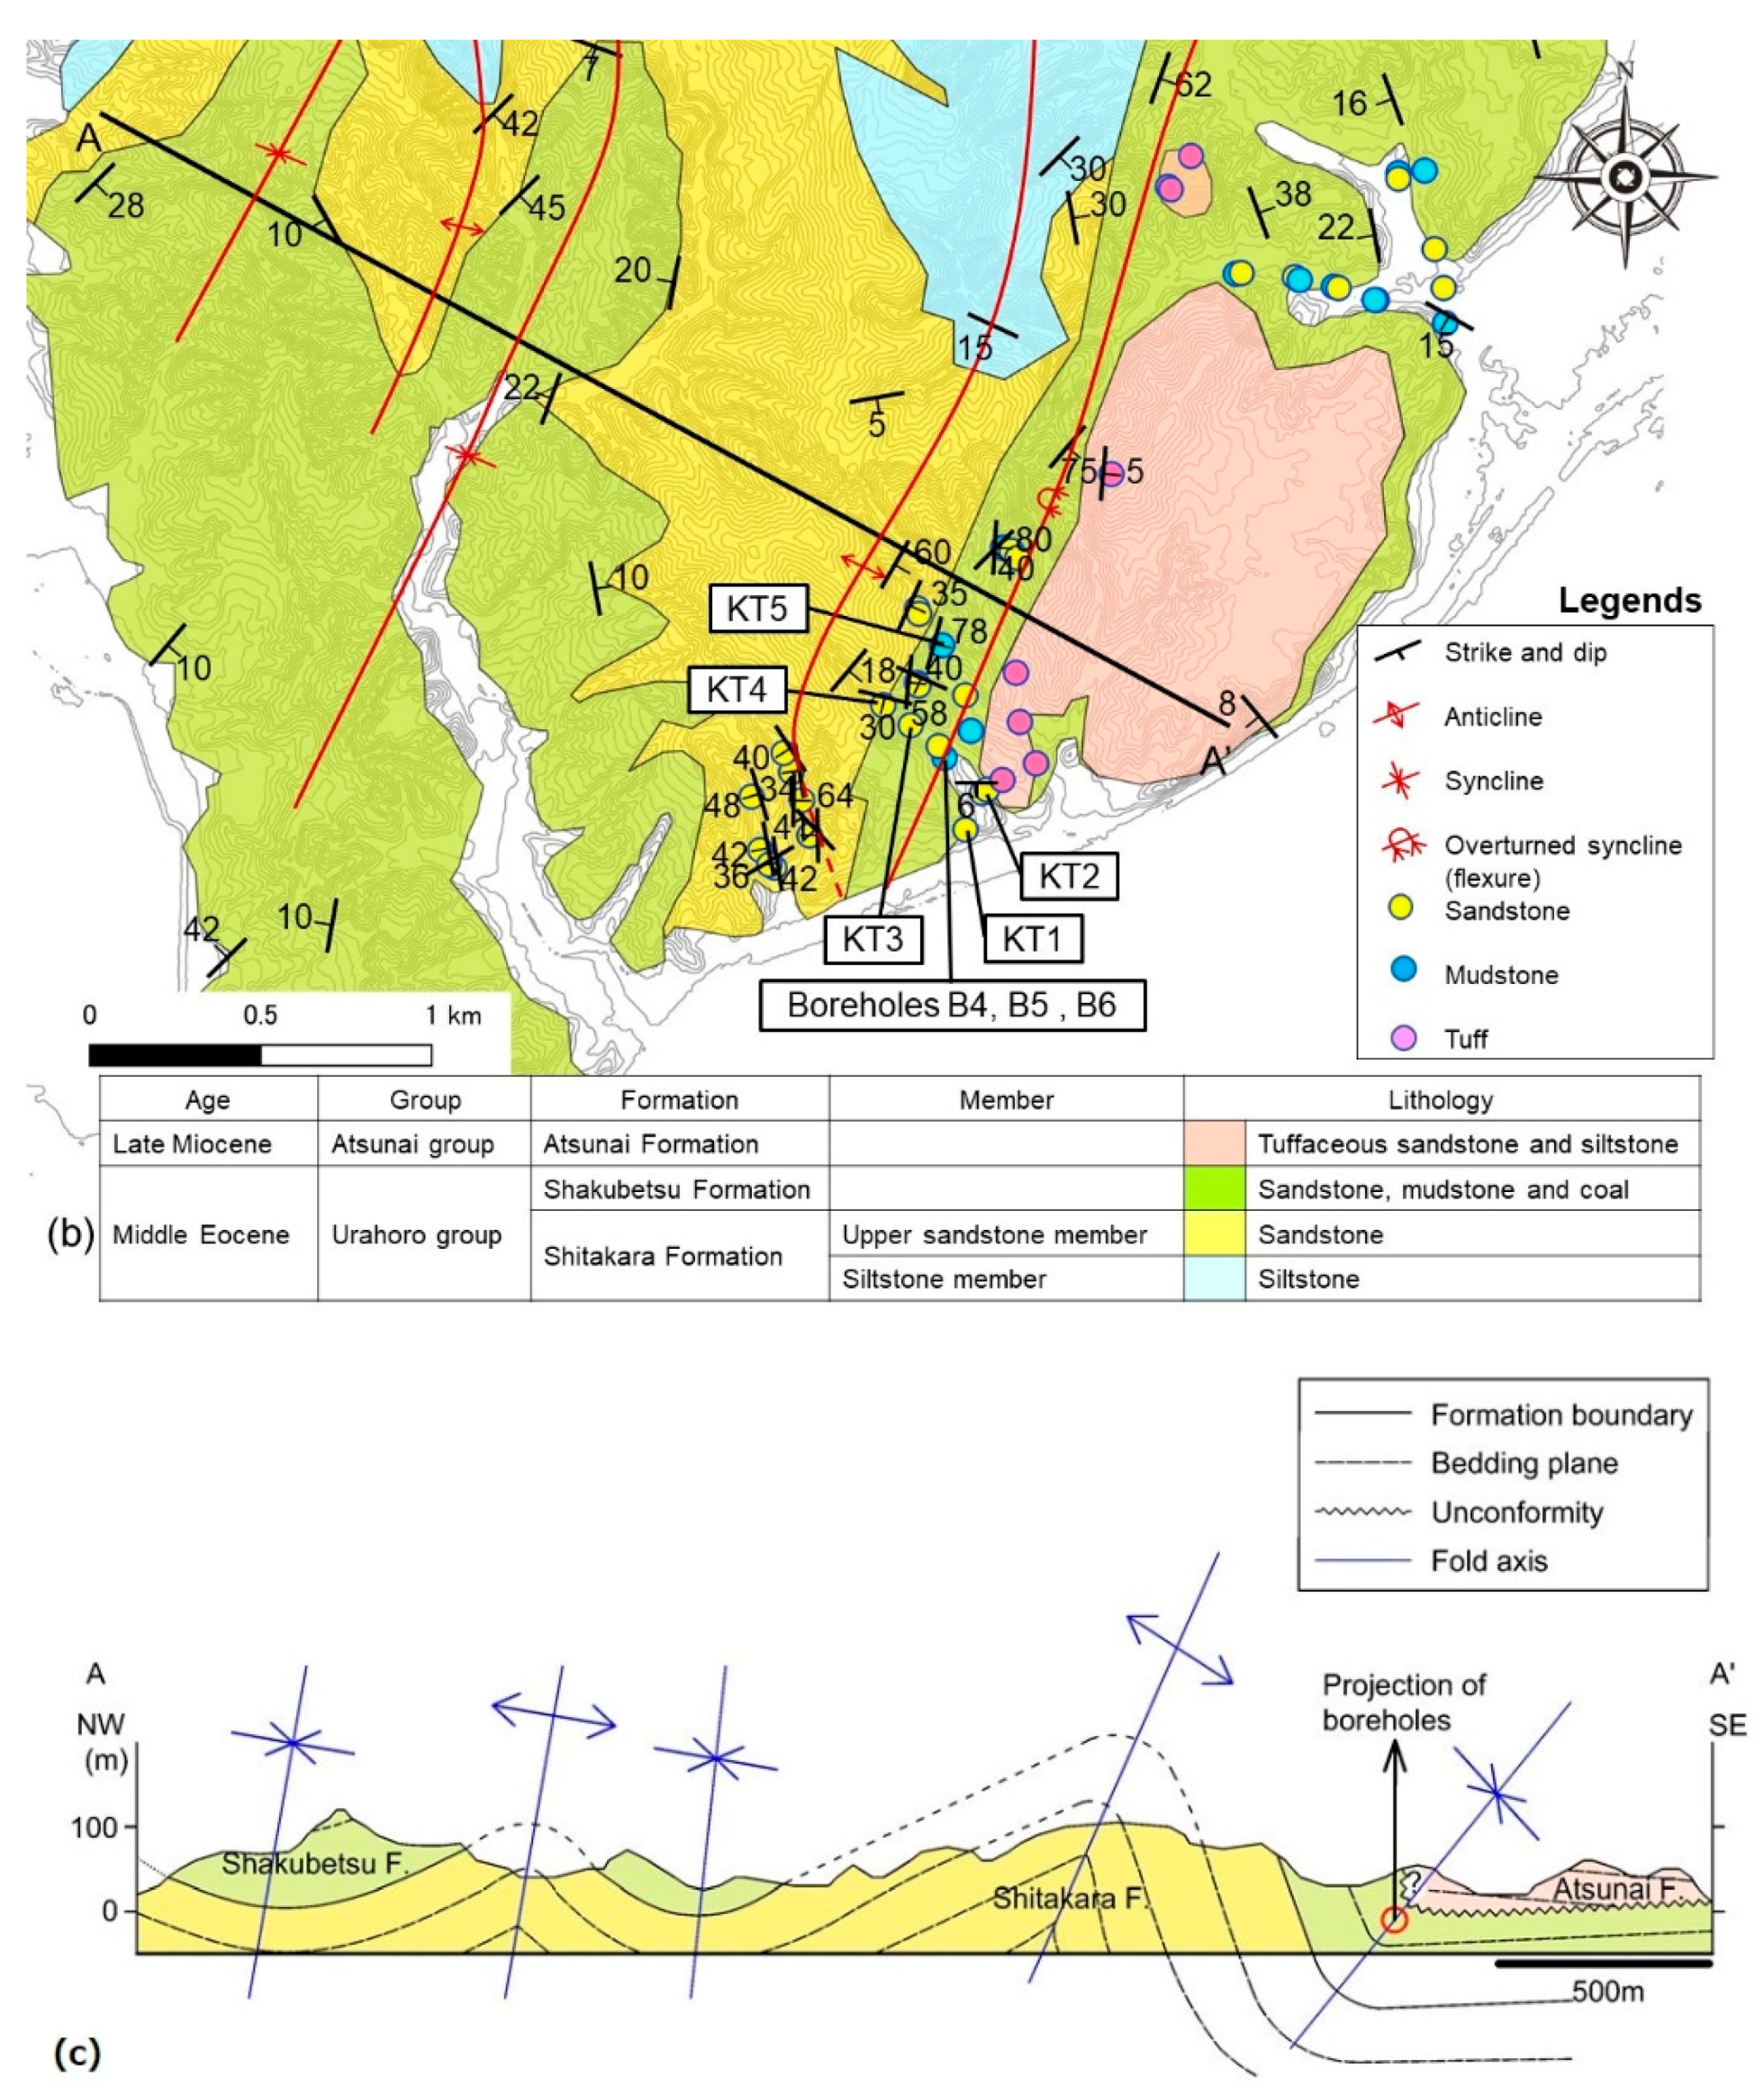
In the study area, the geologic structure of the Eocene Urahoro Group is characterized by a folded belt with a wavelength of 1–2 km. The strata generally dip either east or west at moderate angles. However, there is one flexure structure in the eastern part of the study area consisting of the Shakubetsu Formation, which trends NNE-SSW to NE-SW. The northwestern limb of the flexure very steeply dips SE at 75° to almost vertically, while the southeastern limb dips south at 6° (almost horizontally).
(2)
Deformation bands in this area only developed in the Shakubetsu Formation around the flexure, which contains mudstones and coal layers other than sandstones, not in the uppermost unit of the Shitakara Formation, which solely consists of sandstones. Therefore, it could be inferred that strain was localized in the weak Shakubetsu Formation, resulting in the development of flexure and deformation bands with increasing NW-SE trending shortening in the folded belt. This shortening deformation mostly occurred after the deposition of the Atsunai Formation dated c. 7 Ma.
(3)
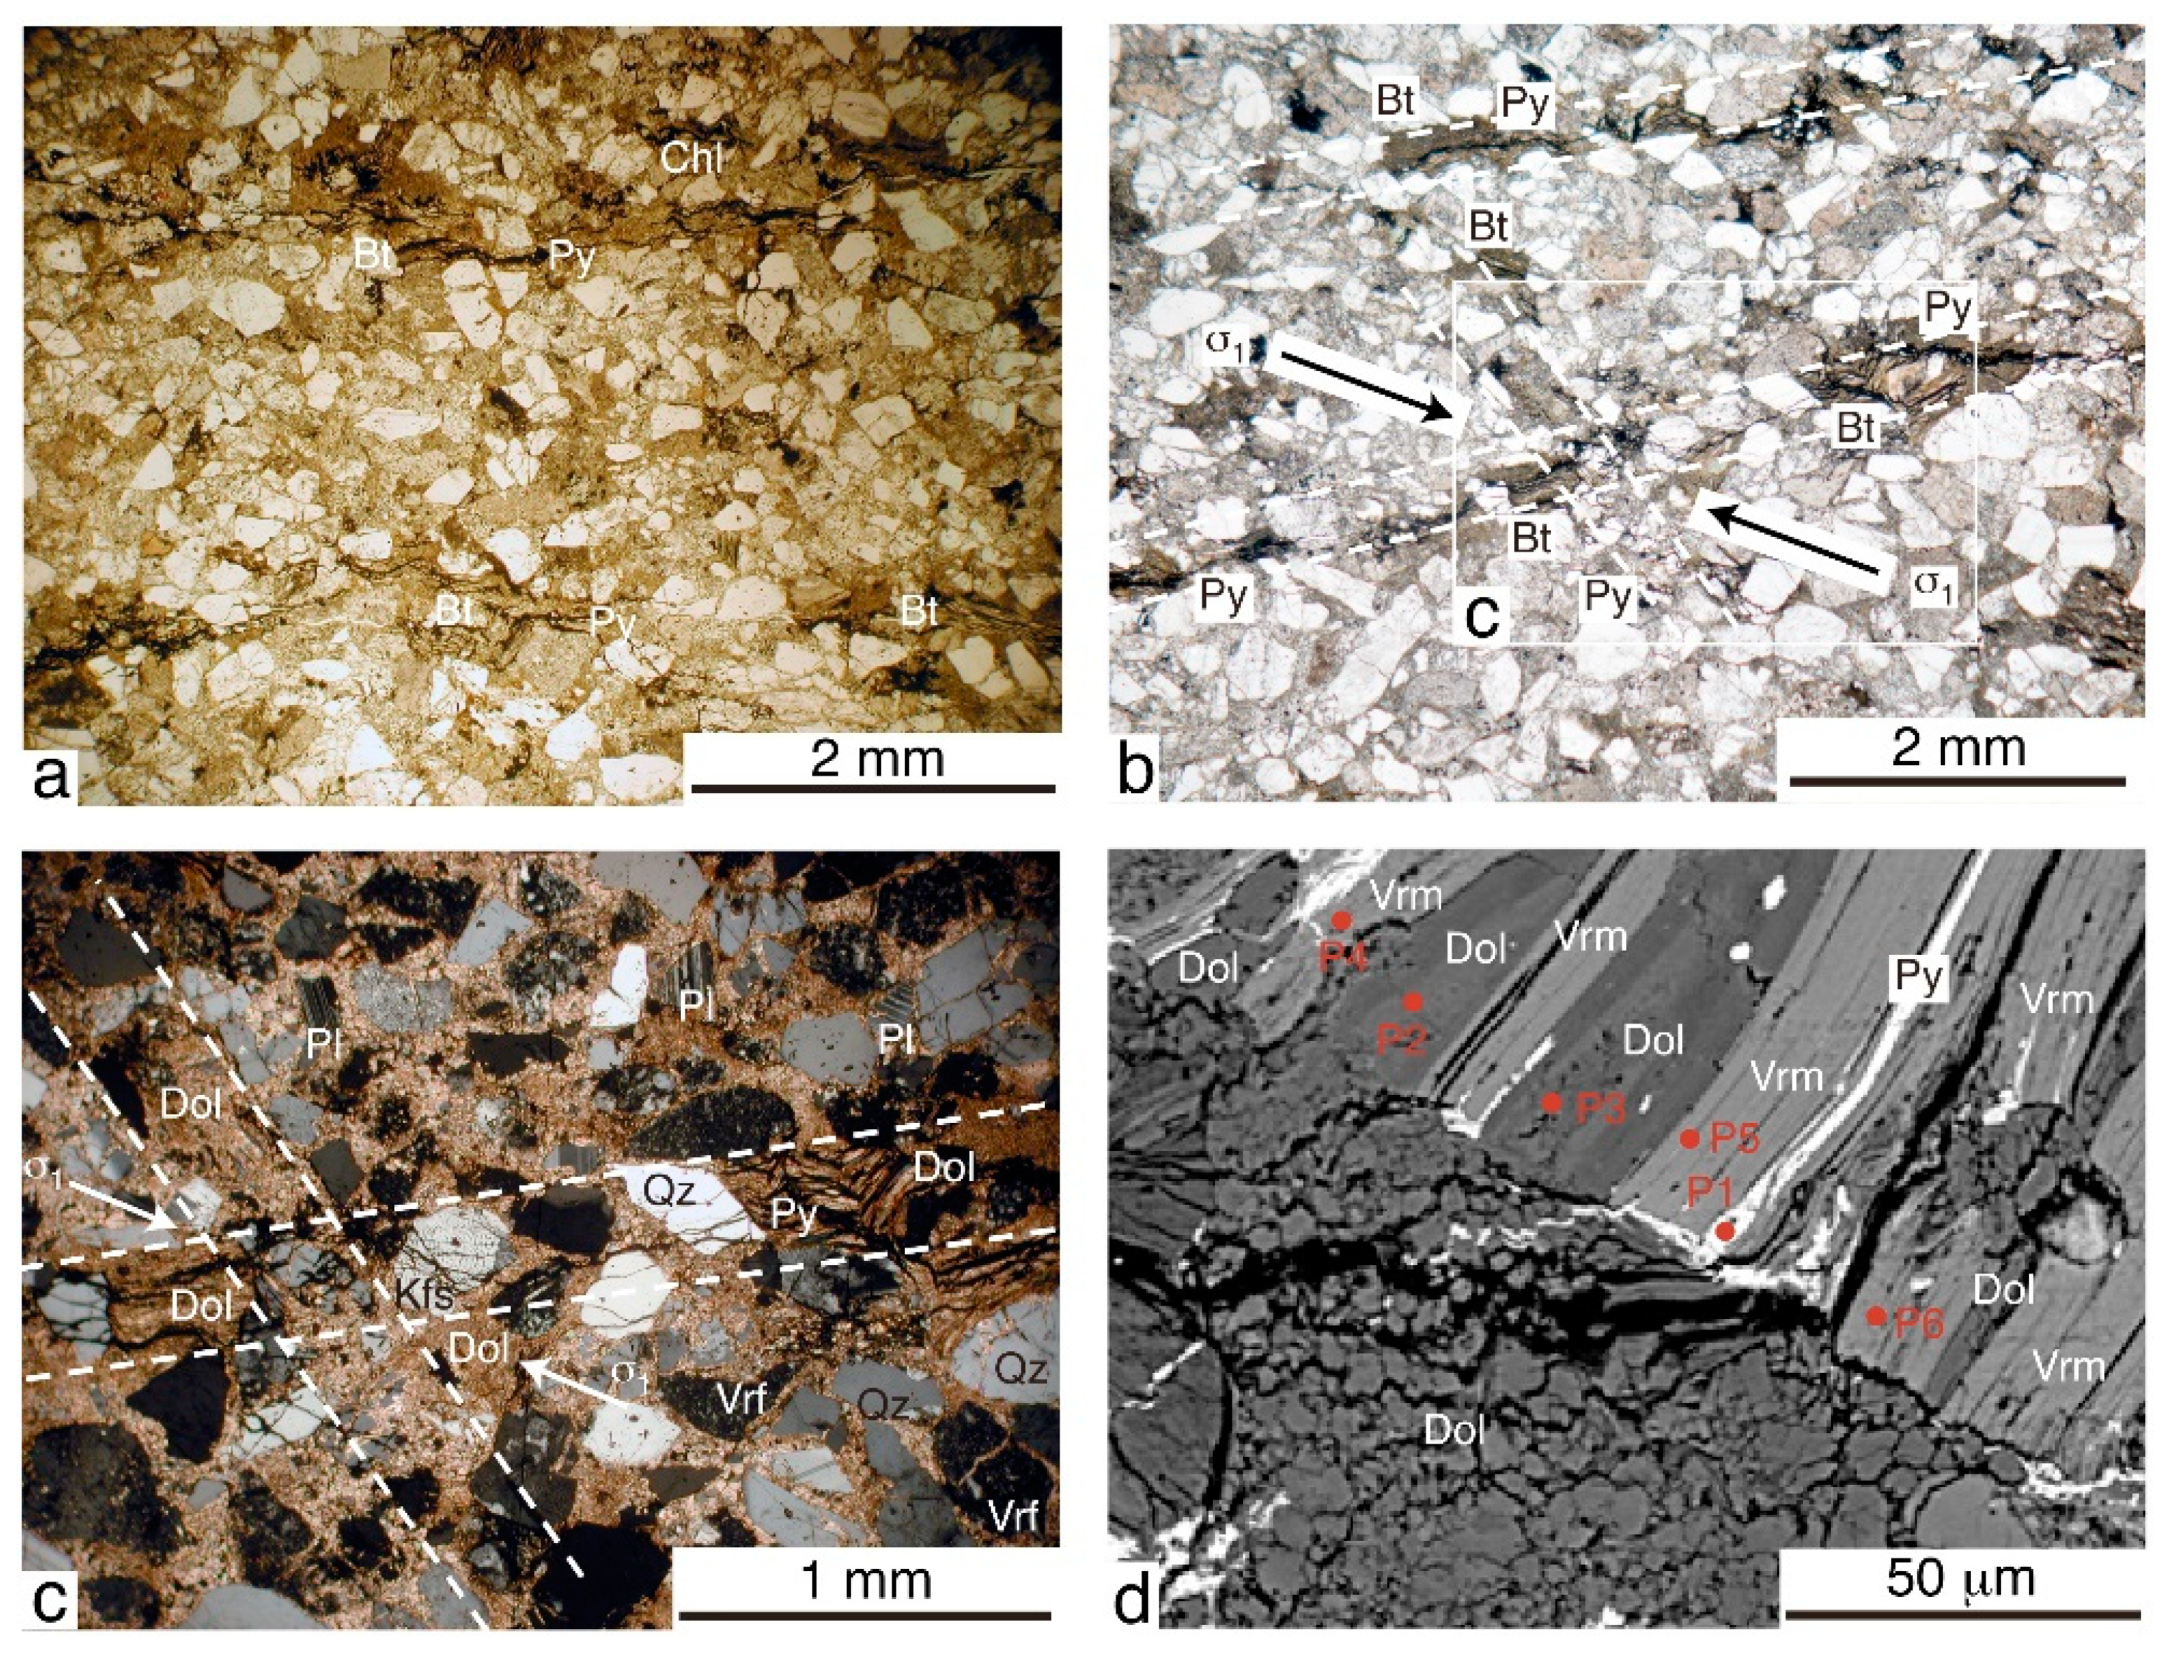
The temperature conditions for the formation of deformation bands were inferred to be c. 50 °C from the vitrinite reflectance values (%RO) of the coal layers (c. 0.5). The deformation bands could have formed at the maximum burial depth, which was inferred to be as much as c. 2.7 km from the thickness of the overlying strata. The depth estimate conforms to the one (1.5–2.5 km) inferred from the inferred temperature conditions, assuming the geothermal gradient of 20 °C in a forearc region and surface temperature of 0–20 °C. The deformation bands were inferred to have originated as phyllosilicate bands, which developed into the cataclastic bands with increasing strain in the Shakubetsu Formation with c. 10 vol.% of phyllosilicate.
(4)
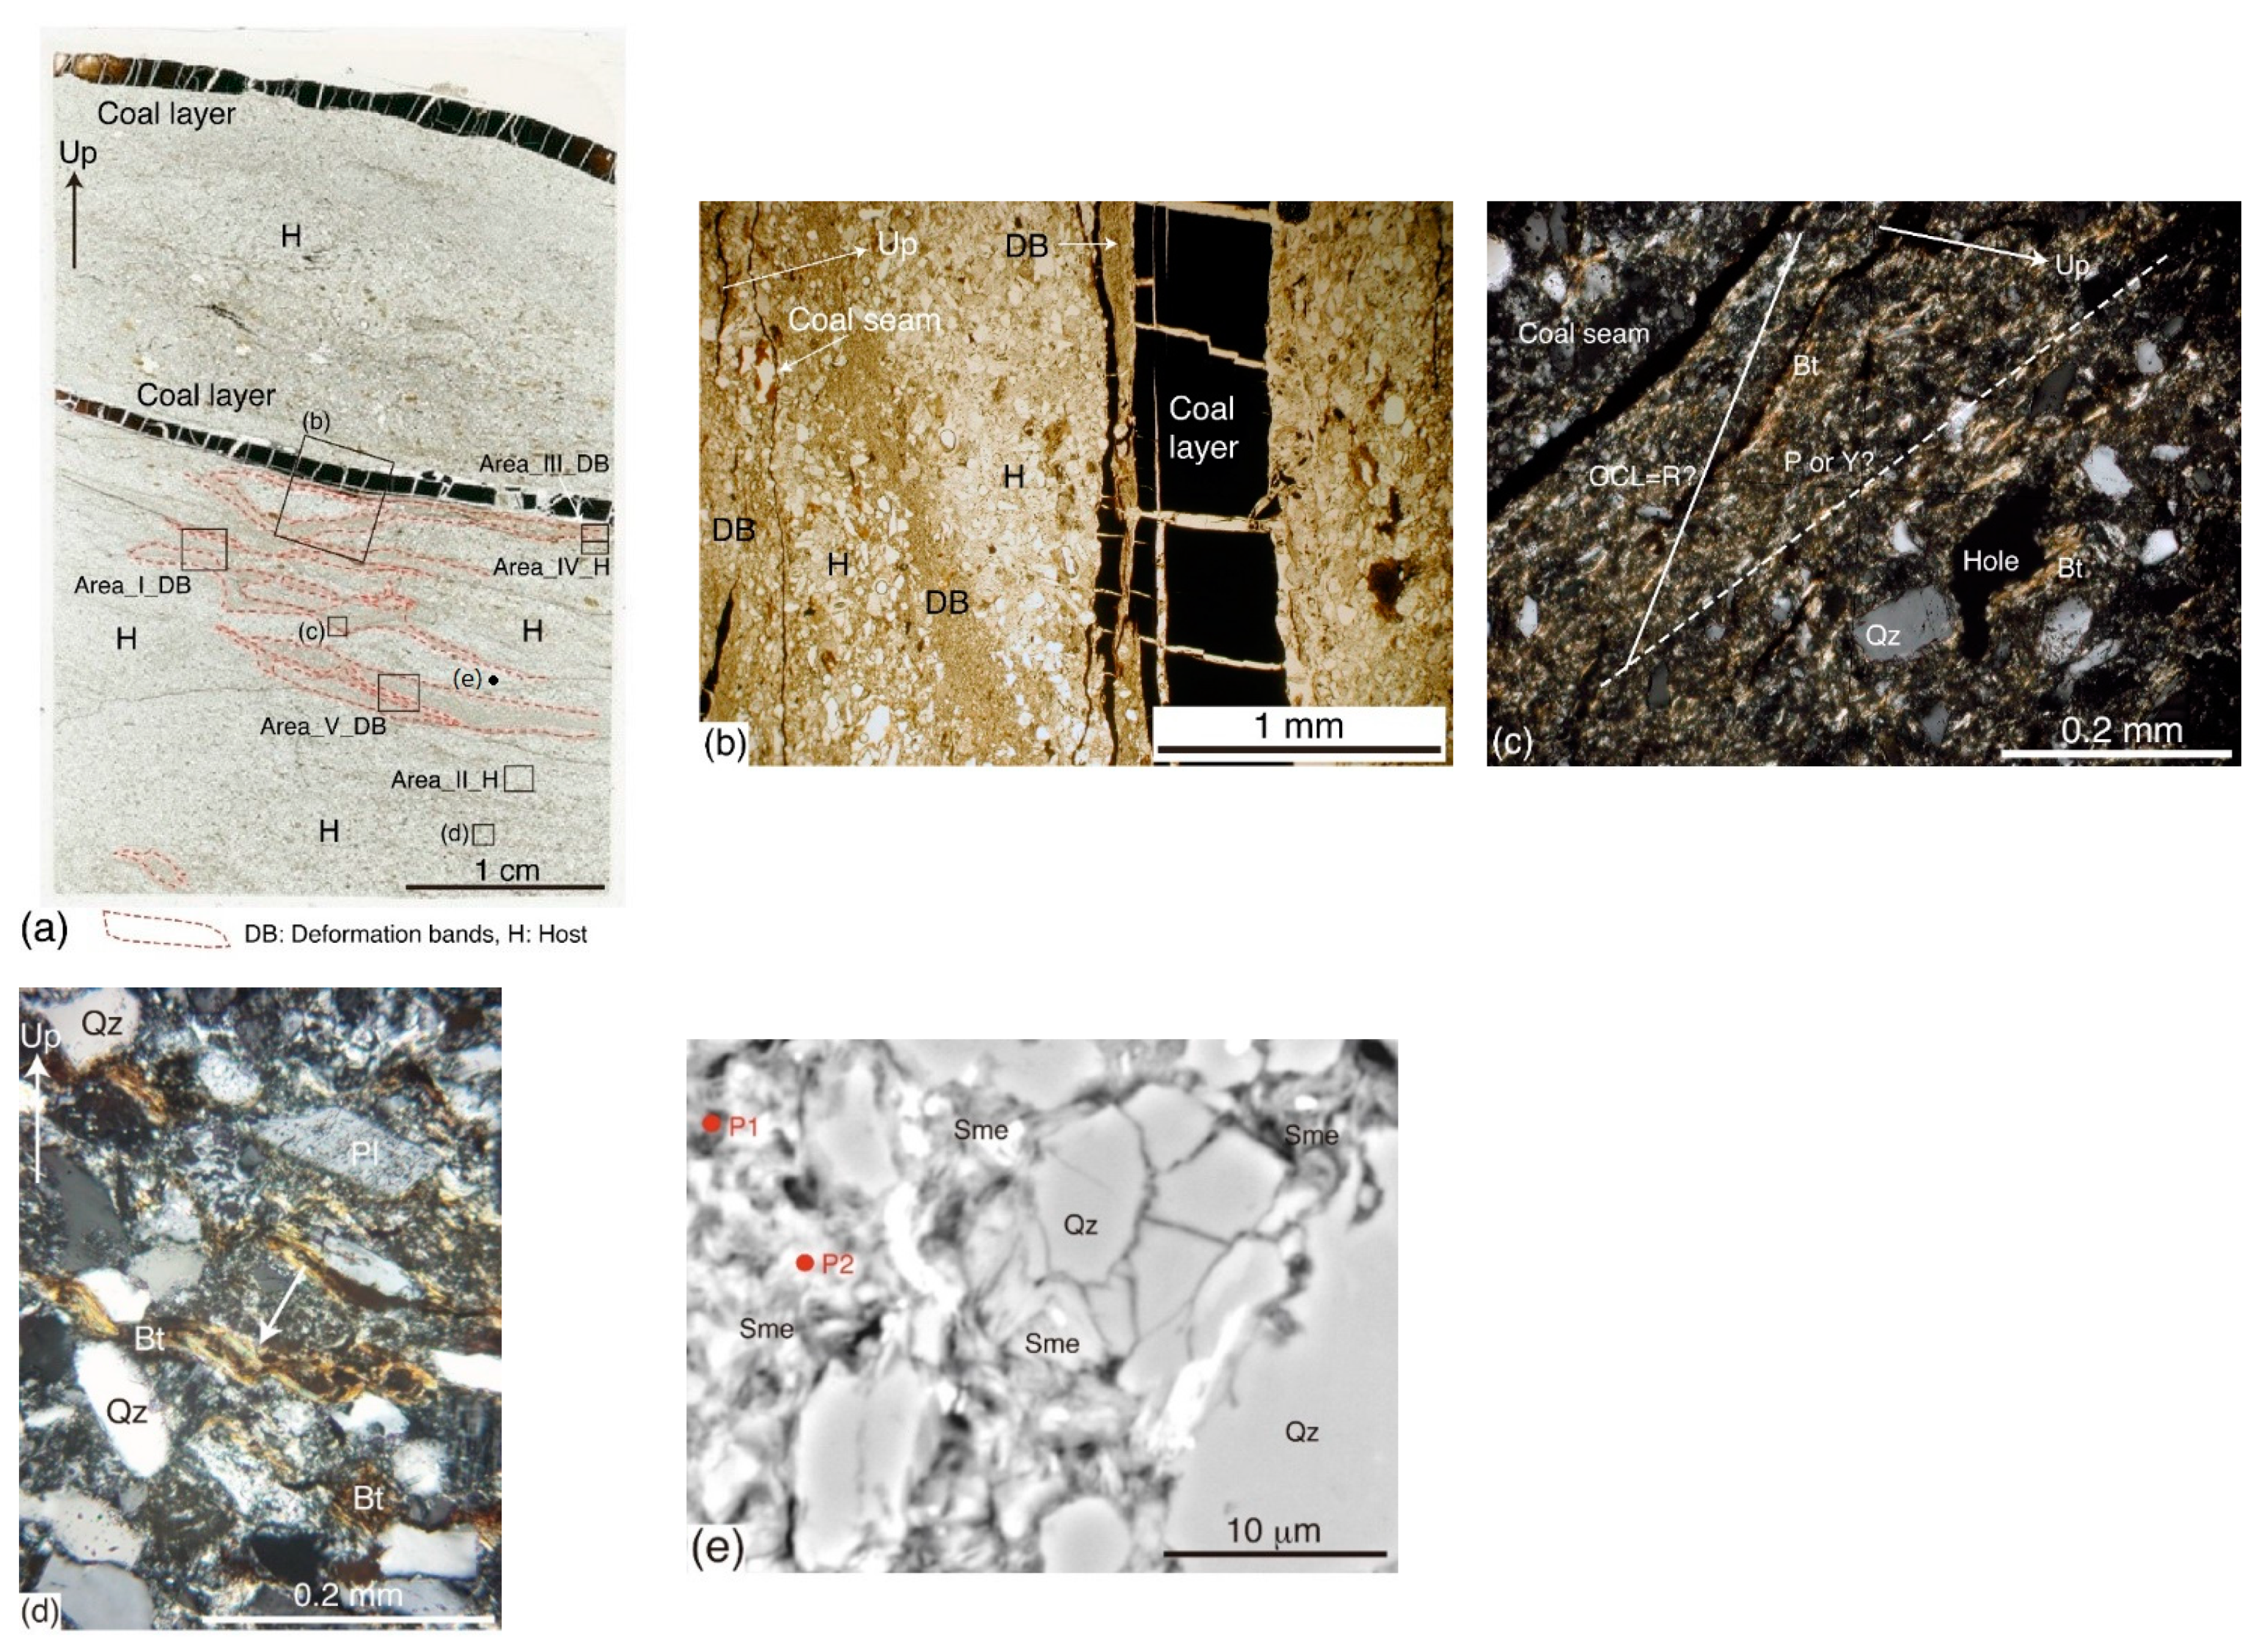
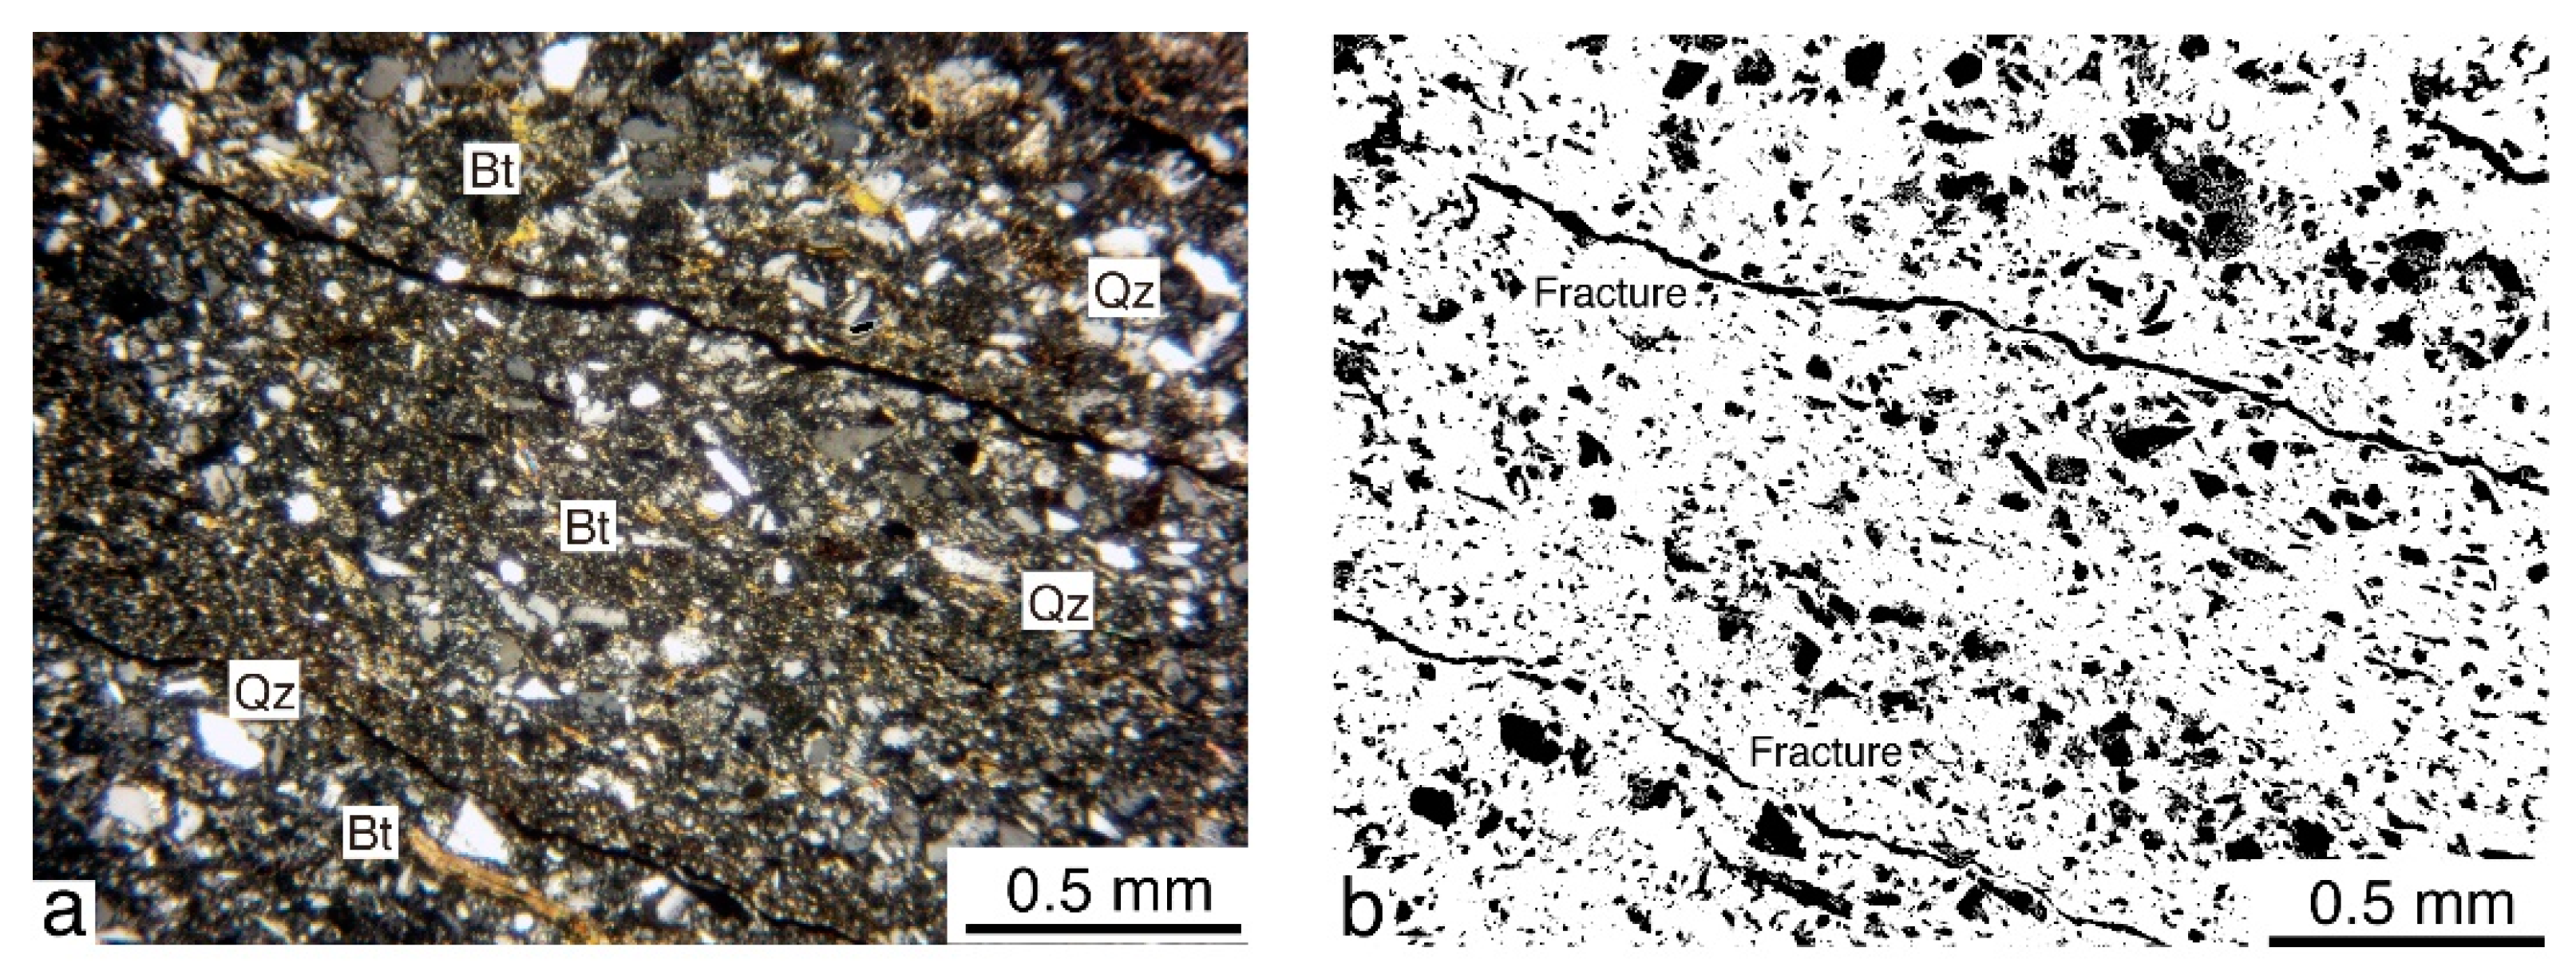
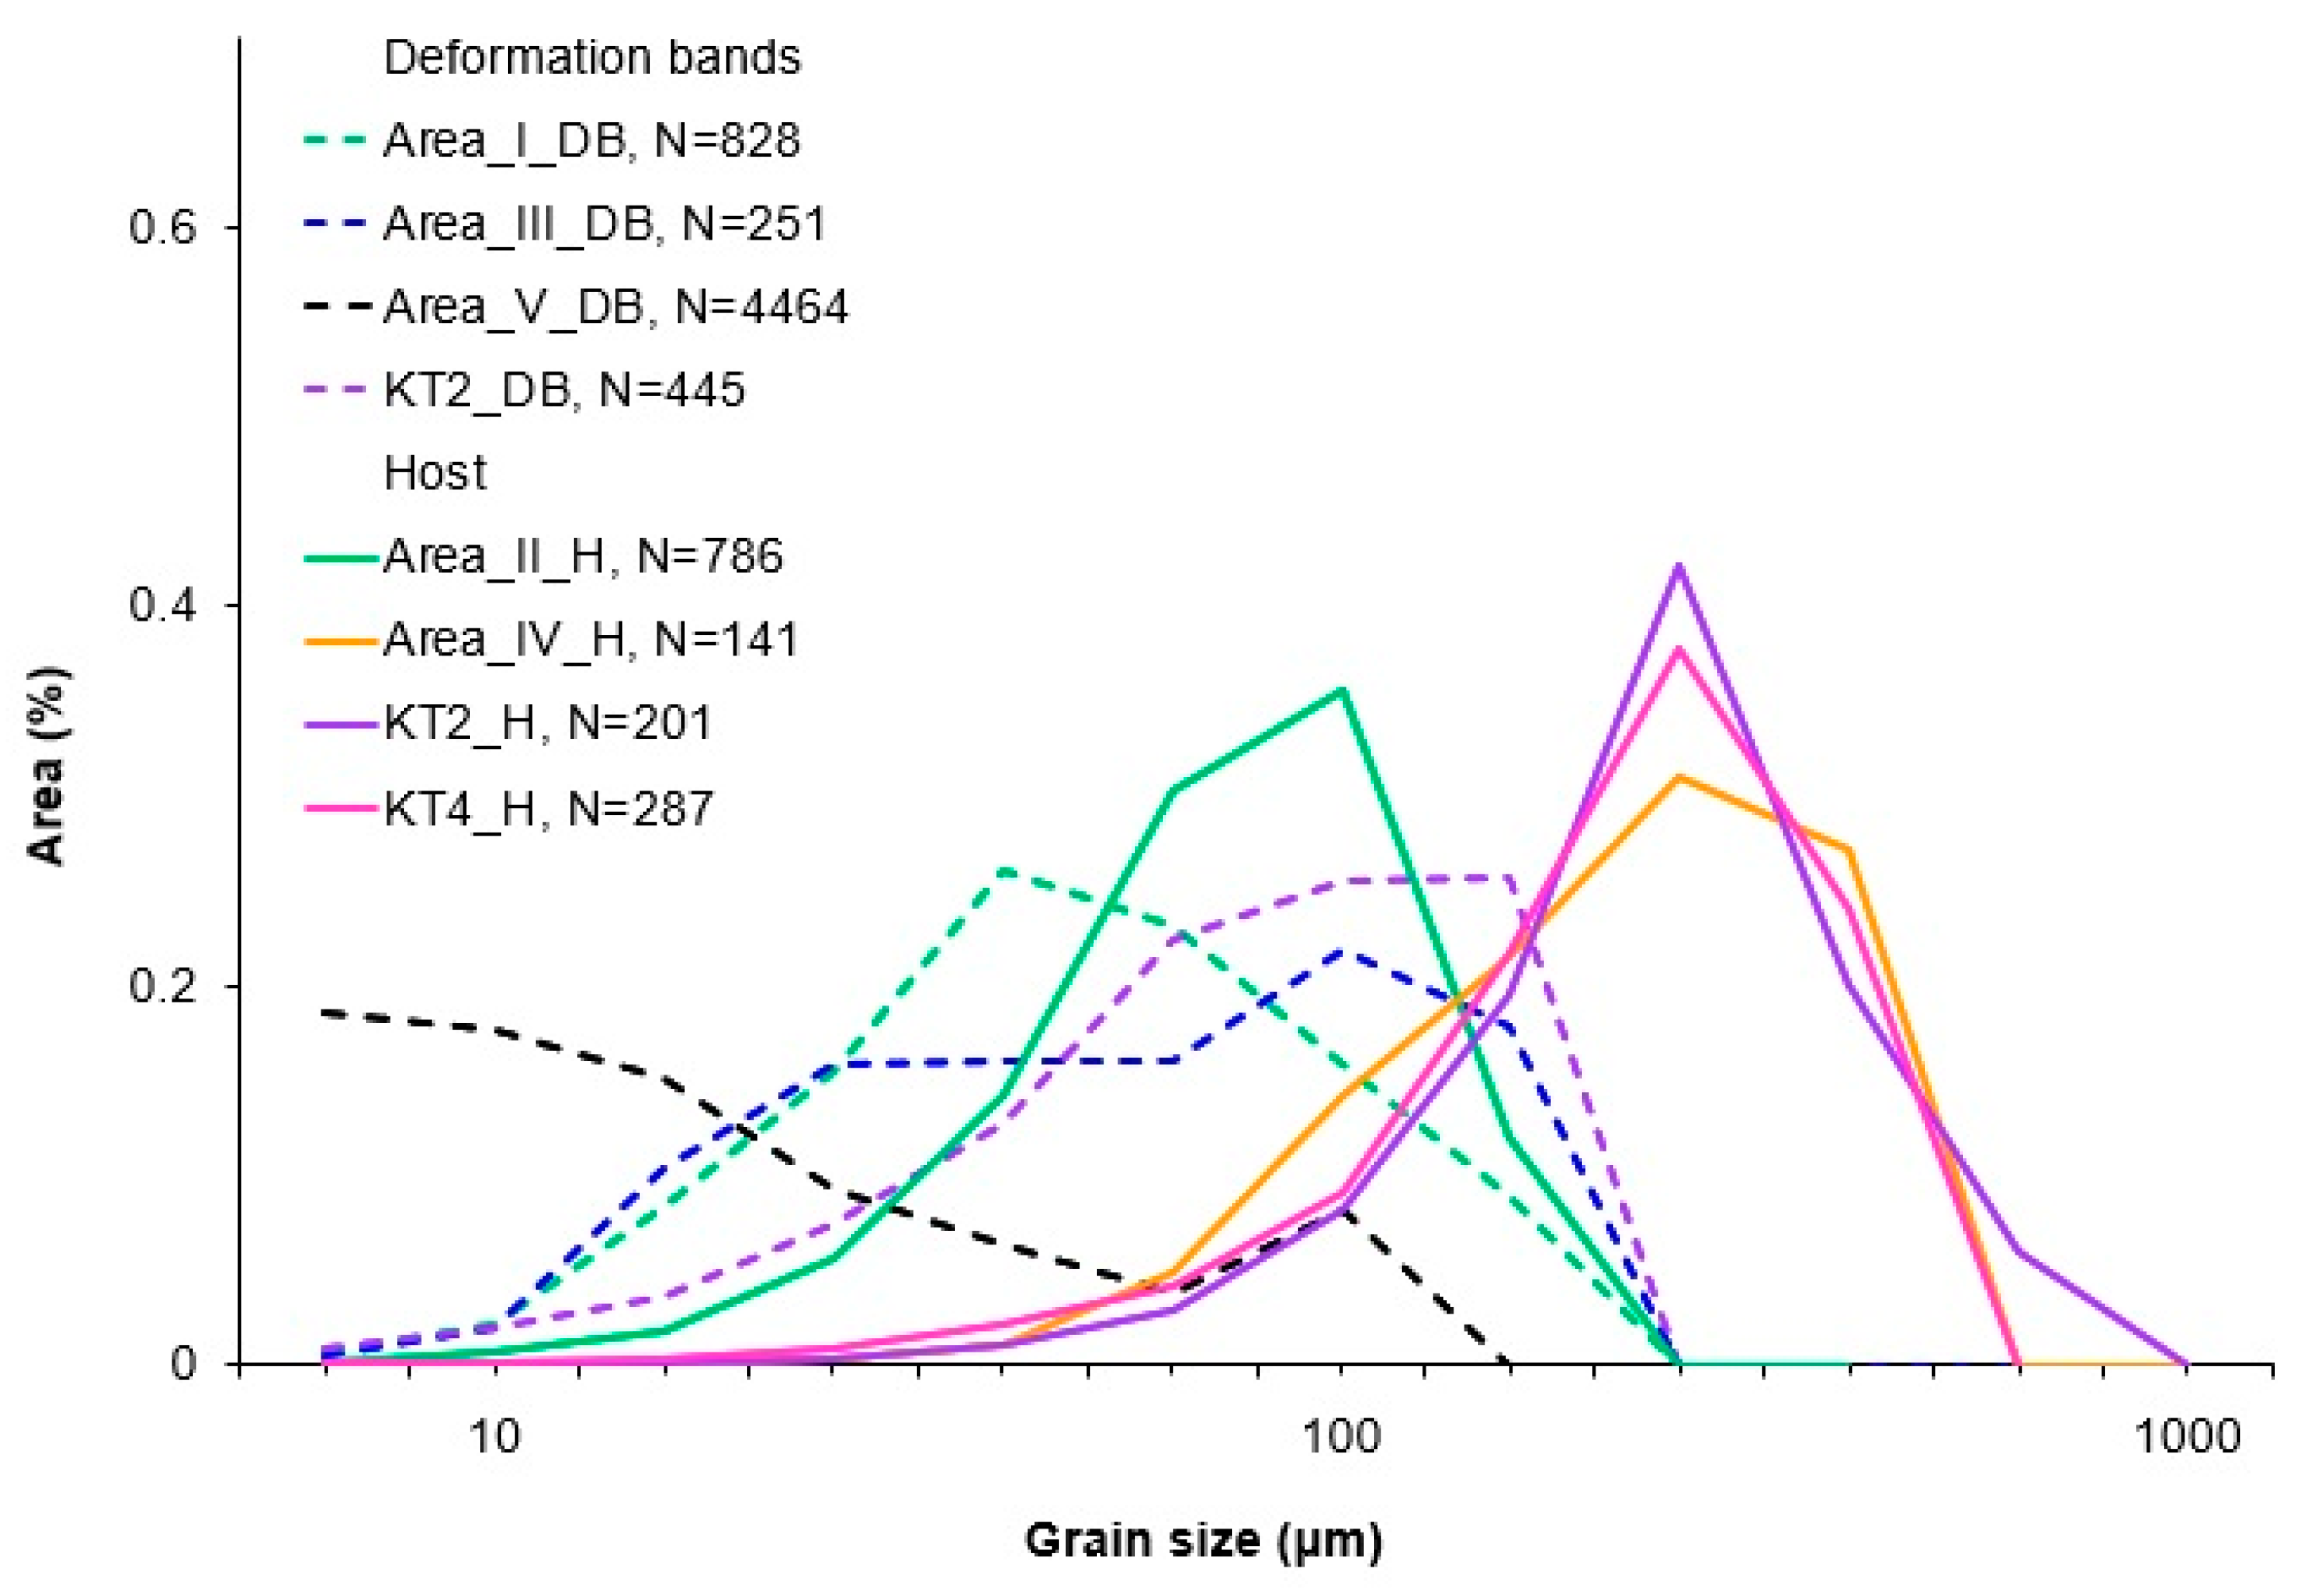
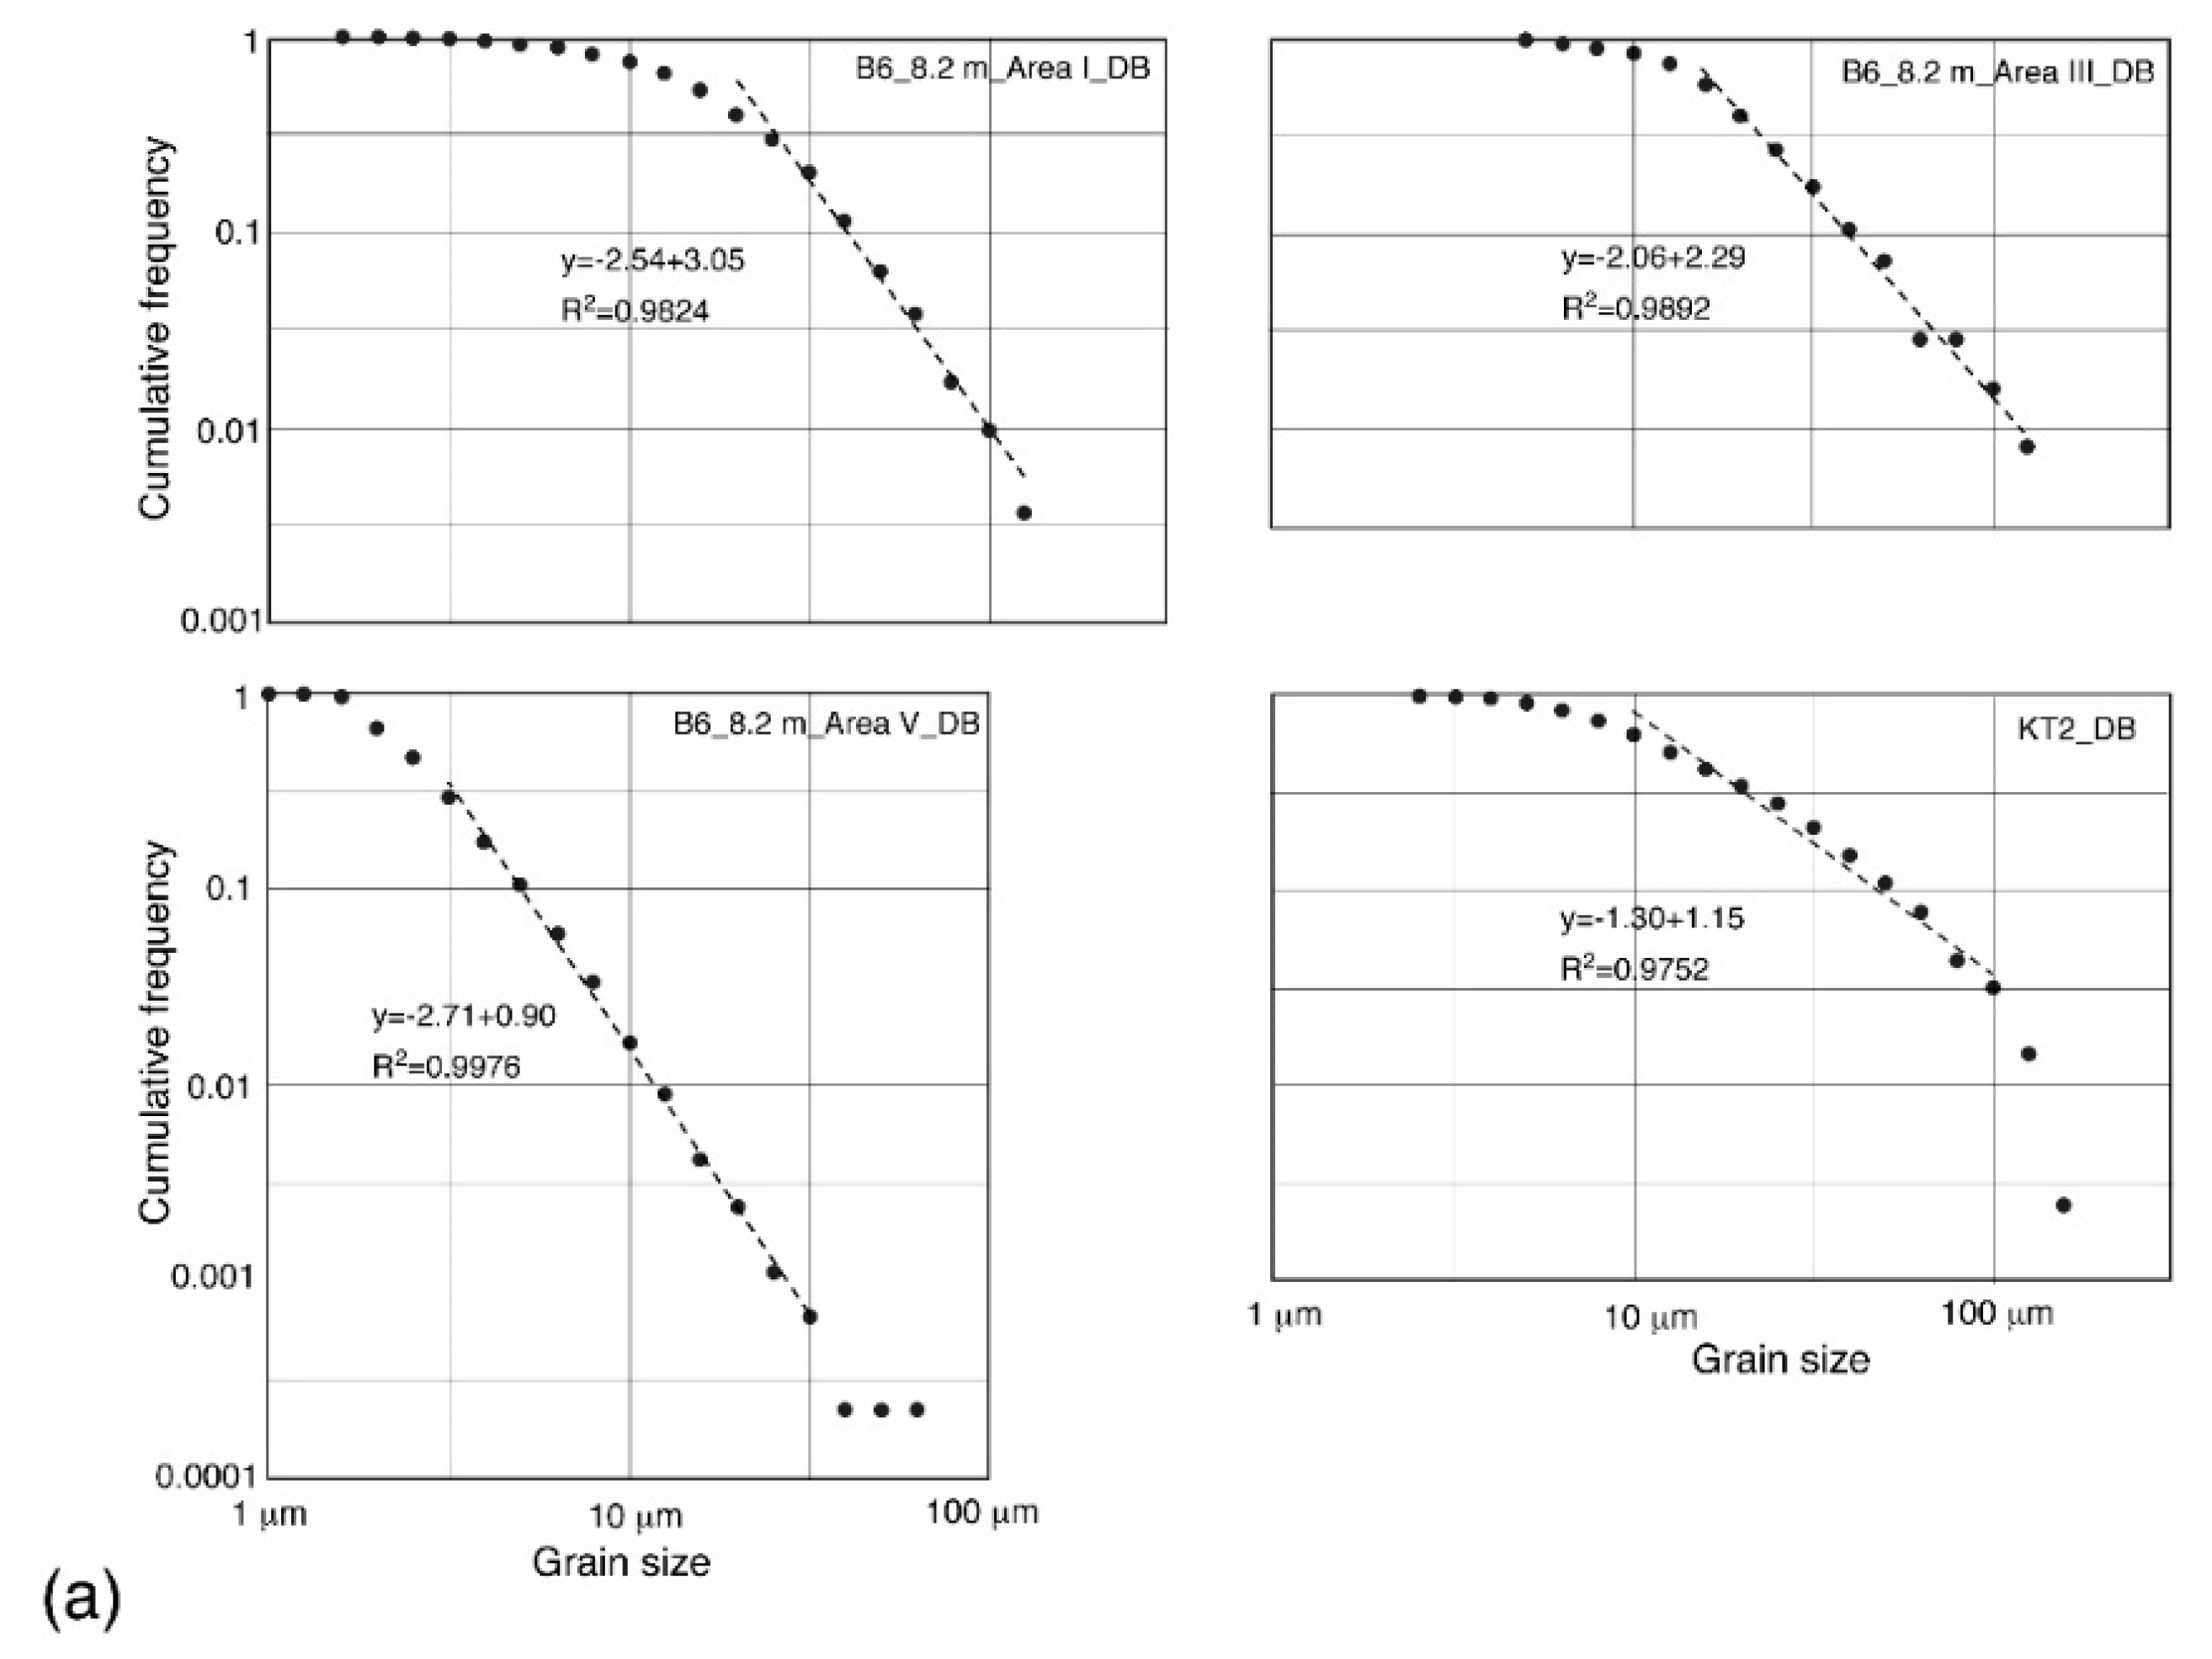
In the cataclastic bands, the detrital grains in host sandstones are crushed into sizes less than one-half to one-fifth of the original ones, and the asperities are flaked during the formation of deformation bands. The latter fact could be revealed by a higher circularity of detrital grains in the deformation bands than in the host parts.
(5)
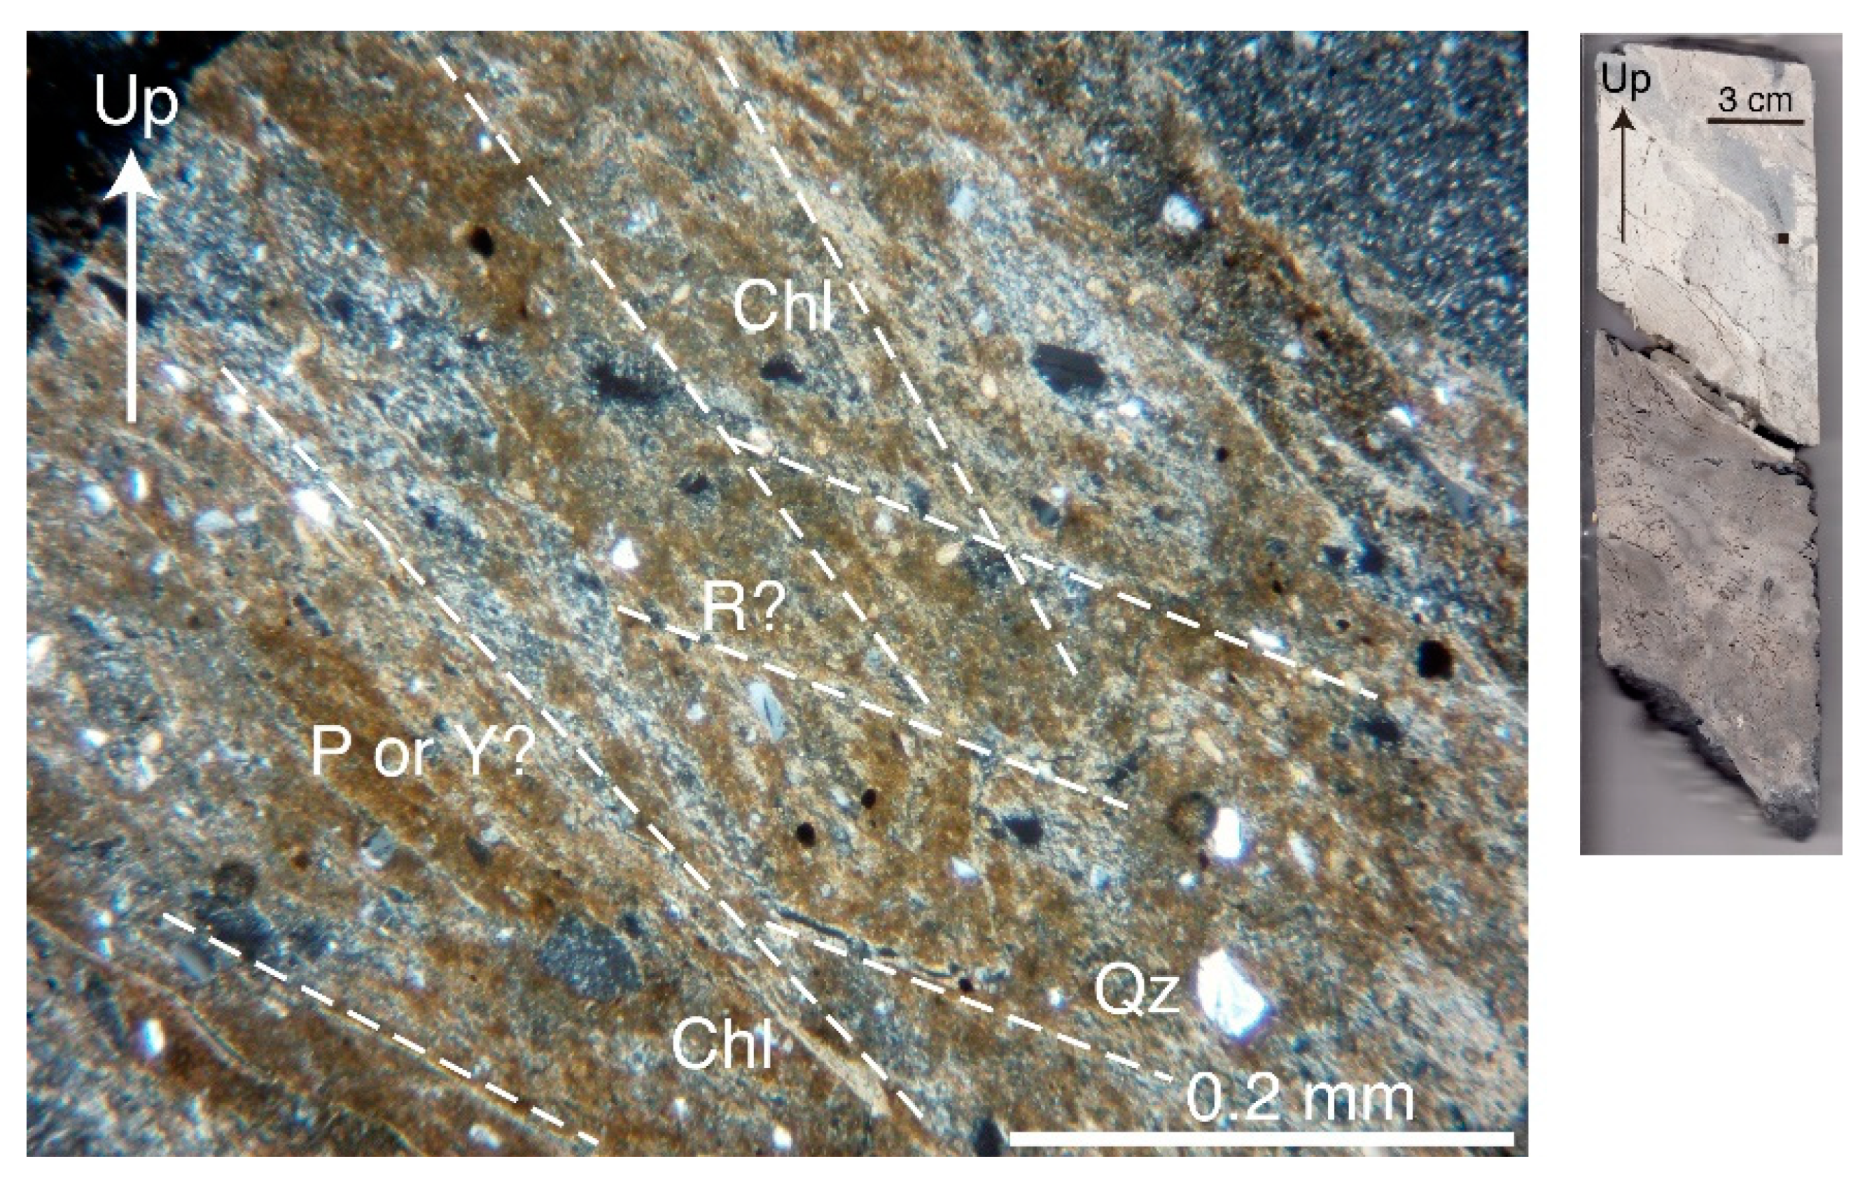
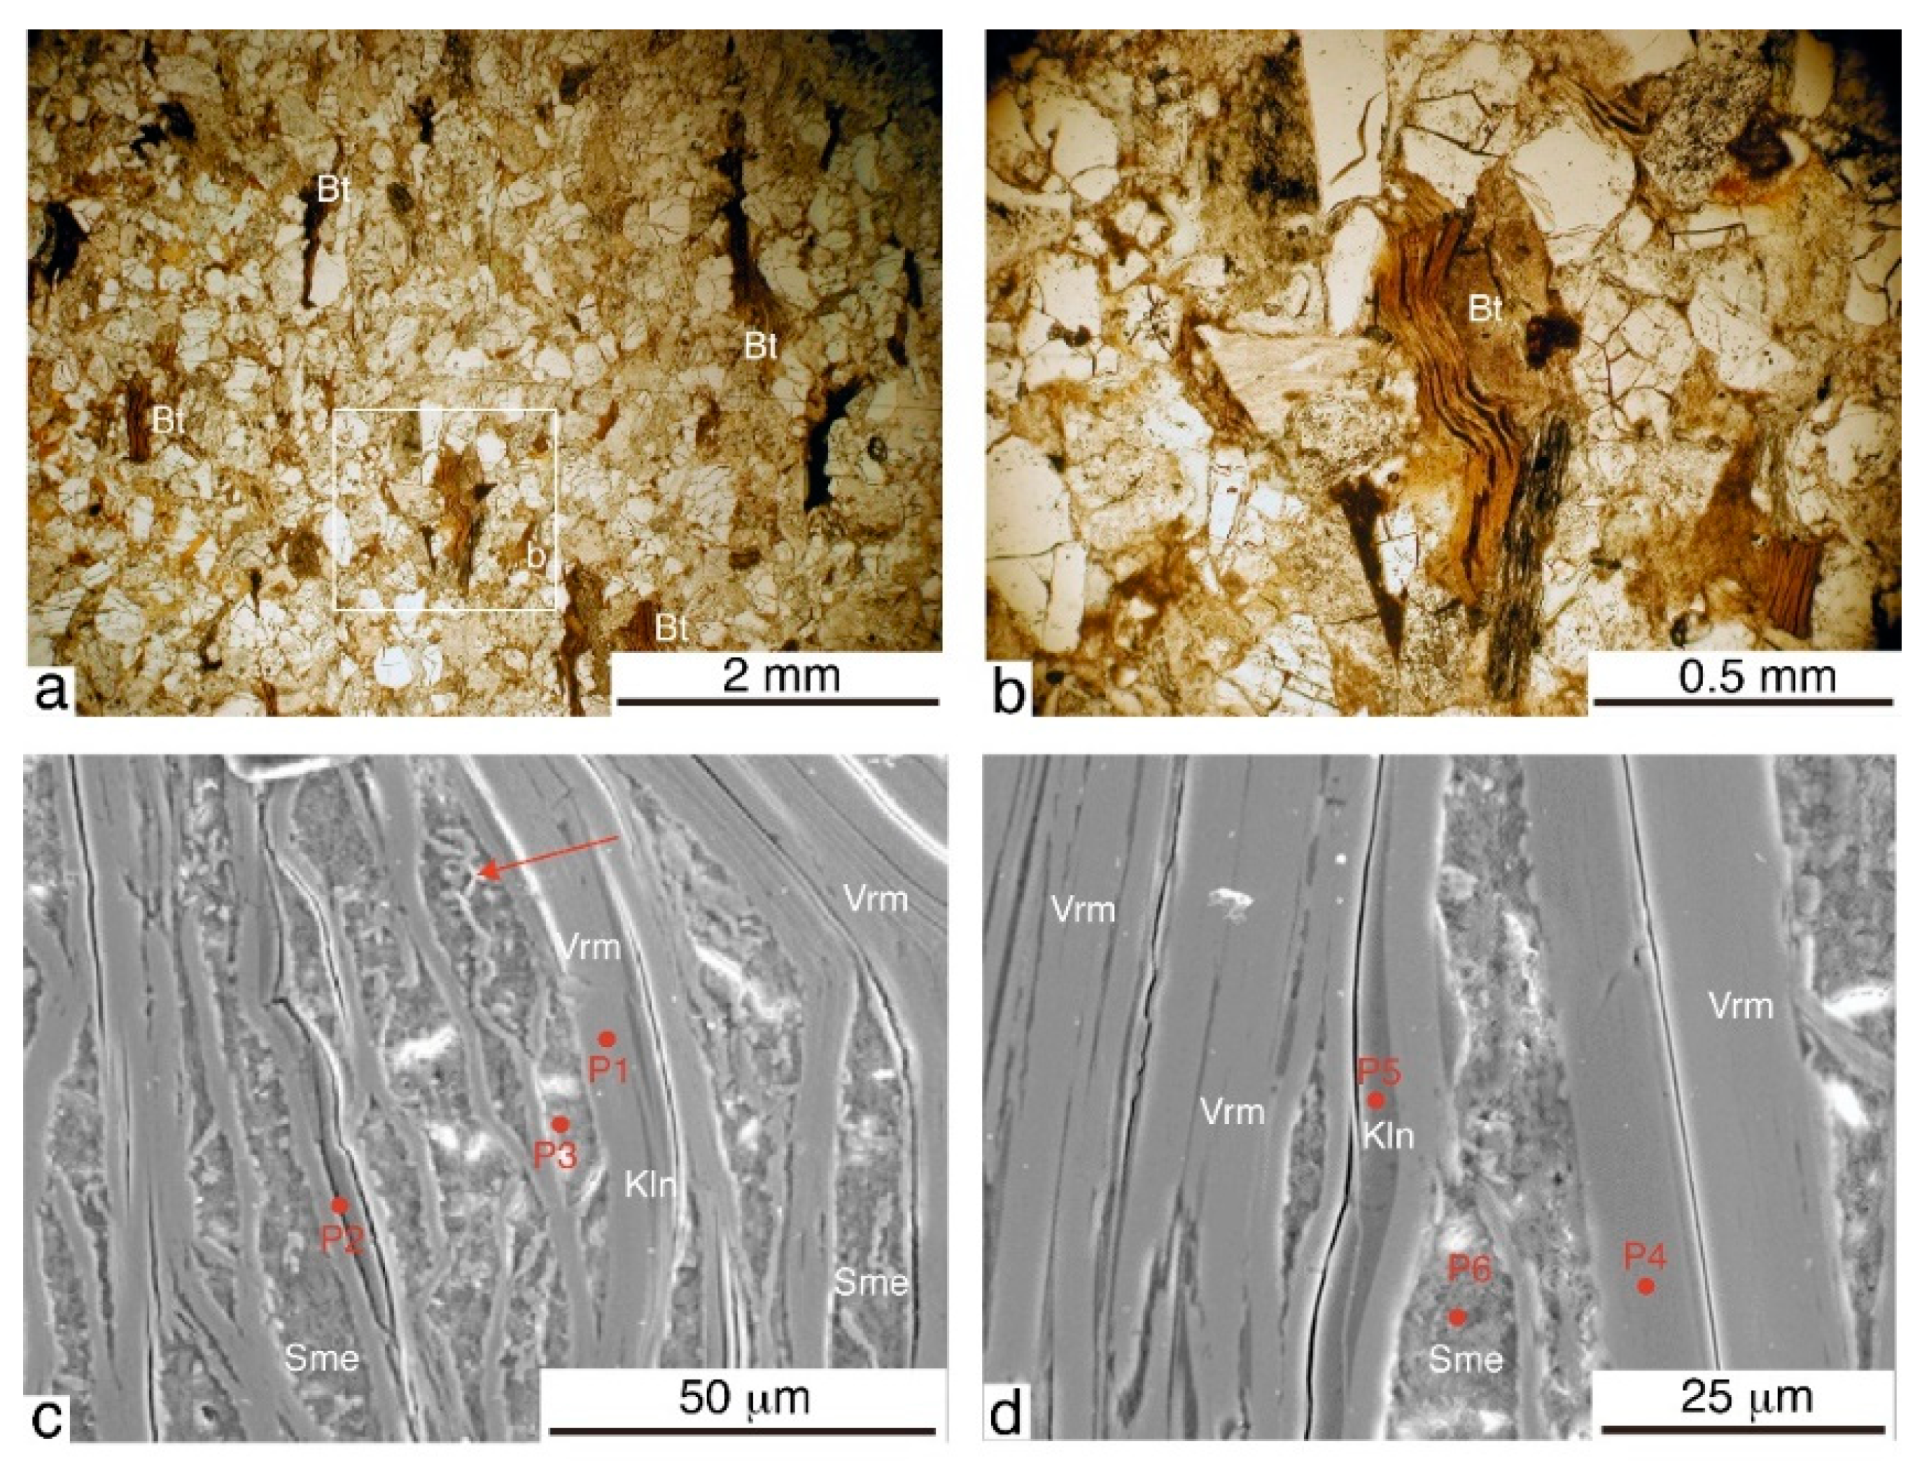
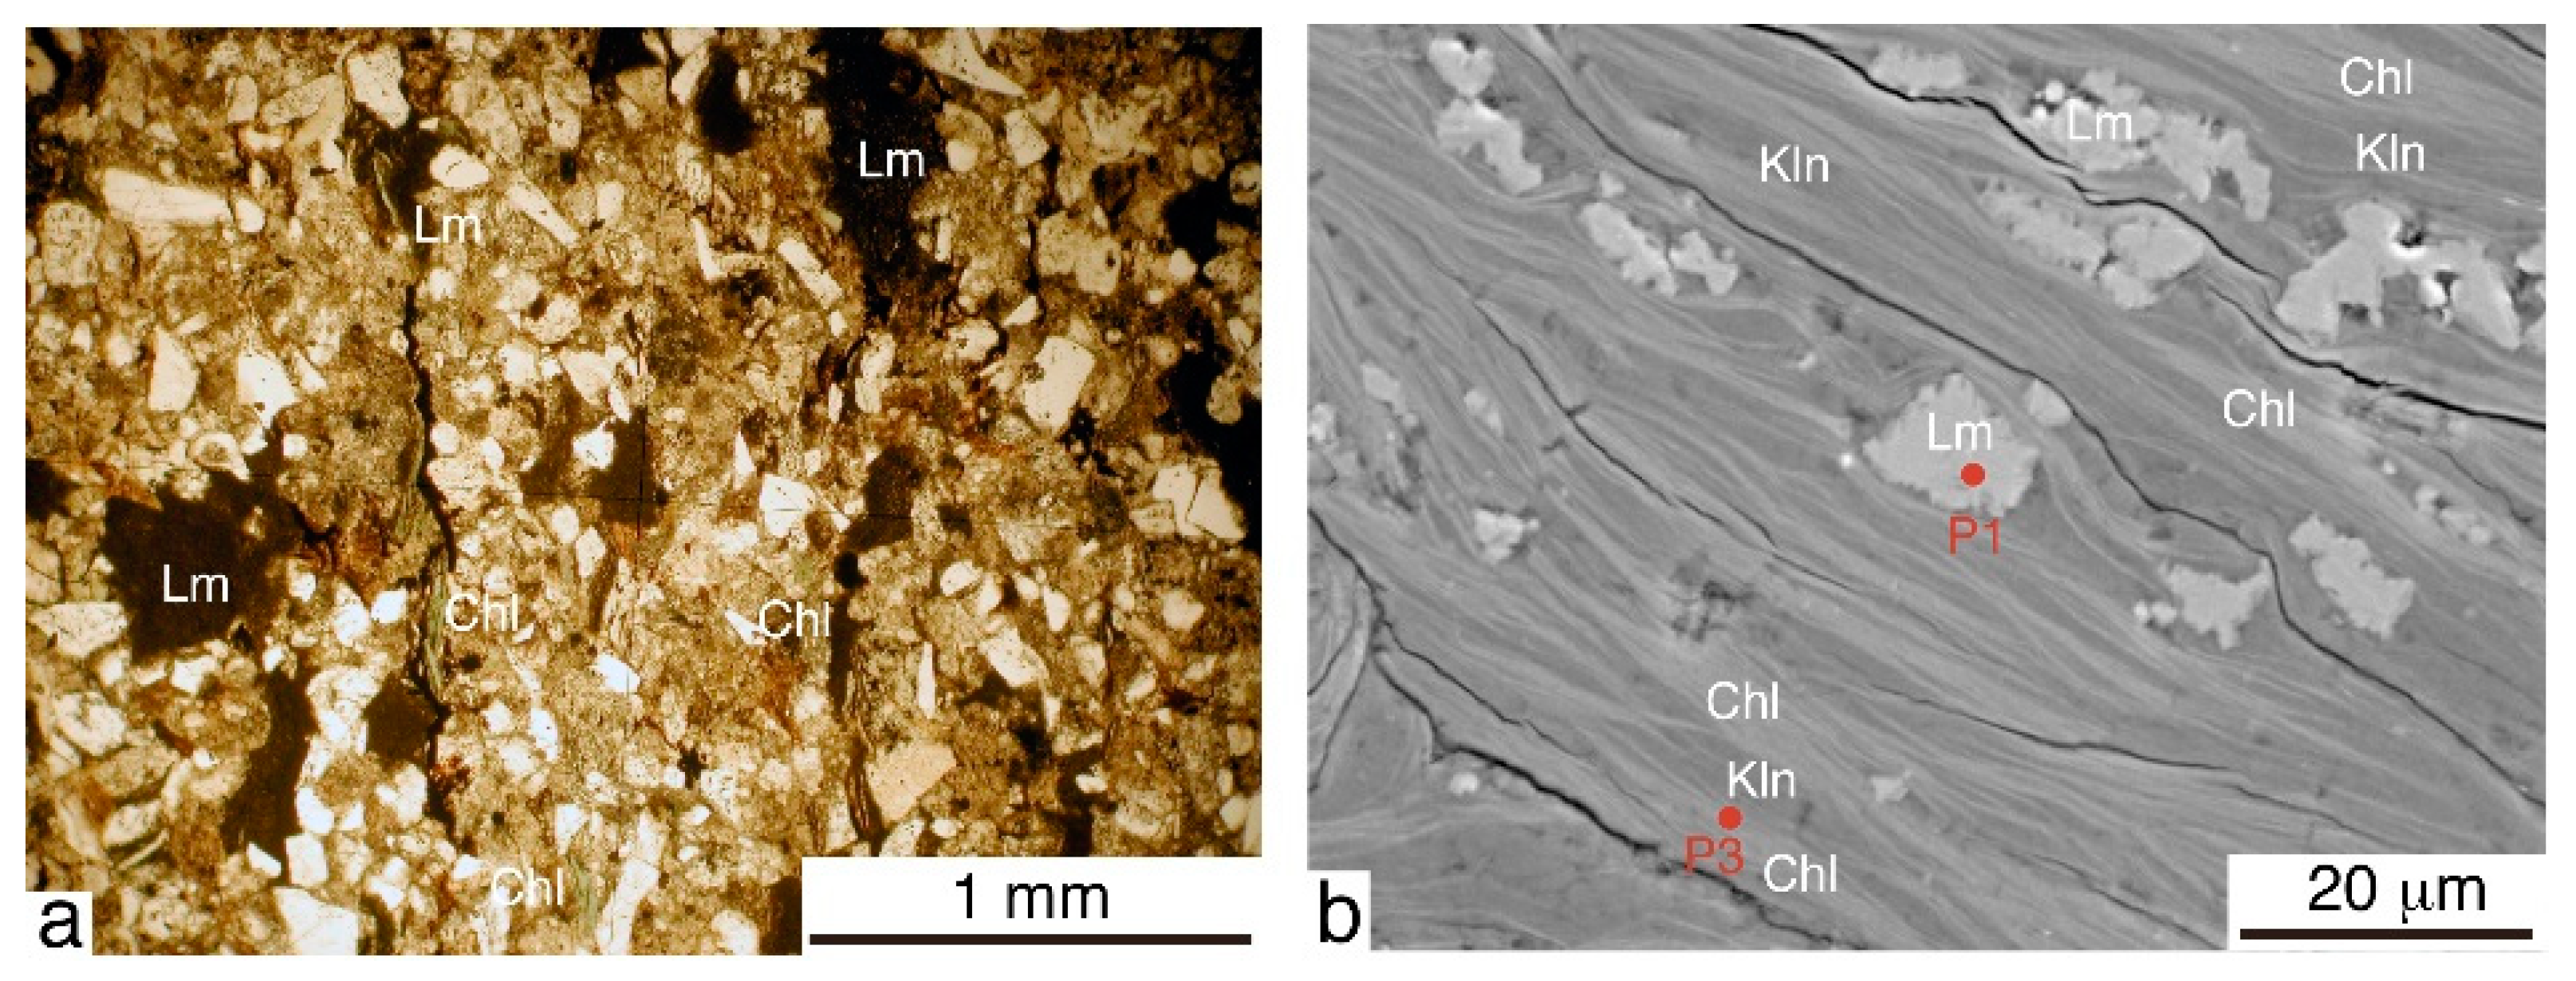
Reactive transport or structural diagenesis was significant in the present sandstones with deformation bands, some of which were characterized by the alignment of phyllosilicate (i.e., phyllosilicate bands). Here, the detrital biotite and chlorite grains were fractured along the cleavages and were altered (or weathered) to vermiculite and further to kaolinite. Also, authigenic smectite grew in the pore space created by fracturing in detrital grains. Since the deformation-induced weathering could have significantly reduced the internal friction and permeability of rocks in the study area, the landslide was probably triggered by heavy rainfall in such weathered rocks.

Author Contributions

Conceptualization, H.K. and T.T.; methodology, H.K.; software, H.K.; validation, H.K. and T.T.; formal analysis, H.K. and T.T.; investigation, H.K. and T.T.; resources, T.T.; data curation, H.K.; writing—original draft preparation, T.T.; writing—review and editing, H.K. and T.T.; visualization, H.K. and T.T.; supervision, T.T.; project administration, T.T.; funding acquisition, T.T. All authors have read and agreed to the published version of the manuscript.

Funding

This research was funded by JSPS KAKENHI, Grant Number 21H01181, to T. Takeshita.

Institutional Review Board Statement

Not applicable.

Informed Consent Statement

Not applicable.

Data Availability Statement

All the data used in the study are described in the paper.

Acknowledgments

We thank the Division of Construction Management, the General Promotion Bureau, Kushiro, Hokkaido Government for allowing us to use the drilled core samples from Meiji Consultant Co. Ltd. We also thank the institution for allowing us to reproduce Figure 3. H. Nomura and K. Nakamura are thanked for thin section preparation and A. Matsumoto for help with the electron-prove microanalyses.

Conflicts of Interest

The authors declare no conflict of interest.

References

  1. Aydin, A.; Borja, R.I.; Eichhubl, P. Geological and mathematical framework for failure modes in granular rock. J. Struct. Geol. 2006, 28, 83–98. [Google Scholar] [CrossRef]
  2. Fossen, H.; Schultz, R.A.; Shipton, Z.K.; Mair, K. Deformation bands in sandstone: A review. J. Geol. Soc. 2007, 164, 755–769. [Google Scholar] [CrossRef]
  3. Fossen, H.; Soliva, R.; Ballas, G.; Trzaskos, B.; Cavalcante, C.; Schultz, R.A. A Review of Deformation Bands in Reservoir Sandstones: Geometries, Mechanisms and Distribution; Geological Society of London Publications: London, UK, 2017; Volume 459, pp. 9–33. [Google Scholar]
  4. Ballas, G.; Soliva, R.; Benedicto, A.; Sizun, J.P. Control of tectonic setting and large-scale faults on the basin-scale distribution of deformation bands in porous sandstone (Provence, France). Mar. Petrol. Geol. 2014, 55, 142–159. [Google Scholar] [CrossRef]
  5. Liu, Z.; Sun, Y. Characteristics and formation process of contractional deformation bands in oil-bearing sandstones in the hinge of a fold: A case study of the Youshashan anticline, western Qaidam Basin, China. J. Petrol. Sci. Eng. 2020, 189, 106994. [Google Scholar] [CrossRef]
  6. Soliva, R.; Schultz, R.A.; Ballas, G.; Taboada, A.; Wibberley, C.; Saillet, E.; Benedicto, A. A model of strain localization in porous sandstone as a function of tectonic setting, burial and material properties; new insight from Provence (southern France). J. Struct. Geol. 2013, 49, 50–63. [Google Scholar] [CrossRef]
  7. Zuluaga, L.F.; Fossen, H.; Rotevatn, A. Progressive evolution of deformation band populations during Laramide fault-propagation folding: Navajo Sandstone, San Rafael monocline, Utah, USA. J. Struct. Geol. 2014, 68, 66–81. [Google Scholar] [CrossRef]
  8. Gambino, S.; Fazio, E.; Maniscalco, R.; Punturo, R.; Lanzafame, G.; Barreca, G.; Butler, R.W.H. Fold-related deformation bands in a weakly buried sandstone reservoir analogue: A multi-disciplinary case study from the Numidian (Miocene) of Sicily (Italy). J. Struct. Geol. 2019, 118, 150–164. [Google Scholar] [CrossRef]
  9. Braathen, A.; Petrie, E.; Nystuen, T.; Sundal, A.; Skurtveit, E.; Zuchuat, V.; Gutierrez, M.; Midtkandal, I. Interaction of deformation bands and fractures during progressive strain in monocline—San Rafael Swell, Central Utah, USA. J. Struct. Geol. 2020, 141, 104219. [Google Scholar] [CrossRef]
  10. Childs, C.; Manzocchi, T.; Walsh, J.J.; Bonson, C.G.; Nicol, A.; Schöpfer, M.P.J. A geometric model of fault zone and fault rock thickness variations. J. Struct. Geol. 2009, 31, 117–127. [Google Scholar] [CrossRef]
  11. Mitchell, T.M.; Faulkner, D.R. The nature and origin of off-fault damage surrounding strike-slip fault zones with a wide range of displacements: A field study from the Atacama fault system, northern Chile. J. Struct. Geol. 2009, 31, 802–816. [Google Scholar] [CrossRef]
  12. Choi, J.-H.; Edwards, P.; Ko, K.; Kim, Y.-S. Definition and classification of fault damage zones: A review and a new methodological approach. Earth Sci. Rev. 2016, 152, 70–87. [Google Scholar] [CrossRef]
  13. Schultz, R.A.; Siddharthan, R.A. general framework for the occurrence and faulting of deformation bands in porous granular rocks. Tectonophysics 2005, 411, 1–18. [Google Scholar] [CrossRef]
  14. MacQuarrie, K.T.B.; Mayer, K.U. Reactive transport modeling in fractured rock: A state-of-the-science review. Earth Sci. Rev. 2005, 72, 189–227. [Google Scholar] [CrossRef]
  15. Kaneko, Y.; Takeshita, T.; Watanabe, Y.; Shigematsu, N.; Fujimoto, K.-I. Alteration reaction and mass transfer via fluids with progress of fracturing along the Median Tectonic Line, Mie Prefecture, Southwest Japan. In Evolutionary Models of Convergent Margins—Origin of Their Diversity; Itoh, Y., Ed.; InTechOpen: London, UK, 2017; pp. 121–142. [Google Scholar]
  16. Liping, Q.; Huang, A.; Wang Zhechao, W.; Wenyuan Gao, W.; Liua, J. Alteration of minerals and temporal evolution of solution in reactive flow through granitic rock fractures. Int. J. Rock Mech. Min. Sci. 2019, 123, 104105. [Google Scholar] [CrossRef]
  17. Moore, O.W.; Buss, H.L.; Dosseto, A. Incipient chemical weathering at bedrock fracture interfaces in a tropical critical zone system, Puerto Rico. Geoch. Cosmoch. Acta 2019, 252, 61–87. [Google Scholar] [CrossRef]
  18. Laubach, S.E.; Eichhubl, P.; Hilgers, C.; Lander, R.H. Structural diagenesis. J. Struct. Geol. 2010, 32, 1866–1872. [Google Scholar] [CrossRef]
  19. Rodrigues, R.S.; Alves da Silva, F.C.; Córdoba, V.C. Evolution of deformation bands, insights from structural diagenesis. J. Struct. Geol. 2021, 143, 104257. [Google Scholar] [CrossRef]
  20. Kristensen, T.B.; Rotevatn, A.; Peacock, D.C.P.; Henstra, G.A.; Midtkandal, I.; Grundvåg, S.-A. Structure and flow properties of syn-rift border faults: The interplay between fault damage and fault-related chemical alteration (Dombjerg Fault, Wollaston Forland, NE Greenland). J. Struct. Geol. 2016, 92, 99–115. [Google Scholar] [CrossRef]
  21. Salomon, E.; Rotevatn, A.; Kristensen, T.B.; Grundvåg, S.-A.; Henstra, G.A.; Meckler, A.N.; Albert, R.; Gerdes, A. Fault-controlled fluid circulation and diagenesis along basin-bounding fault systems in rifts—Insights from the East Greenland rift system. Solid Earth 2020, 11, 1987–2013. [Google Scholar] [CrossRef]
  22. Salomon, E.; Rotevatn, A.; Kristensen, T.B.; Grundvåg, S.-A.; Henstra, G.A. Microstructure and fluid flow in the vicinity of basin bounding faults in rifts—The Dombjerg Fault, NE Greenland rift system. J. Struct. Geol. 2021, 153, 104463. [Google Scholar] [CrossRef]
  23. Lommatzsch, M.; Exner, U.; Gier, S.; Grasemann, B. Dilatant shear band formation and diagenesis in calcareous, arkosic sandstones, Vienna Basin (Austria). Mar. Petrol. Geol. 2015, 62, 144–160. [Google Scholar] [CrossRef]
  24. Collettini, C. The mechanical paradox of low-angle normal faults: Current understanding and open questions. Tectonophysics 2011, 510, 253–268. [Google Scholar] [CrossRef]
  25. Behnsen, J.; Faulkner, D.R. Permeability and frictional strength of cation-exchanged montmorillonite. J. Geophys. Res. 2013, 118, 2788–2798. [Google Scholar] [CrossRef]
  26. Regmi, A.D.; Yoshida, K.; Dhital, M.R.; Devkota, K. Effect of rock weathering, clay mineralogy,and geological structures in the formation of large landslide, a case study from Dumre Besei landslide, Lesser Himalaya Nepal. Landslides 2013, 10, 1–13. [Google Scholar] [CrossRef]
  27. Fujii, K.; Yonetani, H.; Sogabe, M.; Sasaki, M.; Higashide, N. Coal petrological studies of the sub-bituminous coal in the Kushiro Coal Field, Hokkaido, Japan -As basic data for oil exploration off Kushiro. J. Japan Assoc. Petrol. Tech. 1979, 44, 20–29. [Google Scholar] [CrossRef]
  28. Sasa, Y. The tertiary stratigraphy in the Kushiro coal field and previous views. J. Hokkaido Coal Mining Assoc. 1940, 308, 1–24, (In Japanese with English abstract). [Google Scholar]
  29. Matsui, M. Sedimentological study of the Paleogene basin of Kushiro in Hokkaido, Japan. J. Fac. Sci. Hokkaido Univ. Ser. IV 1962, 11, 431–480. [Google Scholar]
  30. Tanai, T. Explanatory text of the Geological Map of Japan, Scale 1:50,000, Onbetsu (Kushiro-45). Hokkaido Dev. Agency. 1957, 52p. (In Japanese with English abstract). Available online: https://www.gsj.jp/data/50KGM/PDF/GSJ_MAP_G050_02045_1957_D.pdf (accessed on 21 August 2022).
  31. Oda, Y.; Nemoto, T.; Uemura, T. Explanatory text of the Geological Map of Japan, Scale 1:50,000, Tokomuro (Kushiro-44). Hokkaido Dev. Agency. 1959, 54p. (In Japanese with English abstract). Available online: https://www.gsj.jp/data/50KGM/PDF/GSJ_MAP_G050_02044_1959_D.pdf (accessed on 21 August 2022).
  32. Kaiho, K. Paleogene Foraminifera from Hokkaido, Japan. Part 1: Lithostratigraphy and biostratigraphy including description of new species. Sci. Rep. Tohoku Univ. Sec. Ser. Geol. 1984, 54, 95–139. [Google Scholar]
  33. Kaiho, K. Paleogene Foraminifera from Hokkaido, Japan. Part 2: Correlation of the Paleogene System in Hokkaido and systematic paleontology. Sci. Rep. Tohoku Univ. Sec. Ser. Geol. 1984, 55, 1–74. [Google Scholar]
  34. Katagiri, T.; Naruse, H.; Hirata, T.; Hattori, K. U–Pb age of the tuff bed in the Urahoro Group, eastern Hokkaido, northern Japan. J. Geol. Soc. Jpn. 2016, 122, 495–503, (In Japanese with English abstract). [Google Scholar] [CrossRef]
  35. Shibata, K.; Tanai, T. K-Ar ages of Tertiary volcanic rocks in Hokkaido. In Recent Progress in the Neogene Biostratigraphy of Hokkaido; Tanai, T., Ed.; Sapporo, Japan, 1982; pp. 75–80, (In Japanese with English abstract). [Google Scholar]
  36. Tanai, T.; Yamaguchi, S. Explanatory text of the Geological Map of Japan, Scale 1:50,000, Urahoro (Kushiro-54). Hokkaido Dev. Agency. 1965, 46p. (In Japanese with English abstract). Available online: https://www.gsj.jp/data/50KGM/PDF/GSJ_MAP_G050_02054_1965_D.pdf (accessed on 21 August 2022).
  37. Suzuki, T. Explanatory text of the Geological Map of Japan, Scale 1:50,000, Shiranuka (Kushiro-43). Hokkaido Dev. Agency. 1958, 46p. Available online: https://www.gsj.jp/data/50KGM/PDF/GSJ_MAP_G050_02046_1958_D.pdf (accessed on 21 August 2022). (In Japanese with English abstract).
  38. Akiba, F.; Ichinoseki, T. The Neogene Micro- and Chronostratigraphies in Hokkaido-Special Reference to those of the Southwestern Part of the Kushiro Coal Field Area, Eastern Hokkaido, Japan. J. Jpn. Associ. Petrol. Tech. 1983, 48, 48–61. [Google Scholar]
  39. Kimura, G. Oblique subduction and collision: Forearc tectonics of the Kuril arc. Geology 1986, 14, 404–407. [Google Scholar] [CrossRef]
  40. Katagiri, T.; Naruse, H.; Ishikawa, N.; Hirata, T. Collisional bending of the western Paleo-Kuril Arc deduced from paleomagnetic analysis and U–Pb age determination. Isl. Arc 2019, 29, e12329. [Google Scholar] [CrossRef]
  41. Tada, R.; Iijima, A. Stratigraphy and geology of the Neogene Atsunai Group of the Atsunai and Urahoro areas in southeastern Hokkado, Northwest Japan. J. Geol. Soc. Jpn. 1986, 92, 31–45. [Google Scholar] [CrossRef]
  42. The GIMP Document Team. GNU Image Manipulation Program User Manual. 2020. Available online: https://docs.gimp.org/2.10/en/ (accessed on 21 August 2022).
  43. Abramoff, M.D.; Magelhaes, P.J.; Ram, S.J. Image Processing with ImageJ. Biophotonics Int. 2004, 11, 36–42. [Google Scholar]
  44. Pizzati, M.; Balsamo, F.; Storti, F. Displacement-dependent microstructural and petrophysical properties of deformation bands and gouges in poorly lithified sandstone deformed at shallow burial depth (Crotone Basin, Italy). J. Struct. Geol. 2020, 137, 104069. [Google Scholar] [CrossRef]
  45. Sibson, R.H. Fault rocks and fault mechanisms. J. Geol. Soc. London 1977, 133, 191–213. [Google Scholar] [CrossRef]
  46. Woodcock, N.H.; Mort, K. Classification of fault breccias and related fault rocks. Geol. Mag. 2008, 145, 435–440. [Google Scholar] [CrossRef]
  47. Logan, J.M.; Rauenzahn, K.A. Frictional dependence of gouge mixtures of quartz and montmorillonite on velocity, composition and fabric. Tectonophysics 1987, 144, 87–108. [Google Scholar] [CrossRef]
  48. Laubach, S.E.; Marrett, R.A.; Olson, J.E.; Scott, A.R. Characteristics and origins of coal cleat: A review. Int. J. Coal Geol. 1998, 35, 175–207. [Google Scholar] [CrossRef]
  49. Baldermann, A.; Dietzel, M.; Reinprecht, V. Chemical weathering and progressing alteration as possible controlling factors for creeping landslides. Sci. Total Environ. 2021, 778, 146300. [Google Scholar] [CrossRef]
  50. Hashimoto, Y.; Nakaya, T.; Ito, M.; Kimura, G. Tectonolithification of sandstone prior to the onset of seismogenic subduction zone: Evidence from tectonic mélange of the Shimanto Belt, Japan. Geochem. Geophys. Geosys. 2006, 7, Q06013. [Google Scholar] [CrossRef]
  51. Keulen, N.; Heilbronner, R.; Stünitz, H.; Boullier, A.-M.; Ito, H. Grain size distributions of fault rocks: A comparison between experimentally and naturally deformed granitoids. J. Struct. Geol. 2007, 29, 1282–1300. [Google Scholar] [CrossRef]
  52. Suzuki, N.; Matsubayashi, H.; Waples, D.W. A simpler kinetic model of vitrinite reflectance. Am. Associ. Petrol. Geologists Bull. 1993, 77, 1502–1508. [Google Scholar]
  53. Del Sole, L.; Antonellini, M. Microstructural, petrophysical, and mechanical properties of compactive shear bands associated to calcite cement concretions in arkose sandstone. J. Struct. Geol. 2019, 126, 51–68. [Google Scholar] [CrossRef]
  54. Eichhubl, P.; Hooker, J.N.; Laubach, S.E. Pure and shear-enhanced compaction bands in Aztec Sandstone. J. Struct. Geol. 2010, 32, 1873–1886. [Google Scholar] [CrossRef]
  55. Robert, R.; Robion, P.; Souloumiac, P.; David, C.; Saillet, E. Deformation bands, early markers of tectonic activity in front of a fold-and-thrust belt: Example from the Tremp-Graus basin, southern Pyrenees, Spain. J. Struct. Geol. 2018, 110, 65–85. [Google Scholar] [CrossRef]
  56. Robert, R.; Souloumiac, P.; Robion, P.; David, C. Numerical simulation of deformation band occurrence and the associated stress field during the growth of a fault-propagation fold. Geosciences 2019, 9, 257. [Google Scholar] [CrossRef]
  57. Ujiie, K.; Maltman, A.J.; Sánchez-Gómez, M. Origin of deformation bands in argillaceous sediments at the toe of the Nankai accretionary prism, southwest Japan. J. Struct. Geol. 2004, 26, 221–231. [Google Scholar] [CrossRef]
  58. Yamamoto, Y.; Mukoyoshi, H.; Ogawa, Y. Structural characteristics of shallowly buried accretionary prism: Rapidly uplifted Neogene accreted sediments on the Miura-Boso Peninsula, central Japan. Tectonics 2005, 24, TC5008. [Google Scholar] [CrossRef]
Figure 2. Outcrop photographs of the Shakubetsu Formation. (a) Steeply dipping strata located at the northwest of flexure (outcrop KT5). The bedding plane is shown by dashed lines. (b) Almost horizontally dipping strata located at the southeast of flexure (outcrop KT2), where the sandstone sample for image analysis is collected. See Figure 1b for the localities.
Applsci 12 08348 g002
Figure 3. (a) Cross section of landslide and localities of boreholes (B4, 5 and 6). See Figure 1b,c for the drilled site. (b,c) Photographs of drilled core samples. (b) Borehole 4 (B4) core. (c) Borehole 6 (B6) core. Bedrock and landslide debris was divided by a failure surface, which was framed by white solid lines. Coal samples in (b,c) were those used for the vitrinite reflectance measurements (Table 2).
Applsci 12 08348 g003
Figure 4. Microstructures in gouge from borehole core sample B4 (crossed polarized light). Dashed lines indicate composite planar structures, along which elongated chlorite detrital grains were aligned. Inset diagram shows the cross-section of borehole core sample B4, the locality for which is indicated in Figure 3b. The dot in the inset diagram shows the locality of the thin section. The up direction of the borehole is shown by arrows. Qz, quartz; Chl, chlorite.
Applsci 12 08348 g004
Figure 5. Microphotographs of deformation bands in borehole core sample B6. (a) Whole thin section (plane polarized light), where deformation bands and host areas are divided by red dashed lines. See Figure 3c for the locality. (b) Microstructures of coal seams, deformation bands (DB) and host areas (H) (plane-polarized light). (c) Alignment of fine-grained biotite grains in deformation bands shown by white dashed lines (crossed polarized light). OCL, orientation of coal layer in (a). (d) Extended and kinked biotite grains (crossed polarized light, shown by a white arrow). (e) Authigenic smectite grains grown in pore spaces created by fracturing of detrital grains. Measurements points for microchemical analysis with EPMA are indicated by filled red circles. See Table 3 for the compositions. See (a) for the localities of (be). The up direction of the borehole is shown by arrows in the diagrams (ad). Qz, quartz; Pl, plagioclase; Bt, biotite; Sme, smectite.
Applsci 12 08348 g005
Figure 6. Microphotographs of deformation bands in outcrop sample KT1. See Figure 1b for the locality. (a) Phyllosilicate bands. Note that extended biotite grains aligned parallel to the bedding plane (the short dimension of the microphotograph). (b) Enlargement of the part enclosed by a white frame shown in (a). Note that the biotite detrital grains were extended and kinked due to slipping along the cleavages. (a,b) Under plane-polarized light. (c,d) SEM-BSE microphotographs of altered biotite grains. Note that kinking and creation of pore space were caused by cleavage fracturing in biotite grains, and peeled-off biotite selvages were curled in (c) (shown by an arrow). In (c,d), authigenic smectite grew in the pore spaces. Measurements points for microchemical analysis with SEM-EDS are indicated by filled red circles. See Table 3 for the compositions. Bt, biotite; Vrm, vermiculite; Kln, kaolinite, Sme, smectite.
Applsci 12 08348 g006
Figure 7. Microphotographs of deformation bands in outcrop sample KT2. See Figure 1b and Figure 2b for the locality. (a) Phyllosilicate bands (plane-polarized light). Note that extended biotite grains aligned nearly parallel to the bedding plane forming deformation bands, and pyrite intruded along the bands. (b) Conjugate cataclasitic bands (plane-polarized light). Note that pyrite intruded along the deformation bands. The maximum principal stress (σ1) orientation is shown by arrows. (c) Enlargement of the part enclosed by a white frame shown in (b) (cross-polarized light). Note that dolomite in the matrix intruded along the cleavage plane in biotite grains. Deformation bands (DBs) and host areas (H) are divided by white dashed lines in (b,c). The longer dimension of the microphotograph (ac) is parallel to the bedding plane. (d) SEM-BSE microphotograph of an altered biotite grain along deformation bands. Measurements points for microchemical analysis with SEM-EDS and EPMA are indicated by filled red circles. See Table 3 for the compositions. Qz, quartz; Pl, plagioclase; Kfs, K-feldspar; Bt, biotite; Dol, dolomite; Vrm, vermiculite; Kln, kaolinite.
Applsci 12 08348 g007
Figure 8. Microphotograph of phyllosilicate bands in outcrop sample KT3. See Figure 1b for the locality. (a) Phyllosilicate bands (plane-polarized light). Note that chlorite and iron oxide or hydroxide (probably limonite) grains aligned parallel to the bedding plane (the short dimension of the microphotograph) (b) SEM-BSE microphotograph of altered chlorite grains aligned parallel to the phyllosilicate bands, including limonite grains. Measurements points for microchemical analysis with SEM-EDS and EPMA are indicated by filled red circles. The measurement points P2 and P4 are outside of the view. See Table 3 for the compositions. Chl, chlorite; Lm, limonite; Kln, kaolinite.
Applsci 12 08348 g008
Figure 9. An example of the grain outline data acquired with GIMP. Sample B6_8.2 m_Area V_DB. (a) Microphotograph of the deformation bands area (cross-polarized light). (b) Acquisition of grain boundaries with GIMP.
Applsci 12 08348 g009
Figure 10. A summary diagram of grain area percent versus logarithm of grain size (D) for the four deformation band areas and four host areas in the core and outcrop samples. N is the number of grains analyzed.
Applsci 12 08348 g010
Figure 11. The cumulative frequency of logarithmic grain size (D) for (a) four deformation bands and (b) four host areas in the core and outcrop samples. The best fit straight lines with the slope and intercept are shown for (a), while the straight lines for the DBs are shown as reference in (b). Sample name is shown at the upper right corner of each diagram. See Figure 10 for the number of grains analyzed.
Applsci 12 08348 g011aApplsci 12 08348 g011b
Figure 12. The histogram of aspect ratio for the (a,c,e,g) four deformation bands and (b,d,f,h) four host areas in the core and outcrop samples. Sample name is shown at the top of each diagram. The average value and one standard deviation (σ) are also shown.
Applsci 12 08348 g012
Figure 13. The orientation distribution of the long axis of the fitted ellipse to the grain shape for the (a,c,e,g) four deformation bands and (b,d,f,h) four host areas in the core and outcrop samples. Sample name is shown at the top of each diagram. Dashed lines indicate the orientation of deformation bands.
Applsci 12 08348 g013
Figure 14. The histogram of circularity for the (a,c,e,g) four deformation bands and (b,d,f,h) four host areas in the core and outcrop samples. Sample name is shown at the top of each diagram. The average value and one standard deviation (σ) are also shown.
Applsci 12 08348 g014
Figure 15. Schematic diagram showing a model of development of the flexure and deformation bands. See text for explanations. (a) Before folding. (b) After folding. Note that the conjugate deformation bands in outcrop sample KT2 (Figure 7b,c) are flipped so that the σ1 orientation is conformable to activate the bedding parallel R-bands in the B4 and B6 core samples. This is an explanation because not only the sample KT2 was not collected as an oriented sample, but also the borehole cores B4 and B6 were not oriented.
Applsci 12 08348 g015
Table 2. Summaries of analyzed samples.
Sample No.Core or
Outcrop
Sample
FormationLithologyAnalysis
B4_5.1 mcoreShakubetsu F.gougemicro.
B4_5.3 mcoreShakubetsu F.coalvitri.
B6_8.2 mcoreShakubetsu F.v.f.s. to f.s. with mudst. and coal layersmicro. image a. EPMA
B6_8.6 mcoreShakubetsu F.coalvitri.
KT1outcropShakubetsu F.v.f.s. to f.s.micro. SEM-EDS
KT2outcropShakubetsu F.f.s to m.s. with mudst. and coal layersmicro. SEM-EDS, EPMA, image a.
KT3outcropShakubetsu F.v.f.s.micro. SEM-EDS, EPMA
KT4outcropShitakara F.f.s. to m.s.image a.
KT5outcropShakubetsu F.v.f.s. with mudst. and coal layersvitri.
Abbreviations: mudst., mudstone; v.f.s., very-fine-grained sandstone; f.s., fine-grained sandstone; m.s., medium-grained sandstone; micro., microstructure; vitri., vitrinite reflectance; image a., image analysis.
Table 3. Chemical compositions of analyzed minerals (wt.%) with EPMA or SEM-EDS. SEM-EDS analyses are indicated by * marks at the right of both mineral name and total, which are normalized to 100 wt.% in total. For EPMA analyses without * marks, the total is the total weight percent of measured oxide, which does not include the compositions such as H2O, which cannot be measured by EPMA. Mg# = 100 × Mg/(Fe2+ + Mg); -, No measurements or not applicable.
SampleB6_8.2 mB6_8.2 mKT1KT1KT1KT1KT1KT1KT2KT2KT2KT2KT2KT3KT3KT3KT3
Band typeCBCBPBPBPBPBPBPBCBCBCBCBCBPBPBPBPB
Point No.P1P2P1P2P3P4P5P6P2P3P4P5P6P1P2P3P4
MineralSmeSmeVrm *Kln *Sme *Vrm *Kln *SmeDolDolVrmVrmVrmLm *ChlChlKln
SiO245.0345.4140.0054.0263.4940.4954.1063.490.002.7531.7633.4937.500.0033.8038.1647.53
TiO20.050.134.360.000.004.220.000.000.040.253.293.332.600.500.060.020.13
Al2O317.2519.6315.6544.3627.7515.6644.3828.310.041.6216.4616.3221.440.0022.4425.8136.67
Cr2O30.010.010.000.000.000.000.00.000.080.000.000.020.030.000.000.000.00
NiO0.030.02------0.040.000.000.000.00-0.030.010.01
FeO1.351.5622.6016.562.7422.391.142.505.374.5625.5423.1819.7595.9322.8717.140.22
MnO0.000.020.000.000.000.000.000.000.280.200.310.380.212.860.380.270.00
MgO2.532.1612.260.402.8512.060.382.7517.9219.059.118.536.780.467.685.850.24
CaO1.660.850.000.002.960.000.002.6531.8128.310.540.830.590.730.100.180.28
Na2O0.060.060.000.000.210.000.000.301.967.100.090.080.080.000.070.050.00
K2O0.790.905.140.000.005.180.000.000.000.000.742.310.540.001.120.760.60
(Total)(68.75)(70.74)(100 *)(100 *)(100 *)(100 *)(100 *)(100 *)(55.63)(57.04)(97.49)(96.84)(97.30)(100 *)(88.55)(88.25)(85.67)
(Oxygen)(22)(22)(22)(22)(22)(22)(22)(22)(2)(2)(22)(22)(22)-(28)(28)(28)
Si7.757.585.696.327.515.756.327.500.000.085.225.435.70-6.807.328.25
Ti0.010.020.470.000.000.450.000.000.000.010.410.410.30-0.010.000.02
Al3.503.862.626.123.872.626.113.940.000.053.193.123.84-5.325.837.50
Cr0.000.000.000.000.000.000.000.000.000.000.000.000.00-0.000.000.00
Ni0.000.00------0.000.000.000.000.00-0.010.000.00
Fe2+0.190.222.690.120.272.660.110.250.140.113.513.142.51-3.842.750.03
Mn0.000.000.000.000.000.000.000.000.010.000.040.050.03-0.070.040.00
Mg0.650.542.600.070.502.550.070.480.810.792.232.061.54-2.301.670.06
Ca0.310.150.000.000.380.000.000.331.040.850.100.140.10-0.020.020.05
Na0.020.020.000.000.050.000.000.070.000.000.451.810.73-0.030.020.00
K0.170.190.930.000.000.940.000.000.000.010.160.480.10-0.290.180.13
(Sum)(12.59)(12.58)(15.00)(12.62)(12.58)(14.96)(12.62)(12.57)(2.00)(1.90)(14.87)(14.86)(14.14)-(18.69)(17.87)(16.05)
Mg#777149-6549-66--394038-3738-
[VI]Al3.243.440.314.433.380.374.443.43--0.410.551.54-4.125.157.75
[IV]Al0.250.422.311.680.492.251.680.50--2.782.572.30-1.200.68−0.25
[A]Ca+Na+K0.500.360.930.000.420.940.000.40--0.280.650.22-0.340.240.19
Table 4. Results of vitrinite reflectance analyses and calculated temperatures for coal layer samples from the boreholes (B4_5.1 m and B6_8.6 m) and outcrop sample (KT5) of the Shakubetsu Formation. See Figure 1b, Figure 2a and Figure 3 for the localities of analyzed coal layers. σ is one standard deviation.
Sample
Number
Mean
of
Ro%
Number
of
Analysis
Minimum RoMaximum RoCalculated
Temperature ± 1σ
B4_5.1 m0.50650.450.550.02747.3 ± 7.9 °C
B6_8.6 m0.52870.460.570.03347.7 ± 9.8 °C
KT50.50950.430.570.03747.3 ± 11.0 °C
Publisher’s Note: MDPI stays neutral with regard to jurisdictional claims in published maps and institutional affiliations.

