Abstract
Based on the lateral consolidation compression experiment of remolded soil simulating the effects of pile driving and soil squeezing, in this paper, the microstructures of soil with different degrees of lateral consolidation were investigated by a scanning electron microscope. Combined with Image-Pro Plus software to process data, parameters such as the equivalent diameter, porosity, circularity, directional frequency and fractal dimension of the soil microstructure were analyzed. The results demonstrate that the microstructure of the soil sample before consolidation was debris, aggregated particles and irregular flake aggregates. Following consolidation, the microstructure became a closed flake structure, where an obvious agglomeration phenomenon occurred. During the process of lateral consolidation compression, the large pore structure was more likely to be compressed and damaged, resulting in a decrease in the equivalent pore diameter and plane porosity, the approaching of circularity towards unity and an increase in the compaction and homogenization of soil with obvious directionality. Soil particles moved continuously under the action of consolidation compression to adjust the microstructure, and the fractal dimension gradually increased. Then, as consolidation compression continued, it gradually developed to a new equilibrium state, where the fractal dimension began to decrease and approach stability.
1. Introduction
Because of its excellent quality, high construction efficiency, low pollution and low noise, the static pile technique has been widely utilized in engineering construction. Static piles, on the other hand, cause compaction effects during building. Due to the incompressibility of the soil around the pile in a short period, a high excess pore water pressure is formed during construction, and the displacement of the soil is transformed from small to large. It induces changes in the mechanical properties of the soil, leading to an action of squeezing [1,2,3,4,5,6,7]. In the end, it may result in the displacement of piles, floating piles or even fractured piles, as well as uneven settling of neighboring structures and the cracking of pipelines [8,9,10].
As a result, researchers have conducted extensive research on the topic of the soil squeezing effect of static piles from many perspectives. The topic is now being studied through the use of theoretical calculation approaches [11,12,13,14,15,16,17], laboratory and field experiments [3,4,18,19,20,21] and numerical calculations [22,23,24,25,26,27]. Among them, three main theories may be used to evaluate the mechanical properties of static piles: the cavity expansion method (CEM) [11,12,13,14], the strain path method (SPM) [5,7,16] and the limit equilibrium method (LEM) [17], although each has its own set of limitations. In addition, Liu [19] conducted piling tests under various conditions of centrifugal acceleration and discovered that the displacement of soil increased as piling depth increased. The displacement was lessened when the pile penetrated to eight ~ ten times the diameter of the pile. The radial displacement of extruding soil reached a peak value when the prestressed high-strength concrete (PHC) pipe pile penetrated to five ~ eight meters, according to Xing et al. [20], then gradually reduced along with the distance in the construction direction. Lei et al. [21] investigated the squeezing effect of PHC pipe piles using a field test and numerical simulation and then calculated the changes in pore pressure surrounding the pipe and the distribution of the displacement of soil during piling. Shao et al. [25] used ABAQUS to study the squeezing effect of PHC pipe piles, including the upheaval of the surface, the displacement of lateral soil and the stress field of soil with changing depths during piling. Yi et al. [26,27] used ABAQUS to perform the undrained effective stress of an Euler finite element analysis on the penetration of pile boots in clay and investigated the impacts of various material models on penetration resistance and excess pore water pressure.
The macroscopic mechanical properties of the soil represent the various strengths and deformation characteristics, and they are the external manifestation of the structural features of the soil. The above research investigates the variation law of stress and displacement of soil, as well as excess pore water pressure surrounding the pile during pile driving, using macro mechanics. However, the macro-mechanical approach fails to account for changes in the microstructure of soil, and the physical interpretations of several parameters are somewhat ambiguous. Previous studies have shown that macro-mechanical characteristics and the performance of the soil squeezing effect are largely reliant on the microstructure of the soil [28,29,30,31], and the strength and deformation behavior of the soil is substantially impacted by its stress state [32,33,34]. At present, there is little research on the microstructure of the soil squeezing effect. In engineering, piles squeeze out the surrounding soil during the process of driving, and the pore water pressure dissipates from the higher pore pressure area to the lower pore pressure area, causing the soil around the pile to consolidate. The issue of soil squeezing during static pile driving is also a problem of lateral consolidation compression. Hence, it is important to reveal the regular relationship between the soil squeezing effect caused by the pile driving and the changes in the microstructure of the soil around the pile. Furthermore, in order to clearly understand the soil squeezing effect during pile driving, it is also of great significance to establish the relationship between the microstructural characteristics of the soil surrounding the pile and its macroscopic mechanical properties.
In this study, using Hangzhou soft clay as the research object, the consolidation compression experiment of the soil in the horizontal direction was carried out to model the radial compression impact of the static pile on the soil around the pile. The experimental samples were obtained for electron microscope scanning, and a qualitative investigation of microstructure features was realized. Using image processing, the influence of static pile driving on the microstructure parameters of soil around the pile was explored, and the essence of the action of soil squeezing by static pile driving was discovered. In practical engineering, the experimental conclusions have guided relevance for developing effective measures to reduce or limit the soil squeezing effect.
2. Materials and Methods
2.1. Experimental Materials
The original soil for this experiment comes from Liangzhu Station of Hangzhou Metro Line 2, which is typical of saturated soft clay in Hangzhou. In order to reduce the influence of the homogeneity difference of undisturbed soil on the experimental findings, a novel intelligent kind of self-developed, multi-connected and vacuum pre-loading equipment for remolded soil is employed in this experiment to prepare remolded soil, as shown in Figure 1. The novel intelligent kind of self-developed, multi-connected and vacuum pre-loading equipment includes three preparation buckets of the soil sample, one vacuum water tank and drainage bucket, one vacuum pump and one set of intelligent control and display systems. The preparation process of the remodeled soil includes: (1) drying the soil sample; (2) crushing and screening out fine particles of dry soil; (3) mixing with water and stirring evenly; (4) pouring into the preparation device and tightening the sealing cover; (5) turning on the equipment to vacuum and to achieve consolidation; and (6) taking out the soil sample for use. The specific process is detailed in the works of [35,36].
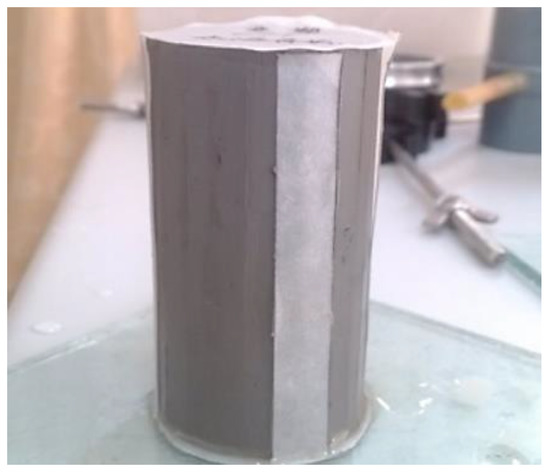
Figure 1.
The remolded soil sample.
In addition, the QUANTA FEG 650 field emission scanning electron microscope (FEI Company, Eindhoven, The Netherlands) is used to observe the microstructure of the remolded soil samples to ensure the comparability and accuracy of the follow-up research results, as shown in Figure 2. Then, by comparing the parameters of pore structure, the results demonstrate that the remolded soil samples prepared by this experimental equipment have good uniformity [35]. The physical and mechanical parameters of the remolded soil samples are listed in Table 1.
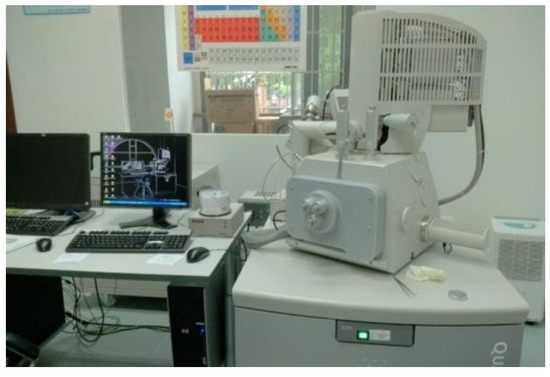
Figure 2.
The QUANTA FEG 650 field emission scanning electron microscope.

Table 1.
Physical and mechanical parameters of the soil sample.
2.2. Experimental Plan
2.2.1. Consolidation Compression Experiment
To better understand the mechanism of soil squeezing during pile driving in soft soil areas, the effect of the lateral compaction of pile driving on the soil around the pile is investigated in this paper. This study employs a standard consolidation instrument to conduct a horizontal consolidation experiment on soil samples to simulate the lateral compaction of the static pile. In order to explore the long-term influence of the lateral extrusion effect during the construction of static piles, the compression pressure is kept at 0.2 MPa, and the compression time is controlled at 30, 60, 240, 720 and 1440 min. Table 2 shows the experimental plan (each experimental group is repeated three times).
Table 2.
Consolidation compression experiment.
The detailed steps are as follows:
- According to the needs of the experiment, laterally select a ring knife with an area of 30 cm2 to take the horizontal soil samples;
- Install a ring knife with a soil sample in the consolidation instrument (the knife edge should be downward), paste clean and moist filter paper on both ends of the soil sample and put a permeable stone on it. Then, place the pressure guide ring, pressure plate and directional steel ball on the top of the permeable stone in sequence;
- Check whether the connection of each part is flexible, and then pressurize;
- After the beam is in contact with the ball, insert the piston rod and load it at 0.2 MPa;
- At the end of the experiment, remove the weight, raise the pressure plate, remove the consolidation instrument and clean the instrument after taking out the soil sample.
2.2.2. SEM Experiment
In this study, a scanning electron microscope (SEM) is adopted for the analysis of the soil’s microstructure. After the consolidation compression experiment, soil samples from various experimental conditions are used as SEM samples.
The preparation of the SEM sample is the basis of capturing SEM images. To ensure that the scanning image can accurately reflect the true morphology of the sample, certain requirements should be met in the preparation of SEM samples: the disturbance and damage of the samples should be minimized, the shrinkage deformation of the sample should be minimized in the drying process, uniformity should be ensured as much as possible when spraying the conductive medium and the thickness of the samples should be appropriate [36,37].
The process of preparation is as follows:
- The samples after different consolidation times are reserved and dried. The horizontal section of the sample is selected as the observation surface. When the sample reaches a semi-solid state, the core of the sample is selected, and a soil strip with a length of about 5 cm and a cross-section of about 1 cm × 1 cm is cut out and dried.
- To ensure that the observation section is not disturbed, cut and grind the sample into a microscopic sample of 5 mm × 5 mm × 2 mm, and then use an ear-washing ball to blow off loose soil particles on the observation section.
- Due to the poor conductivity of soft clay, a gold film of 20~50 nm should be sprayed on the surface of the sample as a conductive material before scanning to assure the quality of microscopic images.
Furthermore, the selection of the amplification factor has a non-negligible effect on the accuracy of the SEM images. In addition, differences in the microstructure of soil samples from various areas may have existed [38,39]. Therefore, to ensure the accuracy of the SEM images, an appropriate magnification factor must be adjusted, and many images of the soil samples must be collected. Considering the small size of clay particles in soft soils, combined with the research results of the previous literature [40], after careful consideration, the magnification in this study is set as 8000 times, and the number of SEM images of each soil sample is set as 20.
3. Results and Discussion
3.1. Qualitative Analysis of Soil Microstructure
At 8000 times magnification, microscopic images of representative sections of each SEM sample were captured. Particle morphology, connection mode and pore shape and size were used to evaluate changes in the microstructure of soil samples under different experimental conditions. Figure 3 shows SEM images of the samples under different compression consolidation times.
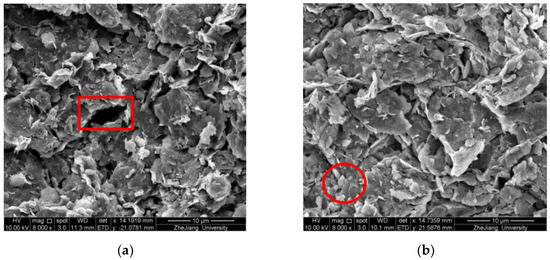
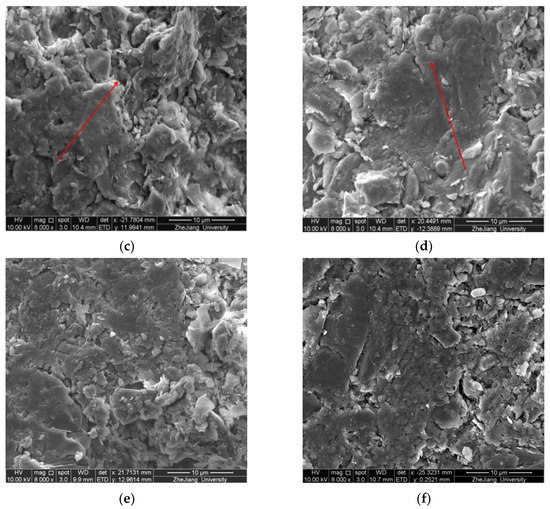
Figure 3.
Microstructure of soil samples under different consolidation times: (a) 0 min; (b) 30 min; (c) 60 min; (d) 240 min; (e) 720 min; (f) 1440 min.
Figure 3a shows that the sample had a flocculation structure before consolidation, and individual particles were spread as debris, aggregates and irregular flake-like aggregates. There was cementation between the particles, but no directionality. Numerous huge pores were discontinuous and isolated (shown as rectangles in Figure 3a). Particle gaps were widely distributed, and the integrity was poor. Figure 3b reveals that, after 30 min of consolidation, there were more flaky joints, fewer large pores and a significant increase in small pores, showing the dispersion of debris and feather flocs (shown as circles in Figure 3b), although the direction was not evident. This is because soil skeleton particles were crushed and broken during the consolidation process, and the large pores were crushed first, resulting in one pore being crushed into two or more. As a result, the medium pores were crushed as well, resulting in fewer medium and large holes and an increase in the number of small pores. As the consolidation time increased, soil samples formed bigger aggregates composed of edge–edge and edge–surface between flake-like structures. Such a trend was in conformity with the study on the evolution of the microstructure of soft clay under consolidation loading conducted by Zheng et al. [41]. As the degree of soil compaction rose, the connection strength also increased, and the arrangement became more ordered (marked as arrows in Figure 3c,d). Over a long period of consolidation, neighboring soil particles approached, aggregated and compacted, and then the microstructure transformed from a skeleton-type overlapping structure to a closed-type flake structure, resulting in an obvious agglomeration event. The connection mode between structural units, which was previously based mostly on edge–edge and edge–surface, shifted to one dominated by surface–surface, and the structure became more stable. Therefore, the compaction effect of the soil was significant at the microscopic scale.
When the six images below are compared, it is clear that the long-term consolidation process involved the breaking of large holes, increases in small and medium pores and the gradual compression of the soil. The above findings reflect the qualitative change in soil after consolidation and compression under different test conditions. Macroscopically, the axial strain of the soil sample increased after long-term consolidation and compression. The experimental findings show that the change in the mesostructure can explain the macroscopic properties of soft soil after lateral consolidation and compression to a certain extent.
3.2. Quantitative Analysis of Soil Microstructure
The existence of pores in the soil structure was one of its important characteristics, and the microscopic characteristics of the pores had a direct impact on the macroscopic engineering properties of the soil. The major factor impacting the structural properties of soft soil following lateral compression was the change in pore characteristics. As a consequence, the changes in pore characteristics as a function of consolidation time were quantitatively analyzed, and the weakening mechanism of the soft soil structure as a result of pile driving is discussed in this study.
In this study, Image-Pro Plus 6.0 (IPP) was utilized for image processing and quantitative analysis. The purpose of image processing was to extract information from the images and output data of pore characteristics for statistical analysis. The processing steps were divided into three: the calibration of the pixel space, binarization processing and automatic software analysis [37]. (1) Firstly, a calibration of the pixel space was required. The experiment of the field emission scanning electron microscope in this study adopted a magnification of 8000 times, allowing a unified pixel space to be used for calibration. (2) Secondly, when converting a grayscale image to a binary image, the setting of the threshold was critical for SEM image processing. Due to the differences in the light and uniformity of gold plating during the photographing, many particles in the images were present in the pores, not just on the sliced surface of the sample. If the threshold was set too high, these particles were regarded as pores, and if the threshold was set too low, some tiny pores near the soil particles were counted as soil particles. As a result, during the binarization process, a suitable threshold must be selected, as shown in Figure 4. After binarization, the white part of the image represents soil particles, whereas the black part represents pores. The color may also be changed according to the requirements. (3) Finally, after binarization, IPP software could identify, mark and obtain the characteristic parameters of the microstructure, and it could count parameters such as the diameter, area, perimeter, shape factor, roundness, etc., as shown in Figure 5.
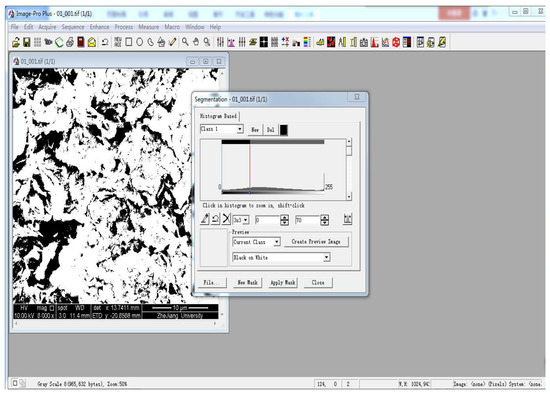
Figure 4.
Image binarization processing.
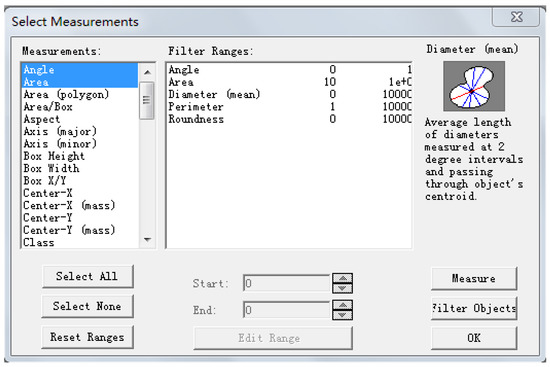
Figure 5.
Schematic of selecting measurements.
In this section, the following parameters were selected to analyze the changes in pore characteristics:
- Diameter D
The diameter is the most basic feature to describe the size of pores. The diameter of the pores is the average value of the length of the line connecting two points on the contour of the selected object and passing through the centroid.
- 2.
- Equivalent diameter D′
The equivalent diameter is the diameter of the equivalent circle with the same area as the pore, and its calculation formula is:
where A is the area of the pore.
- 3.
- Planar porosity P
Planar porosity is the percentage of the measured area of the pore to the total area of the image, and its calculation formula is:
where A1 is the total area of particles and pores.
- 4.
- Circularity R0
3.2.1. Equivalent Diameter of Pores
Figure 6 shows the curve of the average equivalent diameter of pores under different consolidation times. The equivalent diameter decreased as the consolidation time continued to increase. This is because the deformation of the soil during the consolidation process was primarily caused by the combined influence of structural connection, structural units and pores. The existence of pores in soil samples, in particular, was the root cause of structural crushing and damage. Under the action of an external force, the connection of some soil particles was destroyed and created a structure of scattered debris. In addition, the large pores were extruded, and the area was reduced, after which the particles were cohesive, compressed and recombined with each other, resulting in a reduction in the particle spacing and a decrease in the average equivalent diameter of the pores.
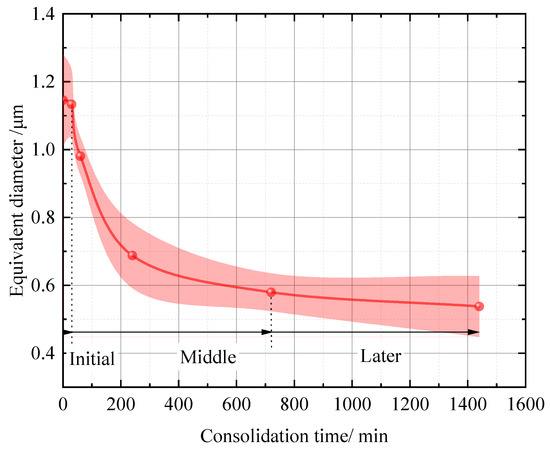
Figure 6.
The curve of the average equivalent diameters of pores under different consolidation times.
In addition, the change in the average equivalent diameter of pores throughout the consolidation process may be broadly divided into three stages, as shown in Figure 6: (1) At the initial stage of consolidation, with the alternate appearance of aggregation and damage of soil particles, the equivalent diameter decreased slightly. (2) At the middle stage of consolidation, the large pores were compressed sharply and filled with particles, the particles gradually approached, the structure seemed to be connected and the soil became more compact. (3) At the later stage of consolidation, as time passed, the adjustment of particle aggregation and dispersion in the soil slowed down, and the area of the pore approached a constant value. The rate at which the equivalent diameter decreased slowed, indicating that the consolidation process was nearly complete.
It is worth noting that the equivalent diameter of the soil decreased quickly between 60 and 240 min, corresponding to the middle stage of consolidation, and the soil sample already belonged to the disturbed soil with poor structural strength. As a result, more attention should be paid to the control of soil deformation in practical engineering during the middle stage of piling.
3.2.2. Planar Porosity
Figure 7 shows the curve of plane porosity under different consolidation times. It follows the same trend and stage as the equivalent diameter in Figure 6. Overall, under the action of a certain pressure, the space between soil particles decreased continuously, and the plane porosity decreased with time. This change rule reflects the fact that, with continuous consolidation, the amount of area occupied by pores in the soil decreases, and the structural units come closer together.
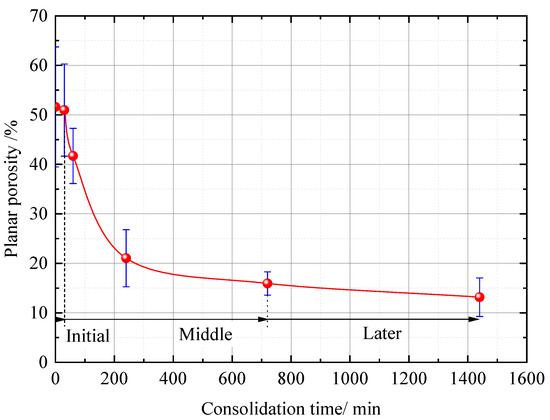
Figure 7.
The curve of plane porosity under different consolidation times.
Because of the existence of structural strength, the pores in the soil did not change much during the initial stage of consolidation. Under long-term pressure, the large pores gradually reduced, the curve entered a stable stage with a considerable decline and the plane porosity tended to a certain value. This is because, once the pores reached a certain size, they would no longer be damaged. However, within a particular scale, they gradually compressed, resulting in an area of the pore that was basically unchanged and a porosity that was basically constant [42].
3.2.3. Pore Circularity
The circularity is defined as the degree to which the measured pore shape resembles a circle, with a value range of [0, 1]. As the particle becomes more rounded, it becomes more circular. Figure 8 shows the curve of pore circularity under different consolidation times. When compared to before consolidation, the circularity of the pores in the soil sample increased during consolidation compression. The pores of the soil sample became more regular and closer to a circle after consolidation. This is because, during the consolidation compression process, the soil particles rearranged and formed a more stable equilibrium condition. At this time, the pores were smaller, the soil particles were more intimately coupled and the arrangement was more directed, which improved the homogeneity of the pores. Similar results have also been presented by Di et al. [43], who proposed that, under the initial consolidation stress, structural units are compressed and structurally adjusted, and the shape becomes oblate.
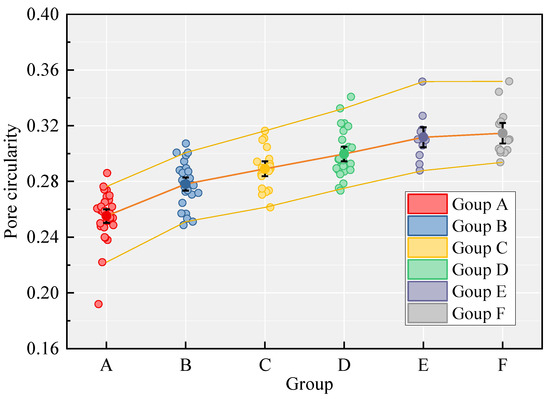
Figure 8.
The curve of the circularity of pores under different consolidation time.
In addition, the authors discovered that, at the initial stages of consolidation, particle damage is greater, and growth is more obvious, whereas at the later stage, particle shape and pore shape are more stable, and the curve is flatter. This demonstrates that recombination and aggregation occur among structural units under the consolidation pressure, and the degree of homogeneity of the pore tends to approach with time [43]. This conclusion is supported by the results of equivalent diameter and plane porosity.
3.2.4. Distribution of Pores
The curve of pore distribution can intuitively and quantitatively reflect the composition and distribution of pores. In this study, for the convenience of analysis, the pores of the soil samples were divided into the following categories: large pores, with diameters of d > 1.0 μm; medium pores, with diameters of 0.5 μm < d < 1.0 μm; medium and small pores, with diameters of 0.3 μm < d < 0.5 μm; small pores, with diameters of 0.2 μm < d < 0.3 μm; and micropores, with diameters of 0.1 μm < d < 0.2 μm. Figure 9 shows the curve of soil pore diameter under different consolidation times.
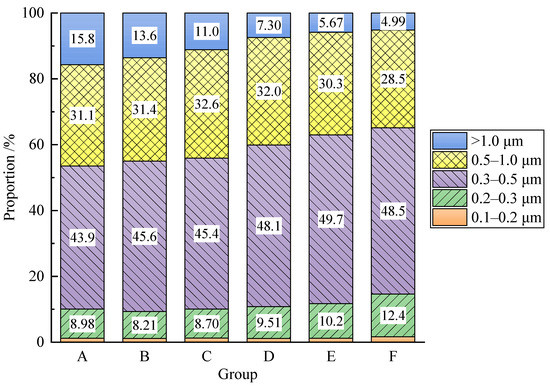
Figure 9.
The curve of soil pore diameter under different consolidation times.
The pore components with pore sizes ranging from 0.3 μm to 1.0 μm completely dominated the soil samples, accounting for roughly 65 percent of the total area of the pore. During the initial stage of consolidation, the composition of each pore size did not vary much, and only a portion of the content of large pores decreased. Since large pores were more easily crushed into tiny pores than small pores, as consolidation time increased, the components of large pores decreased dramatically, whereas the components of small holes grew significantly. Furthermore, the area of the micropore group was almost within a certain range, and the proportion was quite little. This is because the micropores were not sufficiently compressed under the experimental circumstances. Only a small percentage of medium or small pores were broken up, resulting in a slight increase in micropore proportion.
It can be seen that the changes in pore size caused by consolidation were not equal for each pore group, and only visible pores made the corresponding adjustments. This adjustment broke the original form of the distribution of particle size and replaced it with a new structural form that was compatible with consolidation compression [44].
3.2.5. Directional Frequency of Pores
In order to represent the changes in the distributional intensity of the unit body in a certain direction, 0°~180° is divided into n equal parts (locations), and the angle range of the representative director of each location is . From this, the directional frequency of the i-th location unit body in the n locations ranging from 0° to 180° can be obtained:
where mi is the number of elliptical units in the i-th location along the long axis direction, and M is the total number of units or pores. By changing the value in Equation (4), i.e., changing the number of divided locations, different distributions of directional frequency can be obtained. This study takes .
The distribution of pores in each direction can be seen from the wind rose diagram of the directional frequency of pores in Figure 10. The pores in the unconsolidated soil sample were uniformly distributed without noticeable directionality in all directions. After a time of consolidation, the directional frequency of pores at a certain location in the range of 0° to 180° increased significantly. The directional angles of the pores in group F, for example, were mostly concentrated between 70° and 100°, indicating that consolidation caused the pores in the soil to develop in a certain direction and that the distribution of the pore was more directional. The weak connection between soil particles in some directions was disrupted under the action of consolidation pressure, making the connection in one direction significantly weaker than in other directions. Then, the soil structure would continue to break along this direction, extend to the entire section and eventually form a particular direction angle.
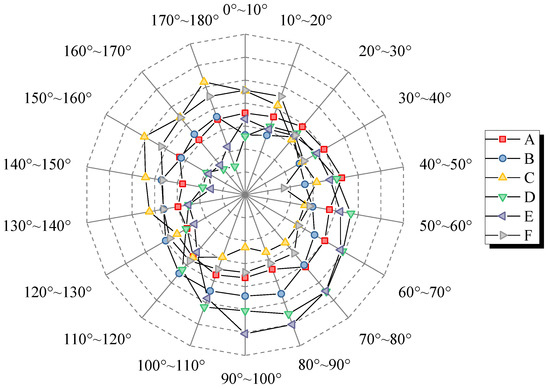
Figure 10.
A wind rose diagram of the directional frequency of pores under different consolidation times.
Furthermore, because of the varying locations of the scanned images of the samples, the directionality of the pores was not constant, and the final directional angles were not completely concentrated. This demonstrates that the direction of soil particles during the consolidation process was random and that the consolidation compression and even the damage of soil particles were unequal and unpredictable. In addition, the deformation was frequently concentrated in particular areas, whereas other areas rarely changed. As a result, it is necessary to further understand the arrangement law of soil particles after lateral consolidation in future research, which can be helpful to grasp the inherent law of soil deformation and stability under the effect of pile driving and soil squeezing. It also has practical and important engineering guiding significance for the safe protection of pile driving.
3.2.6. Fractal Dimension of Pores
Previous studies have shown that soil particles and pores can be described by the fractal dimension [45,46]. The fractal dimension is used to characterize the distribution of pores and to deeply analyze the deformation features of soil samples under the action of lateral consolidation compression. The area–perimeter method is used for the calculation of the fractal dimension, and its basic principle is as follows:
where L is the perimeter of the pore; A is the area of the pore; C is a constant; and G is the fractal dimension of the pore. The general value range of G is [1, 2], and as G becomes larger, the pore structure becomes more complex.
Figure 11 shows the fitted curves of the fractal dimension of each experimental group according to Equation (5). Then, the fractal dimension of each group was calculated, which was plotted against consolidation time, as shown in Figure 12. Figure 12 shows the curve of the fractal dimension of soil pores under different consolidation times. Based on the above microstructure investigation, the curve of the fractal dimensions was also separated into three stages. When compared to before consolidation, soil samples after remolding treatment exhibited good homogeneity and simple pore structures. During the initial stage of consolidation, large soil particles were crushed and divided into small particles, and the development of small soil particles resulted in the formation of small holes between the small particles [41]. At this time, the pore structure became more complicated, and the fractal dimension grew. Then, the soil microstructure began to be reconstructed, and soil particles moved continuously under the action of consolidation compression to adjust the microstructure and to gradually evolve to a new equilibrium state. The fractal diameter of the pores decreased over time. As a result of consolidation, the area of the pores decreased, the shape became smoother, the degree of the homogeneity of the pores rose and the complexity of the pore structure was reduced. At the later stage of consolidation, the change in the microstructure of the soil slowed down, and the fractal dimension of pores varied only a little. The microstructure was restructured and eventually reached a new equilibrium.
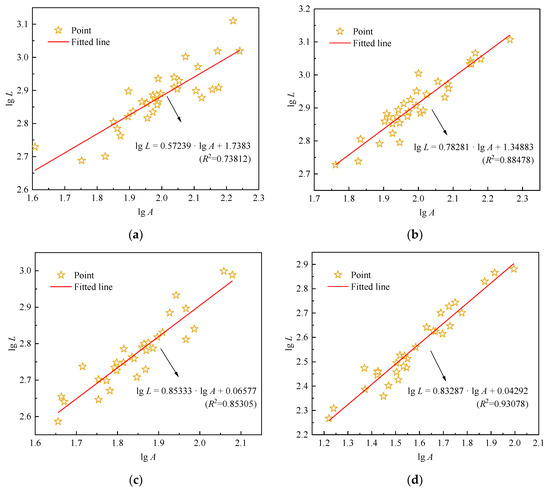

Figure 11.
Fitted curves of the fractal dimension of each experimental group under different consolidation times: (a) 0 min; (b) 30 min; (c) 60 min; (d) 240 min; (e) 720 min; (f) 1440 min.
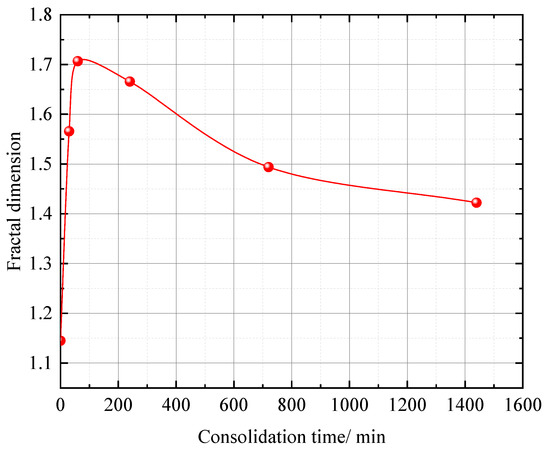
Figure 12.
The curve of fractal dimension of soil pores under different consolidation time.
4. Conclusions
In this study, an experiment of the lateral consolidation compression of remolded soil was used to explore the influence of pile driving and soil squeezing. Scanning electron microscopy was used to examine microscopic pictures of soil with varying consolidation times. In addition, the data of pore characteristics were processed with IPP software to perform qualitative and quantitative investigations of the microstructure of the soil. The following conclusions were obtained:
- The microstructures of the soil sample before consolidation comprised debris, aggregated particles and irregular flake-like aggregates, with large pores between particles and no directional arrangement. After consolidation, the microstructure became a closed-type flake structure, and an obvious agglomeration phenomenon occurred. The connection mode of edge–edge and edge–surface between structural units shifted to the connection mode dominated by surface–surface. In addition, the soil mass was laterally compressed, and the structure tended to be stable.
- During the consolidation compression process, the large pore structure was more likely to be compressed and damaged. The particles were cohesive, compressed and recombining with each other, resulting in a decrease in the equivalent pore diameter and plane porosity, a decrease in the area of small pores and an increase in the compactness of the soil. Furthermore, the fact that circularity was approaching unity indicated that, after consolidation, the degree of the homogeneity of the soil grew, and the soil exhibited obvious directionality. When the soil particles moved continuously under the action of consolidation compression to adjust the microstructure, the fractal dimension increased. The soil then progressively evolved to a new equilibrium condition, where the fractal dimension began to decrease and approach stability.
- The changes in soil microstructure during the lateral compression experiment simulating the effects of pile driving and soil squeezing were divided into three stages. Special emphasis should be paid to the large change in micro-properties of soil that was subjected to lateral compression pressure at the middle stage. In addition, lateral displacement was prevalent, and the influence of soil extrusion was significant. At the later stages, the pore water pressure was considerably dissipated, and then the structural adjustment of the soil advanced to a somewhat stable stage. Within this period, the effect of soil squeezing induced by adjacent construction would be significantly lessened. Controlling the speed of pile driving, the sequence of pile driving and the time interval between neighboring pile driving are all recommended as efficient methods to reduce the effect of pile driving and soil squeezing.
In this study, stress redistribution and the rearrangement of particles may be caused by sampling for SEM analysis, and this disturbance cannot be effectively avoided during the operation of the experiment. However, the error can be eliminated as much as possible through multiple experiments. Therefore, it is necessary to note that this experiment has certain limitations, and it is hoped that future research makes breakthroughs in this field. Moreover, in view of the evolution law and microscopic mechanism of soil samples under lateral consolidation compression, Nuclear Magnetic Resonance Technology (NMR) can be used for further discussion in the future.
Author Contributions
Conceptualization, Z.D.; methodology, X.Z. and Z.D.; software, X.Z. and M.-M.S.; formal analysis, X.Z. and S.-H.H.; investigation, X.Z., G.-D.Z. and T.-D.X.; resources, Z.D.; data curation, X.Z.; writing—original draft preparation, X.Z. and Z.D.; writing—review and editing, X.Z. and S.-H.H.; visualization, X.Z.; funding acquisition, Z.D. All authors have read and agreed to the published version of the manuscript.
Funding
This research was funded by the Chinese National Natural Science Foundation (Grant No. 52178400), the Key Project of Zhejiang Provincial Natural Science Foundation (Grant No. LHZ20E080001), the Zhejiang Provincial Key Research and Development Project (Grant No. 2020C01102) and the Scientific Research Cultivation Fund of Zhejiang University City College (Grant No. J-202112).
Data Availability Statement
The data are available from the corresponding author upon request.
Acknowledgments
The authors are very grateful to Yu Peng from Zhejiang University for his kind guidance and help in the SEM experiment.
Conflicts of Interest
The authors declare no conflict of interest.
References
- Cooke, R.W.; Price, G.; Tarr, K. Jacked piles in London Clay: A study of load transfer and settlement under working conditions. Geotechnique 1979, 29, 113–147. [Google Scholar] [CrossRef]
- Gong, X.N.; Li, X.H. Several mechanical problems in compacting effects of static piling in soft clay ground. Eng. Mech. 2000, 17, 7–12. [Google Scholar]
- Hagerty, D.J.; Peck, R.B. Heave and lateral movements due to pile driving. J. Soil Mech. Found. Div. 1971, 97, 1513–1532. [Google Scholar] [CrossRef]
- Huang, J.H.; Liang, N.; Chen, C.H. Ground response during pile driving. J. Geotech. Geoenviron. Eng. 2001, 127, 939–949. [Google Scholar]
- Doherty, P.; Gavin, K. Shaft capacity of open-ended piles in clay. J. Geotech. Geoenviron. Eng. 2011, 137, 1090–1102. [Google Scholar] [CrossRef] [Green Version]
- Kim, D.; Bica, A.V.; Salgado, R.; Prezzi, M.; Lee, W. Load testing of a closed-ended pipe pile driven in multilayered soil. J. Geotech. Geoenviron. Eng. 2009, 135, 463–473. [Google Scholar] [CrossRef]
- Sagaseta, C.; Whittle, A.J. Prediction of ground movements due to pile driving in clay. J. Geotech. Geoenviron. Eng. 2001, 127, 55–66. [Google Scholar] [CrossRef]
- Luo, Z.Y.; Xia, J.Z.; Gong, X.N.; Zhu, X.R. Comparative study of dynamic simulation for compacting displacement of jacked pile and in situ test. Chin. J. Rock Mech. Eng. 2008, 27, 1709–1715. [Google Scholar]
- Luo, Z.Y.; Tao, Y.; Gong, X.N.; Zou, B.P. Soil compacting displacements for two jacked piles considering shielding effects. Acta Geotech. 2020, 15, 2367–2377. [Google Scholar] [CrossRef]
- Kou, H.L.; Chu, J.; Guo, W.; Zhang, M.Y. Field study of residual forces developed in pre-stressed high-strength concrete (PHC) pipe piles. Can. Geotech. J. 2016, 53, 696–707. [Google Scholar] [CrossRef]
- Carter, J.P.; Booker, J.R.; Yeung, S.K. Cavity expansion in cohesive frictional soils. Geotechnique 1986, 36, 349–358. [Google Scholar] [CrossRef]
- Cao, L.F.; Teh, C.I.; Chang, M.F. Undrained cavity expansion in modified Cam clay I: Theoretical analysis. Geotechnique 2001, 51, 323–334. [Google Scholar] [CrossRef]
- Li, L.; Li, J.; Sun, D.; Gong, W.B. A feasible approach to predicting time-dependent bearing performance of jacked piles from CPTu measurements. Acta Geotech. 2020, 15, 1935–1952. [Google Scholar] [CrossRef]
- Luo, Z.Y.; Zhu, X.R.; Gong, X.N. Expansion of spherical cavity of strain-softening materials with different elastic moduli of tension and compression. J. Zhejiang Univ.-Sci. A 2007, 8, 1380–1387. [Google Scholar] [CrossRef]
- Chow, Y.K.; Teh, C.I. A theoretical study of pile heave. Geotechnique 1990, 40, 1–14. [Google Scholar] [CrossRef]
- Sagaseta, C.; Whittle, A.J.; Santagata, M. Deformation analysis of shallow penetration in clay. Int. J. Numer. Anal. Methods Geomech. 1997, 21, 687–719. [Google Scholar] [CrossRef]
- Yang, S.; Liu, J.; Garg, A.; Zhang, M.Y. Analytical solution for estimating bearing capacity of a closed soil plug: Verification using an on-site static pile test. J. Mar. Sci. Eng. 2020, 8, 490. [Google Scholar] [CrossRef]
- Hird, C.C.; Ni, Q.; Guymer, I. Physical modelling of deformations around piling augers in clay. Geotechnique 2011, 61, 993–999. [Google Scholar] [CrossRef]
- Liu, W.W. Axisymmetric Centrifuge Modelling of Deep Penetration in Sand. Ph.D. Thesis, University of Nottingham, Nottingham, UK, 2010. [Google Scholar]
- Xing, H.F.; Zhao, H.W.; Ye, G.B.; Xu, C. Effect of driving long pre-stressed high-strength concrete pipe piles in alluvium and its mechanical behavior. Bull. Eng. Geol. Environ. 2012, 71, 771–781. [Google Scholar] [CrossRef]
- Lei, H.Y.; Li, X.; Lu, P.Y.; Huo, H.F. Field test and numerical simulation of squeezing effect of pipe pile. Rock Soil Mechs 2012, 33, 1006–1012. [Google Scholar]
- Mabsout, M.E.; Reese, L.C.; Tassoulas, J.L. Study of pile driving by finite-element method. J. Geotech. Eng. 1995, 121, 535–543. [Google Scholar] [CrossRef]
- Osinov, V.A. Application of a high-cycle accumulation model to the analysis of soil liquefaction around a vibrating pile toe. Acta Geotech. 2013, 8, 675–684. [Google Scholar] [CrossRef]
- Liu, J.; Duan, N.; Cui, L.; Zhu, N. DEM investigation of installation responses of jacked open-ended piles. Acta Geotech. 2019, 14, 1805–1819. [Google Scholar] [CrossRef]
- Shao, Y.; Wang, S.; Guan, Y. Numerical simulation of soil squeezing effects of a jacked pipe pile in soft foundation soil and in foundation soil with an underlying gravel layer. Geotech. Geol. Eng. 2016, 34, 493–499. [Google Scholar] [CrossRef]
- Yi, J.T.; Lee, F.H.; Goh, S.H.; Zhang, X.Y.; Wu, J.F. Eulerian finite element analysis of excess pore pressure generated by spudcan installation into soft clay. Comput. Geotech. 2012, 42, 157–170. [Google Scholar] [CrossRef]
- Yi, J.T.; Goh, S.H.; Lee, F.H.; Randolphm, F. A numerical study of cone penetration in fine-grained soils allowing for consolidation effects. Géotechnique 2012, 62, 707–719. [Google Scholar] [CrossRef]
- Koolen, A.J. Deformation and compaction of elemental soil volumes and effects on mechanical soil properties. Soil Tillage Res. 1987, 10, 5–19. [Google Scholar] [CrossRef]
- Zhang, J.X.; Zhao, J.J.; Niu, L. Analysis of soil microstructure components for squeezing effect by pile-driving. J. Eng. Geol. 2011, 19, 231–237. [Google Scholar]
- Li, F.R.; Sun, H.C.; Wang, Z.Y. Mechanism Analysis and Experimental Study of Soil-Compacting by Silent Piling. Appl. Mech. Mater. 2012, 170, 457–460. [Google Scholar] [CrossRef]
- Xu, J.; Shen, Y.; Sun, Y. Cyclic Mobilisation of Soil–Structure Interface in the Framework of Fractional Plasticity. Fractal Fract. 2022, 6, 76. [Google Scholar] [CrossRef]
- Sun, Y.F.; Gao, Y.F.; Zhu, Q. Fractional order plasticity modelling of state-dependent behaviour of granular soils without using plastic potential. Int. J. Plast. 2018, 102, 53–69. [Google Scholar] [CrossRef]
- Sun, Y.F.; Sumelka, W.; Gao, Y.F.; Nimbalkar, S. Phenomenological fractional stress–dilatancy model for granular soil and soil-structure interface under monotonic and cyclic loads. Acta Geotech. 2021, 16, 3115–3132. [Google Scholar] [CrossRef]
- Sun, Y.F.; Sumelka, W. Multiaxial stress-fractional plasticity model for anisotropically overconsolidated clay. Int. J. Mech. Sci. 2021, 205, 106598. [Google Scholar] [CrossRef]
- Ding, Z.; Zhang, M.Y.; Wei, X.J.; Hong, Q.H.; Zheng, Y.; Yu, X.F. Study on pore pressure and microstructure of frozen and thawed soft soil under subway cyclic loading. Chin. J. Rock Mech. Eng. 2016, 35, 2328–2336. [Google Scholar]
- Zhang, M.Y. Experimental Study on Dynamic Characteristics and Microstructure of Freeze-Thaw Soft Soil under Subway Cyclic Loading. Ph.D. Thesis, Zhejiang University, Hangzhou, China, 2016. [Google Scholar]
- Dai, C.X.; Zhang, Q.F.; He, S.H.; Zhang, A.; Shan, H.F.; Xia, T.D. Variation in micro-pores during dynamic consolidation and compression of soft marine soil. J. Mar. Sci. Eng. 2021, 9, 750. [Google Scholar] [CrossRef]
- Mouret, M.; Ringot, E.; Bascoul, A. Image analysis: A tool for the characterisation of hydration of cement in concrete–metrological aspects of magnification on measurement. Cem. Concr. Compos. 2001, 23, 201–206. [Google Scholar] [CrossRef]
- Scrivener, K.L.; Patel, H.H.; Pratt, P.L.; Parrott, L.J. Analysis of phases in cement paste using backscattered electron images, methanol adsorption and thermogravimetric analysis. MRS Online Proc. Libr. 1986, 85, 67–76. [Google Scholar] [CrossRef]
- Zhou, C.; Yu, L.; Huang, Z.; Liu, Z.; Zhang, L.H. Analysis of microstructure and spatially dependent permeability of soft soil during consolidation deformation. Soils Found. 2021, 61, 708–733. [Google Scholar] [CrossRef]
- Zheng, Y.M.; Sun, H.; Hou, M.X.; Ge, X.R. Microstructure evolution of soft clay under consolidation loading. Eng. Geol. 2021, 293, 106284. [Google Scholar] [CrossRef]
- Zhou, J.; Deng, Y.L.; Cao, Y.; Yan, J.J. Experimental study of microstructure of Hangzhou saturated soft soil during consolidation process. J. Cent. South Univ. 2014, 45, 1998–2005. [Google Scholar]
- Di, S.T.; Jia, C.; Ding, P.P.; Zhu, X. Microstructural Variation of Clay during Land Subsidence and the Correlation between Macroscopic and Microscopic Parameters. Materials 2022, 15, 1817. [Google Scholar] [CrossRef]
- Zhang, X.W.; Kong, L.W.; Guo, A.G.; Tuo, Y.F. Experiment study of pore distribution of strong structural clay under different consolidation pressures. Rock Soil Mech. 2014, 35, 2794–2800. [Google Scholar]
- He, S.H.; Ding, Z.; Hu, H.B.; Gao, M. Effect of Grain Size on Microscopic Pore Structure and Fractal Characteristics of Carbonate-Based Sand and Silicate-Based Sand. Fractal Fract. 2021, 5, 152. [Google Scholar] [CrossRef]
- Ding, Z.; Kong, B.W.; Wei, X.J.; Zhang, W.Y.; Xu, B.L.; Zhao, F.J. Laboratory testing to research the micro-structure and dynamic characteristics of frozen–thawed marine soft soil. J. Mar. Sci. Eng. 2019, 7, 85. [Google Scholar] [CrossRef] [Green Version]
Publisher’s Note: MDPI stays neutral with regard to jurisdictional claims in published maps and institutional affiliations. |
© 2022 by the authors. Licensee MDPI, Basel, Switzerland. This article is an open access article distributed under the terms and conditions of the Creative Commons Attribution (CC BY) license (https://creativecommons.org/licenses/by/4.0/).