Article

Investigation of the Scale Factor Impact on the Results of Acoustic Emission Monitoring of the Steel Specimens Tension Process

1
Moscow Power Engineering Institute, 14, Krasnokazarmennaya Str., 111250 Moscow, Russia
2
Mechanical Engineering Research Institute of the Russian Academy of Sciences, 4, Maly Kharitonyevsky Pereulok, 101990 Moscow, Russia
*
Author to whom correspondence should be addressed.
Appl. Sci. 2022, 12(16), 8280; https://doi.org/10.3390/app12168280
Submission received: 20 July 2022 / Revised: 16 August 2022 / Accepted: 16 August 2022 / Published: 19 August 2022

Abstract

:
The research is devoted to steel structure diagnostics by the acoustic emission (AE) method. The existing regulatory documents for AE diagnostics of metals and alloys do not take into account some critical factors, among which one is the scale factor should be highlighted. As a result, this can lead to an unreliable assessment of the danger degree of defects in structures when using standard AE diagnostic criteria. This paper presents a quantitative assessment of the scale factor impact on the AE data during the static tension test of steel specimens to failure. Experimental studies were carried out on flat specimens of various thicknesses with a side notch made of high-quality alloyed steel 30 KhGSA. It was established that AE data changed (rise in the AE signals amplitudes and AE activity) within the increase of specimen thickness. Growth in the recorded AE signals cumulative energy was registered with a greater specimen thickness. Partial correlation dependences of the mean count frequency and cumulative energy of AE signals on the specimen thickness were obtained. It was shown that such an effect occurred due to both a general increase in the deformed metal volume and greater strain intensity during the tension of thick specimens. The obtained dependences may contribute to the development of AE diagnostics of metallic materials which is invariant to the scale factor impact.

1. Introduction

One of the most difficult tasks concerning diagnostics of industrial facilities is the assessment of the metal state. In addition to the mechanical properties and microstructure parameters estimation, the main role is assigned to the study of defects’ presence and reasons for construction damage under the influence of operational loads. The timely and reliable detection of dangerous defects is likely to increase the safe operation of industrial facilities and reduce the risk of accidents.
Currently, various non-destructive test (NDT) methods are carried out to detect metal damage as periodic diagnostics (for example, ultrasonic testing, radiation flaw detection, etc.) and as continuous monitoring (for example, acoustic testing, vibration diagnostic systems, etc.). When it comes to monitoring systems, one of the most promising methods is the acoustic emission (AE) method. Namely this technique allows defining the location and degree of damage in a real-time mode [1,2,3,4].
The AE method is based on the phenomenon of elastic wave generation during the formation and development of defects in the material [5]. To conduct AE monitoring, multichannel systems for collecting, processing, and storing diagnostic signals recorded using piezoelectric transducers are used. As a result of the AE signals processing, the construction of a coordinate location and the assessment of the AE sources danger degree are performed. Finally, it is possible to draw a conclusion about the metal state [6,7,8].
When processing AE data, it is necessary to note many factors that have a significant impact on the method’s accuracy. At the same time, in the regulatory documents for AE diagnostics (ASTM E1118/E1118M-16, ASTM E1139/E1139M-17, ISO 22096:2007, etc.) some critical factors do not mention. One of them is the scale factor, which, generally speaking, consists of the dependence of test results on the specimen dimensions. The scale factor also manifests itself in acoustic emission diagnostics. According to the results presented in [9,10,11,12,13,14], the AE parameters recorded during specimen loading largely depend on the scale factor. Specimens were made of rocks and complex structural materials, such as concrete and composite. During AE monitoring of specimens of various sizes, the authors notice a change in the amplitude, activity, and spectral characteristics of the recorded AE signals. Under damage accumulation in small specimens, a stream of low-amplitude acoustic signals of high activity was recorded. For larger ones, there was a characteristic decrease in activity and an increase in the AE signals amplitude, registered upon reaching the limit loads. The danger degree of developing damage can be assessed using the “b-value” parameter, based on the calculation of the distribution function slope of the AE signals amplitudes. The main feature of this technique is the possibility of carrying out a numerical assessment of the damage evolution in the material in real-time using the statistical and fractal analysis methods [15,16,17,18,19,20]. To determine the damage degree in rocks, the energy and frequency characteristics of the AE data are also compared. In accordance with the analysis results given in [21], crack growth leads to a decrease in the maximum of the frequency spectrum and an increase in the energy of AE signals.
The main reason for the scale factor’s influence on the results of AE diagnostics is the different volumes of the tested material. When testing several constructions of similar shapes and different linear dimensions, the volume of the material under control and the AE signals propagation will be different. Thus, the number and parameters of the registered AE signals will also be various. A change in the AE data characteristics has a significant effect on the critical values of the standard criteria, which makes it difficult to carry out the appropriate AE diagnostics of damages in several typical objects with different linear dimensions. For instance, it concerns pipelines of the same length and diameter, but different wall thicknesses. This fact can lead to the false results of the standard criteria application when testing products of various sizes.
The papers presented above [9,10,11,12,13,14,15,16] are devoted to the study of the scale factor impact on the AE diagnostics results of concretes, rocks, and composites. Most of these materials do not go through plastic deformations before failure due to low plasticity. Moreover, strain (work) hardening cannot undergo in these materials. In AE diagnostics of metallic materials due to the phenomenon of strain hardening, the scale effect should manifest itself even more ambiguously. Taking into account the fact that plastic deformation in metals and alloys is accompanied by considerable changes in the AE data, it is rather difficult to predict the influence of various factors on the results of AE diagnostics on the whole. The presence of a nonlinear (unknown) dependence of the acoustic signal parameters on the linear dimensions of the structure makes it difficult to carry out the control procedure and obtain reliable results for AE diagnostics. To deal with this problem and ensure high-quality results of AE diagnostics of metals and metallic alloys it is of importance to take into account the influence of the linear dimensions of the controlled object on the AE signals, i.e., scale factor.
This research is devoted to an experimental study of the metallic object linear dimensions impact on the results of the AE diagnostics during tensile testing. Tensile testing to failure of steel specimens with different linear dimensions makes it possible to clearly demonstrate the influence of the scale factor and establish the dependence of the acoustic signals parameters on the tested object dimensions.

2. Materials and Methods

In order to study the impact of the scale factor on the results of diagnostics of metallic materials by the AE method, several experiments were carried out including tensile testing.
The experience of previous research performed by the authors [22,23,24] on AE diagnostics of structural carbon and alloyed steels shows that a two-phase ferrite-pearlite structure can lead to a high level of “structural noise” associated with micro deformation of the ferrite phase, as well as the destruction of the cementite network during the material deformation. Moreover, non-metallic inclusions (sulfides, oxides, silicates, etc.) create additional noise sources. This becomes a reason for distortion of AE signals recorded during the deformation and destruction of the investigated material [25].
A high-quality alloyed steel 30 KhGSA after annealing was investigated in the current study. The chemical composition of the steel (see Table 1) was determined using the LAES Matrix atomic emission spectrometer and the Metavak-CS sulfur/carbon analyzer. The 30 KhGSA is considered to be high-quality steel due to a reduced content of harmful impurities and non-metallic inclusions. The structure of this steel in the annealed state should consist of alloyed ferrite and finely dispersed carbides located along the body of the grain and grain boundaries. Presumably, such a structure should provide a lower level of “structure noise”, which in turn will contribute to more reliable results of the planned research tests.
To analyze the actual structural and mechanical state of the metal under study (steel 30 KhGSA, sheet 6 mm), a metallographic analysis was carried out by optical microscopy and tensile testing.
Flat specimens were prepared in advance to determine the mechanical properties (see Figure 1a). These specimens were made and tested in accordance with the Russian state standard GOST 1497-84 (ISO 6892-1:2019). The width was 20 mm, the gauge length was increased to 270 mm. The tension tests were performed on an Instron 5982 testing machine with a movable traverse speed of 2 mm/min using 6 specimens. The results are presented in Table 2; as an example, one of the tensile diagrams is shown in Figure 1c.
Blanks for microsections were cut out from the 30 KhGSA sheet to study the microstructure. The steel structure is ferrite with finely dispersed carbides (Figure 2).
Specimens with a V-shaped side notch (concentrator) were made to conduct experiments and study the influence of the scale factor on the AE diagnostics results. The geometry of prepared specimens is shown in Figure 3a. The presence of a side notch makes it possible to unambiguously determine the location of AE sources during the deformation and destruction of the tested material by constructing a coordinate location. The study of the scale factor influence on the AE monitoring results was carried out by tensile testing to failure using an Instron 5982 testing machine (see Figure 3b) with an electromechanical drive to ensure the minimum level of acoustic noise. A pair of VS150-RIC quasi-resonant AE transducers (AET #1 and AET #2 in Figure 3a) with a built-in preamplifier with a gain of 34 dB and maximum sensitivity at a frequency of 150 kHz was used. The AETs used are highly sensitive in the frequency range from 120 to 450 kHz, which makes it possible to reduce the effect of mechanical and electromagnetic noises recorded at frequencies below 50 kHz and above 500 kHz, respectively. The transducers were installed on the specimen at a distance of about 130 mm of the lateral V-shaped notch and fastened with clamps, providing the necessary acoustic contact. Thus, a location zone with a size of B = 260 mm was formed, and in the subsequent analysis of the AE, sources coordinates the distance X was measured from the location of the upper acoustic emission transducer (AET #1).
The thickness of the specimens was chosen as a variable dimensional (scale) parameter. Specimens with a nominal thickness of 1 to 6 mm (1 mm increment) were made. Other dimensions were the same for all specimens.
To ensure that the properties and structure of the material under test were as close as possible to each other and did not change from specimen to specimen, all specimens were cut from the same 6 mm thick metal sheet. The required thickness of the specimen was provided by grinding. A total of 18 specimens were prepared—three specimens of each thickness.
At the initial stage of experimental studies, the optimal parameters of the Vallen AMSY-6 measuring system for collecting and processing acoustic signals were determined. The AE signals threshold uth was defined based on the condition uthun + 6 dB (un is the maximum noise signal amplitude) and equaled to uth = 36 dB. The bandwidth of the digital filters was chosen to be Δf = 95–850 kHz. To construct a linear location of acoustic sources arising in the process of tensile testing before failure, the value of the propagation velocity of AE signals Vg was obtained. The calculation of the Vg parameter was carried out according to the results of preliminary tests, which consisted in simulating acoustic signals using a Hsu-Nielson source. The velocity value was Vg = 3300 m/s with the size of the location zone B = 260 mm.
A series of experimental studies consisted of the registration of AE signals during tensile testing to failure were performed. The movable traverse speed was 2 mm/min during the tests.
Synchronization of the AE diagnostics results with the size of a developing crack was done by the digital image correlation (DIC) method using the LaVision StrainMaster optical control system. The imaging system consisted of two Imager SX video cameras, a LaVision PTU synchronization device for simultaneous acquisition of images, and a personal computer with DaVis 8.4 software (LaVision GmbH, Göttingen, Germany). To increase the contrast of the image, a random pattern (speckle) was created on the surface of the specimens using white and black aerosol paints. During the test, images of the specimen surface in the notch area were recorded at a frequency of 2 fps. As an example, in Figure 4 photos of the specimen surface and strain fields during one of the experiments are shown. For an accurate assessment, this parameter was determined from the vector fields of displacements calculated when processing experimental images using the algorithm developed by the authors of the paper. It was based on the binarization of the scalar deformation field in the area of the crack and the skeletonization area that defines the cracks’ coordinates.
Real-time determination of crack sizes using an optical system made it possible to synchronize the change in AE parameters depending on the crack size and the stress-strain state of the tested specimens. The obtained results were used in the processing of experimental AE data.

3. Results

The processing of the experimental data results contributed to the evaluation of AE parameters depended on the specimens’ thickness. To eliminate the noise signals arising in the process of mechanical friction of the specimen in the testing machine grips, a linear location for each specimen was built. Figure 5, as an example, shows the location pattern for one of the tested specimen specimens (6 mm). The selected location range of AE sources along the coordinates X = [75–200] mm made it possible to eliminate the sources of friction in the grips and at AE transducers fixing points. It should be noted that the scatter in the results of constructing the AE source’s coordinate location is due to the application of the threshold algorithm for recording the oscillating shape of AE pulses of various amplitudes [26].
To demonstrate the influence of the specimen thickness on the AE diagnostics results, the experimental dependences are shown for two specimens with the maximum difference in thickness, 1 mm and 6 mm. Figure 6 shows the time (τ) dependences of the amplitudes um and AE hits rate Ń that corresponds to hits per sec, of signals with a superimposed stress σ curve, recorded during the deformation of steel specimens with a thickness of 1 mm and 6 mm. The total number of located AE events was 295 pulses for the specimen of 1 mm thick, and 1780 pulses for the specimen of 1 mm thick.
When analyzing the AE signals for two specimens, the entire tension process was conditionally divided into several stages and signal parameters were compared for the same crack sizes. The parameters of acoustic signals were compared during the development of cracks up to a size of l ≈ 1.7 mm (appearance of a visible crack), l ≈ 4.4 mm (stable crack development), the period of acoustic gap l ≈ 7–8 mm, and the period before destruction (l ≈ 9–10 mm).
As shown in Figure 6a,b, at the initial loading stage of a 1 mm thick specimen (test time τ ≤ 60 s), the amplitude and AE hits rate reached um = 68 dB and Ń = 2 hits/s, respectively. The obtained values of the AE parameters were registered with an increase in the crack size to l ≈ 1.7 mm. Further growth of the applied testing load (60 s <τ ≤ 104 s) led to severe plastic deformation of the specimen in the area of the stress concentrator and a rise in the crack size to l ≈ 4.4 mm. In the considered time interval, the amplitude and AE hits rate attain um = 89 dB and Ń = 6 hits/s, respectively. In the time interval from 104 s to 112 s, the moment of “acoustic gap” registered [27], characterized by the localization of the plastically deformed zone at the crack tip and a decrease in the amplitude and AE hits rate to the values of um = 65 dB and Ń = 3 hits/s, respectively. When the specimen reaches the state of pre-destruction (l ≈ 9.5 mm, τ = 130 s), there was significant growth in the amplitude and AE hits rate up to the values of um = 82 dB and Ń = 27 hits/s, respectively.
Similar results for a 6 mm thick specimen are presented in Figure 6c,d. When the crack achieved 1.7 mm in length (τ ≤ 72 s), the parameters um and Ń reached 100 dB and 26 hits/s, respectively. Growth in the maximum values of the parameters under consideration was due to an increase in the energy of elastic waves generated in the process of internal stress relaxation in a larger volume material. During time interval 73 s <τ ≤ 129 s, the crack length increased to l ≈ 4.4 mm. There was also a decline in the activity of AE signals registration to a value of Ń = 10 hits/s. Upon reaching the “acoustic gap” (130 s <τ ≤ 140 s), there was a drop in the amplitude and AE hits rate to the values of um = 70 dB and Ń = 6 hits/s, respectively. When the specimen reached the state of pre-destruction (l ≈ 9.5 mm, τ = 167 s), there was a significant increase in the amplitude and AE hits rate up to the values of um = 100 dB and Ń = 38 hits/s, respectively.
For clarity, the obtained results are presented in Table 3. It can be seen from the results that at all loading stages, the deformation of a specimen with a greater thickness was accompanied by higher values of AE hits rate and amplitudes.
As can be seen from Table 3, the greatest difference in the AE parameters is observed at the initial stage of testing, which may be due to the different nature of cracks formation and propagation. In a thin specimen, a crack propagates fairly quickly over the entire thickness of the specimen; while a thicker specimen is characterized by asymmetric crack growth in thickness. As a rule, cracks, in this case, are initially formed along the edges of the sample, and then propagate deep into the specimen, merging into a single crack. The stress-strain state of the metal at the crack tip will in any case be more complex and inhomogeneous for a thick specimen [28]—the state of the metal and the size of the plastic deformation zone on the surface and inside the specimen differ. Therefore, at any stage of the specimen test, from the initiation of a crack to complete failure, the metal of a thick sample has higher strain intensities, and, accordingly, is more acoustically active.
To assess the degree of danger of AE sources, criterion parameters are used, the calculation of which is carried out according to the values of amplitude, duration, activity, etc. One of the most common criteria is the “b-value” parameter. The calculation of the “b-value” parameter is carried out according to the results of the approximation of the amplitude distribution by the linear function lg(N) = abAdB [29]. The calculation of the “b-value” parameter was carried out using a rolling window with a size of W = 75 signals at a scanning step of 15 pulses. The amplitude distribution was constructed in the range of values AdB = [30–100] dB. The results of calculating of “b-value” are shown in Figure 7.
As shown in Figure 7a, for the sample of 1 mm thick, the maximum value of the parameter reached b = 2.648, and its scattering Δb during the loading time was 0.552. For a sample of 6 mm thick (Figure 7b), there is an increase in the scatter of the b-valuesb = 0.932). The definition of the damage stage, according to data shown in Figure 7, seems to be difficult. However, it should be noted that an increase in the specimen leads to an increase in the scatter of the “b-value” during the loading process.
To assess the influence of the scale factor on the acoustic signal parameters generated during the crack development in the test object, it is necessary to take into account changes not only in absolute values, but also in the type of distribution functions of AE data. According to [30,31], the processes of damage accumulation at the micro-, meso-, and macroscale levels of structural materials destruction are characterized by the unique ranges of energy (E) and mean count frequency of AE signals (Npp), where Np is hits number and τp is pulse duration. When the scale level of destruction is changed, the nature of damage accumulation in the material also changes. It manifests in a change in the frequency characteristics of the recorded AE signals. Therefore, for specimens of different thicknesses, the empirical distribution functions of the mean count frequency of AE signals (Npp), should be different. Thus, in this paper, we compared the empirical distribution functions of the (Npp) parameter. The construction of distribution functions was performed using a rolling-window with a size of W = 75 signals at a scanning step of 15 pulses. As an example, Figure 8a,c shows the empirical distribution functions of the parameter Npp, registered when the crack grew to a value of l = 1.7 mm. For a numerical evaluation of the scale factor effect, the change in the level quantile p = 0.8 ((Npp)p = 0.8) was estimated. For specimens with a thickness of t = 1 mm, the parameter under study was (Npp)p = 0.8 = 0.152 [1/μs]. When processing the AE signals recorded during specimen loading with a thickness of t = 6 mm, a decrease in the quantile of the empirical distribution function to the value (Npp)p = 0.8 = 0.125 [1/μs] was noted. The decrease in the (Npp)p = 0.8 parameter for a specimens with a thickness of t = 6 mm, was associated with an increase in the proportion of low-energy signals.
When crack size was about l = 9.5 mm (Figure 8b,d), the (Npp)p = 0.8 parameter also grew to the mean values of (Npp)p = 0.8 = 0.206 [1/μs] for a 1 mm thick specimen and (Npp)p = 0.8 = 0.181 [1/μs] for 6 mm thick specimen. The difference between the maximum and minimum values of the (Npp)p = 0.8 parameter were Δ(Npp) = 0.054 [1/μs] for 1-mm specimen and Δ(Npp) = 0.056 [1/μs] for 6-mm specimen. The relative change in the difference between the mean count frequency of AE signal for specimens with 1 mm and 6 mm thickness is 3.6%.
Figure 9 shows the result of plotting the dependence of the maximum values (Npp)p = 0.8 on the specimens thickness.
As noted earlier, a large proportion of high-frequency signals was recorded for small thickness specimens. This fact was confirmed by the maximum value of the specific count frequency of AE signals (Npp)p = 0.8 = 0.206 [1/μs]. When processing the AE data obtained during specimen loading of greater thickness, a decrease in the (Npp)p = 0.8 parameter was registered. For example, an increase in the proportion of low-frequency harmonics in the spectrum of registered AE signals was noted for the 6 mm thickness specimens during experiments. While, the maximum value of the (Npp)p = 0.8 parameter corresponded to (Npp)p =0.8 = 0.181 [1/μs].
The least squares method was used to synthesize an approximating function that describes the correlation between the (Npp)p = 0.8 parameter and the thickness of the object under study. As a result of applying this algorithm for the 30 KhGSA steel, the correlation dependence (Npp)p = 0.8(t) = 0.04∙t(−0.45) + 0.16 was obtained, the accuracy of which is confirmed by the coefficient of determination R2 = 0.98.
The scale factor has a considerable effect on the energy characteristics of the registered AE signals. An increase in the volume of the relaxation zone of the deformed material with an increase in the test object thickness leads to a rise in the cumulative energy values (EΣ) of acoustic signals. To determine the correlation dependence of the parameters under consideration, Figure 10 shows the effect of the specimens’ thickness on the cumulative energy of AE signals.
The lowest value of the cumulative energy EΣ = 109.0 dBmkeV was recorded when testing steel specimens of 1 mm thick. An increase in the specimen thickness causes a significant rise in the cumulative energy of the registered AE signals. For instance, for specimens with a thickness of 3 mm and 6 mm, the value of the EΣ reached 118.8 dBmkeV and 123.1 dBmkeV, respectively. The least squares method was used to approximate the obtained results. As a result, the correlation dependence EΣ(t) = −15.39∙t(−0.93) + 124.52 was obtained, the accuracy of which is dedicated by the coefficient of determination R2 = 0.96.

4. Discussion

The results of experimental studies show the dependence of the AE data on the specimen’s thickness. The reasons for this can be both a general increase in the deformable volume of the metal, and a more complex stress-strain state of the metal during the deformation of specimens with greater thickness. Figure 11 represents the distributions of strain fields near the stress concentrator for specimens of 1 mm and 6 mm thick.
It can be seen from the data presented that the plastic deformation zone in a specimen of 6 mm thick is higher than for a specimen of 1 mm thick. The maximum strain near the crack is obviously higher (about 0.48 (Figure 11f)) for a 6-mm specimen compared to the corresponding value for a 1-mm specimen (about 0.34 (Figure 11e)). Presumably, during loading of a specimen of greater thickness, a more complex stress-strain state was formed, characterized by increased stress intensity due to larger transverse strains.
Generally, the obtained results are consistent with the well-known theory of the scale factor impact on mechanical strength. According to it, specimens with smaller linear dimensions are characterized by lower values of the ultimate uniform strain and total strain to failure. The higher ductility of the thicker specimen was confirmed by the quantitative measurements made during the tests using the DIC. Figure 12 shows the dependence of the mean strain degree in the region of the stress concentrator for specimens of various thicknesses. It can be seen from the results that the mean strain values increase monotonically with thickness increasing (Figure 12b–e). For a specimen of 6 mm thick, the mean strain values are considerably higher on the whole: the mean elongation at the moment before failure is about 0.17 (Figure 12e) while for a specimen of 1 mm thick, this value is 0.11 (Figure 12b).

5. Conclusions

In this paper, an urgent problem concerning the influence of the scale factor on the AE monitoring data of metallic materials was considered.
-
The change in primary parameters of the recorded AE signals depending on the size of the developing crack during tensile testing of steel specimens with various thicknesses was assessed. It was established that an increase in the thickness of the controlled object leads to a steady change in the primary parameters of acoustic emission data—a rise in the AE signals amplitude (um) and the AE hits rate (Ń). The values of AE signals amplitude and AE hits rate recorded during the tension test of steel specimens with thickness t = 1 mm and t = 6 mm corresponded to the values (um = 89 dB; Ń = 27 hits/s) and (um = 100 dB; Ń = 38 hits/s) respectively. The greatest difference in the values of the primary AE parameters is observed at the initial stage of destruction—during a crack initiation in the stress concentrator (V-shape notch). We assume that this is due to the uneven crack development along the thickness in specimens of large thickness at the initial stage. In the case of thick samples, several cracks form at the initial stage of fracture, each of which is a separate AE source that increases the overall acoustic activity.
-
It was presented that the distribution parameters of the mean count frequency of AE signals depend on the specimen thickness. The parameter Npp can be used in the construction of analytical models for estimating the damage degree of the objects under study, which are invariant to the influence of the scale factor. For 30 KhGSA specimens, an empirical dependence of the quantile of the mean count frequency distribution of AE signals of level p = 0.8 on the specimen thickness t was obtained: (Npp)p = 0.8(t) = 0.04∙t(−0.45) + 0.16 (coefficient of determination R2 = 0.98).
-
It has been shown that an increase in the specimen thickness led to a significant increment of the cumulative energy of the registered AE signals EΣ(t) = −15.39∙t(−0.93) + 124.52, (coefficient of determination R2 = 0.96).
-
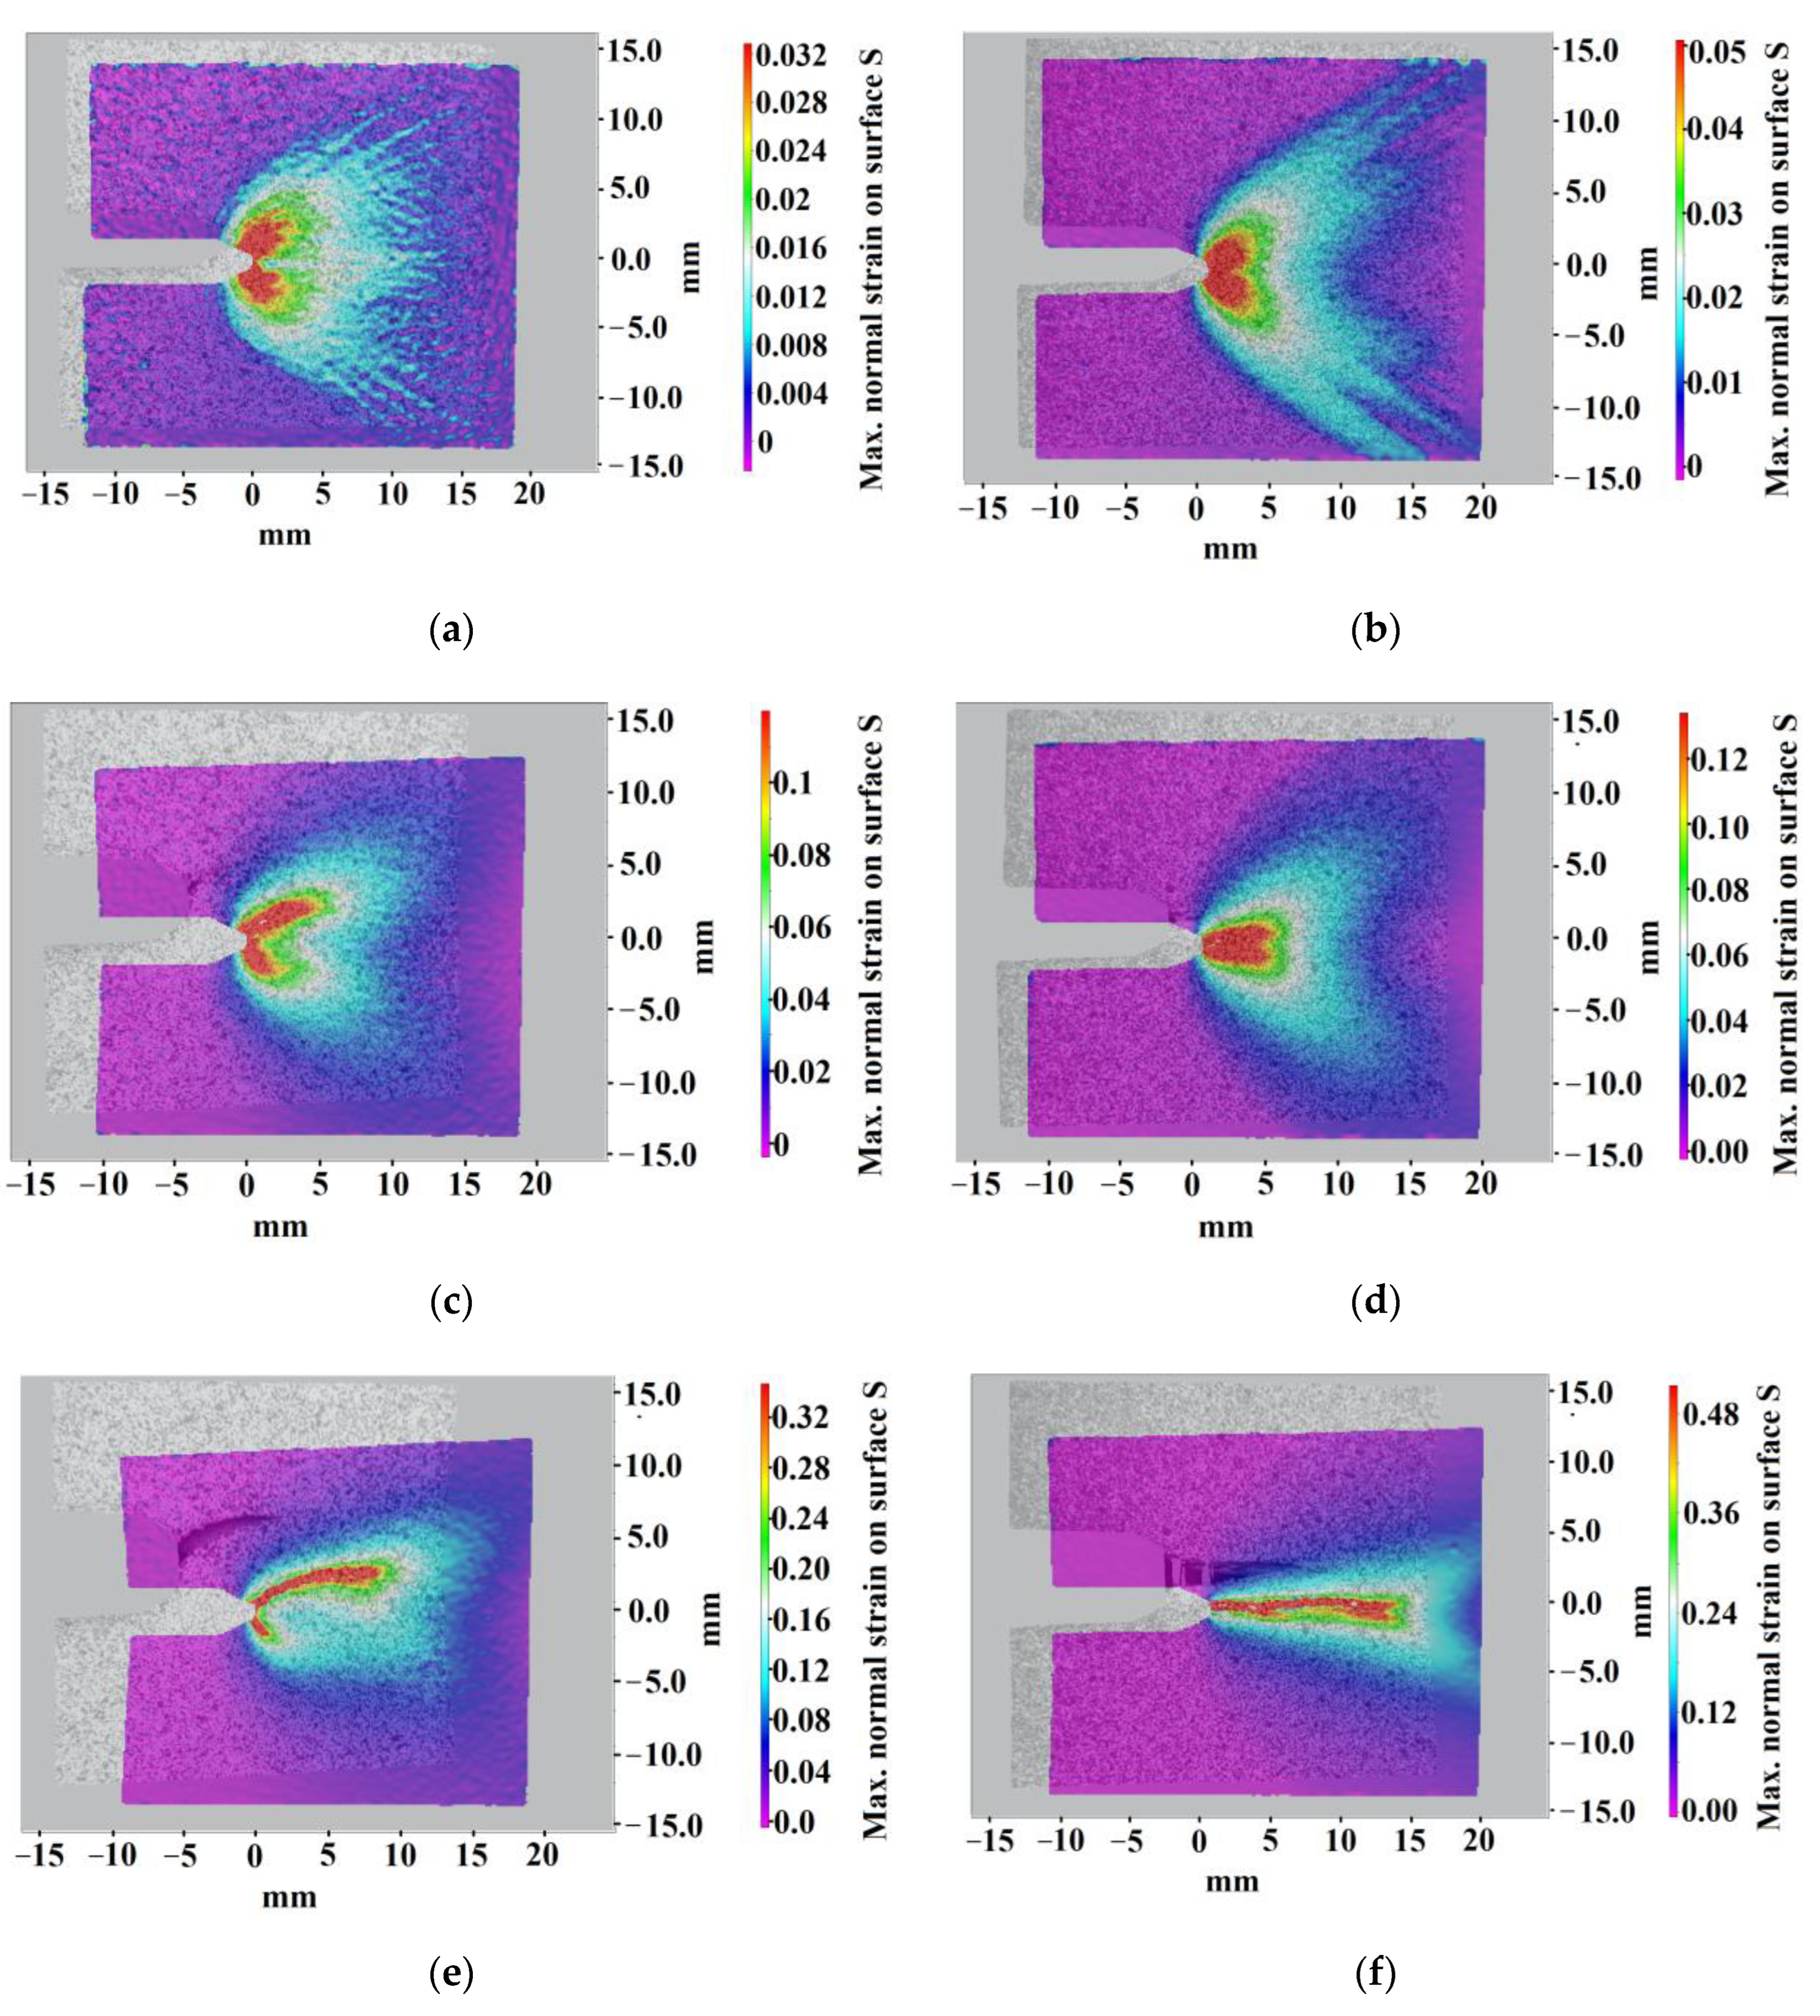
It has been assumed that the main factors affecting the influence of the scale effect are the overall increase in the deformable metal volume, as well as the more complex stress-strain state of the metal near the stress concentrator due to the transverse deformations present in specimens with large thicknesses. Using the DIC method, it was shown that with an increase in the specimen thickness, the strain value before failure rises, both the average strain before failure in the region near the V-shaped notch and the ultimate strain value at the fracture site. Since the plastically deformable metal is an AE source, the overall increase in its volume and the increase in the ultimate strain degree also explain the increased acoustic activity when testing thicker specimens.
-
The results obtained show that for a defined structural metal alloy there is an impact of the test object sizes on the AE parameters. This leads to the need to take into account the sizes of the control object, since this affects the classification of the danger degree of identified AE sources, as well as the values of the criteria for assessing the technical condition of the object. To develop a reliable method for assessing the state of the metallic object, invariant to the influence of the scale factor, the authors plan to conduct additional studies using artificial neural networks and regression analysis models.

Author Contributions

Conceptualization, A.M. and D.C.; methodology, A.M. and D.C.; experiment, A.M., D.C., E.R. and A.P. (Anton Poroykov); validation, A.M.; formal analysis, D.Z. and A.P. (Anastasia Pankina); investigation, D.C.; data curation, A.P. (Anton Poroykov), E.K. and T.K.; writing—original draft preparation, D.C. and A.M.; writing—review and editing, D.Z. and A.P. (Anastasia Pankina); visualization, D.Z., A.P. (Anastasia Pankina) and E.K.; supervision, A.M.; project administration, A.M. and D.Z.; funding acquisition, A.M. All authors have read and agreed to the published version of the manuscript.

Funding

The reported study was funded by the Russian Science Foundation (project No. 21-79-00232).

Institutional Review Board Statement

Not applicable.

Informed Consent Statement

Not applicable.

Acknowledgments

This research was carried out at National Research University “Moscow Power Engineering Institute”. The experimental results were obtained using the equipment provided by the center “Science-intensive technologies for creating machines of the future” (IMASH RAS).

Conflicts of Interest

The authors declare no conflict of interest.

References

  1. Tang, J.; Wang, Y.; Li, J.; Wang, H.; Chen, G. In-situ monitoring and analysis of the pitting corrosion of carbon steel by acoustic emission. Appl. Sci. 2019, 9, 706. [Google Scholar] [CrossRef]
  2. Lukonge, A.; Cao, X. Leak detection system for long-distance onshore and offshore gas pipeline using acoustic emission technology. A review. Trans. Indian Inst. Met. 2020, 73, 1715–1727. [Google Scholar] [CrossRef]
  3. Matvienko, Y.G.; Vasiliev, I.E.; Chernov, D.V.; Marchenkov, A.Y. Diagnostics of welded joints in main pipelines equipment. Sci. Technol. Oil Prod. Pipeline Transp. 2018, 8, 618–630. [Google Scholar]
  4. Sarath, S.; Patel, P.; Dharmik, D.; Raghavendra, V.S.; Kothari, D.; Rao, V.N. Application acoustic emission testing during hydrostatic test to ensure integrity of pressure vessel section with support structures. Nondestruct. Eval. 2017, 6, 411–418. [Google Scholar]
  5. Louda, P.; Sharko, A.; Stepanchikov, D. An Acoustic Emission Method for Assessing the Degree of Degradation of Mechanical Properties and Residual Life of Metal Structures under Complex Dynamic Deformation Stresses. Materials 2021, 14, 2090. [Google Scholar] [CrossRef] [PubMed]
  6. Chernyaeva, E.V.; Volkov, A.E.; Galkin, D.I.; Bigus, G.A.; Merson, D.L.; Bystrova, N.A. Evaluation of the condition of a metal using the acoustic-emission method: Prospects and problems. Russ. J. Nondestruct. Test. 2013, 49, 131–139. [Google Scholar] [CrossRef]
  7. Skal’skyi, V.R.; Pochapskyi, E.P.; Klym, B.P.; Rudak, M.O.; Velykyi, P.P. Application of the method of magnetoelastic acoustic emission for the analysis of the technical state of 19G steel after long-term operation in an oil pipeline. Mater. Sci. 2016, 52, 385–389. [Google Scholar] [CrossRef]
  8. Grosse, C.U.; Ohtsu, M. Acoustic Emission Testing, Basics for Research; Applications in Civil Engineering; Springer: Leipzig, Germany, 2008; p. 414. [Google Scholar]
  9. Deresse, N.E.; Van Steen, C.; Sarem, M.; François, S.; Verstrynge, E. Acoustic Emission Analysis of Fracture and Size Effect in Cementitious Mortars. Appl. Sci. 2022, 12, 3489. [Google Scholar] [CrossRef]
  10. Song, H.; Zhao, Y.; Jiang, Y.; Wang, J. Scale Effect on the Anisotropy of Acoustic Emission in Coal. Shock Vibr. 2018, 2018, 8386428. [Google Scholar] [CrossRef]
  11. Mandal, D.D.; Bentahar, M.; El Mahi, A.; Brouste, A.; El Guerjouma, R.; Montresor, S.; Cartiaux, F.-B. Acoustic Emission Monitoring of Progressive Damage of Reinforced Concrete T-Beams under Four-Point Bending. Materials 2022, 15, 3486. [Google Scholar] [CrossRef]
  12. Alam, S.Y.; Saliba, J.; Loukili, A. Fracture examination in concrete through combined digital image correlation and acoustic emission techniques. Constr. Build. Mater. 2014, 69, 232–242. [Google Scholar] [CrossRef]
  13. Ospitia, N.; Hardy, A.; Si Larbi, A.; Aggelis, D.G.; Tsangouri, E. Size Effect on the Acoustic Emission Behavior of Textile-Reinforced Cement Composites. Appl. Sci. 2021, 11, 5425. [Google Scholar] [CrossRef]
  14. Triantis, D.; Pasiou, E.D.; Stavrakas, I.; Kourkoulis, S.K. Hidden Affinities between Electric and Acoustic Activities in Brittle Materials at Near-Fracture Load Levels. Rock Mech. Rock Eng. 2022, 55, 1325–1342. [Google Scholar] [CrossRef]
  15. Burud, N.B.; Kishen, J.M.C. Application of generalized logistic equation for b-value analysis in fracture of plain concrete beams under flexure. Eng. Fract. Mech. 2019, 210, 228–246. [Google Scholar] [CrossRef]
  16. Liu, X.; Pan, M.; Li, X.; Wang, J. B-Value Characteristics of Rock Acoustic Emission under Impact Loading; Springer: Cham, Switzerland, 2017. [Google Scholar]
  17. Rao, M.V.M.S.; Prasanna Lakshmi, K.J. Analysis of b-value and improved b-value of acoustic emissions accompanying rock fracture. Curr. Sci. 2005, 89, 1577–1582. [Google Scholar]
  18. Xie, X.; Li, S.; Guo, J. Study on Multiple Fractal Analysis and Response Characteristics of Acoustic Emission Signals from Goaf Rock Bodies. Sensors 2022, 22, 2746. [Google Scholar] [CrossRef]
  19. Yang, J.; Zheng, Y.; Wang, H. Modifications and Statistical Analysis of Acoustic Emission Models Based on the Damage and Fractal Characteristics. Adv. Mater. Sci. Eng. 2018, 2018, 1898937. [Google Scholar] [CrossRef]
  20. Loukidis, A.; Triantis, D.; Stavrakas, I.; Pasiou, E.D.; Kourkoulis, S.K. Detecting Criticality by Exploring the Acoustic Activity in Terms of the “Natural-Time” Concept. Appl. Sci. 2022, 12, 231. [Google Scholar] [CrossRef]
  21. Zhang, J. Investigation of Relation between Fracture Scale and Acoustic Emission Time-Frequency Parameters in Rocks. Shock. Vibr. 2018, 10, 3057628. [Google Scholar] [CrossRef]
  22. Barat, V.A.; Marchenkov, A.Y.; Elizarov, S.V. Estimation of Fatigue Crack AE Emissivity Based on the Palmer–Heald Model. Appl. Sci. 2019, 22, 4851. [Google Scholar]
  23. Chernov, D.V.; Matyunin, V.M.; Barat, V.A.; Marchenkov, A.Y.; Elizarov, S.V. Investigation of Acoustic Emission in Low-Carbon Steels During Development of Fatigue Cracks. Russ. J. Nondestr. Test. 2018, 54, 638–647. [Google Scholar] [CrossRef]
  24. Sokolov, I.V.; Matyunin, V.M.; Barat, V.A.; Chernov, D.V.; Marchenkov, A.Y. Advanced Filtering Methods Application for Sensitivity Enhancement During AE Testing of Operating Structures. Indian J. Sci. Technol. 2016, 42, 104223. [Google Scholar] [CrossRef]
  25. Ono, K.; Yamamoto, M. Anisotropic Mechanical and Acoustic Emission Behavior of A533B Steels. Mater. Sci. Eng. 1981, 47, 247–263. [Google Scholar] [CrossRef]
  26. Marchenkov, A.Y.; Vasiliev, I.E.; Chernov, D.V.; Zhgut, D.A.; Moskovskaya, D.S.; Mishchenko, I.V.; Kulikova, E.A. Estimation of Acoustic Source Positioning Error Determined by One-Dimensional Linear Location Technique. Appl. Sci. 2022, 12, 224. [Google Scholar] [CrossRef]
  27. Botvina, L.R.; Petersen, T.B.; Tyutin, M.R. The Acoustic Gap as a Diagnostic Sign of Prefracture. Doklady Phys. 2018, 63, 173–176. [Google Scholar] [CrossRef]
  28. Anderson, T.L. Fracture Mechanics. Fundamentals and applications; Taylor & Francis Group: Boca Raton, FL, USA, 2005; p. 630. [Google Scholar]
  29. Colombo, I.S.; Main, I.G.; Forde, M.C. Assessing Damage of Reinforced Concrete Beam Using “b-value” Analysis of Acoustic Emission Signals. J. Mater. Civ. Eng. 2003, 15, 280–286. [Google Scholar] [CrossRef]
  30. Makhutov, N.A.; Vasiliev, I.E.; Chernov, D.V.; Ivanov, V.I.; Terent’ev, E.V. Kinetics of Damage Accumulation and Failure in the Zones of Stress Raisers in Sample Rupture Tests. Russ. J. Nondestruct. Test. 2021, 57, 31–42. [Google Scholar] [CrossRef]
  31. Botvina, L.R.; Tyutin, M.R.; Petersen, T.B.; Levin, V.P.; Soldatenkov, A.P.; Prosvirnin, D.V. Residual Strength, Microhardness, and Acoustic Properties of Low-Carbon Steel after Cyclic Loading. J. Mach. Manuf. Reliab. 2018, 47, 516–524. [Google Scholar] [CrossRef]
Figure 1. Scheme (a) and photo (b) of a specimen for tensile test for mechanical properties evaluation and stress-strain curve (c) of a specimen from the 30 KhGSA steel.
Applsci 12 08280 g001aApplsci 12 08280 g001b
Figure 2. 30 KhGSA steel microstructure: (a)—200× magnification; (b)—1000× magnification.
Applsci 12 08280 g002
Figure 3. Scheme of a specimen from 30 KhGSA steel with a side notch for testing to assess the scale factor impact on the AE signal parameters (a) and photo of experiments using an AE system (b): 1—a specimen with a V-shaped notch; 2—quasi-resonant transducers VS150-RIC; 3—clamps.
Applsci 12 08280 g003
Figure 4. Photos of the surface (a) and normal strain fields on the surface (b) for one of the specimens at the moment before failure.
Applsci 12 08280 g004
Figure 5. AE sources location pattern for the specimen of 6 mm thick.
Applsci 12 08280 g005
Figure 6. Time dependences of the amplitudes (um) and AE hits rate (Ń) of signals during tension testing to failure of specimens with a thickness of 1 mm (a,b) and 6 mm (c,d).
Applsci 12 08280 g006
Figure 7. Time dependences of the “b-value” parameter with the superimposed stress curve, for specimens with a thickness of 1 mm (a) and 6 mm (b).
Applsci 12 08280 g007
Figure 8. Comparison of the empirical distribution functions of the mean count frequency (Npp) recorded during loading of steel specimens with a thickness of t = 1 mm (a,b) and t = 6 mm (c,d) in the moments when crack length reaches l = 1.7 mm (a,c) and l = 9.5 mm (b,d).
Applsci 12 08280 g008
Figure 9. The influence of the specimen thickness t on the p = 0.8 level quantile values of the empirical count frequency distribution function Npp of AE signals.
Applsci 12 08280 g009
Figure 10. Influence of the specimens’ thickness t on the cumulative energy of AE signals EΣ.
Applsci 12 08280 g010
Figure 11. Photos of strain fields for a specimens of 1 mm thick (left) and 6 mm thick (right) at different stages of crack development: crack initiation (a,b); crack propagation (c,d); before failure (e,f).
Applsci 12 08280 g011
Figure 12. The mean strain in the area of stress concentrator: the area under consideration (a); specimen of 1 mm thick (b); 3 mm thick (c); 5 mm thick (d) and 6 mm thick (e).
Applsci 12 08280 g012
Table 1. Chemical composition of the 30 KhGSA steel, %wt.
ElementCCrMnSiNiCuSP
Content0.291.01.10.9<0.1<0.10.0030.008
Table 2. Mechanical properties of the 30 KhGSA steel (results of 6 specimens test).
ParameterYield Stress σy, MPaUltimate Tensile Stress σu, MPaUniform Elongation δu, %Total Elongation δ, %
Value range388–399584–60810.5–12.711.0–15.4
Average value39159911.513.5
Table 3. Comparison of the amplitudes and AE hits rate at different stages of tension tests of specimens from 30 KhGSA steel with a thickness of 1 mm and 6 mm.
Specimen Thickness1 mm6 mm
ParameterAmplitude um, dBAE Hits Rate Ń, Hits/sAmplitude um, dBAE Hits Rate Ń, Hits/s
Crack length (tensile test stage)l ≈ 1.7 mm (visible crack appearance)68210026
l ≈ 4.4 mm (crack propagation)8969210
l ≈ 7–8 mm (acoustic gap)653706
l ≈ 9–10 mm (before failure)822710038
Publisher’s Note: MDPI stays neutral with regard to jurisdictional claims in published maps and institutional affiliations.

