
Multi-Objective Optimization for Outer Rotor Low-Speed Permanent Magnet Motor


Abstract
:1. Introduction
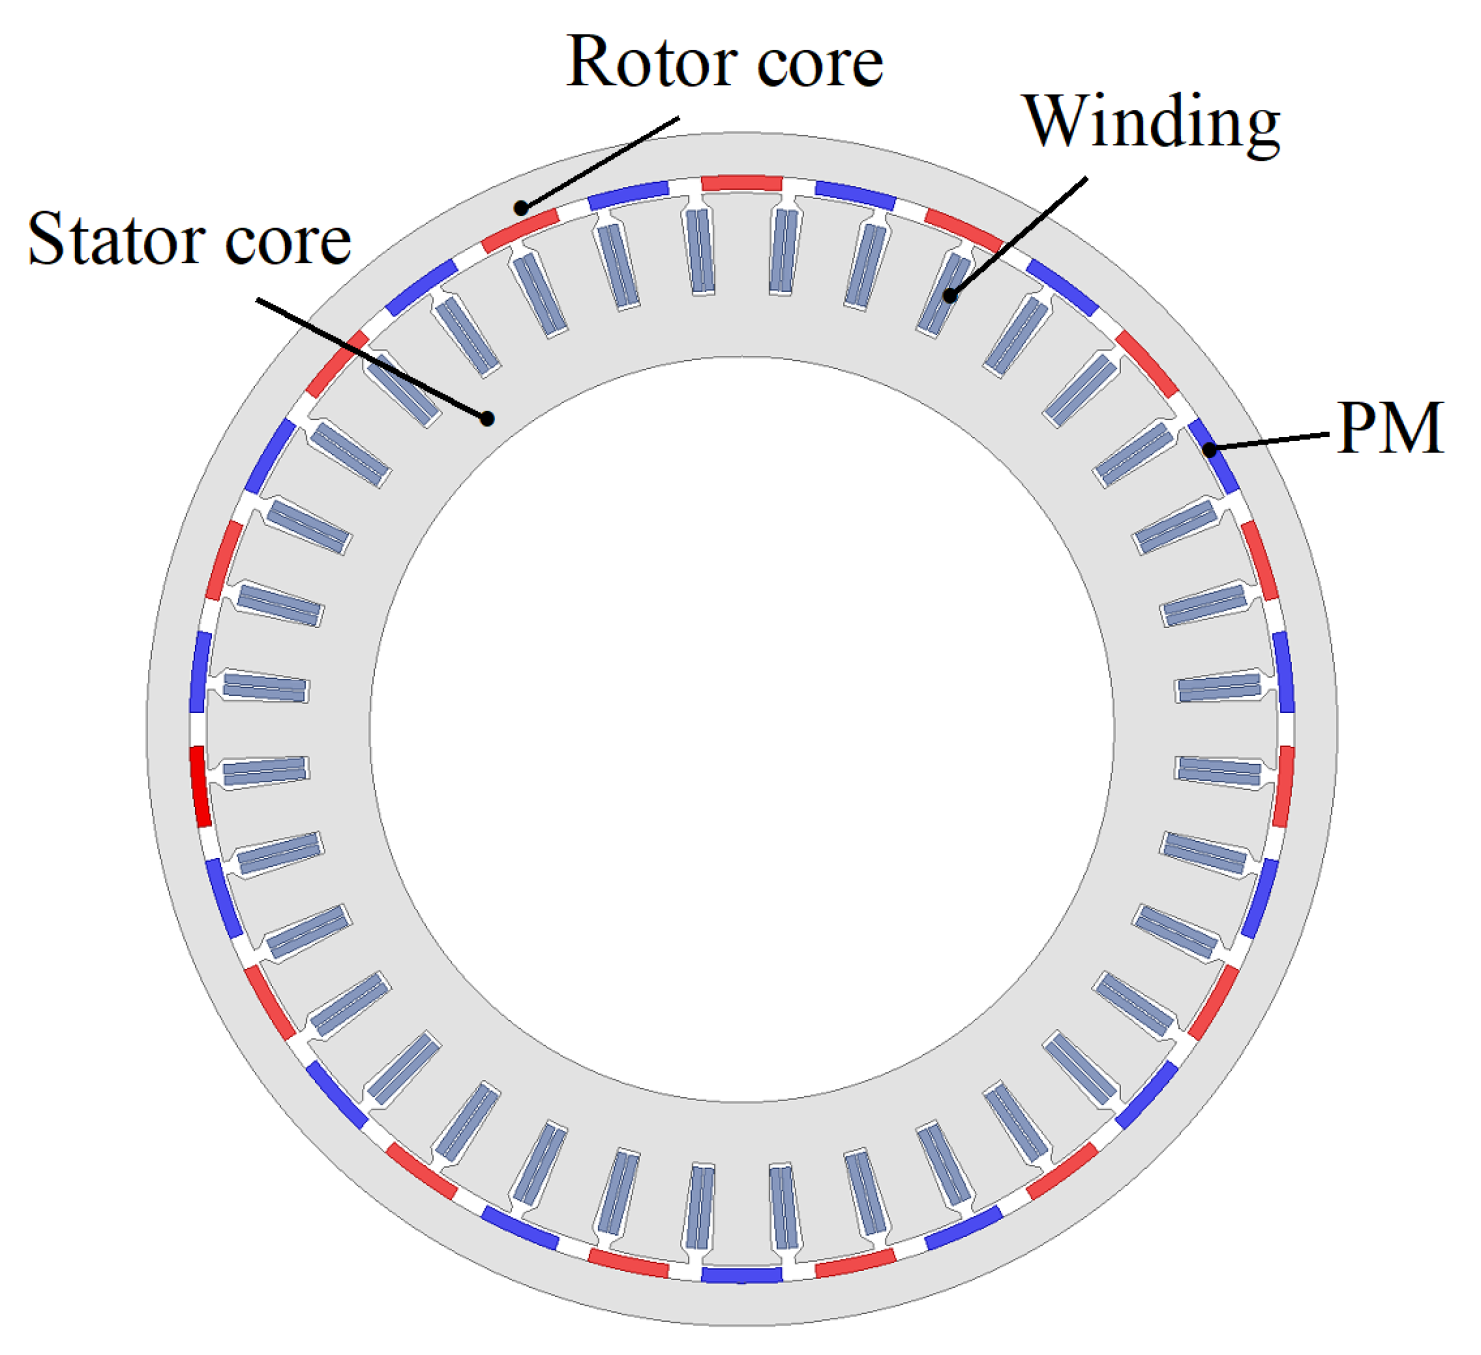
2. Initial Parameters
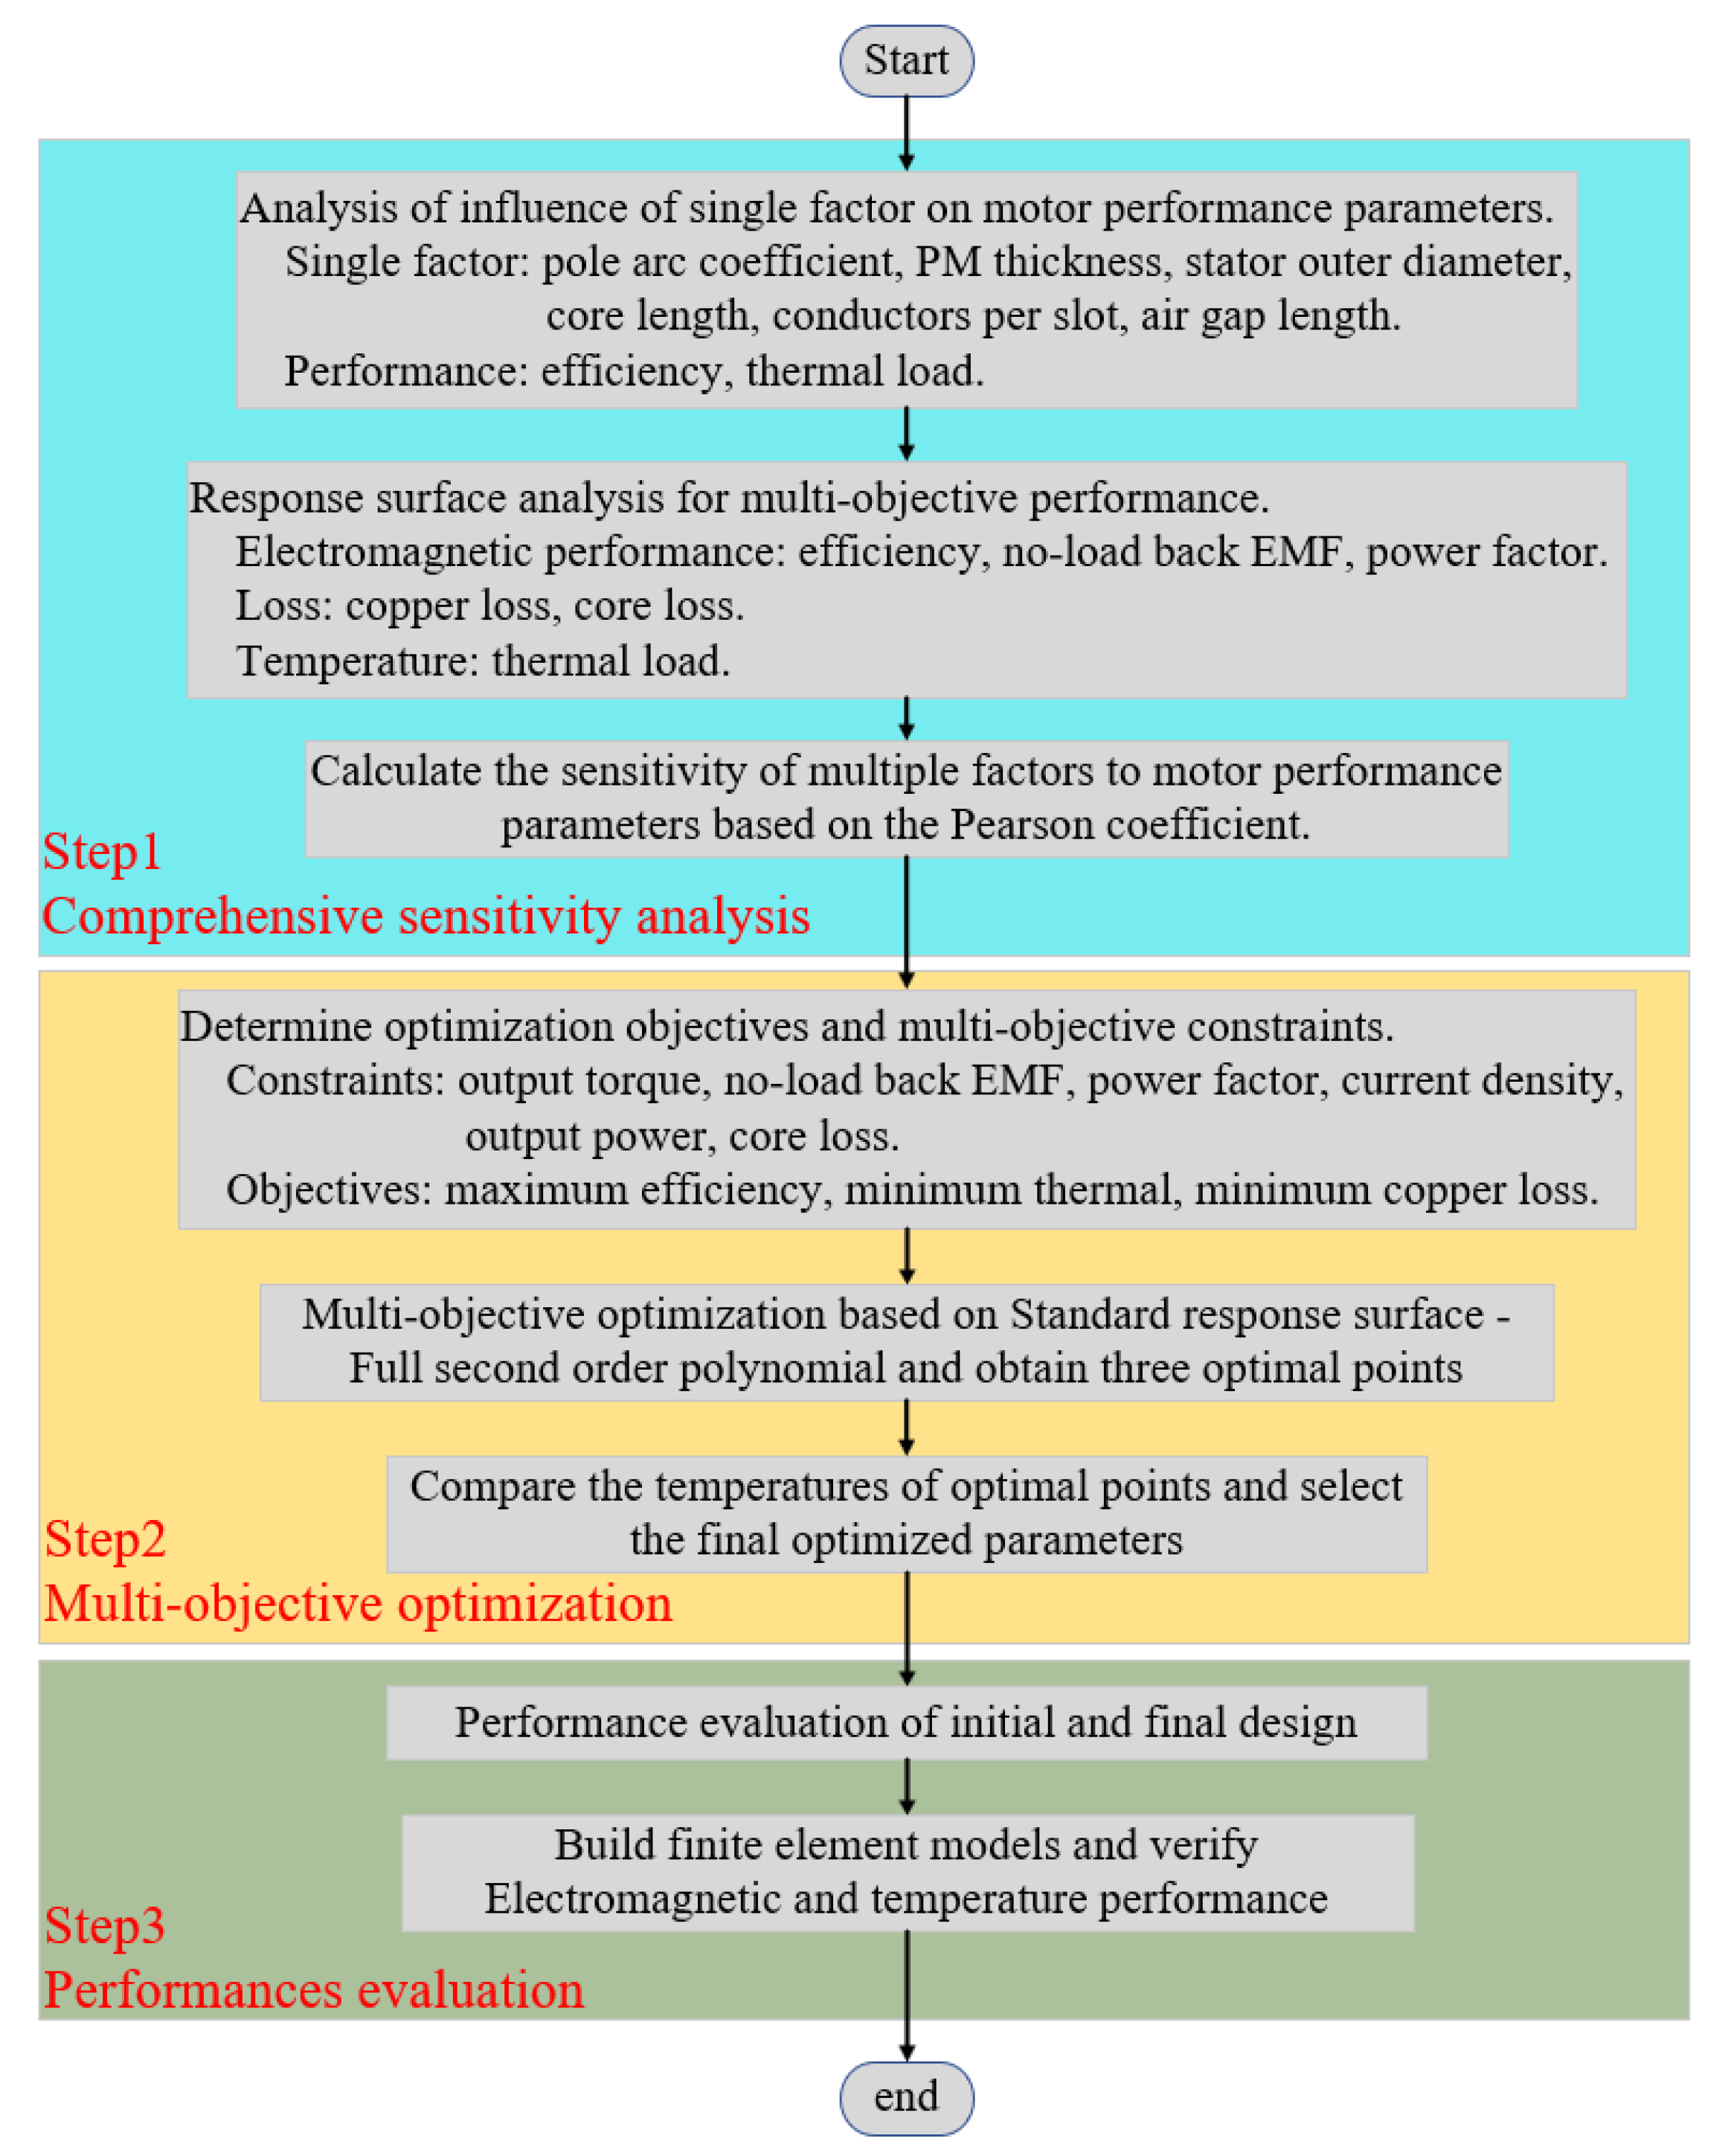
3. Comprehensive Sensitivity Analysis
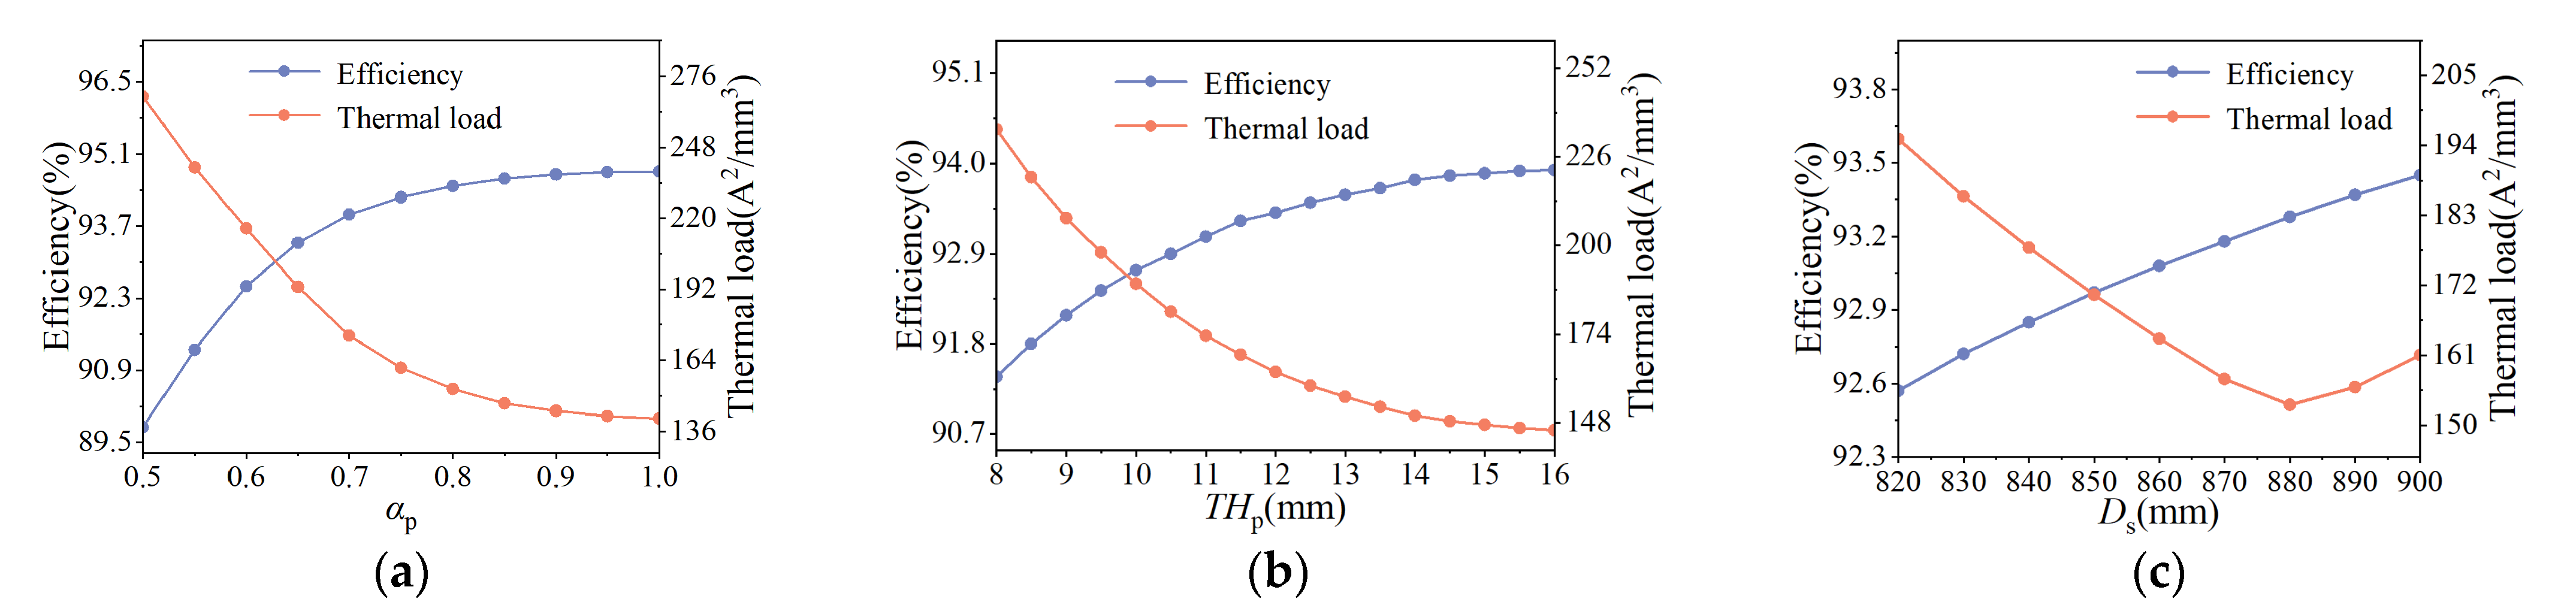
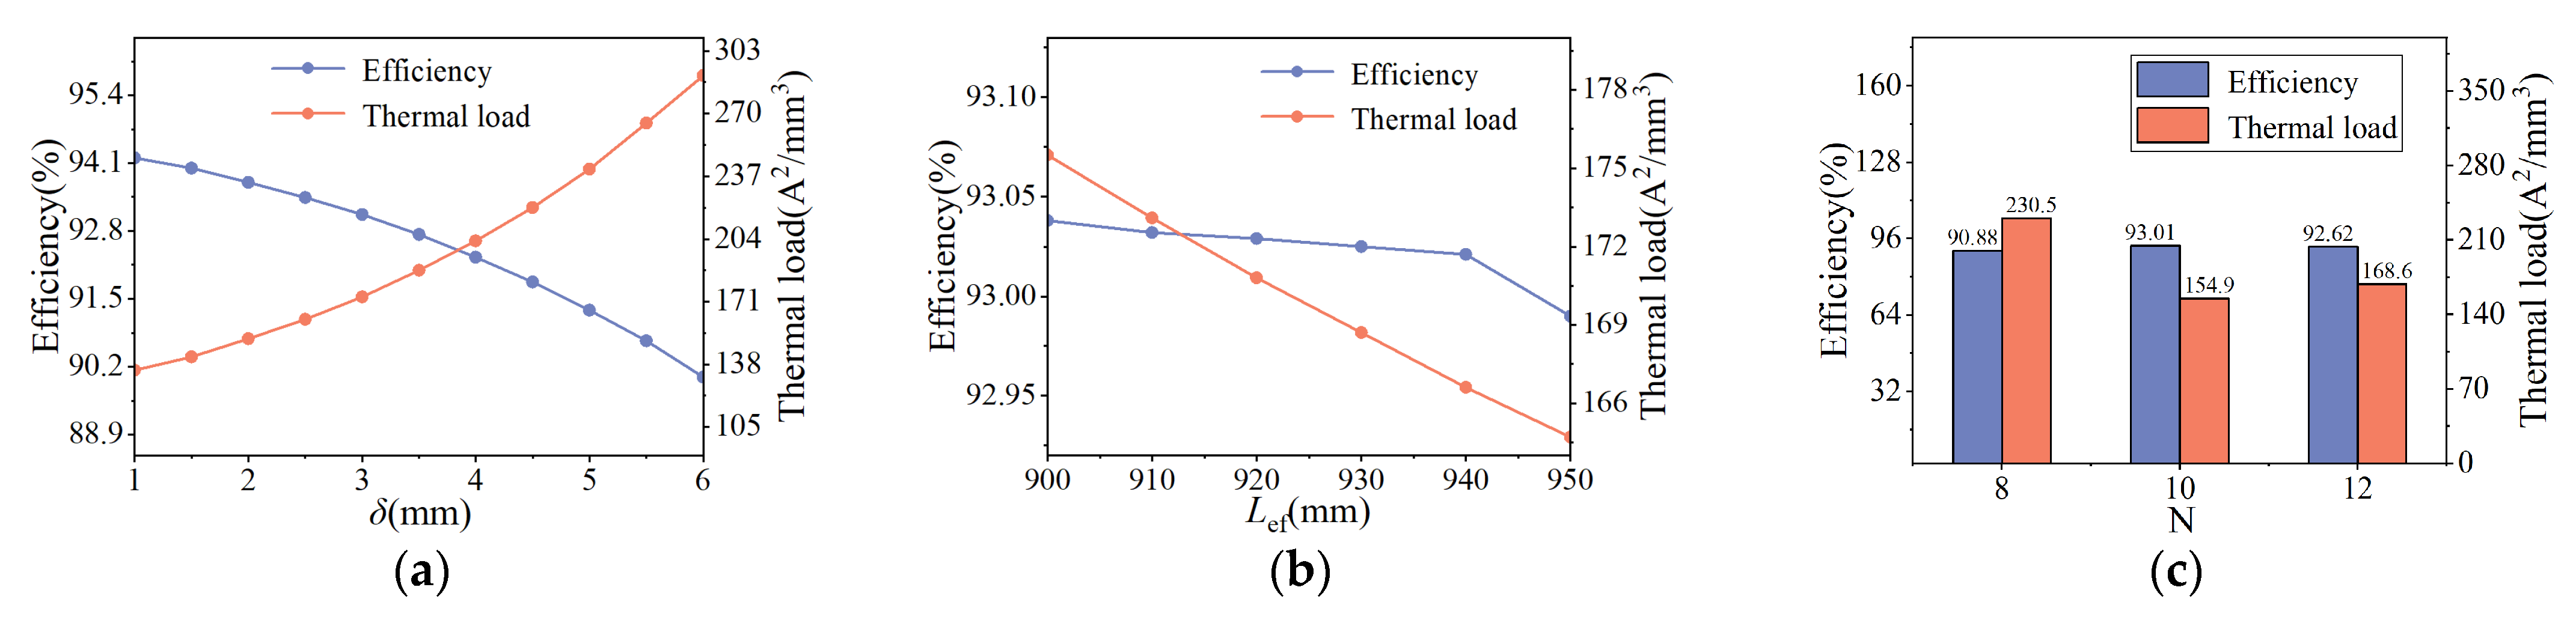
3.1. Optimization Parameters
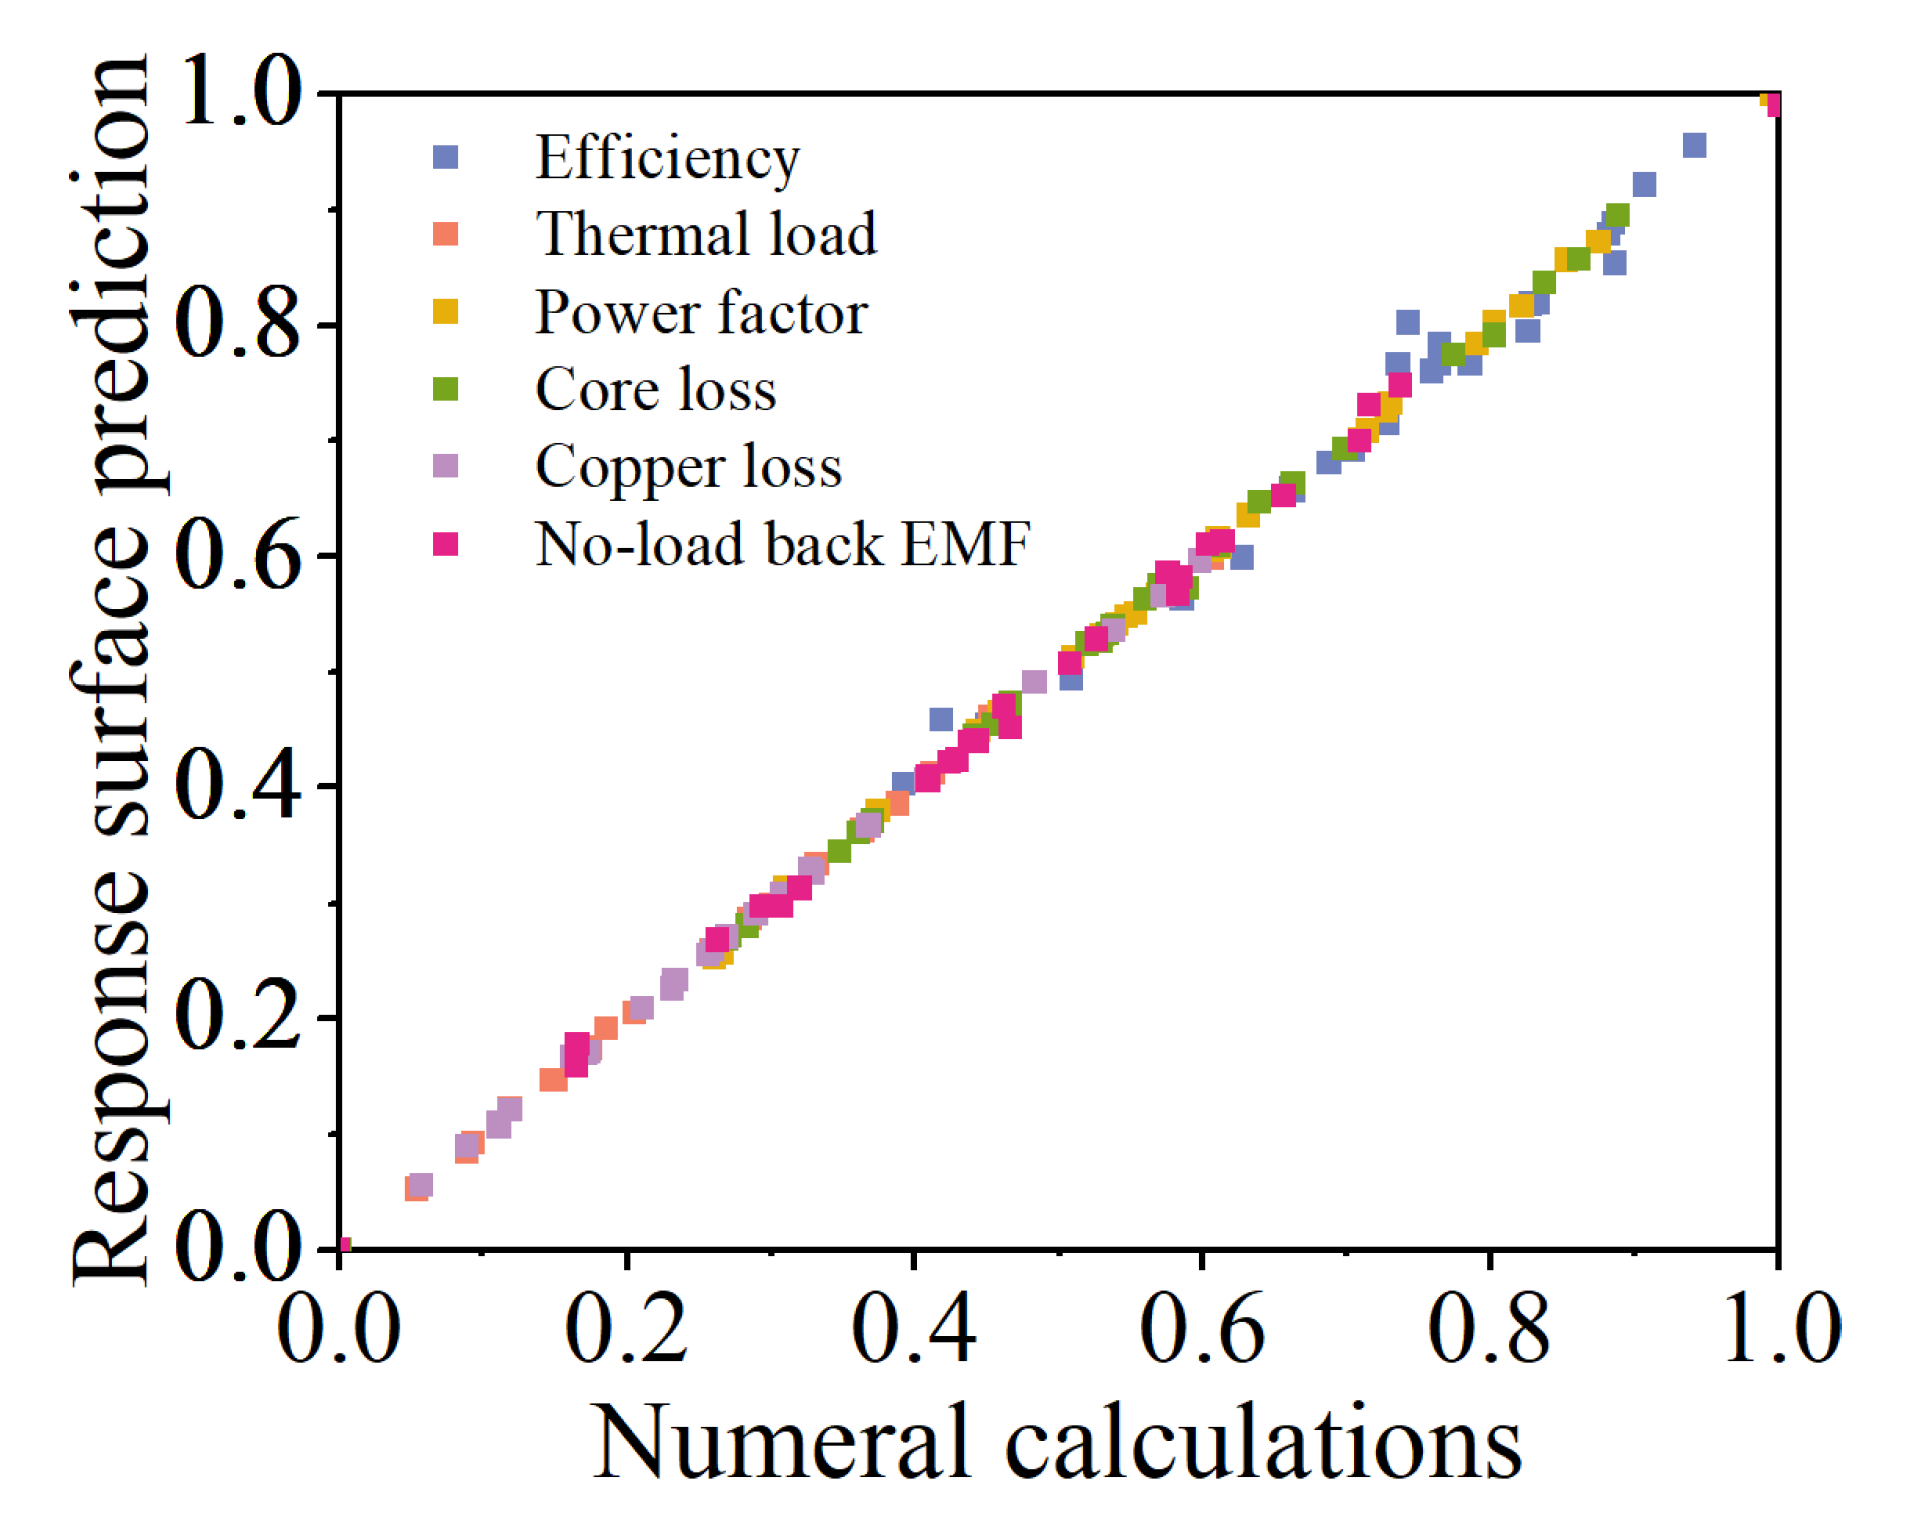
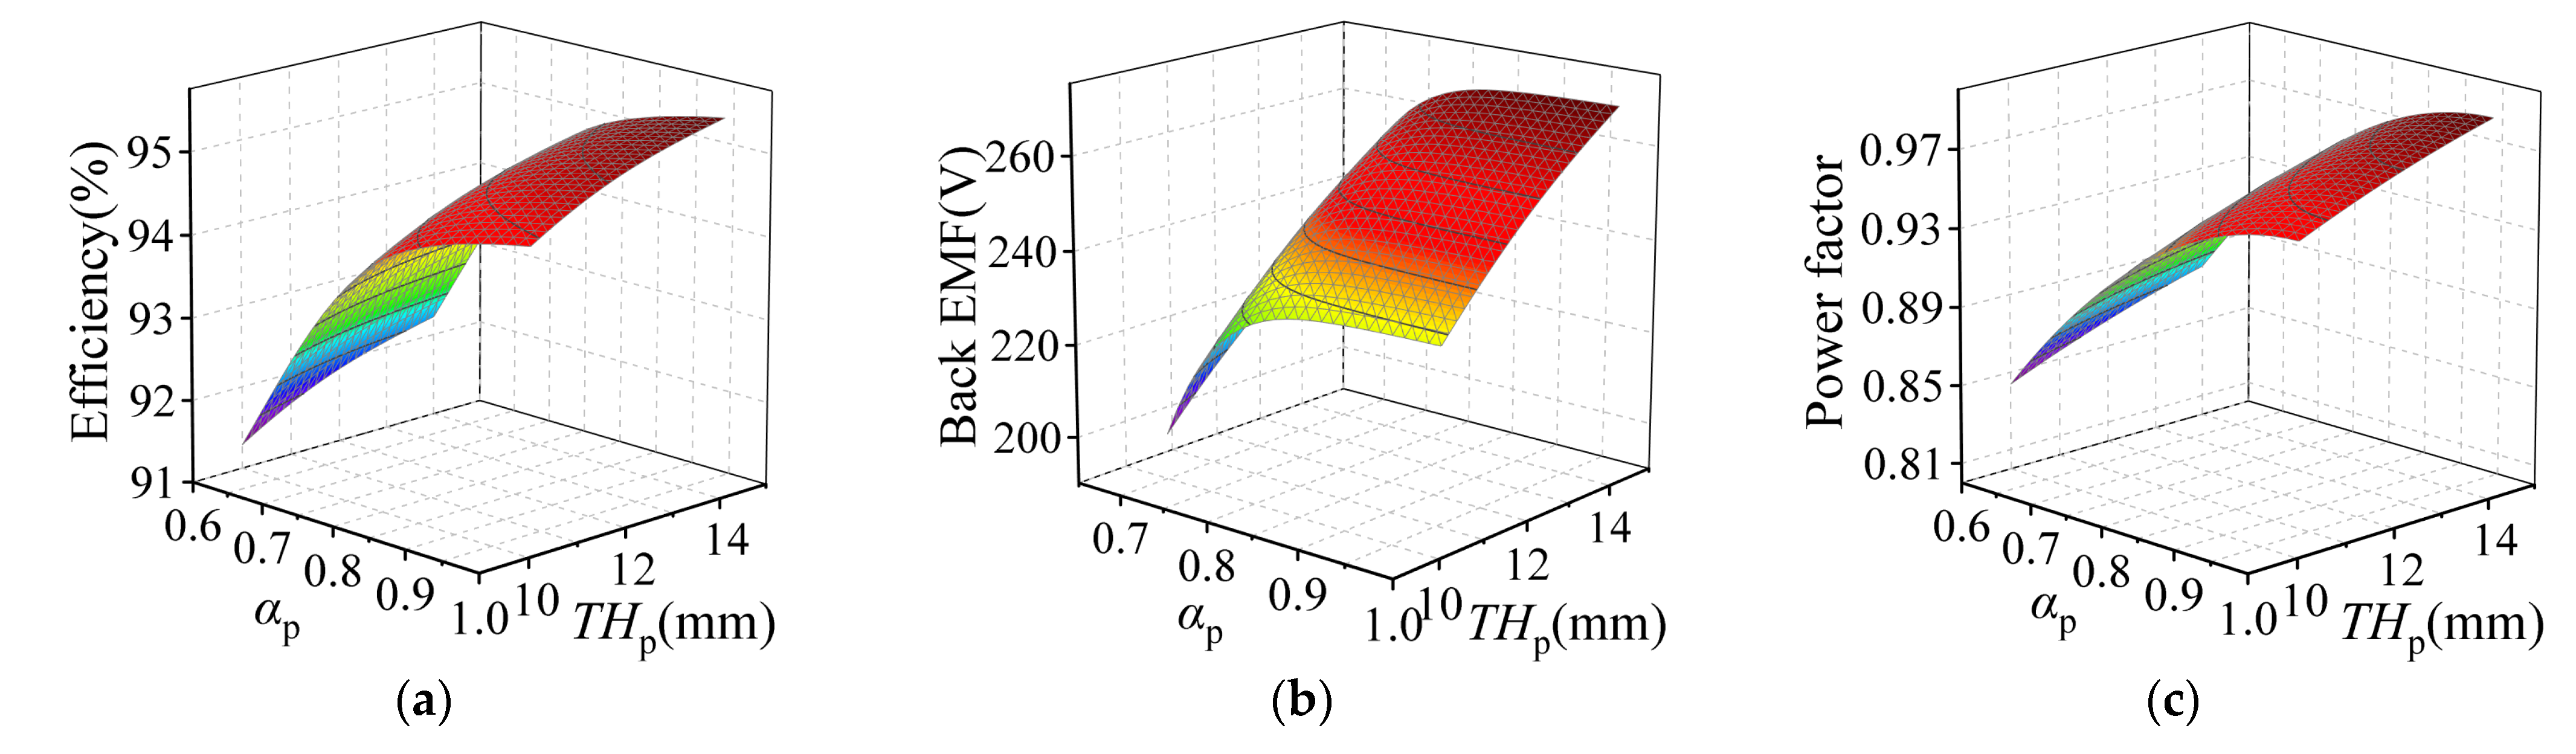
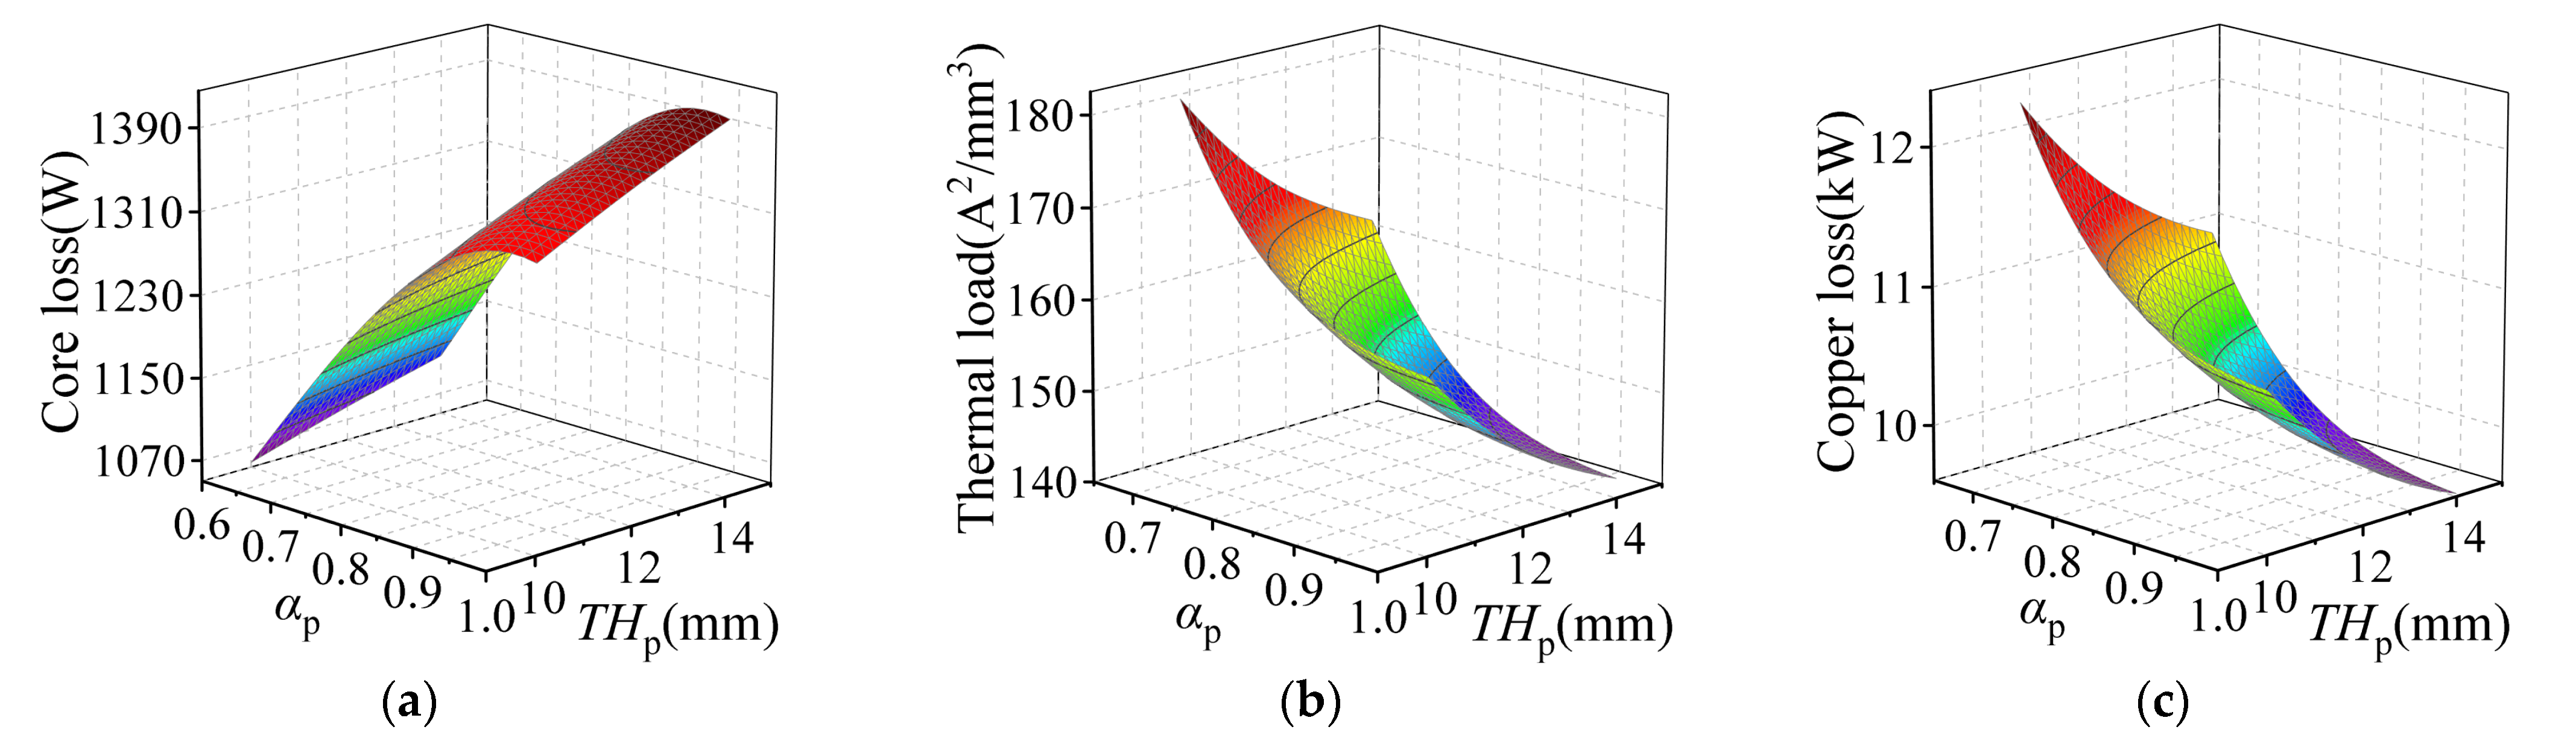
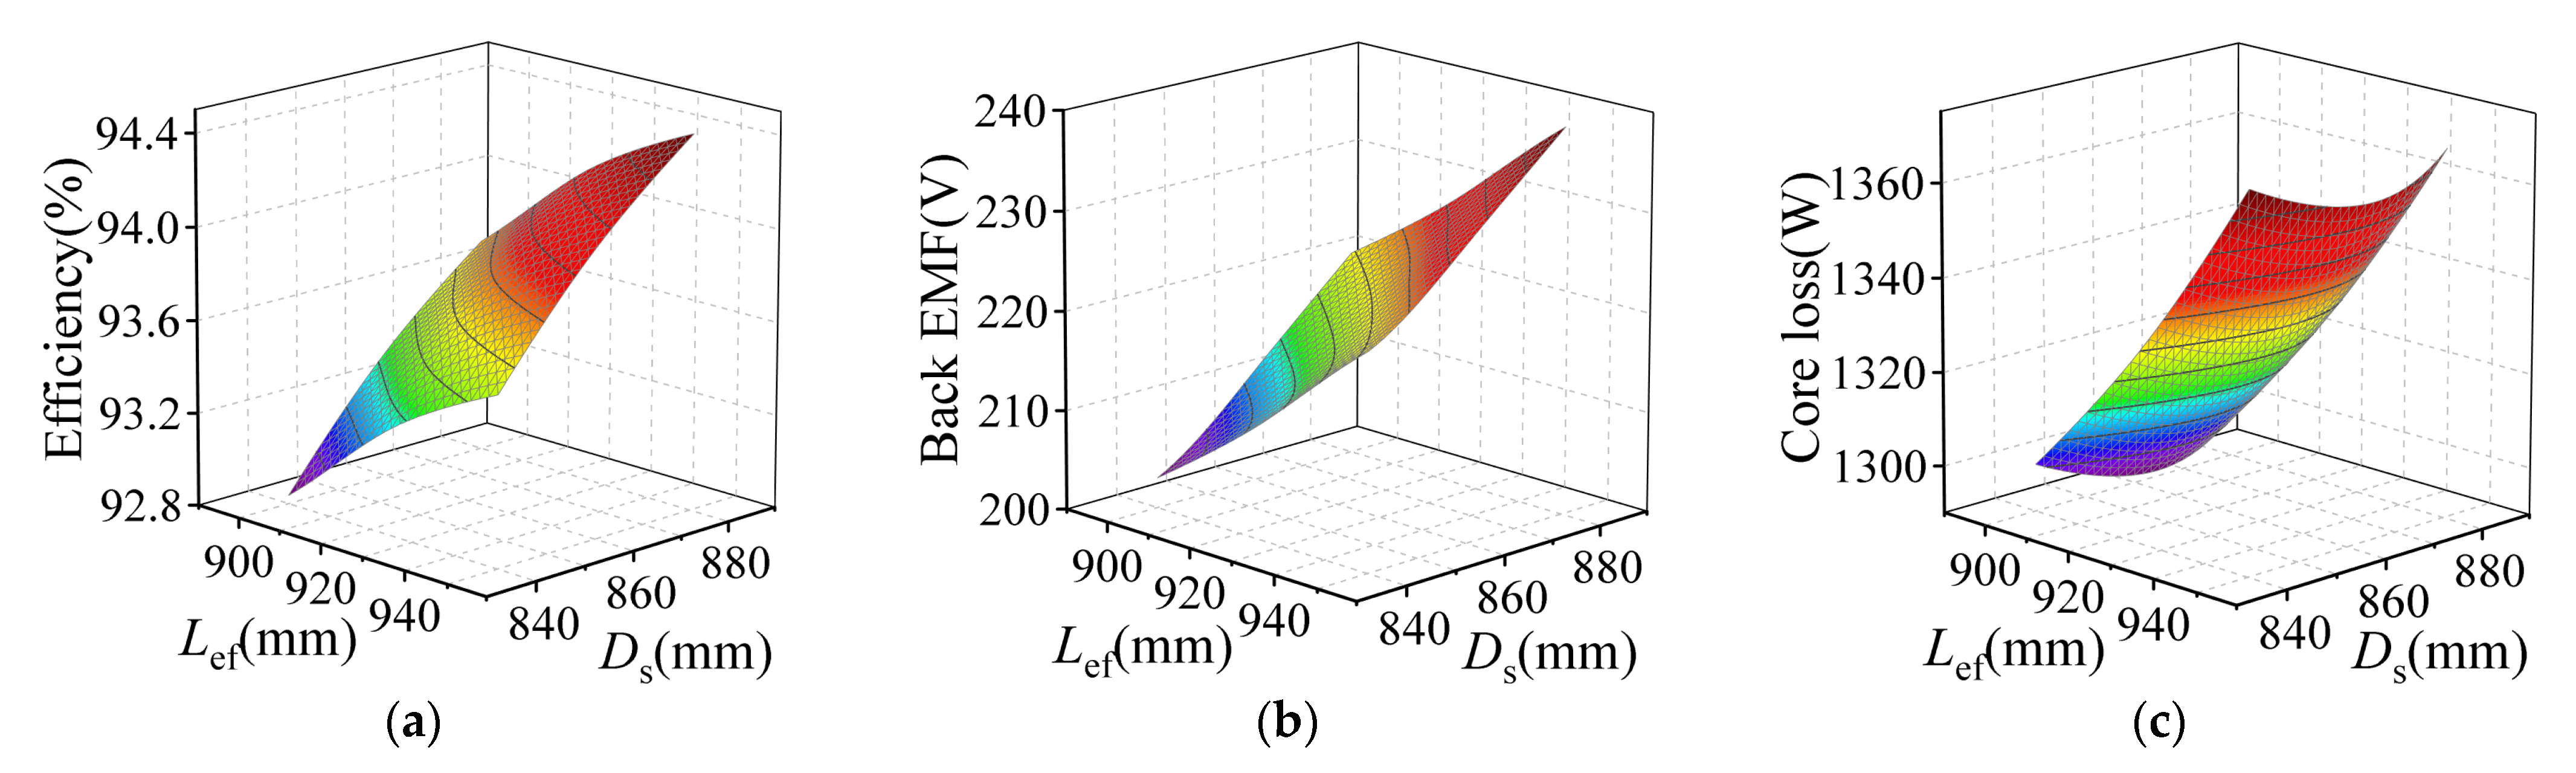
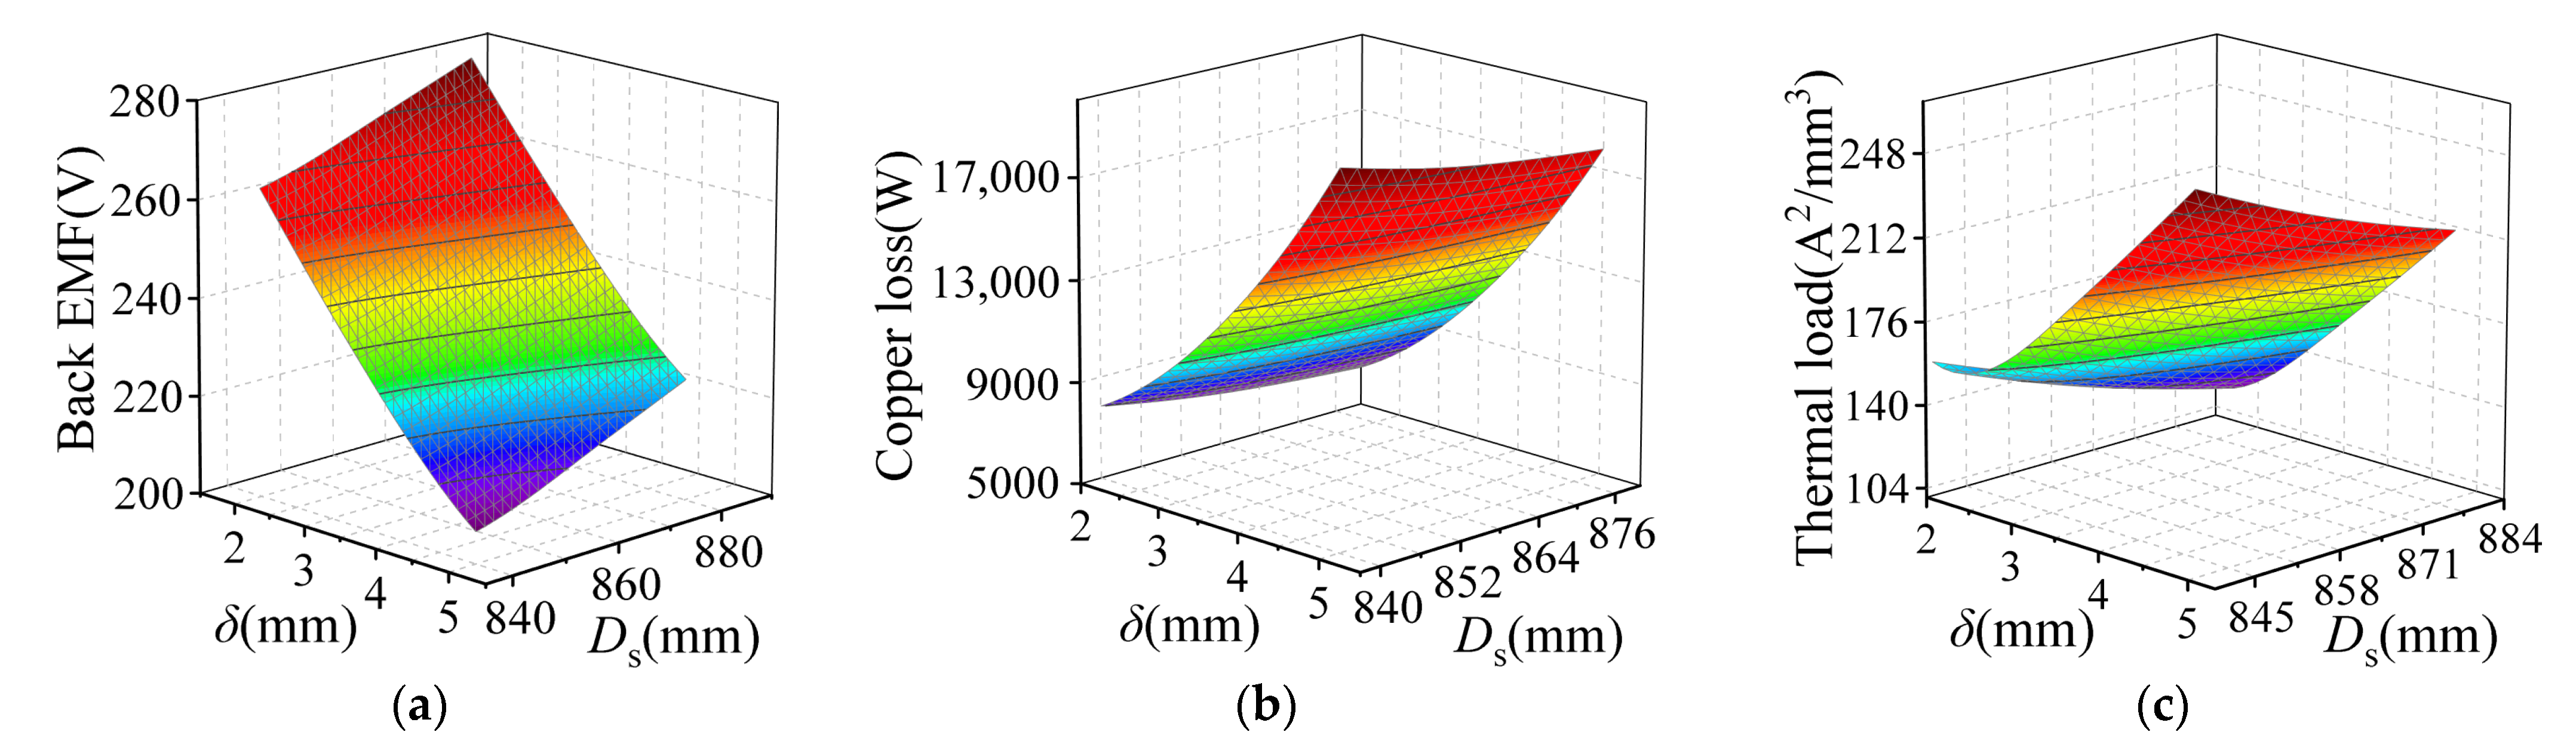
3.2. Response-Surface Analysis
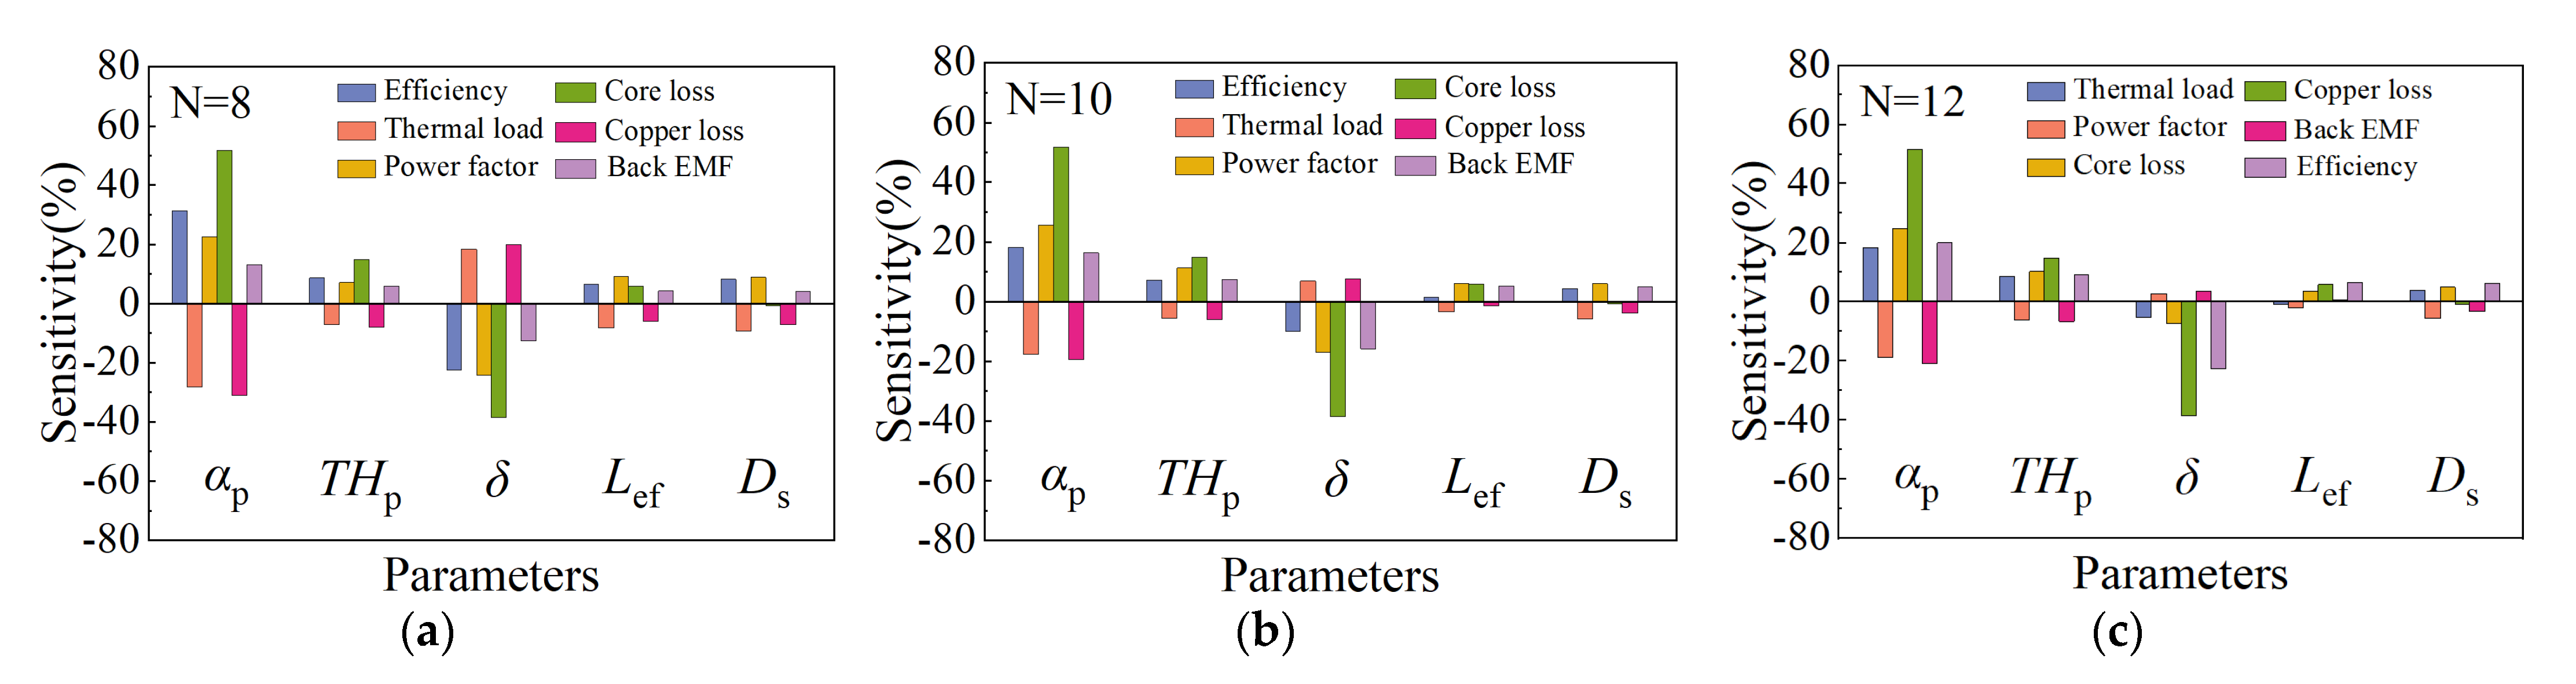
3.3. Sensitivity Analysis
4. Multiple Objectives Comprehensive Optimization
4.1. Multi-Objective Program Design
- Output torque: The output torque should be satisfied first in the design. For the LSPMM, its rated torque depends on the rated power and rated speed of the motor; the greater the rated power and the lower the rated speed, the greater the motor’s torque. In this paper, the rated torque of the design is 34,107.1 Nm and the output torque is constrained to a minimum of 34,110 Nm.
- No-load back EMF: The no-load back EMF is an important factor affecting the power factor. When the back EMF point is close to the voltage amplitude and the deviation is within the voltage range of ±2%, the motor power factor is greater than 0.9; otherwise, the power factor is low. Therefore, to pursue a high power factor, the no-load back EMF should be limited to the vicinity of the rated voltage, which is 205 V to 220 V.
- Power factor: The power factor is an important factor to measure the motor efficiency. The higher the power factor, the higher the motor efficiency. Therefore, the minimum power factor is set to 0.95.
- Current density: The current density also needs to be limited. If the current density is too large, then it will increase the loss and affect the motor temperature; if it is too small, then the amount of coil material will increase. According to the traditional permanent magnet motor theory, the current density of the LSPMM is about 4–6 A/mm2.
- Output power: The power selection of the motor should be appropriate. When the power selection is too large, the efficiency and power factor will be reduced, and when the power selection is too small, the motor will be overloaded and the lifespan will be shortened. In this optimization, the LSPMM is rated at 200 kW, so the minimum output power is limited to 200,000 W.
- Core loss: Although the core loss is about 10 times smaller than the copper loss, the effect of the core loss on the motor temperature is not as large as that of the copper loss, but excessive core loss still affects motor performance. Therefore, the maximum core loss is set to 1500 W.
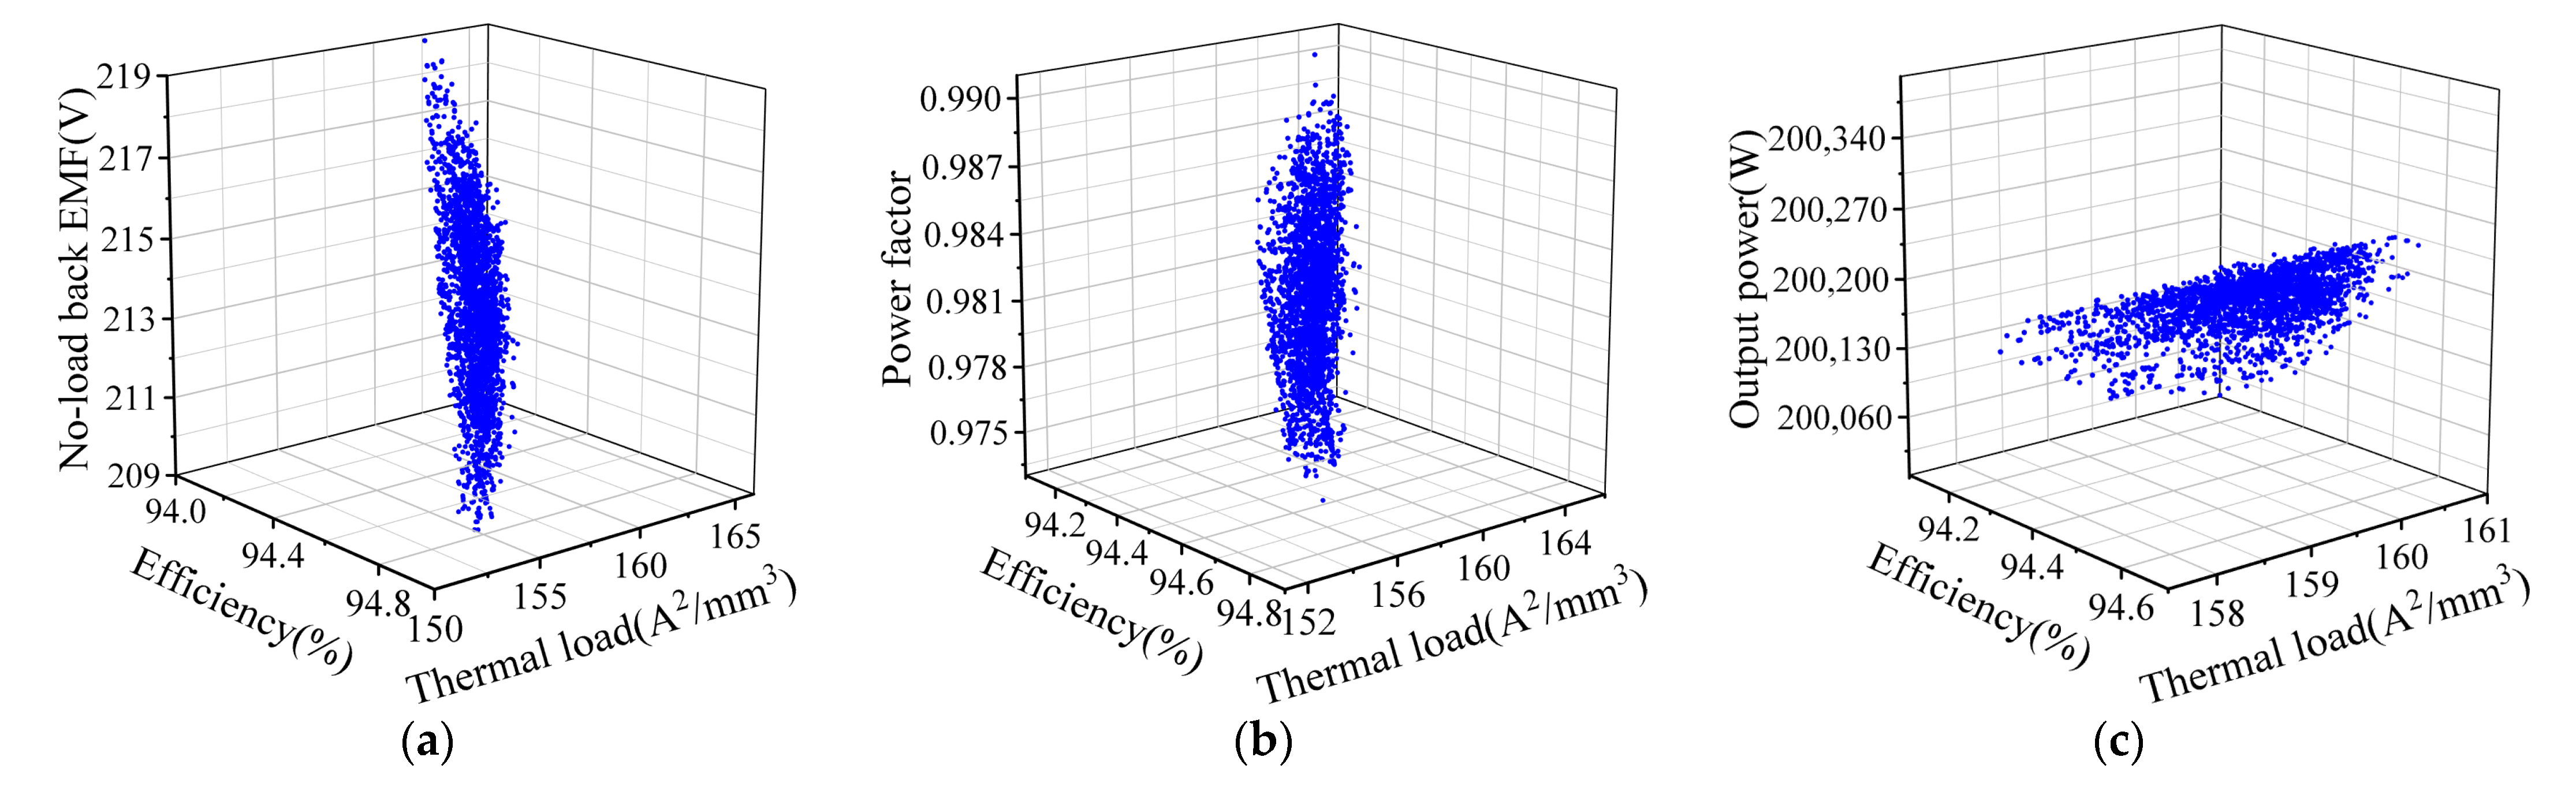
4.2. Optimization
5. Performance Evaluation
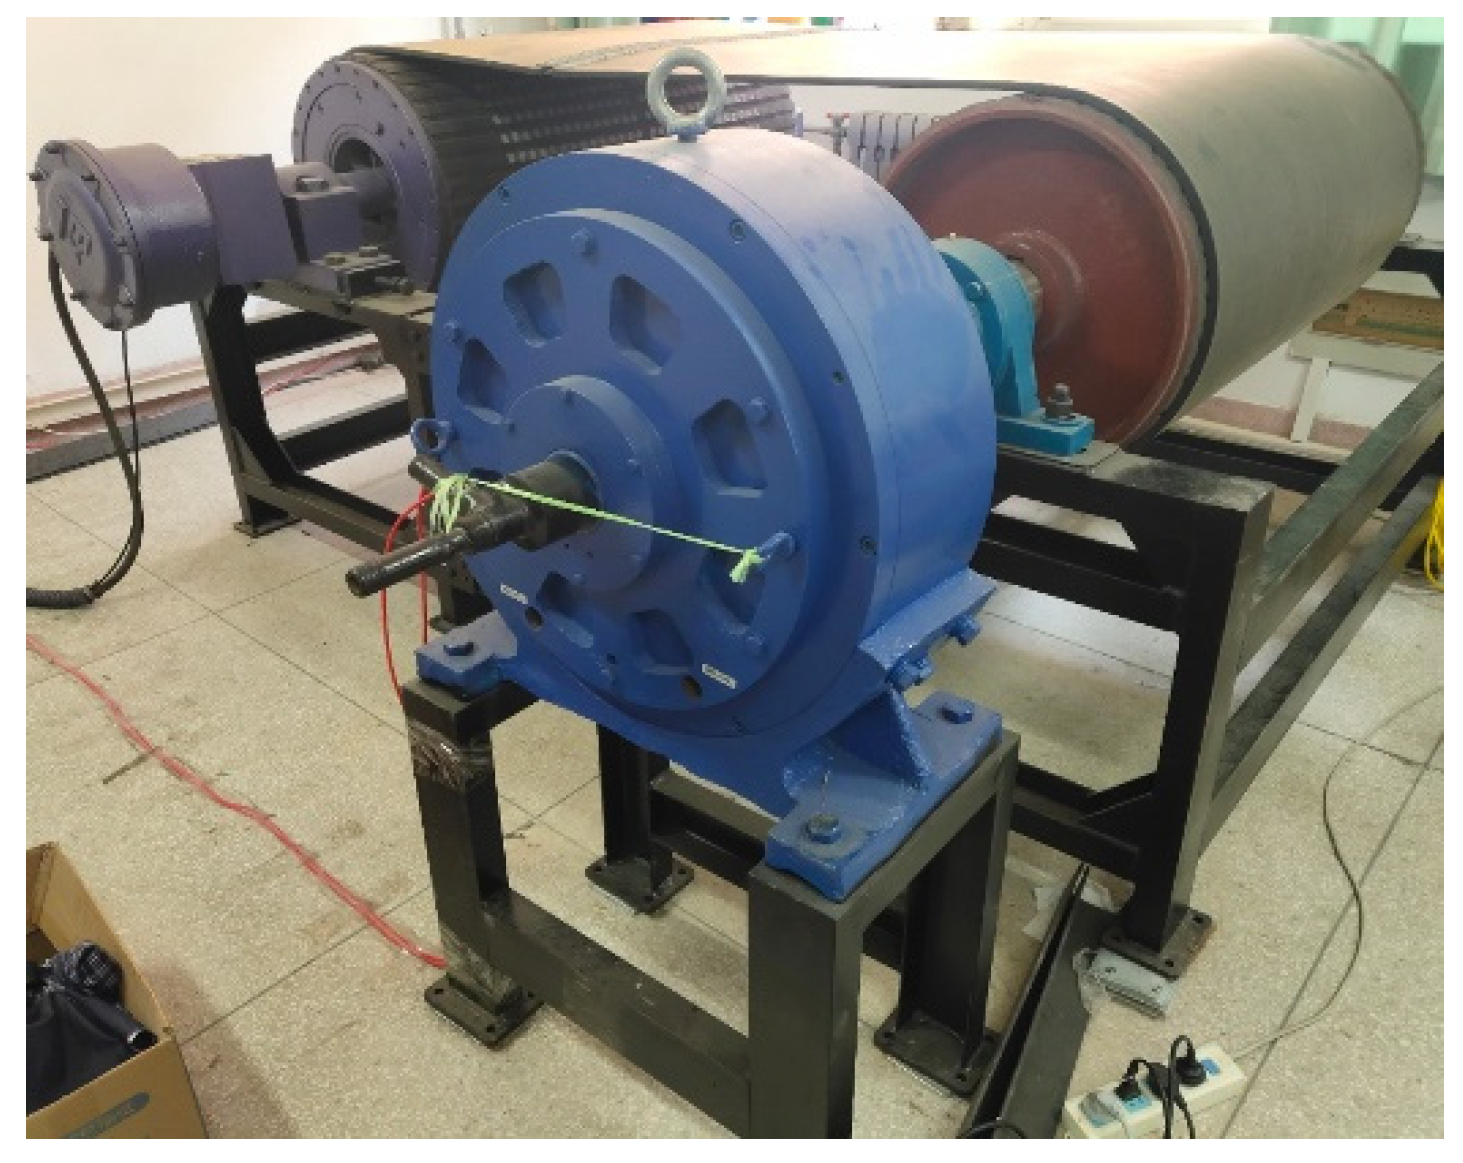
6. Experimental Tests
7. Conclusions
Author Contributions
Funding
Institutional Review Board Statement
Informed Consent Statement
Data Availability Statement
Conflicts of Interest
References
- Brock, H.; Berker, B.; Ali, E. Design of an External-Rotor Direct Drive E-Bike Switched Reluctance Motor. IEEE Trans. Veh. Technol. 2020, 69, 2552–2562. [Google Scholar]
- Shi, Z.; Sun, X.D.; Cai, Y.F.; Tian, X.; Chen, L. Design optimisation of an outer-rotor permanent magnet synchronous hub motor for a low-speed campus patrol EV. IET Electr. Power Appl. 2020, 14, 2111–2118. [Google Scholar] [CrossRef]
- Feng, G.H.; Yu, J.Y.; Zhang, B.Y.; Wang, B.; Sun, H.G. Study on Belt Conveyor Direct Driven by External-Rotor PMSM. Adv. Mater. Res. 2012, 619, 14–17. [Google Scholar] [CrossRef]
- Ma, S.H. Study on the application of permanent magnet synchronous motors in underground belt conveyors. IOP Conf. Ser. Mater. Sci. Eng. 2017, 283, 012006. [Google Scholar] [CrossRef]
- Chu, W.Q.; Zhu, Z.Q. Optimal split ratio and torque comparison of surface-mounted permanent magnet machines having inner or outer rotor. In Proceedings of the 6th IET International Conference on Power Electronics, Machines and Drives (PEMD 2012), Bristol, UK, 27–29 March 2012. [Google Scholar]
- Li, Z.K.; Huang, X.Y.; Chen, Z.; Shi, T.N.; Yan, Y. Nonlinear Analytical Analysis of External Rotor Permanent Magnet Synchronous Motor. IEEE Trans. Magn. 2021, 57, 8204004. [Google Scholar] [CrossRef]
- Ghaffari, A.; Rahideh, A.; Moayed, J.H.; Vahaj, A.A.; Mahmoudi, A.; Soong, W.L. 2-D Analytical Model for Outer-Rotor Consequent-Pole Brushless PM Machines. IEEE Trans. Energy Convers. 2019, 34, 2226–2234. [Google Scholar] [CrossRef]
- Li, Z.; Feng, G.D.; Lai, C.Y.; Tian, J.B.; Li, W.L.; Narayan, C.K. Dual DC current injection-based stator winding temperature tracking for dual three-phase permanent magnet synchronous machine using Kalman filter. IET Electr. Power Appl. 2019, 13, 1726–1733. [Google Scholar] [CrossRef]
- Sami, R.H.; Jere, K.; Jouni, I.; Antero, A. Interdependence of Demagnetization, Loading, and Temperature Rise in a Permanent-Magnet Synchronous Motor. IEEE Trans. Magn. 2010, 46, 949–953. [Google Scholar]
- Du, G.H.; Xu, W.; Zhu, J.G.; Huang, N. Power Loss and Thermal Analysis for High-Power High-Speed Permanent Magnet Machines. IEEE Trans. Ind. Electron. 2020, 67, 2722–2733. [Google Scholar] [CrossRef]
- Fu, Z.K.; Zhang, F.G.; Zhang, Z.Y.; Jin, S. Loss Study of Dual Stator Low Speed High Torque Synchronous Motor with Hybrid Rotor. J. Phys. Conf. Ser. 2021, 1887, 012051. [Google Scholar] [CrossRef]
- Song, T.F.; Zhang, Z.Y.; Liu, H.J.; Hu, W.L. Multi-objective optimisation design and performance comparison of permanent magnet synchronous motor for EVs based on FEA. IET Electr. Power Appl. 2019, 13, 1157–1166. [Google Scholar] [CrossRef]
- Hao, J.S.; Suo, S.F.; Yang, Y.Y.; Wang, Y.; Wang, W.J. Power Density Analysis and Optimization of SMPMSM Based on FEM, DE Algorithm and Response Surface Methodology. Energies 2019, 12, 3639. [Google Scholar] [CrossRef]
- Onsal, M.; Cumhur, B.; Demir, Y.; Yolacan, E.; Aydin, M. Rotor Design Optimization of a New Flux-Assisted Consequent Pole Spoke-Type Permanent Magnet Torque Motor for Low-Speed Applications. IEEE Trans. Magn. 2018, 54, 1–5. [Google Scholar] [CrossRef]
- Beak, S.W.; Kim, B.T.; Kwon, B.I. Practical Optimum Design Based on Magnetic Balance and Copper Loss Minimization for a Single-Phase Line Start PM Motor. IEEE Trans. Magn. 2011, 47, 3008–3011. [Google Scholar] [CrossRef]
- Crider, J.; Jonathan, M.; Sudhoff; Scott, D. An Inner Rotor Flux-Modulated Permanent Magnet Synchronous Machine for Low-Speed High-Torque Applications. IEEE Trans. Energy Convers. 2015, 30, 1247–1254. [Google Scholar] [CrossRef]
- Anders, G.; Prakashraj, K. Force Density Limits in Low-Speed PM Machines Due to Temperature and Reactance. IEEE Trans. Energy Convers. 2004, 19, 518–525. [Google Scholar]
- Rafiee, V.; Faiz, J. Robust Design of an Outer Rotor Permanent Magnet Motor Through Six-Sigma Methodology Using Response Surface Surrogate Model. IEEE Trans. Magn. 2019, 55, 1–10. [Google Scholar] [CrossRef]
- Bianchi, N.; Degano, M.; Fornasiero, E. Sensitivity Analysis of Torque Ripple Reduction of Synchronous Reluctance and Interior PM Motors. IEEE Trans. Ind. Appl. 2015, 51, 187–195. [Google Scholar] [CrossRef]

| Parameters | Value |
|---|---|
| Number of poles | 30 |
| Number of stator slots | 36 |
| Air gap length (mm) | 3 |
| Stator outer diameter (mm) | 863 |
| Core length (mm) | 930 |
| Pole arc coefficient | 0.7 |
| PM thickness (mm) | 11 |
| Number of conductors per slot | 12 |
| Parameters | Range |
|---|---|
| Pole arc coefficient | [0.65, 0.95] |
| PM thickness (mm) | [10, 15] |
| Stator outer diameter (mm) | [840, 880] |
| Core length (mm) | [900, 940] |
| Number of conductors per slot N | [8, 10, 12] |
| Air gap length (mm) | [2, 5] |
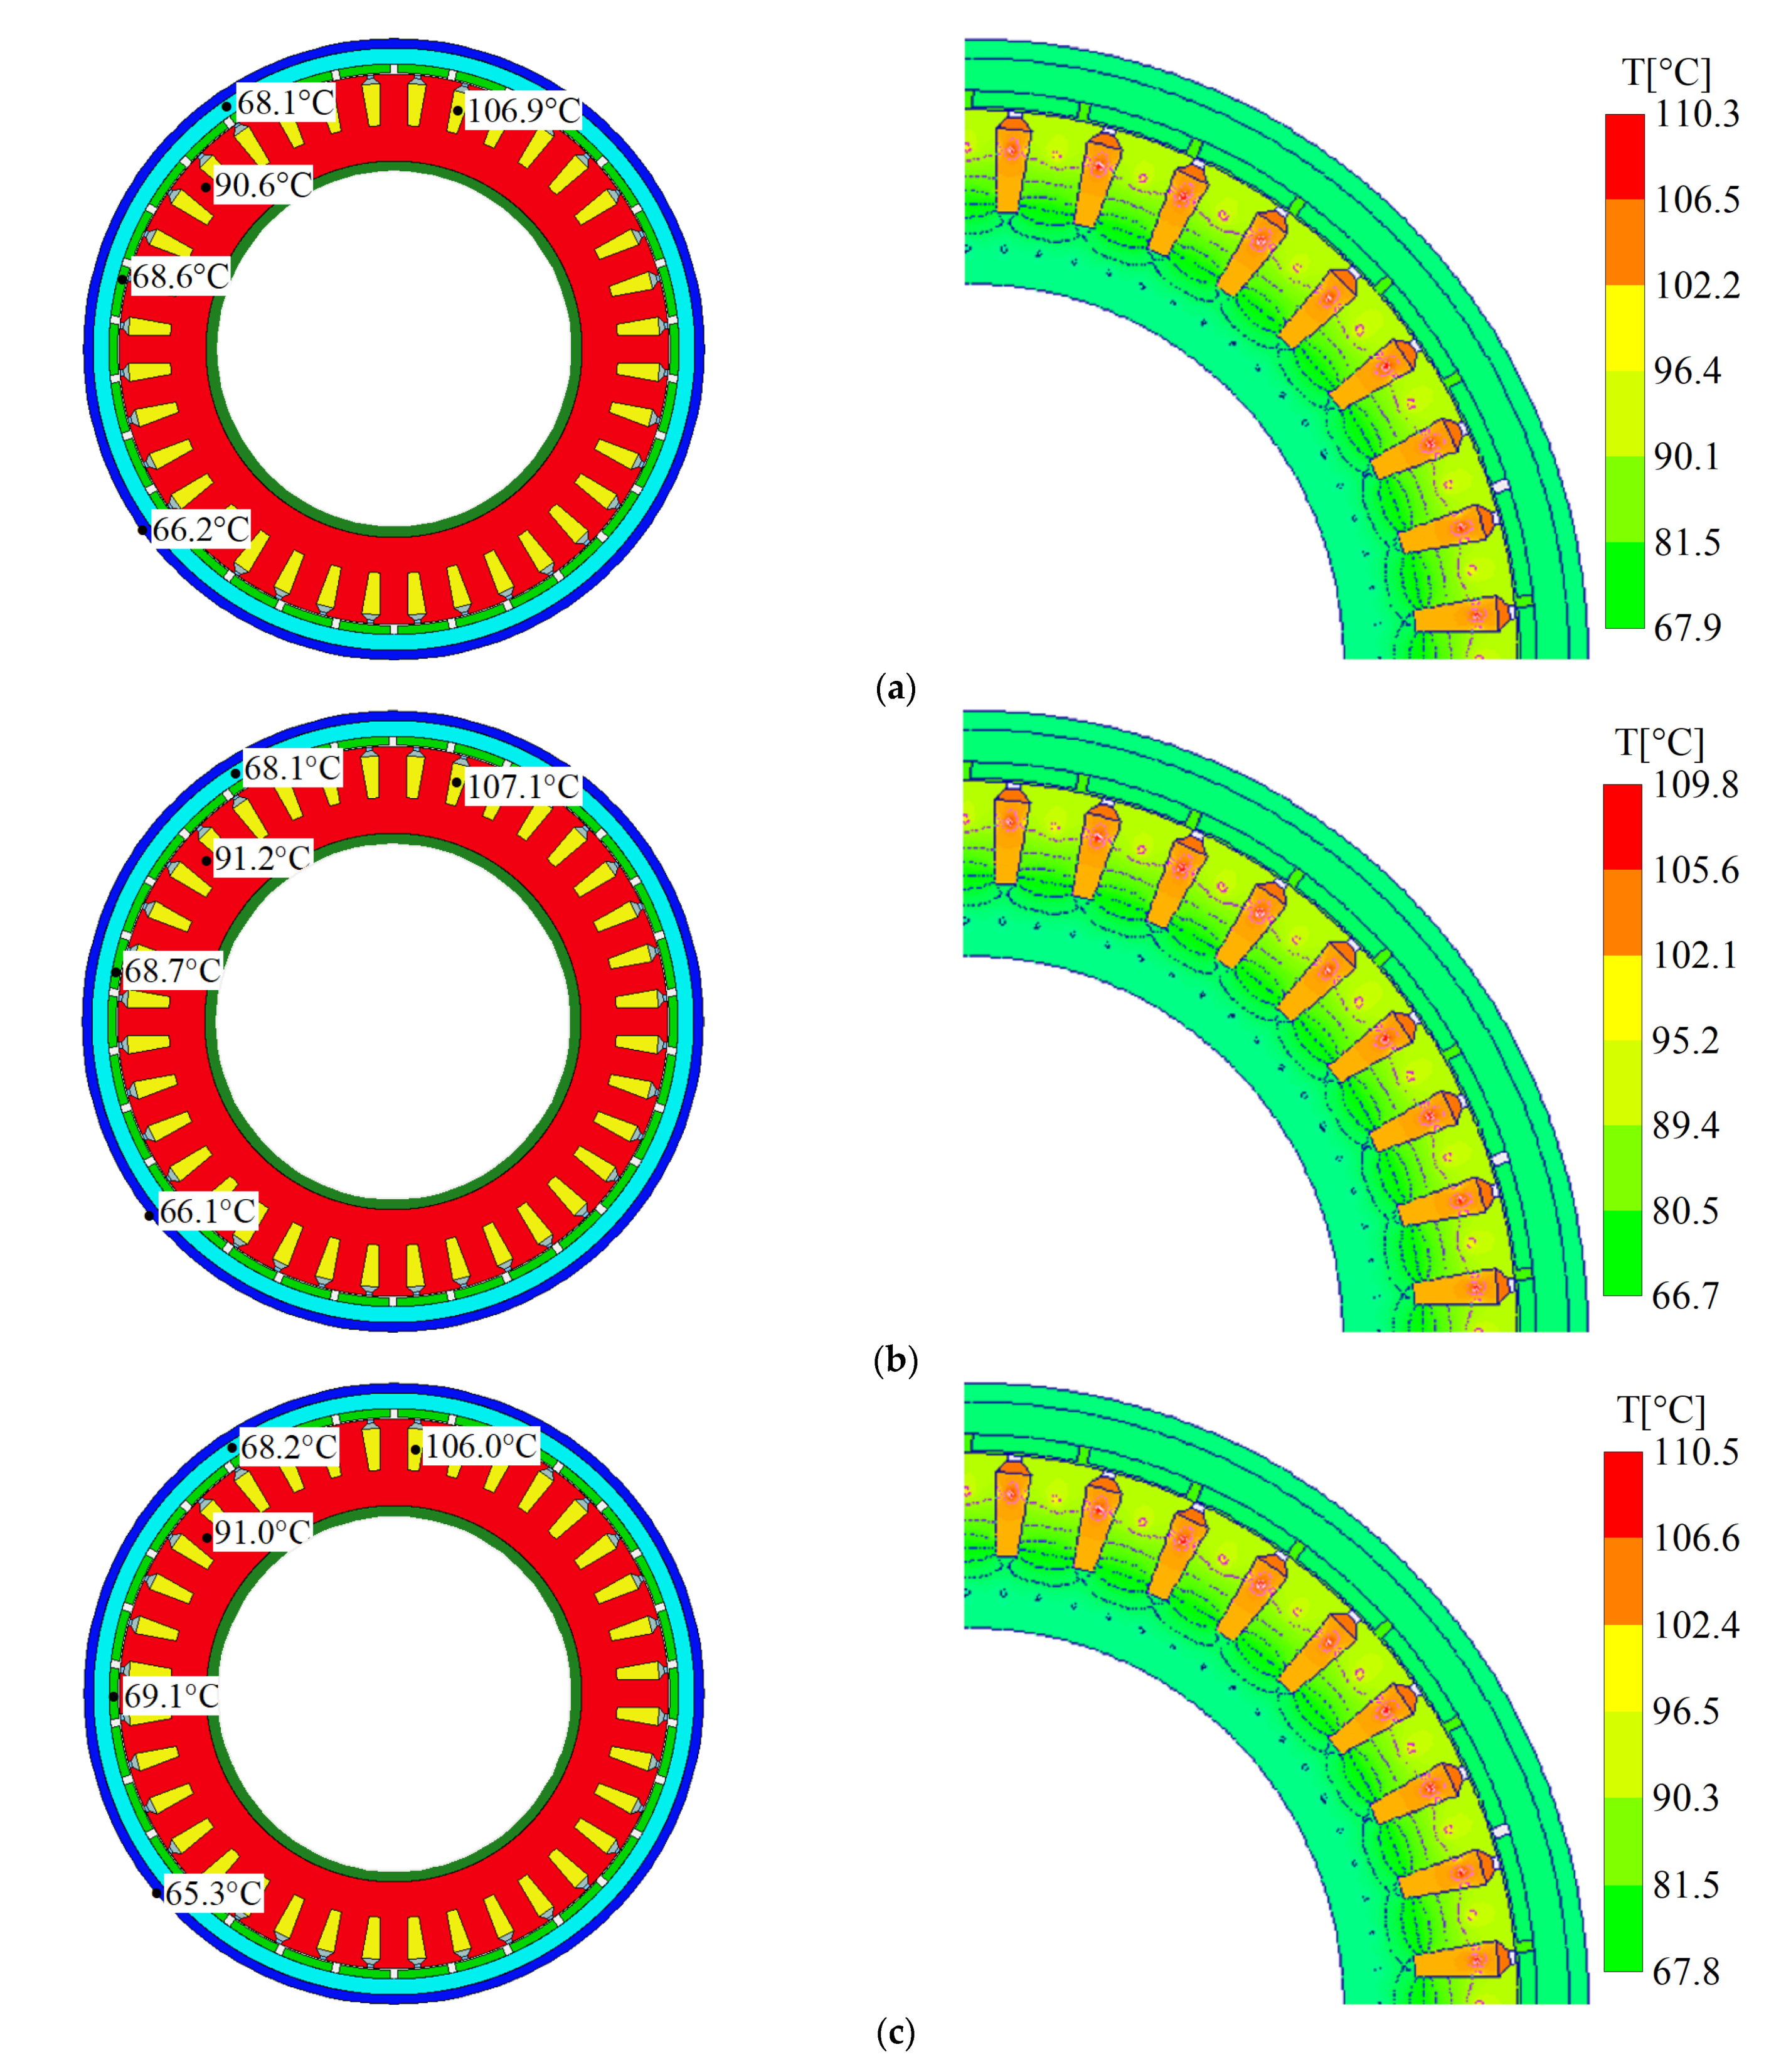
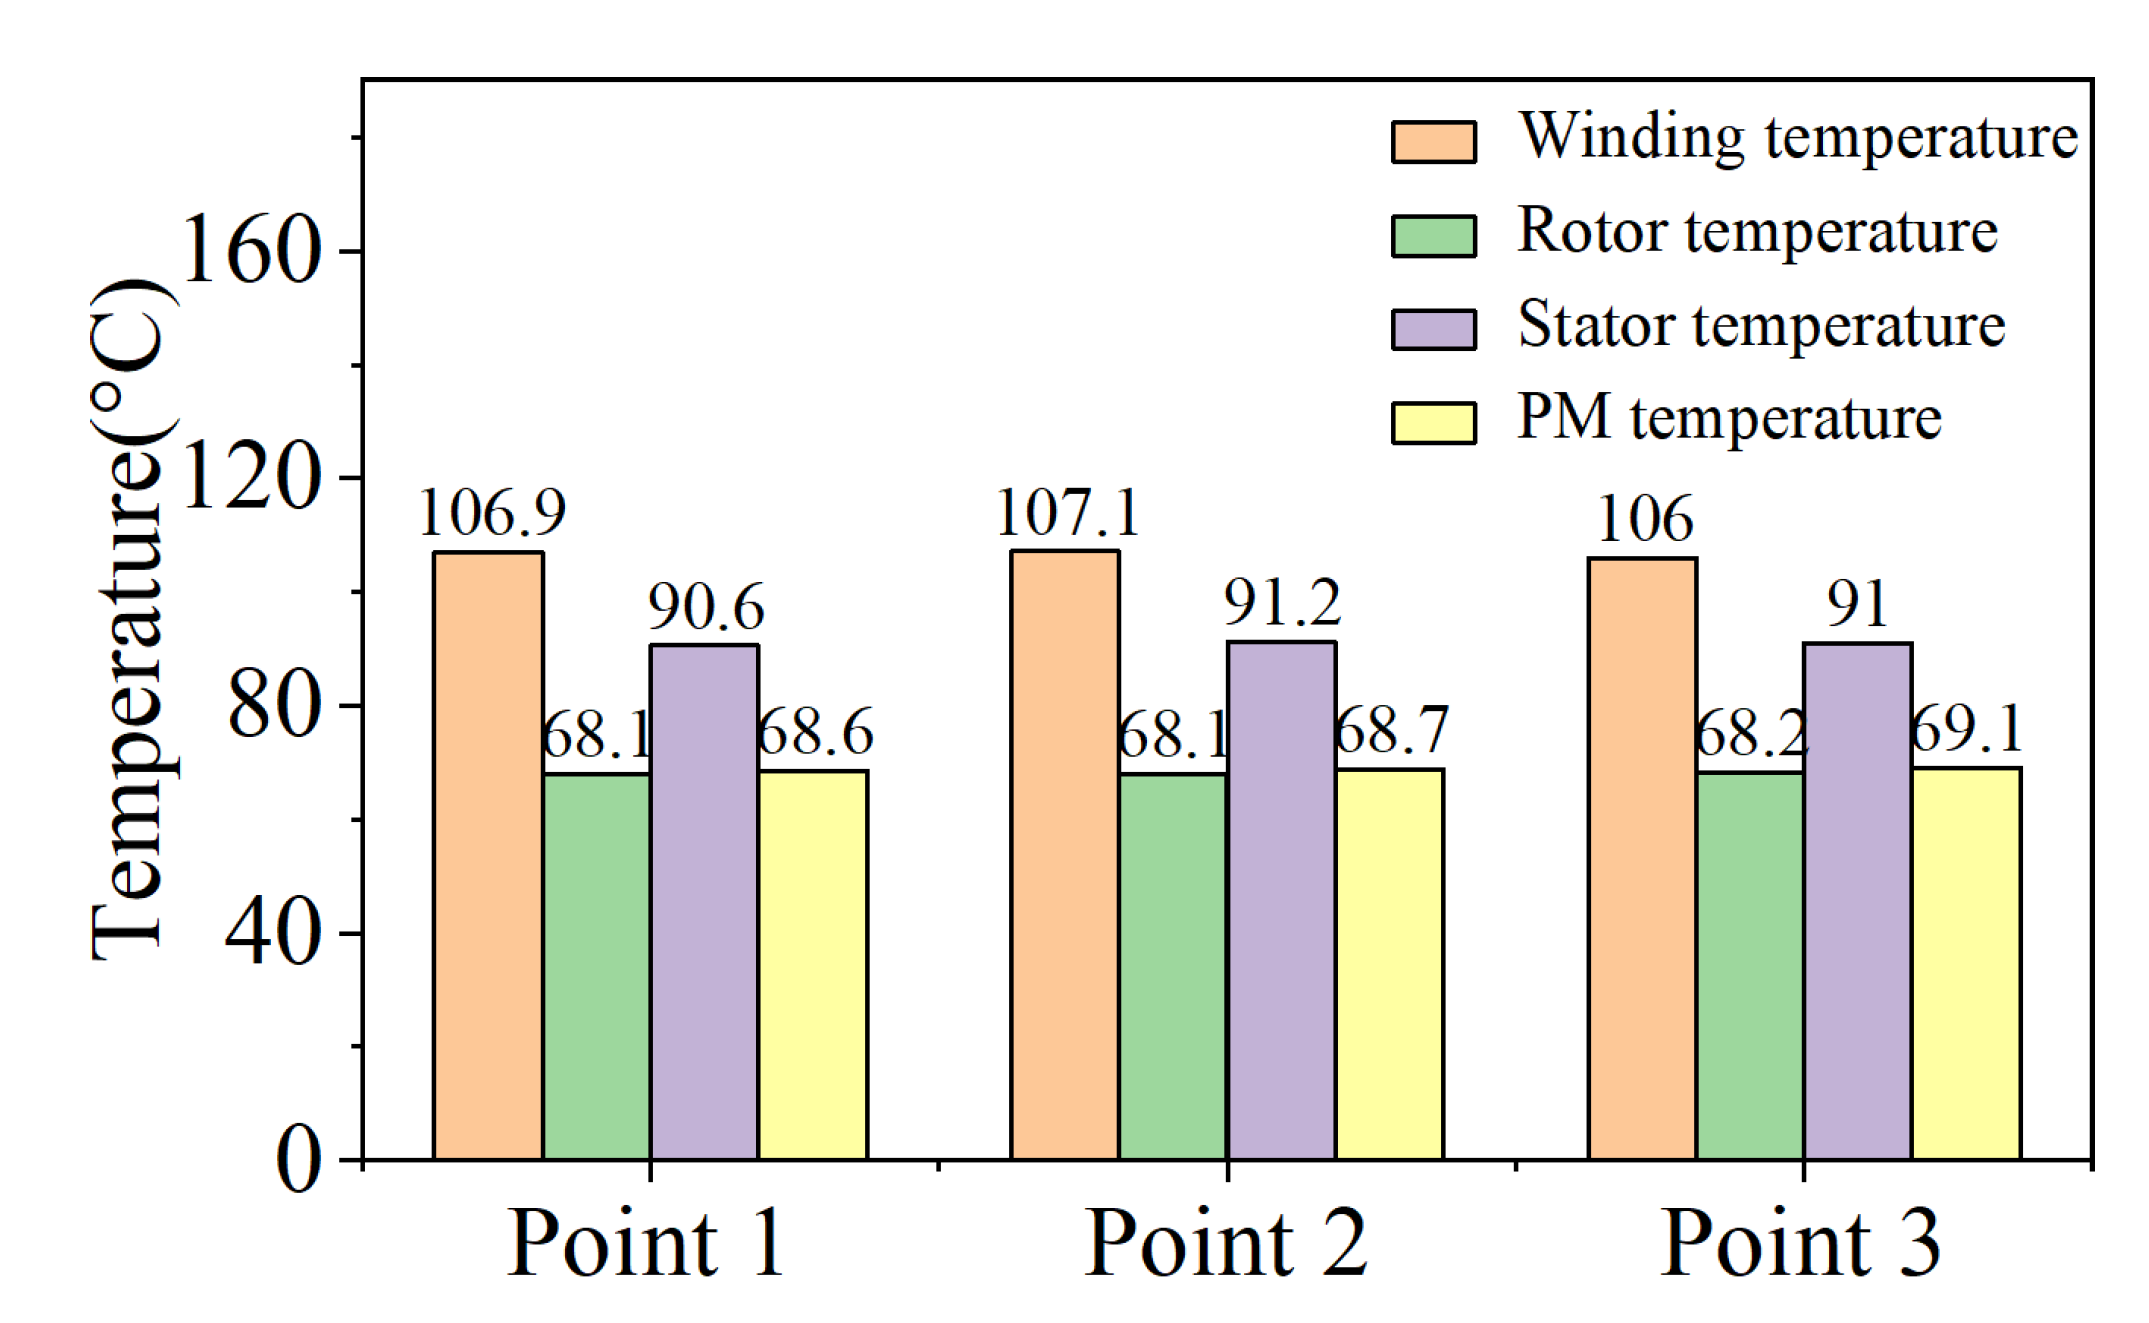
| Parameters | Point 1 | Point 2 | Point 3 | |
|---|---|---|---|---|
| Design parameters | Pole arc coefficient | 0.92 | 0.86 | 0.89 |
| PM thickness (mm) | 13 | 14 | 14 | |
| Stator outer diameter (mm) | 878 | 877 | 877 | |
| Core length (mm) | 922 | 936 | 932 | |
| Conductors per slot | 10 | 10 | 10 | |
| Air gap length (mm) | 2.1 | 2 | 2.3 | |
| Performance | Efficiency (%) | 94.61 | 94.65 | 94.66 |
| Thermal load (A2/mm3) | 158.6 | 156.9 | 157.6 | |
| Power factor | 0.977 | 0.983 | 0.982 | |
| Core loss (W) | 1274.6 | 1258.4 | 1247.6 | |
| Copper loss (W) | 10,684.6 | 10,763 | 10,708.1 | |
| Torque (Nm) | 34,117.1 | 34,118.5 | 34,117.8 | |
| No-load back EMF (V) | 213 | 217.4 | 216.2 | |
| Output power (W) | 200,094 | 200,125 | 200,123 |
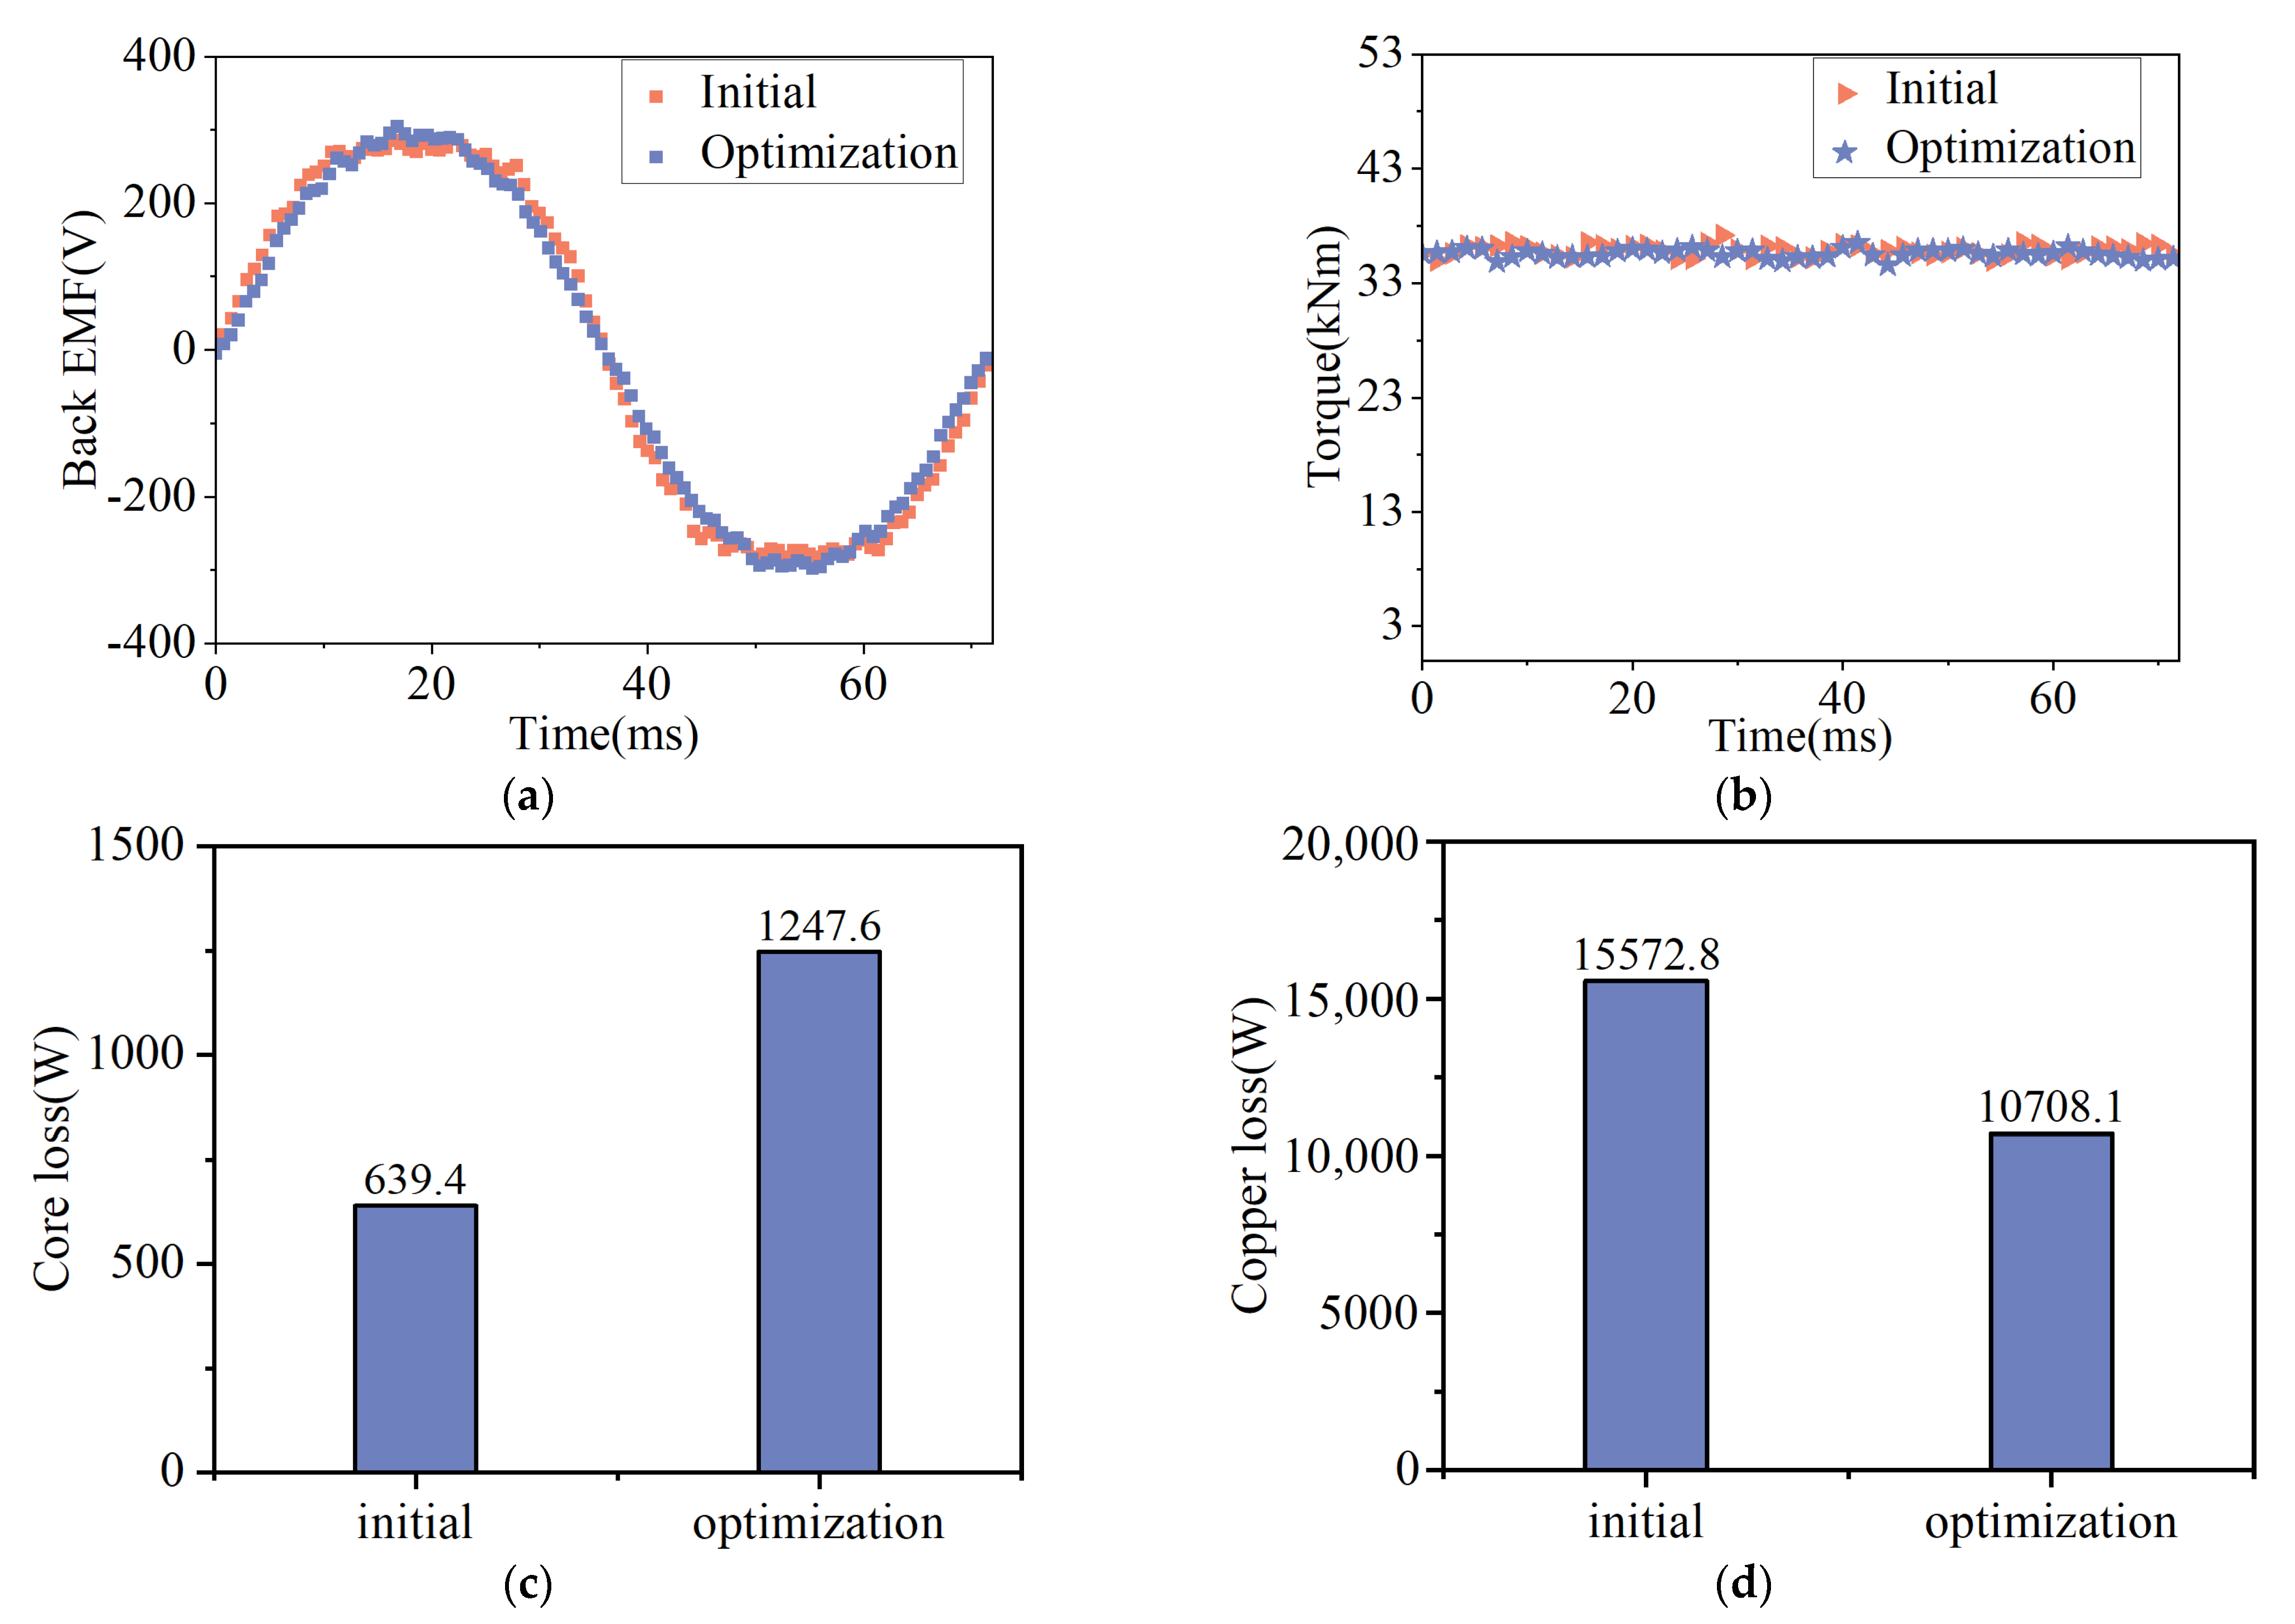
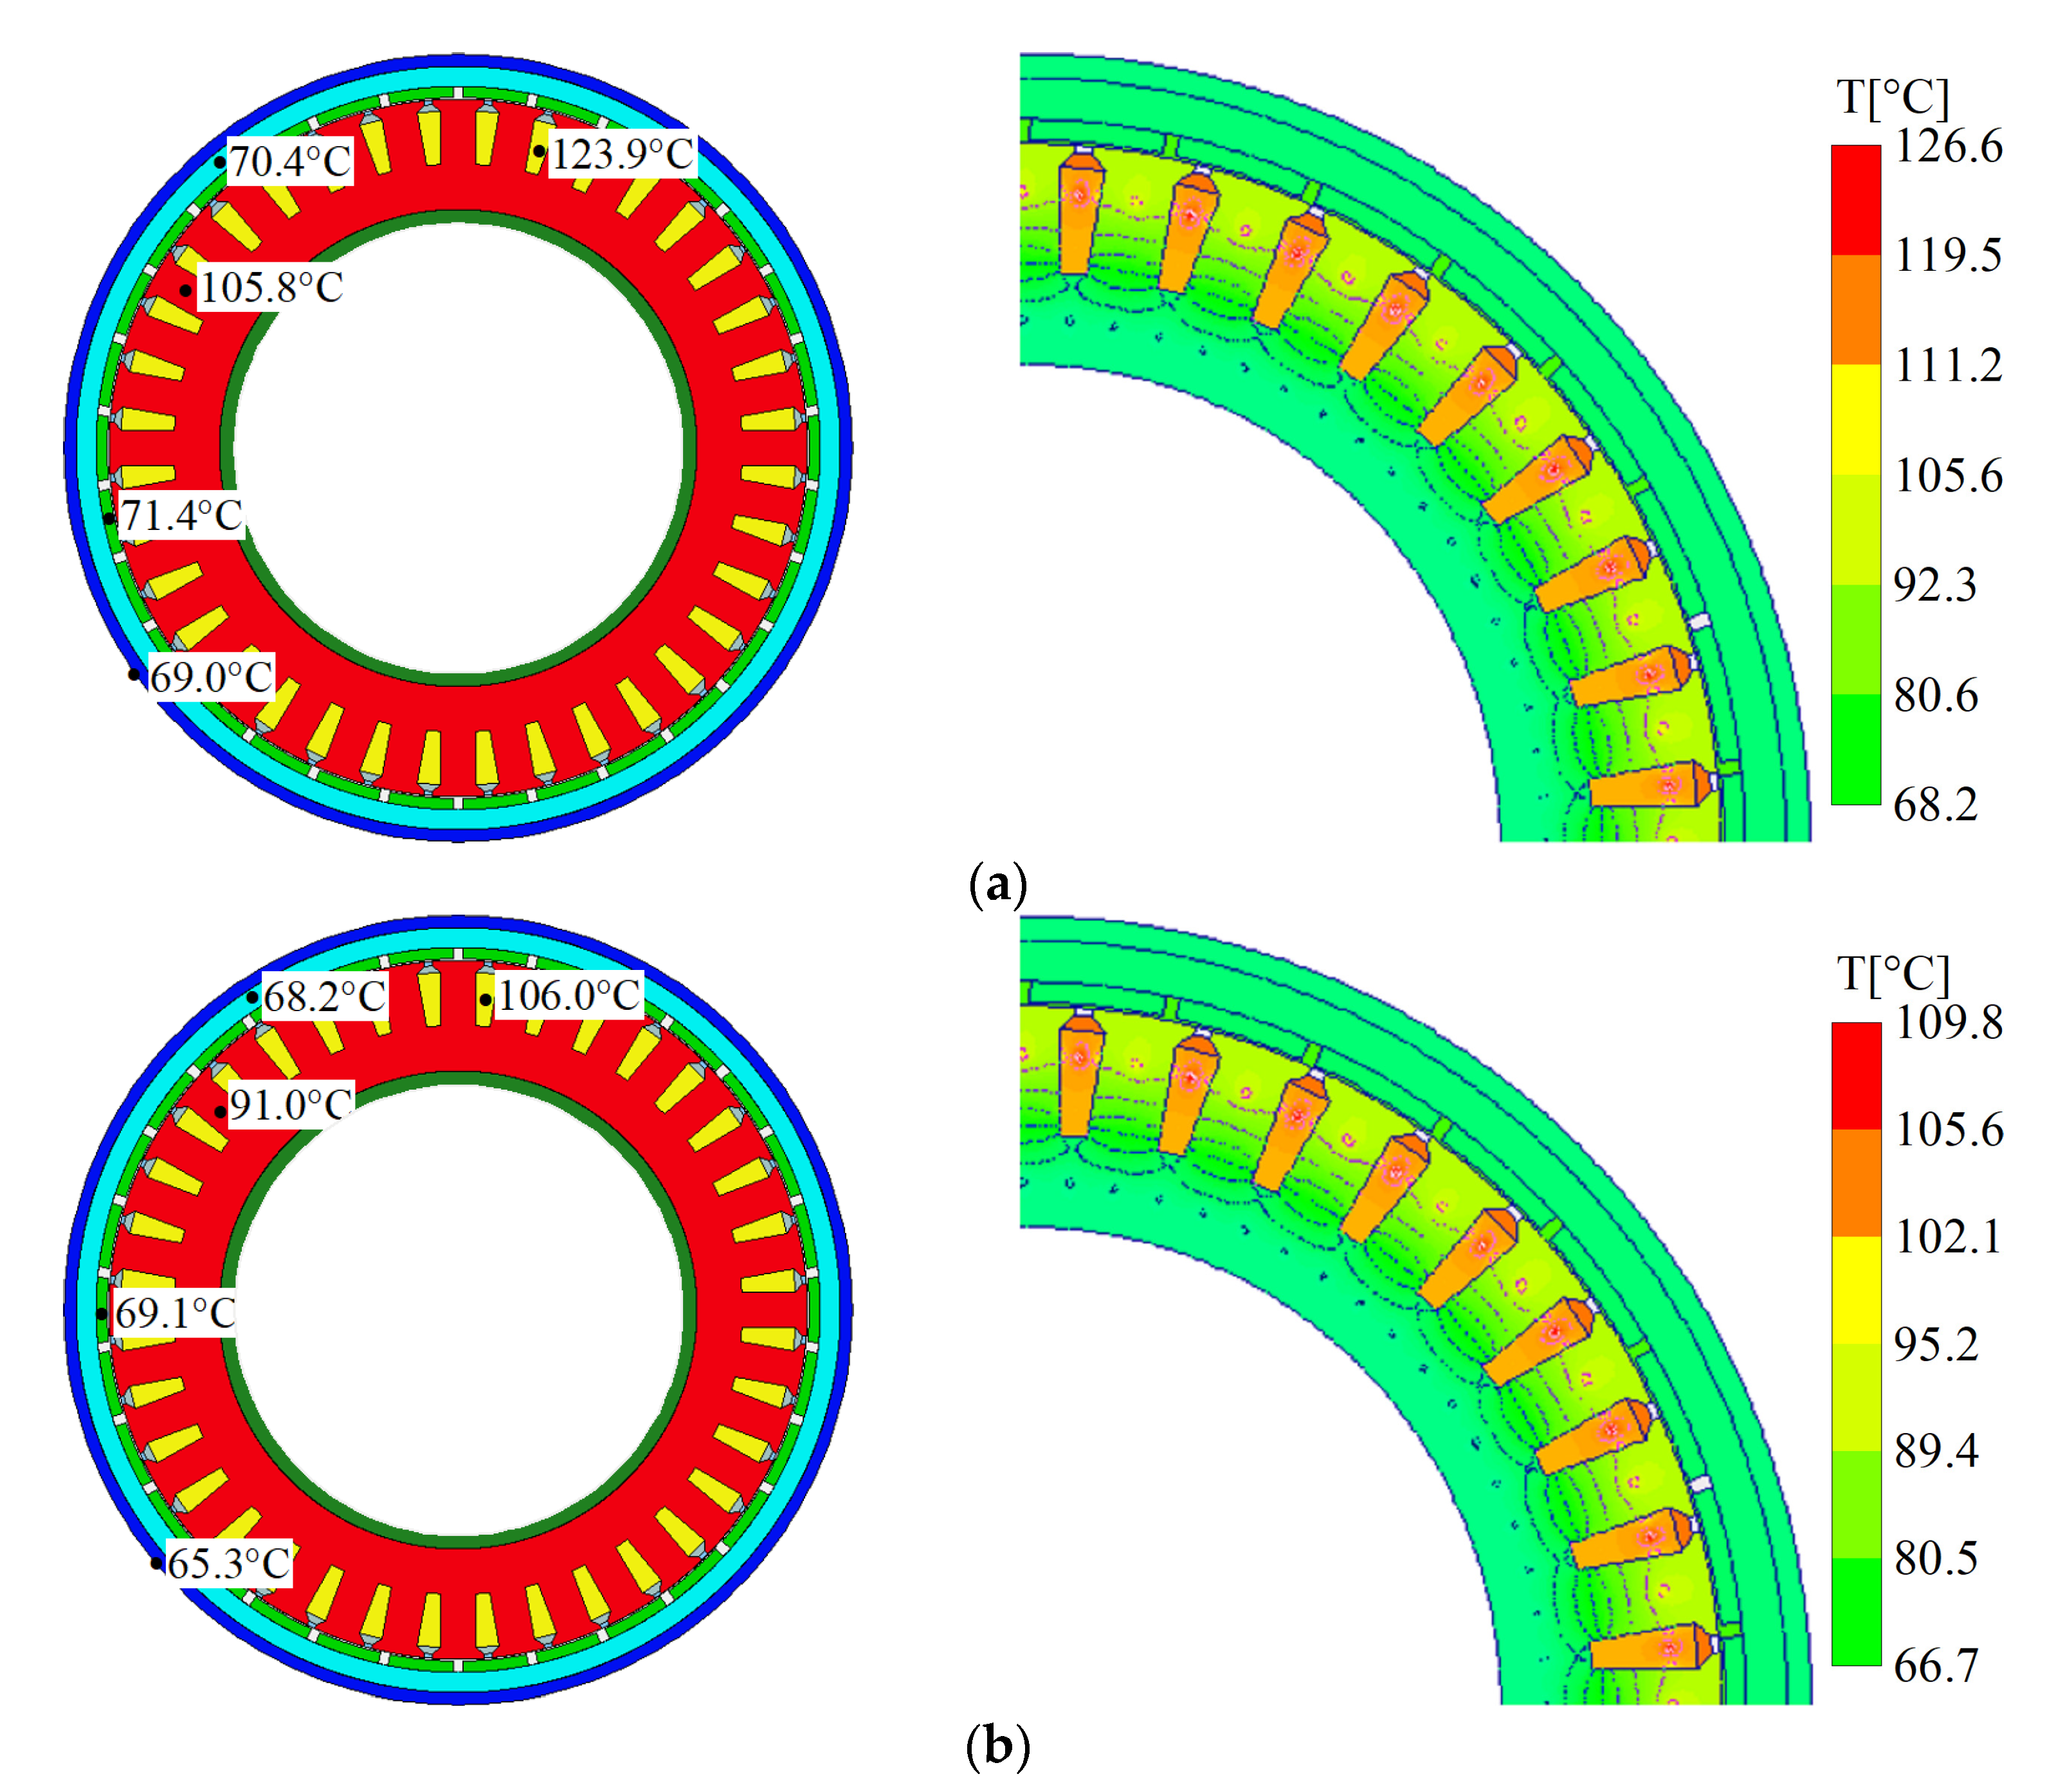
| Parameters | Initial | Optimization |
|---|---|---|
| Pole arc coefficient | 0.7 | 0.89 |
| PM thickness (mm) | 11 | 14 |
| Stator outer diameter (mm) | 863 | 877 |
| Core length (mm) | 930 | 932 |
| Conductors per slot N | 12 | 10 |
| Air gap length (mm) | 3 | 2.3 |
| Parameters | Initial | Optimization |
|---|---|---|
| Efficiency (%) | 92.62 | 94.66 |
| Thermal load () | 233.7 | 157.6 |
| Power factor | 0.910 | 0.982 |
| Core loss (W) | 639.6 | 1247.6 |
| Copper loss (W) | 15,572.8 | 10,708.1 |
| Torque (Nm) | 34,110.7 | 34,117.8 |
| No-load back EMF (V) | 215.2 | 216.2 |
| Current density () | 4.074 | 3.690 |
| Torque ripple (%) | 7.2 | 6.8 |
| Air gap flux density (T) | 0.84 | 0.92 |
| Parameters | Measurement | Calculation |
|---|---|---|
| Power factor | 0.98 | 0.982 |
| Efficiency (%) | 94.2 | 94.66 |
| Winding temperature (°C) | 109 | 106 |
Publisher’s Note: MDPI stays neutral with regard to jurisdictional claims in published maps and institutional affiliations. |
© 2022 by the authors. Licensee MDPI, Basel, Switzerland. This article is an open access article distributed under the terms and conditions of the Creative Commons Attribution (CC BY) license (https://creativecommons.org/licenses/by/4.0/).
Share and Cite
Du, G.; Hu, C.; Zhou, Q.; Gao, W.; Zhang, Q. Multi-Objective Optimization for Outer Rotor Low-Speed Permanent Magnet Motor. Appl. Sci. 2022, 12, 8113. https://doi.org/10.3390/app12168113
Du G, Hu C, Zhou Q, Gao W, Zhang Q. Multi-Objective Optimization for Outer Rotor Low-Speed Permanent Magnet Motor. Applied Sciences. 2022; 12(16):8113. https://doi.org/10.3390/app12168113
Chicago/Turabian StyleDu, Guanghui, Chengshuai Hu, Qixun Zhou, Wentao Gao, and Qizheng Zhang. 2022. "Multi-Objective Optimization for Outer Rotor Low-Speed Permanent Magnet Motor" Applied Sciences 12, no. 16: 8113. https://doi.org/10.3390/app12168113
APA StyleDu, G., Hu, C., Zhou, Q., Gao, W., & Zhang, Q. (2022). Multi-Objective Optimization for Outer Rotor Low-Speed Permanent Magnet Motor. Applied Sciences, 12(16), 8113. https://doi.org/10.3390/app12168113