1. Introduction
Due to the limited space for urban land use, the comprehensive development of urban underground space has become a hotspot in recent years [
1,
2,
3,
4,
5]. In this context, complex foundation pit groups came into being. The “group pit coupling effect” caused by the superposition of the soil stress field and displacement field caused by the cross construction of adjacent foundation pits is more complicated than that of single foundation pits [
6,
7]. When the pit spacing is small, the lateral earth pressure has a greater influence on the envelope structure so it is necessary to study it. At present, the more widely used earth pressure theories are Rankine earth pressure and Coulomb earth pressure, but they are aimed at semi-infinite space and are the basis of earth pressure theory. Nowadays, scholars’ research theories consider either the nonlinear distribution of earth pressure [
8,
9,
10,
11,
12] or the soil arch effect [
13,
14,
15].
For earth pressure of finite soil in foundation pit engineering the exertion mechanism and variation law of earth pressure are not clear due to very few experiments, and the relevant research and discussion are rare and mainly focused on the theoretical aspects [
16,
17,
18,
19]. For example, Gao used the upper limit theory to study the earth pressure in a limited range and analyzed the difference between it and the Rankine soil pressure theory [
20]. Tang et al. derived the analytical solution of active earth pressure through the finite soil calculation model [
21]. Xie et al. proposed a solution that could more accurately predict earth pressure [
22]. However, these studies ignore the effect of displacement on earth pressure and the calculations are mostly limit states. In addition, there are no field measured data for comparison and verification.
In this paper, high-precision optical fibers were adopted to measure the deformation of the on-site envelope structure, and earth pressure cells were equipped to measure the earth pressure during the excavation. Moreover, a simplified calculation formula of earth pressure in finite soil is proposed, which could provide reference for the research of similar projects in the future.
2. Project Overview
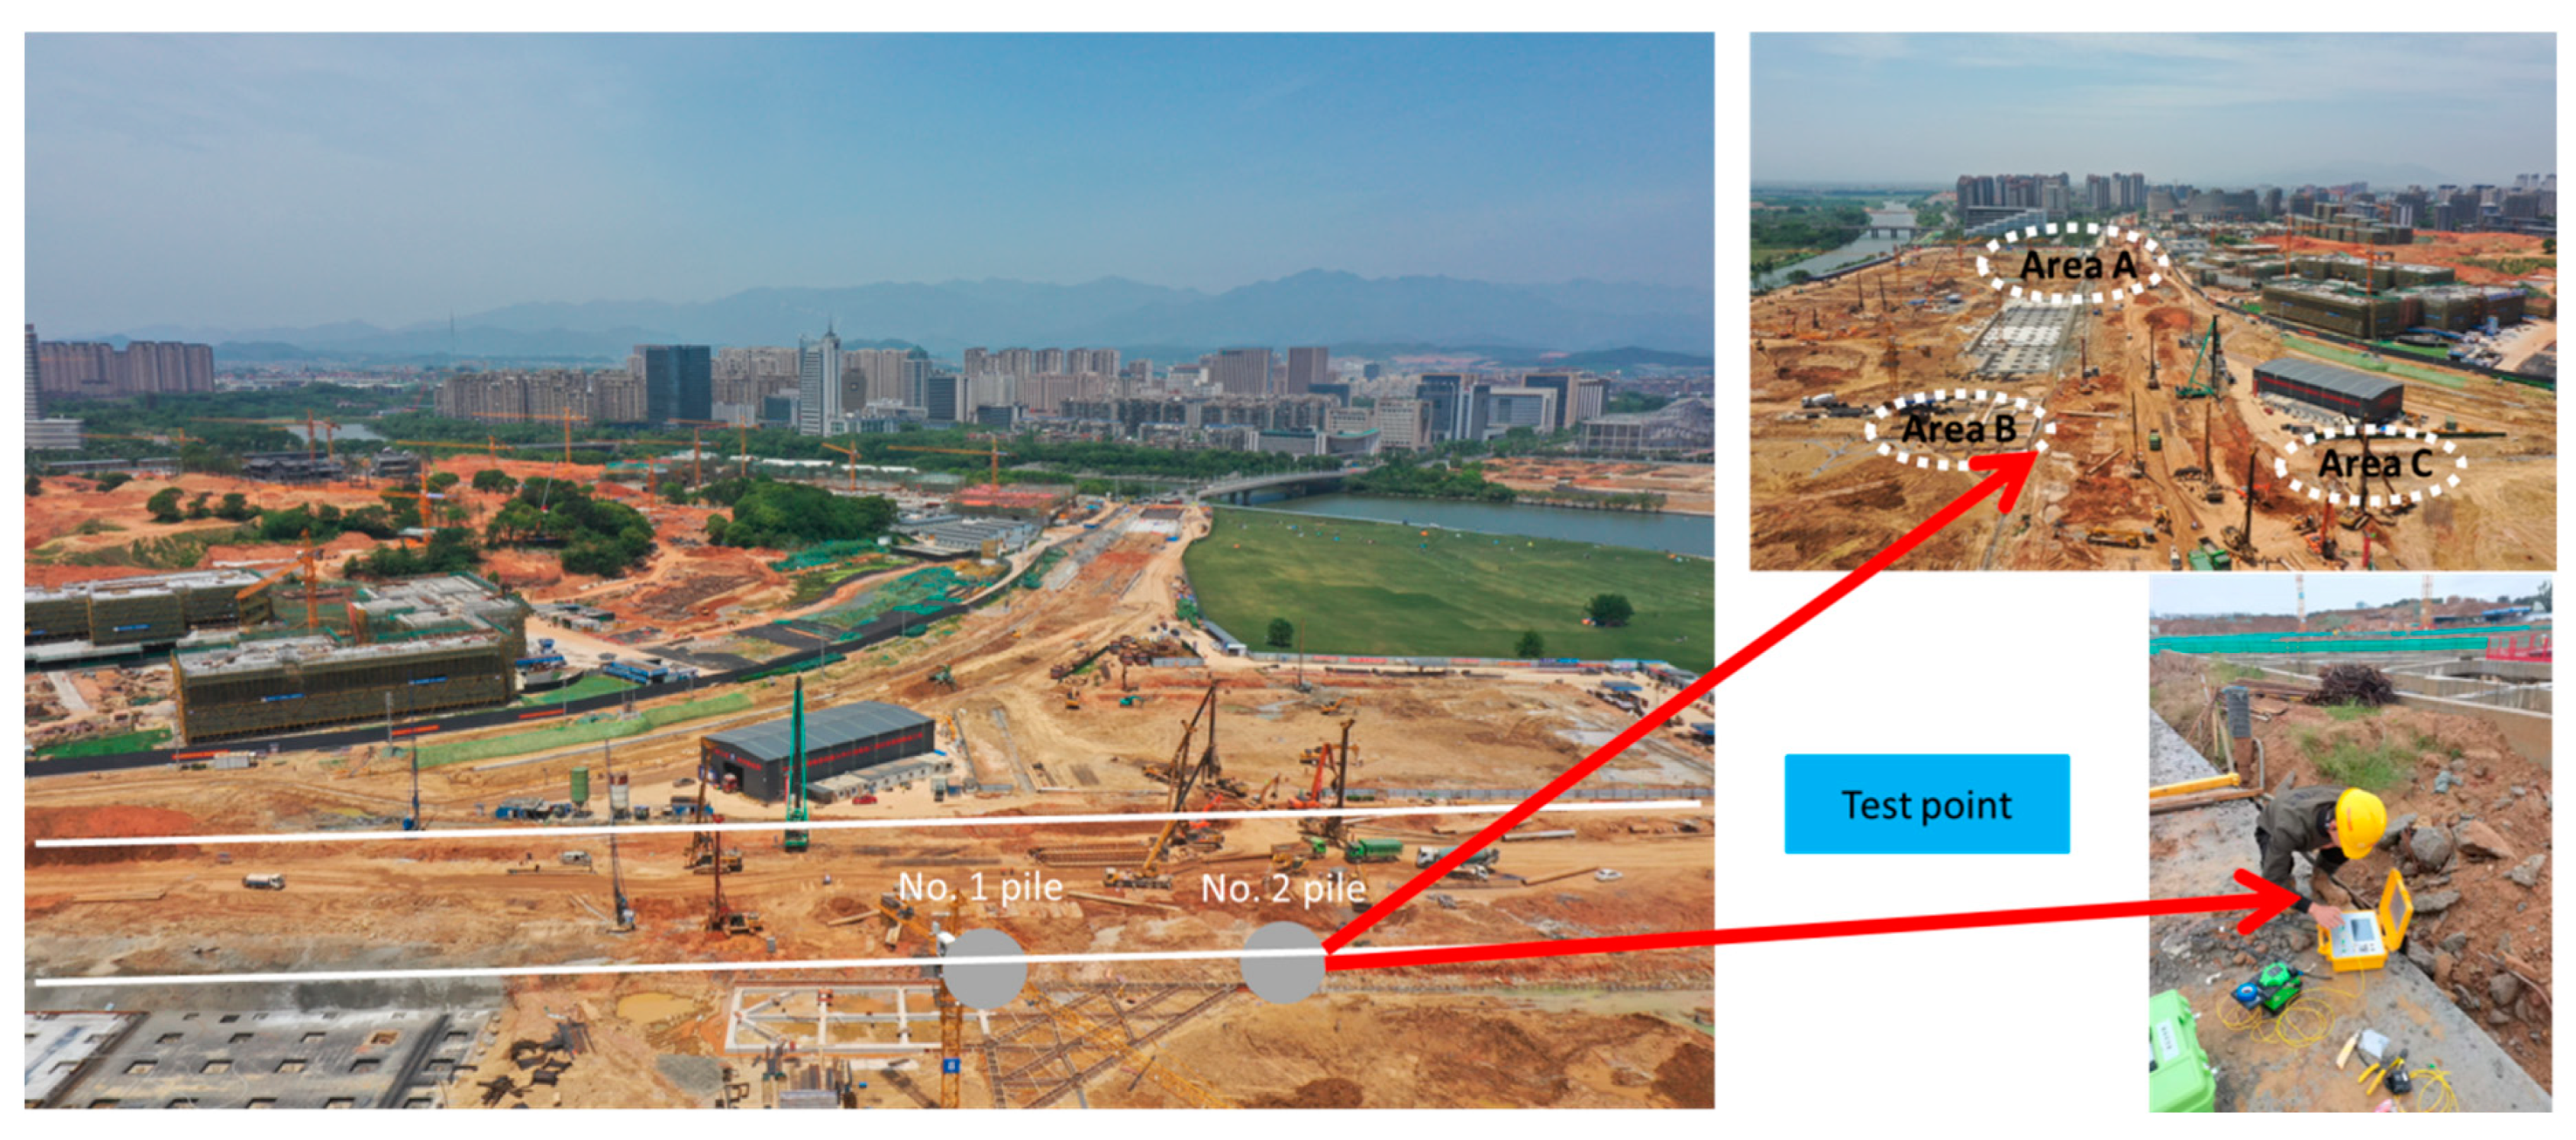
Jiuhua Avenue Tunnel (Phase II) and Ziwei Road Tunnel Project are located in the Peninsula block in the West District of Quzhou City, China. Several large-scale projects are under construction at the same time in the Peninsula block. The three underground garage foundation pits of the Cultural Pioneer Park project (Areas A, B, and C) are adjacent to the Jiuhua Avenue Tunnel (Phase II), as shown in
Figure 1.
The traditional “deep first and shallow” foundation pit excavation construction sequence is more conducive to construction safety and structural quality, but at present, the foundation pit of the surrounding projects will be ahead of the Jiuhua Phase II of this project. During construction, the excavation step of adjacent foundation pits “shallow first and then deep” has higher requirements on the control of deformation. Additionally, the minimum clearance between the Area B and the Jiuhua Avenue Tunnel (Phase II) is only 4.7 m.
Therefore, in this project, the deformation of the envelope structure is tested by burying optical fibers in the test piles. The three test piles are JZ905, JY843, and JY919, respectively. The pile lengths are 19.1 m, 19.8 m, and 19.1 m, and the pile diameters are 0.8 m, 0.8 m, and 1 m, respectively. For JZ905: the original ground elevation is 67.2 m, the crown beam elevation is 64.6 m, the first steel support is 60.3 m, the second steel support is 57.1 m, and the base plate is 52.6 m. For JY843: the original ground elevation is 66.7 m, the crown beam elevation is 65.3 m, the first steel support is 60.3 m, the second steel support is 57.6 m, and the base plate is 52.8 m. For JY919: the original ground elevation is 67.2 m, the crown beam elevation is 64.6 m, the first steel support is 60.3 m, the second steel support is 57.1 m, and the base plate is 52.6 m.
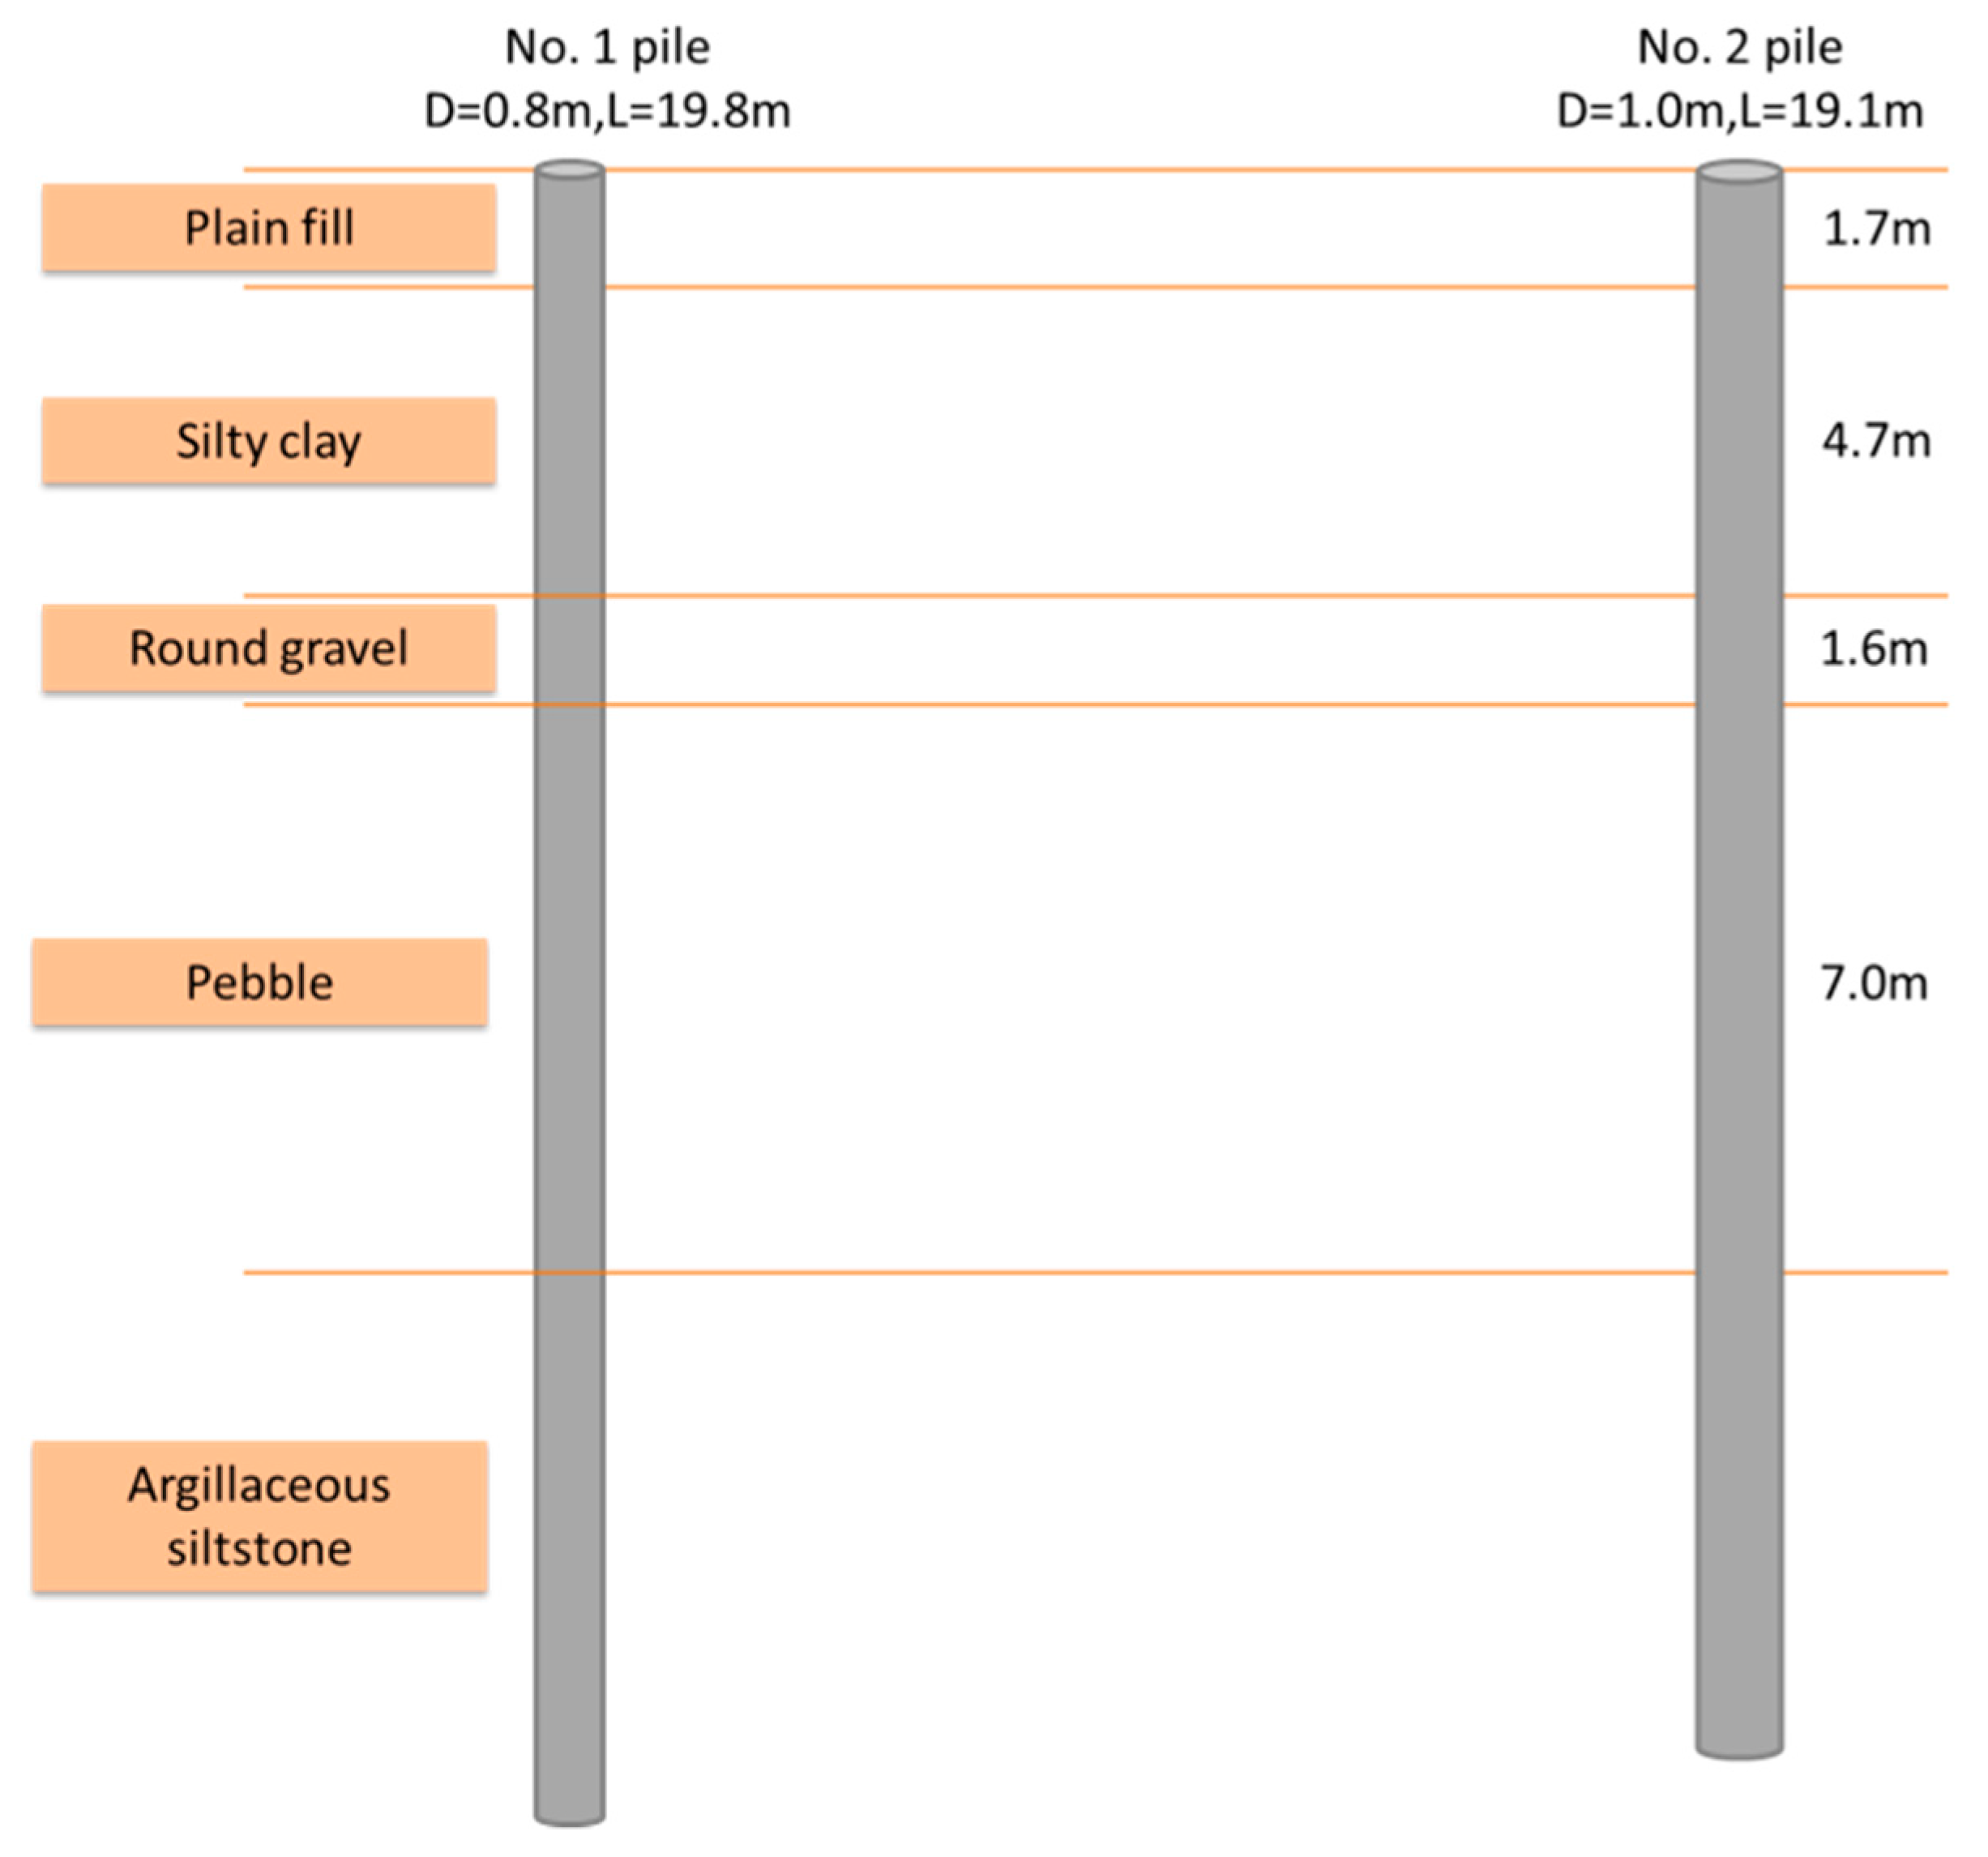
Since the optical fiber of the test pile JZ905 was damaged during the test, only the deformation of JY843 (No. 1 pile) and JY919 (No. 2 pile) and the corresponding earth pressure were tested and analyzed (
Figure 2). The buried depths of the earth pressure cells at each measuring point were 3 m, 6 m, 9 m, 12 m, and 15 m; they are mainly located in the silty clay layer and pebble layer, and their static earth pressure coefficients are 0.5, 0.5, 0.3, 0.3 and 0.3, respectively. The soil parameters are shown in
Table 1.
3. Field Test
3.1. Deformation
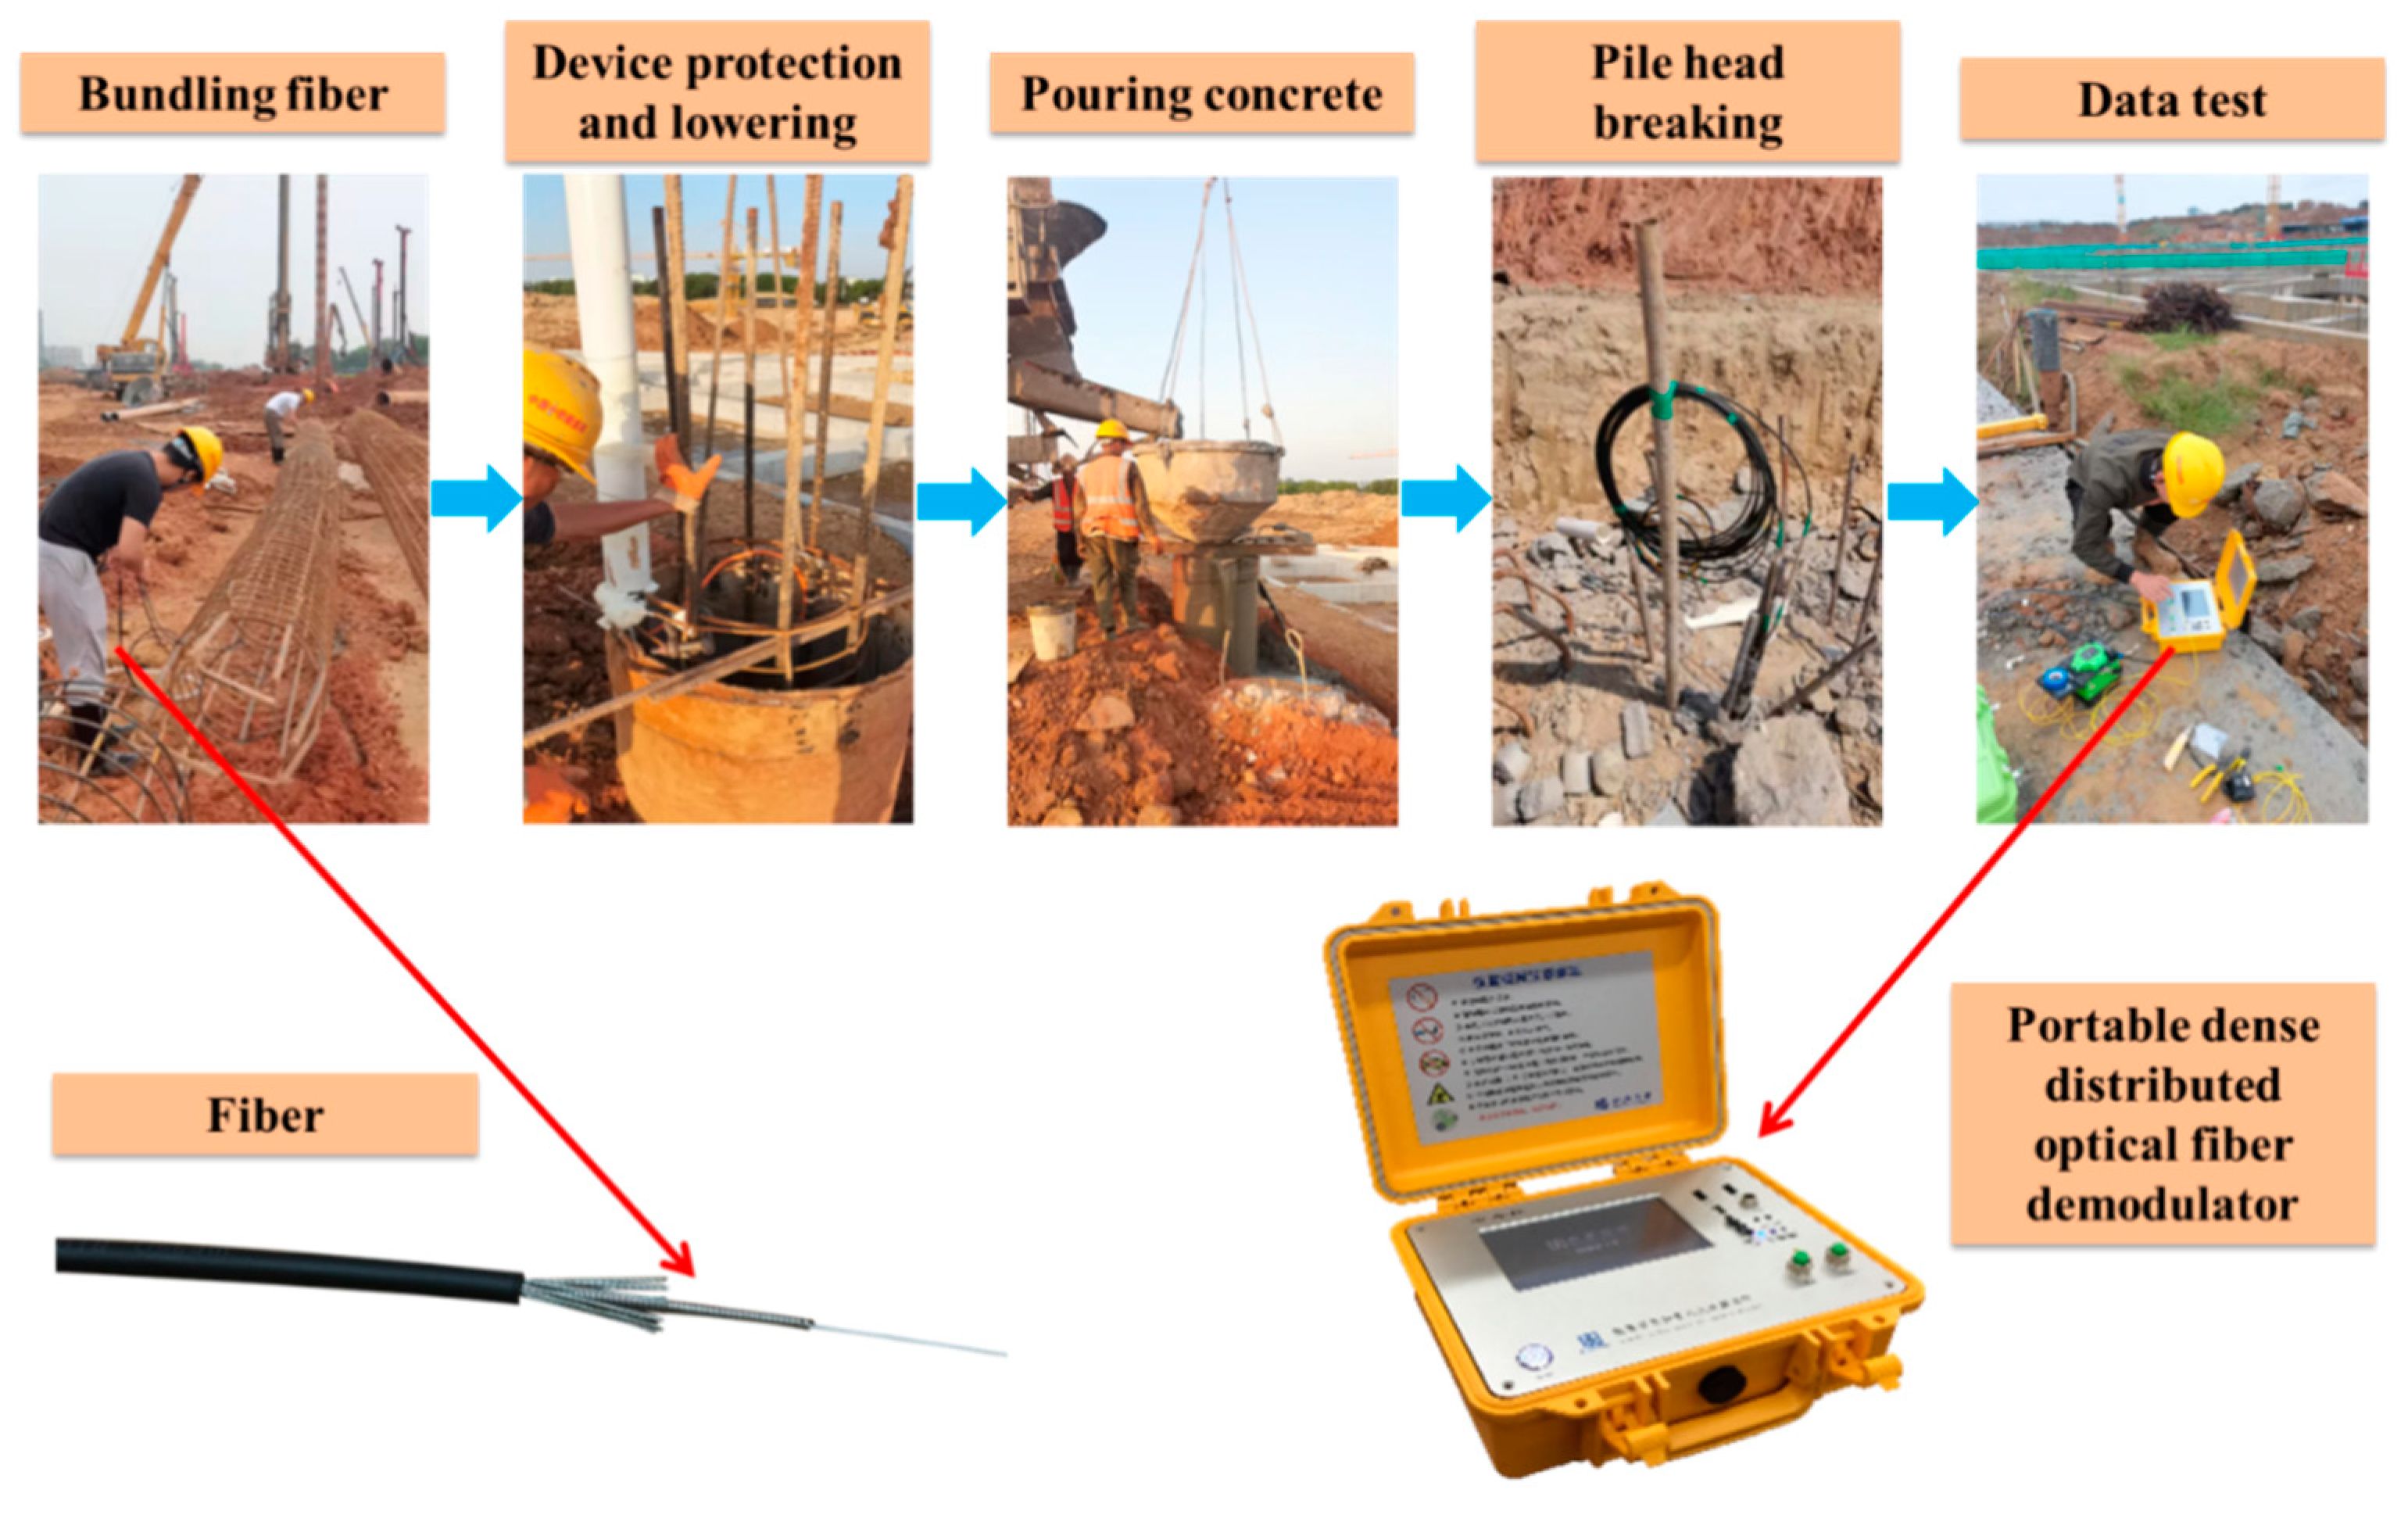
In the deformation test of the foundation pit, the inclinometer tube is usually used. This test will use high-precision optical fibers to test the deformation, and the optical fibers are NZS-DDS-C03 optical fibers, with core diameter of 0.9 mm. It can be used to test the deformation of the foundation pit support structure, tunnel lining structure and concrete cracking deformation [
23,
24]. It is easy to install and can be directly buried in the concrete structure. The main steps are shown in
Figure 3 and as follows:
Step 1: First, bind the optical fiber on the steel cage, and bind the optical fiber back and forth along the steel bar on the side of the steel cage, and the data end of the fiber is led out from the side of the steel cage.
Step 2: Put the inner protective sleeve on the outside of the outgoing optical fiber data end and fix it on the steel cage by electric welding to protect the fiber from being damaged during the lowering of the steel cage. The inner protective sleeve is a steel pipe. The diameter is 10 cm and the length is 1 m.
Step 3: Add a PVC outer protective sleeve to the inner protective sleeve to further protect the optical fiber and add a top cover to the end of the outer protective sleeve to form a closed space. The role of the top cover and the inner and outer protective sleeves is to prevent the interior from being filled when the concrete is poured and the optical fiber from being damaged when the pile head is broken.
Step 4: Drill holes on the limited soil strip, lower the deformation testing device, pour concrete, and remove the pile head after the concrete is solidified.
Step 5: Remove the PVC casing, connect it with the optical fiber with a jumper, input the optical signal, use the portable dense distributed optical fiber demodulator (NZS-DDS-A03) to measure the optical fiber transmission wavelength, and calculate the deformation and displacement of the finite soil strip accordingly.
3.2. Earth Pressure
In the testing, earth pressure cells are often embedded in the facing surface. The earth pressure cell used in this test is CD3030 (
Figure 1), and the connecting sleeve is made of PVC pipe. The main steps are shown in
Figure 4 and as follows:
Step 1: First, drill holes in the soil layer and use mud to protect the wall. The borehole diameter is slightly larger than the earth pressure cell, which is convenient for the lowering the earth pressure cell burying device.
Step 2: Use the link casing to connect the earth pressure cell burying device, and the angle between the two can be adjusted according to the actual needs. The specific method of docking and adjusting the angle is as follows: insert the link casing into the fixed pipe of the earth pressure cell burying device, adjust it to a suitable angle, and drill holes on the fixed pipe with a pistol drill so that the holes pass through the pipe and the link casing. Then use screws and nuts to fix the fixing tube and the link sleeve.
Step 3: Connect a section of the earth pressure cell burying device and lower a section until all the earth pressure cells are buried.
Step 4: Slowly inject low-strength micro-expansion grouting material (the amount depends on the hole diameter and hole depth required for the test) into the borehole where the earth pressure cell burying device is embedded, until the grouting material fills the borehole to the surface.
Step 5: Let it stand, and after the consolidation of the low-strength micro-expansion grouting material is completed carry out an earth pressure test.
4. Theoretical Model
The relationship between displacement and earth pressure is in accordance with hyperbolic curves in the small deformation stage, as shown in Equation (1) [
25]:
where
is the coefficient of static earth pressure;
is the vertical pressure;
is the weight of soil;
is the burial depth of soil;
is the earth pressure without deformation;
is the earth pressure;
is the horizontal displacement of the enclosure structure;
and
are the undetermined coefficient.
It can be obtained from Equation (1), when
, there are:
where
is the soil pressure at the limit state.
Since the lateral displacement of the soil cannot be infinite, it will become the active earth pressure state after reaching a certain value, so the parameters
are:
The radial stress and radial strain have the following hyperbolic relationship:
where
is the initial radial pressure;
is the radial pressure;
is the active earth pressure;
is the radial strain.
and
are the test coefficients, where:
where
is the initial tangential elastic modulus of the initial soil in the test under the condition of lateral unloading.
Caspe divides the fill behind the enclosure into partitions by analyzing the soil deformation state [
26], as shown in
Figure 5. The horizontal strain in the plastic equilibrium zone is equal, and the horizontal strain in the elastic equilibrium zone decreases linearly with the increase in
, namely:
where
is the distance between the soil mass and the enclosure;
is the height of enclosure structure;
is the width of finite soil;
;
is the friction angle in the soil behind the enclosure.
If , then it constitutes a limited soil. That is, the soil width is less than this value. For limited soil to meet the deformation control requirements under normal working conditions, the lateral displacement of the enclosure structure is very small, which is far less than the displacement required to reach the active state so it is difficult to form the ultimate earth pressure mode. At this time, the earth pressure on the enclosure structure should be between the static earth pressure and the active earth pressure, which forms the so-called quasi active earth pressure.
Based on the boundary conditions, the lateral displacement of the existing building is 0, and the relationship between the lateral deformation and strain is obtained:
where
is the height of the rectangular soil divided by the limit state of the finite soil behind the wall. Substitute Equation (7) into Equation (4) and compare it with Equation (1) to obtain the expression for the parameter
:
Substitute Equations (8) and (3) into Equation (1) to obtain the formula for the non-limit state earth pressure of finite soil:
Since the field test is limited soil, the active earth pressure in this formula will be too large if the Rankine active earth pressure is used, so the upper limit solution of the active earth pressure proposed by Gao will be introduced for calculation [
20].
where
is the active earth pressure coefficient,
;
is the cohesion.
where
is the width of finite soil;
is the height of enclosure structure;
is the friction angle of soil.
Take when
The Rankine active earth pressure intensity is:
If the ratio of the upper limit solution of the active earth pressure to the Rankine active earth pressure is defined as the influence coefficient of active earth pressure of finite soil:
where
is the influence coefficient of active earth pressure of finite soil.
Then the active earth pressure of finite soil can be simplified as:
where
is the active earth pressure of finite soil.
Substitute Equation (14) into Equation (9) to obtain a new formula for the non-limit state earth pressure of finite soil:
5. Test Results
5.1. Displacement
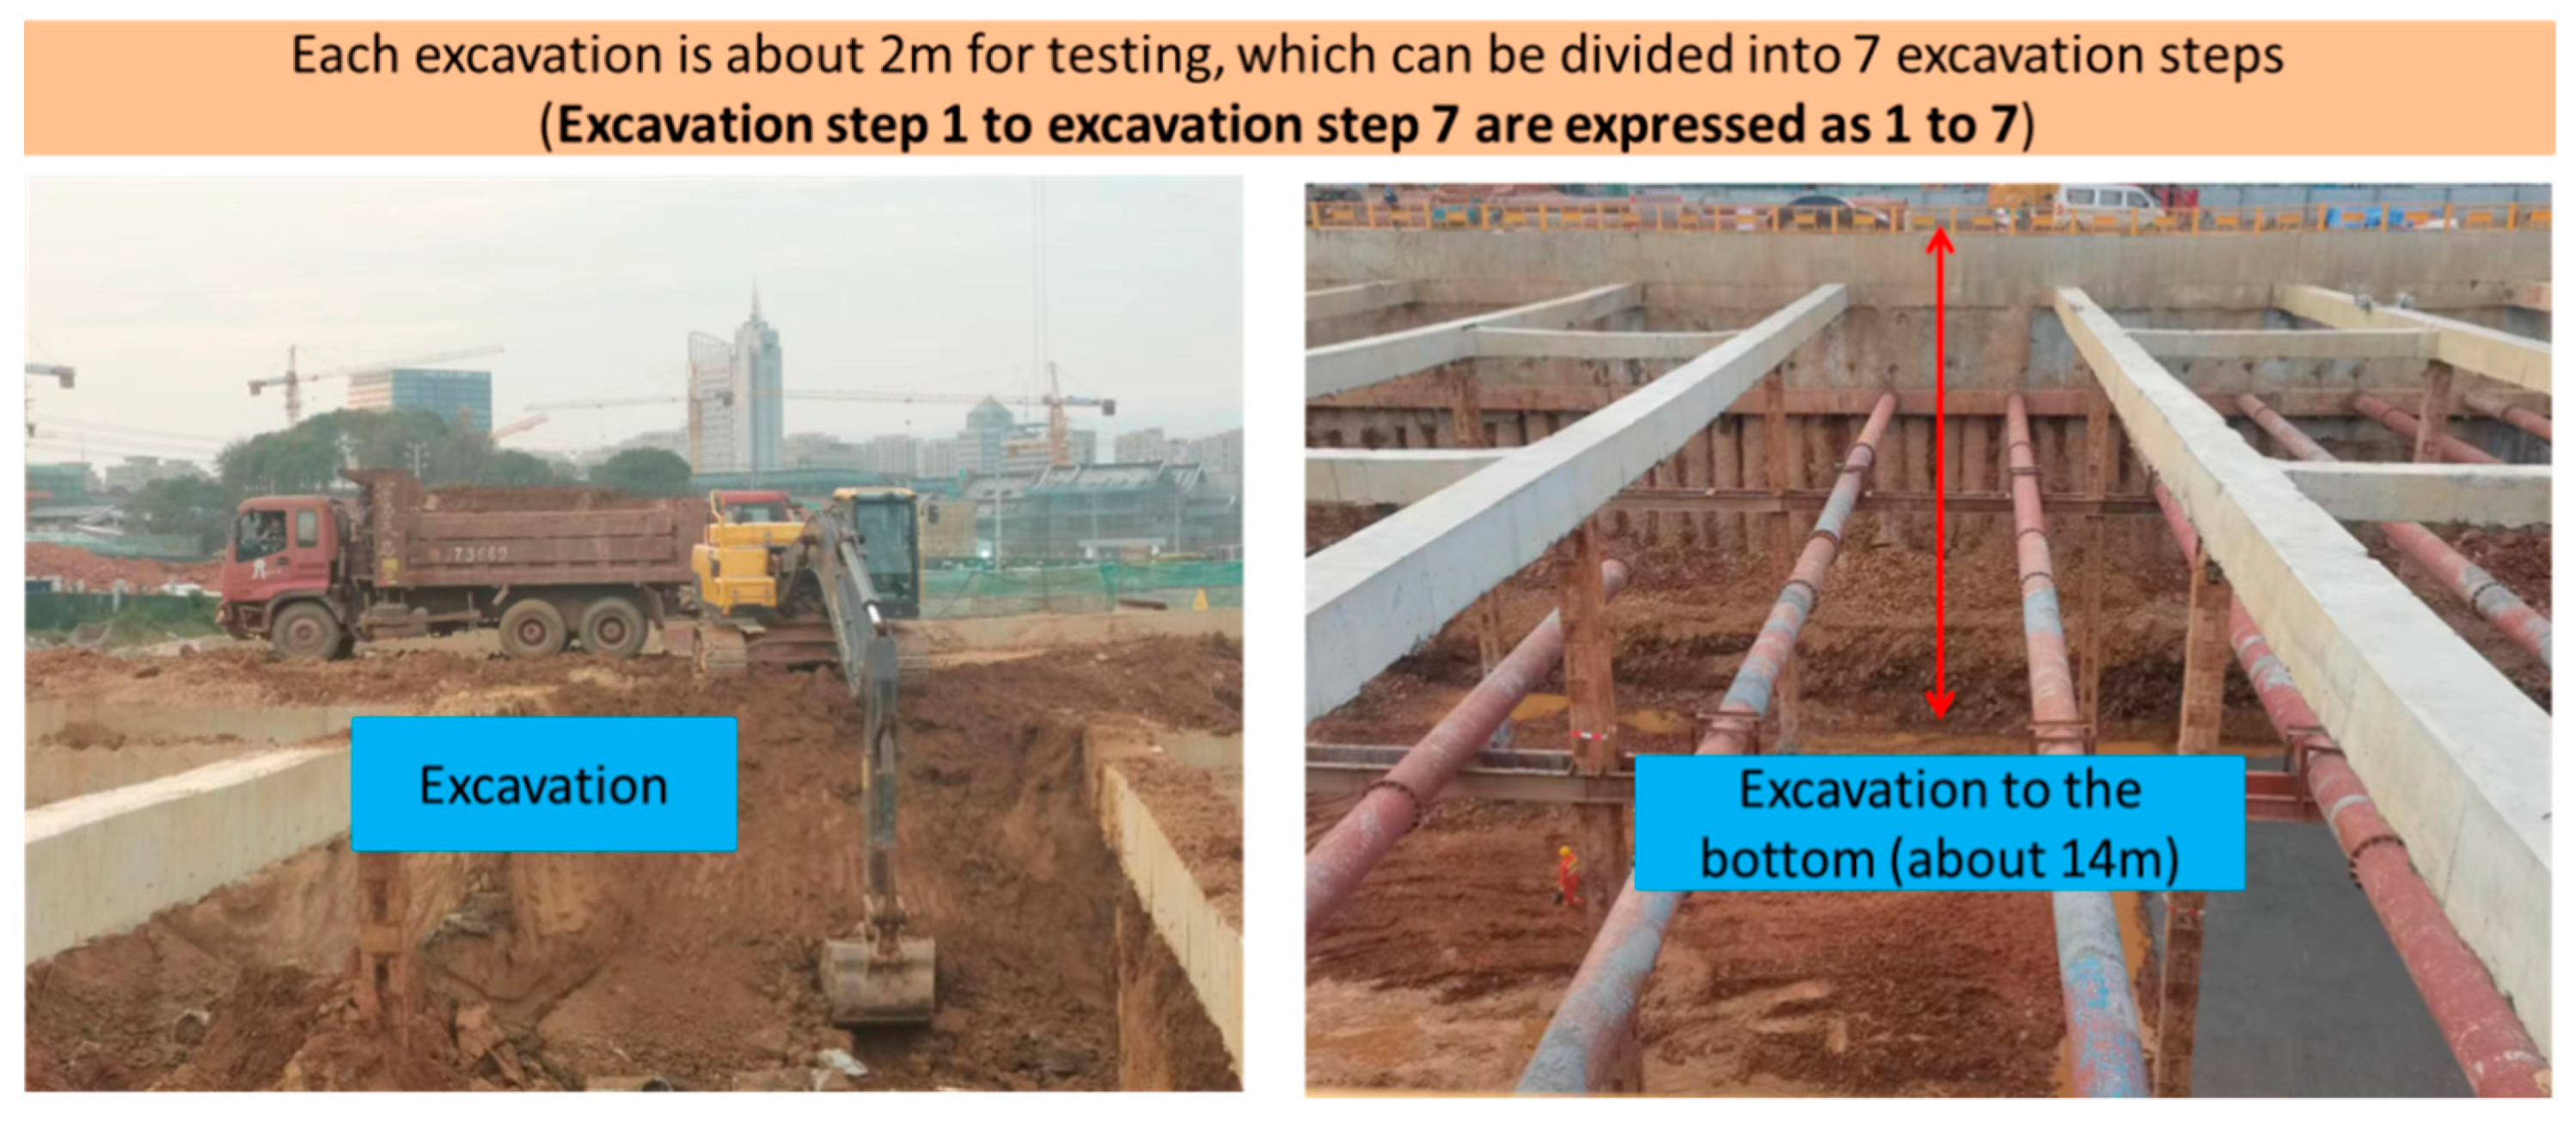
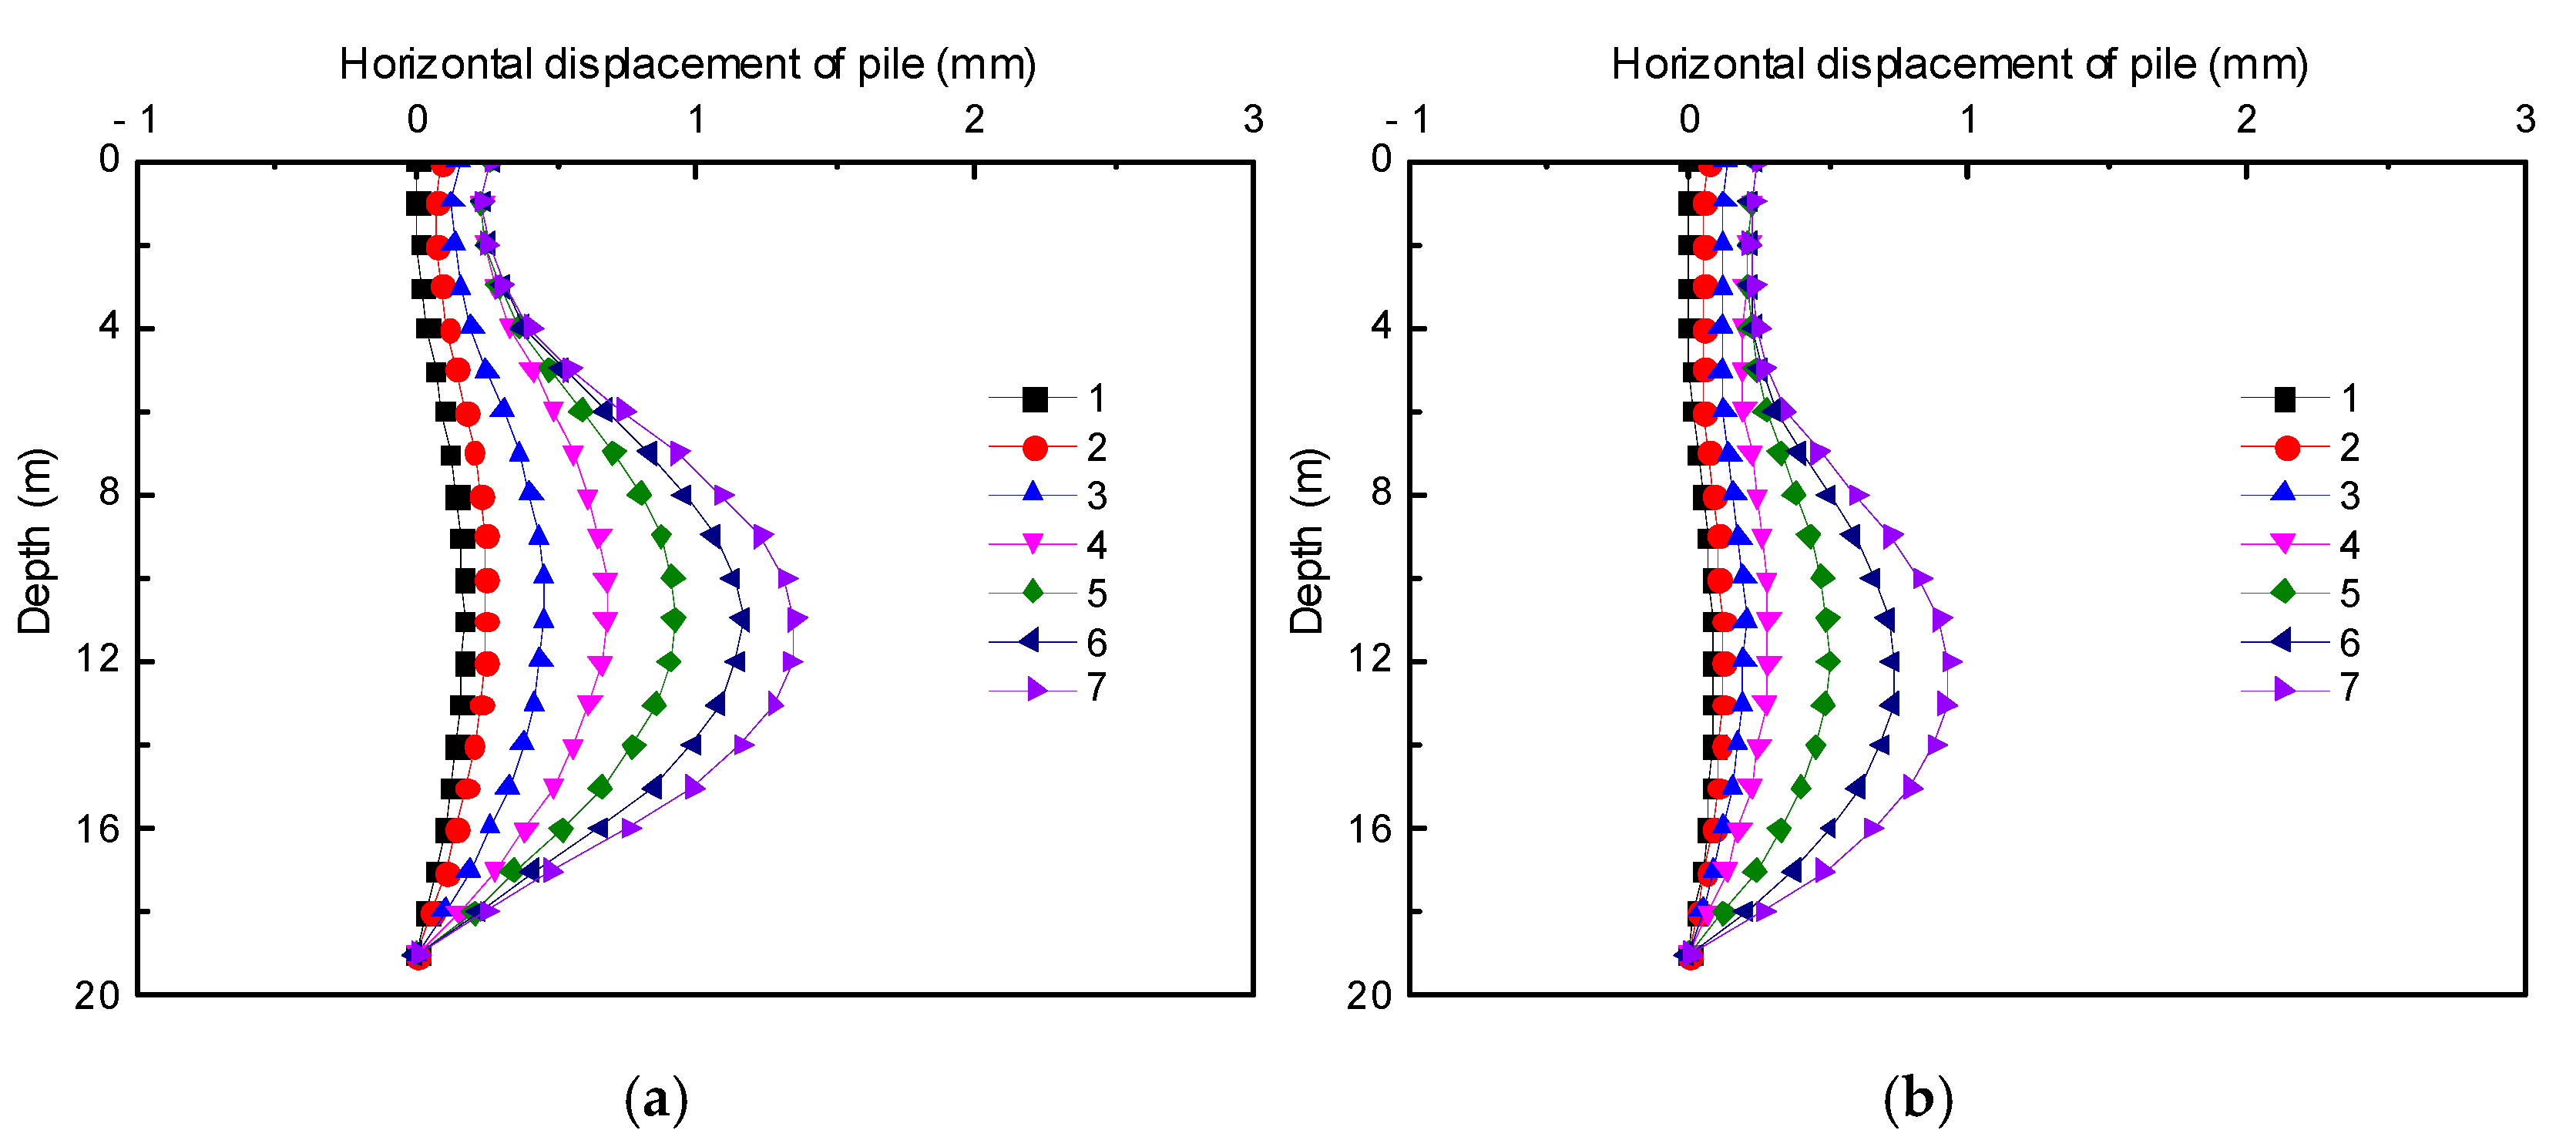
According to the test schedule, the excavation steps are divided into seven and the depth of each step is about 2 m, as shown in
Figure 6. The displacement of the pile is shown in
Figure 7. The displacement is positive as the pile moves into the pit, and the reverse is negative. In
Figure 7a, there is a phenomenon: when the excavation depth increases, the displacement of the pile increases. The maximum displacement of the pile in excavation step 7 is 1.35 mm, the maximum displacement of the pile in excavation step 1 is 0.17 mm, and the difference between the two is 1.18 mm. The change trend in
Figure 7b is consistent with that in
Figure 7a, except that the overall displacement of the pile is smaller than that in
Figure 7a. The maximum displacement in the excavation step 7 is 0.93 mm, and the maximum displacement in the excavation step 1 is 0.09 mm, the difference between the two is 0.84 mm.
5.2. Earth Pressure
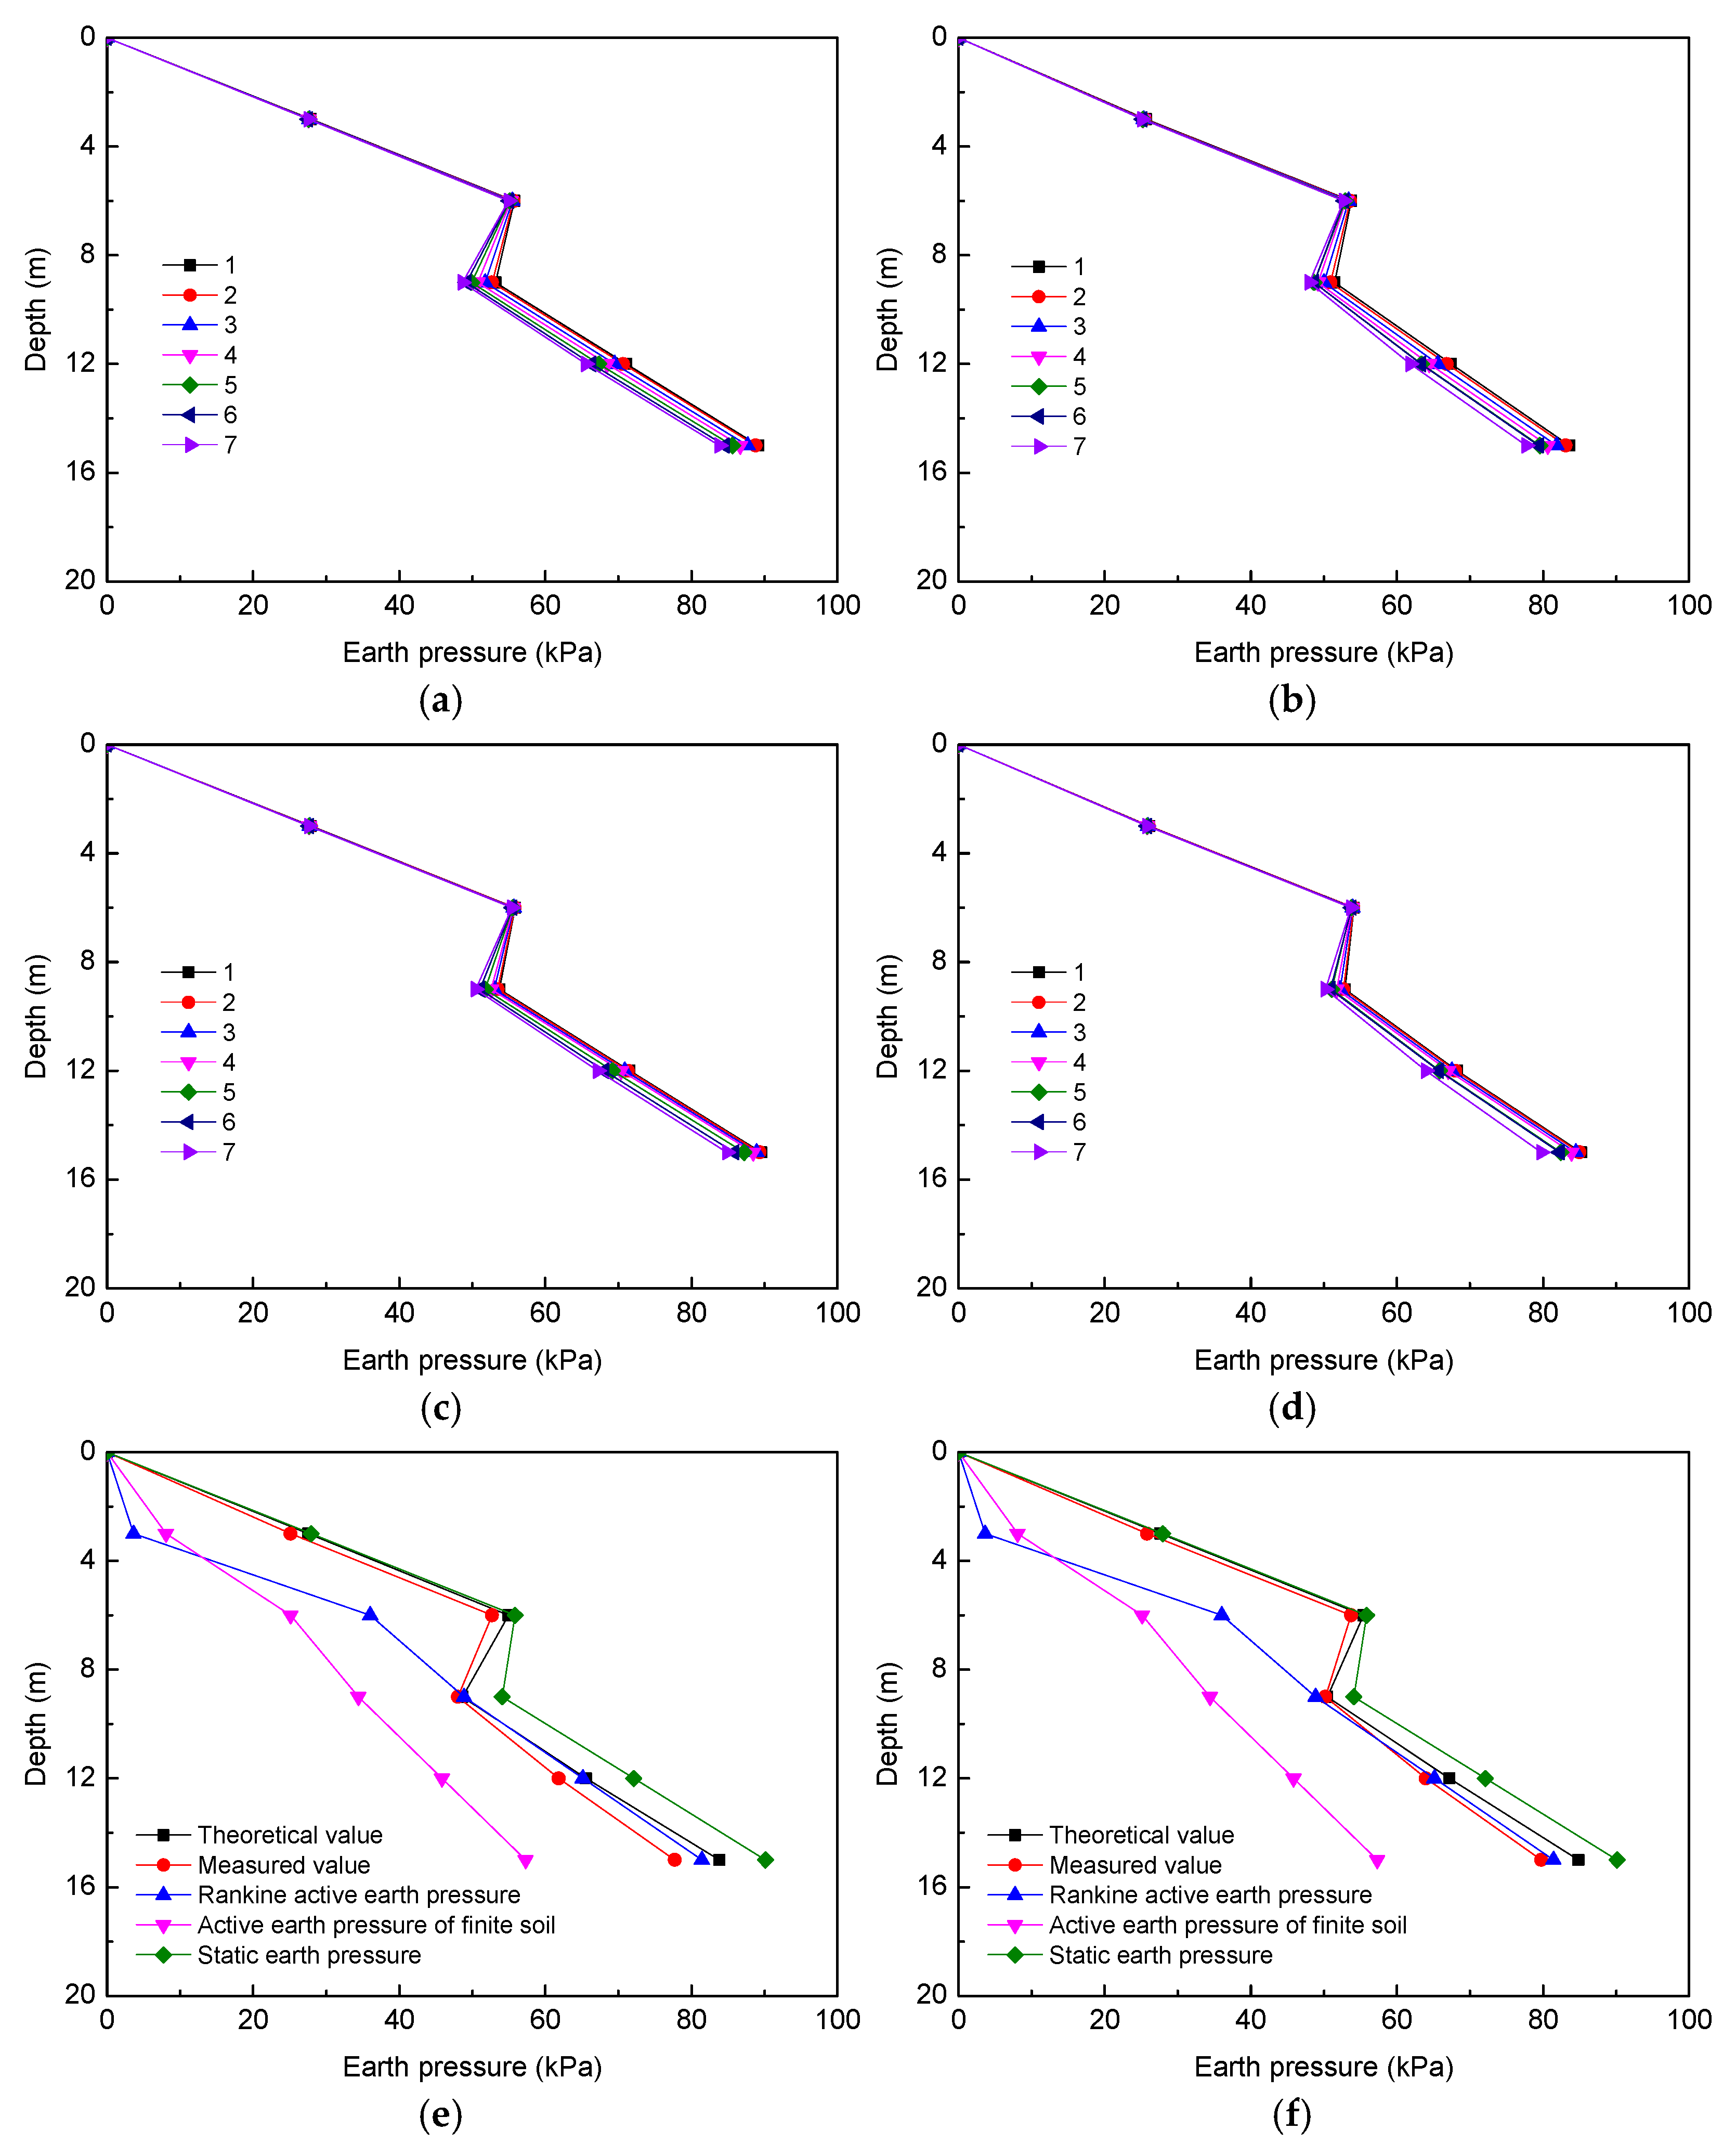
The theoretical and measured values of the earth pressure behind the pile under different excavation steps are shown in
Figure 8. It can be seen that with the increase in the excavation depth, the earth pressure in the foundation pit soil basically presents an unlimited state, and the earth pressure is between the static earth pressure and the active earth pressure. The active earth pressure of finite soil is less than the Rankine active earth pressure (except for the small depth), and the Rankine active earth pressure is between the static earth pressure and the active earth pressure of finite soil (except for the small depth). This is mainly because the Rankine active earth pressure is calculated based on the semi-infinite assumption of soil, so the calculated active earth pressure is greater than that of finite soil. The earth pressure of finite soil under different excavation steps is greater than the active earth pressure of finite soil. Comparing
Figure 8a,b, the theoretical value of the earth pressure of finite soil under different excavation steps is slightly greater than the measured value, but the difference between the two is less than 10% so the rationality of this theoretical formula can be judged as the theoretical value greater than the measured value may be caused by soil parameters. The comparison between
Figure 8c,d is consistent with that of
Figure 8a,b. In addition, between
Figure 8e,f at a depth of 15 m, the measured value of the No. 1 pile is 77.7 kPa, the measured value of the No. 2 pile is 79.8 kPa, the theoretical value of the No. 1 pile is 83.8 kPa, the theoretical value of the No. 2 pile is 84.9 kPa, and the Rankine active earth pressure is 81.4 kPa in which the measured value of the earth pressure of finite soil is lower than the Rankine active earth pressure. Therefore, if the Rankine active earth pressure is used to calculate the limit state, the soil has been damaged at this time but if the soil is not damaged in the actual project, then it shows that the calculation of Rankine active earth pressure in actual engineering does not conform to the finite soil condition.
6. Discussion
In order to facilitate the parameter analysis through theoretical formulas, the current borrowed soil layer is homogeneous silty clay, with a weight of 18.62 kN·m−3, a compressive modulus of 5.85 MPa, a cohesion of 18.9 kPa, and an internal friction angle of 15.4°. The height of the enclosure structure is 19.8 m and the width of limited soil is 4.7 m. During the excavation, the horizontal displacement of pile at 3 m, 6 m, 9 m, 12 m, and 15 m was 0.227 mm, 0.348 mm, 0.727 mm, 0.929 mm, and 0.790 mm, respectively.
In
Figure 9, the static earth pressure is greater than the earth pressure of finite soil, the earth pressure of finite soil is greater than the Rankine active earth pressure, and the Rankine active earth pressure is greater than the active earth pressure of finite soil except for the depth of 3 m. In order to better guide the actual construction of the project, it is necessary to further compare and analyze the difference between the Rankine active earth pressure and active earth pressure of finite soil, which can be represented by
η. The effects of width-to-depth ratio, cohesion, and internal friction angle on
η and the earth pressure of finite soil are now studied.
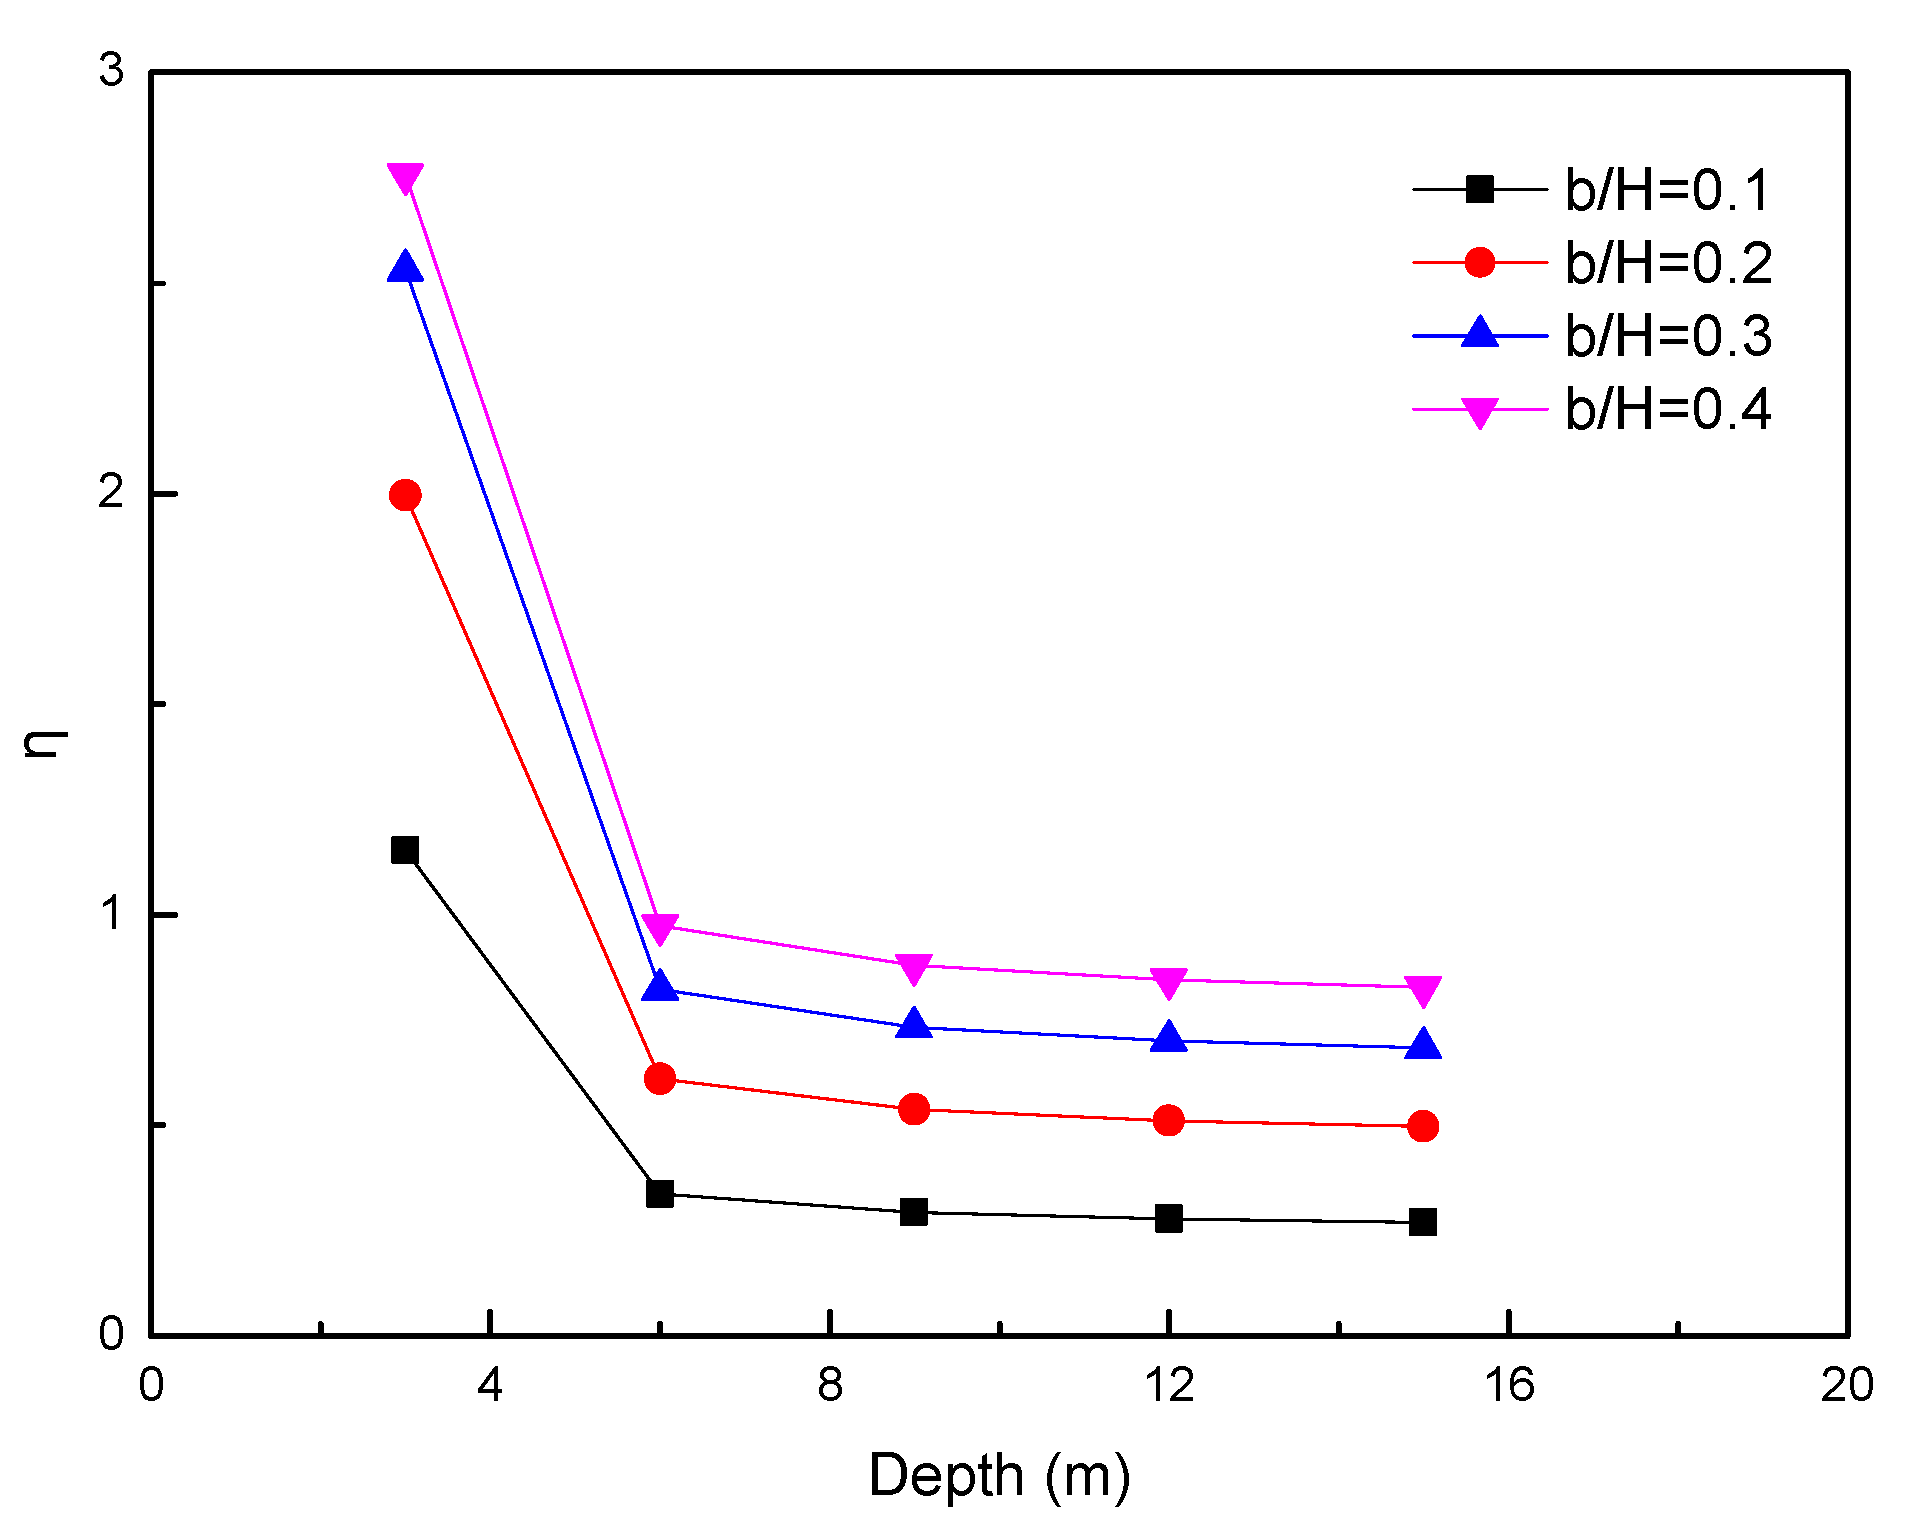
6.1. Influence of Width-to-Depth Ratio
The width-to-depth ratio b/H is taken as 0.1, 0.2, 0.3, and 0.4, respectively, to analyze its influence on
η, as shown in
Figure 10.
In
Figure 10, under the same width-to-depth ratio,
η decreases with the increase in depth. With the increase in width-to-depth ratio,
η increases generally. In addition, when the depth is 3 m, under the condition of the above width-to-depth ratio,
η is all greater than 1, indicating that the active earth pressure of the finite soil is greater than Rankine active earth pressure at this time. If Rankine earth pressure is used for calculation, the calculated value is too small which may easily cause engineering accidents so special attention should be paid.
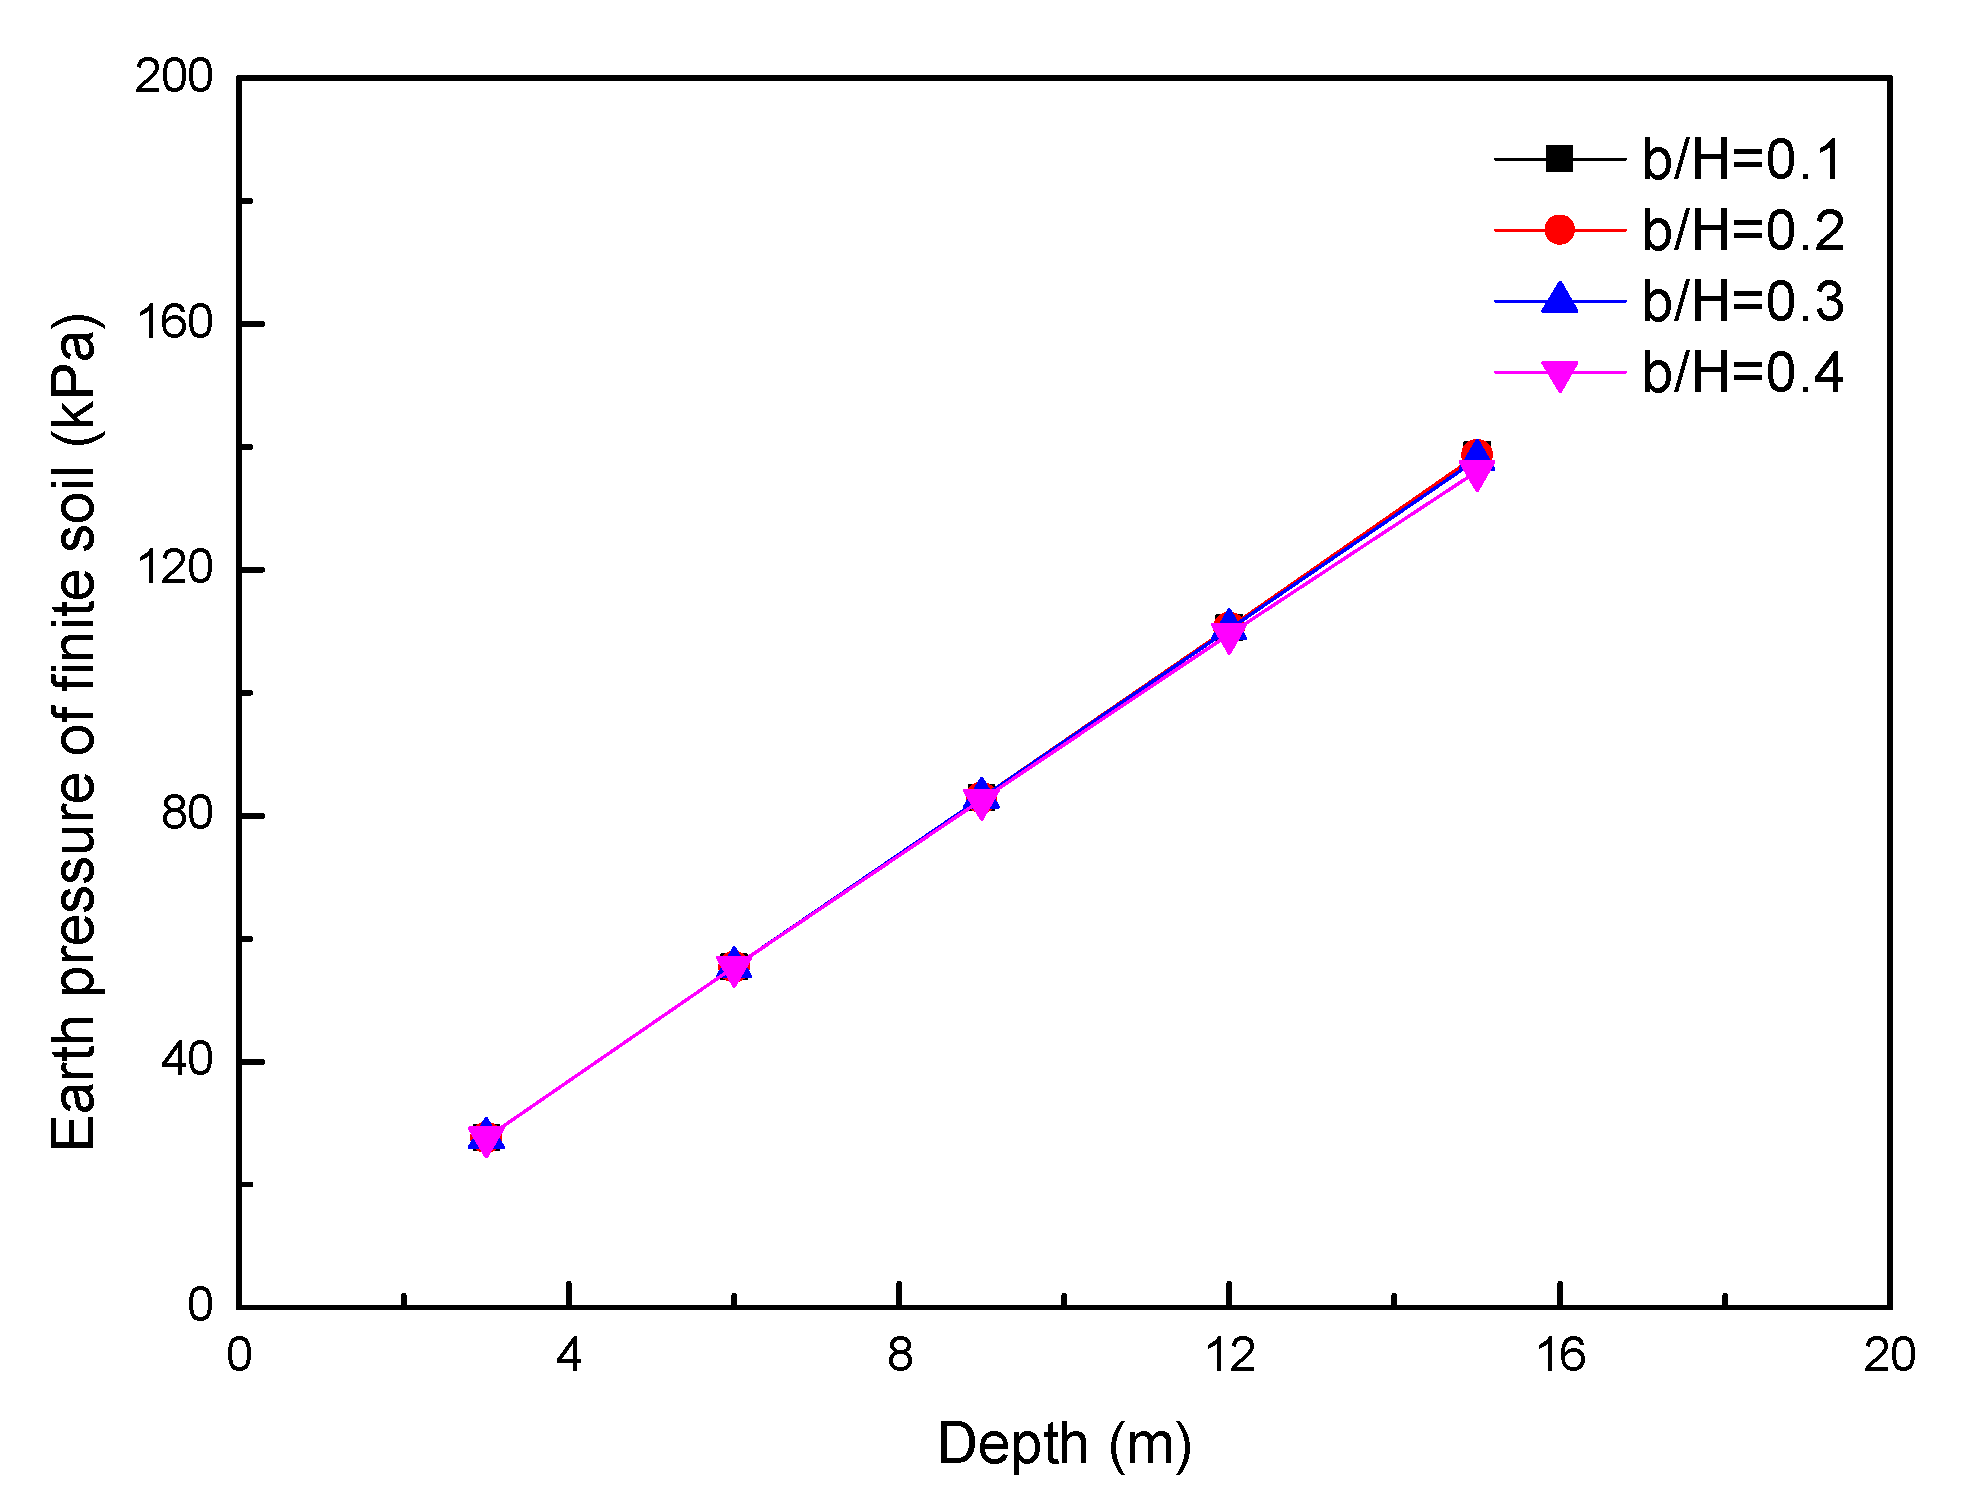
The width-to-depth ratio b/H is taken as 0.1, 0.2, 0.3, and 0.4, respectively, to analyze its influence on the earth pressure of finite soil, as shown in
Figure 11.
In
Figure 11, under the same width-to-depth ratio, the earth pressure of finite soil increases with the increase in depth. The greater the depth, the larger the difference in the earth pressure of finite soil with different width-to-depth ratio.
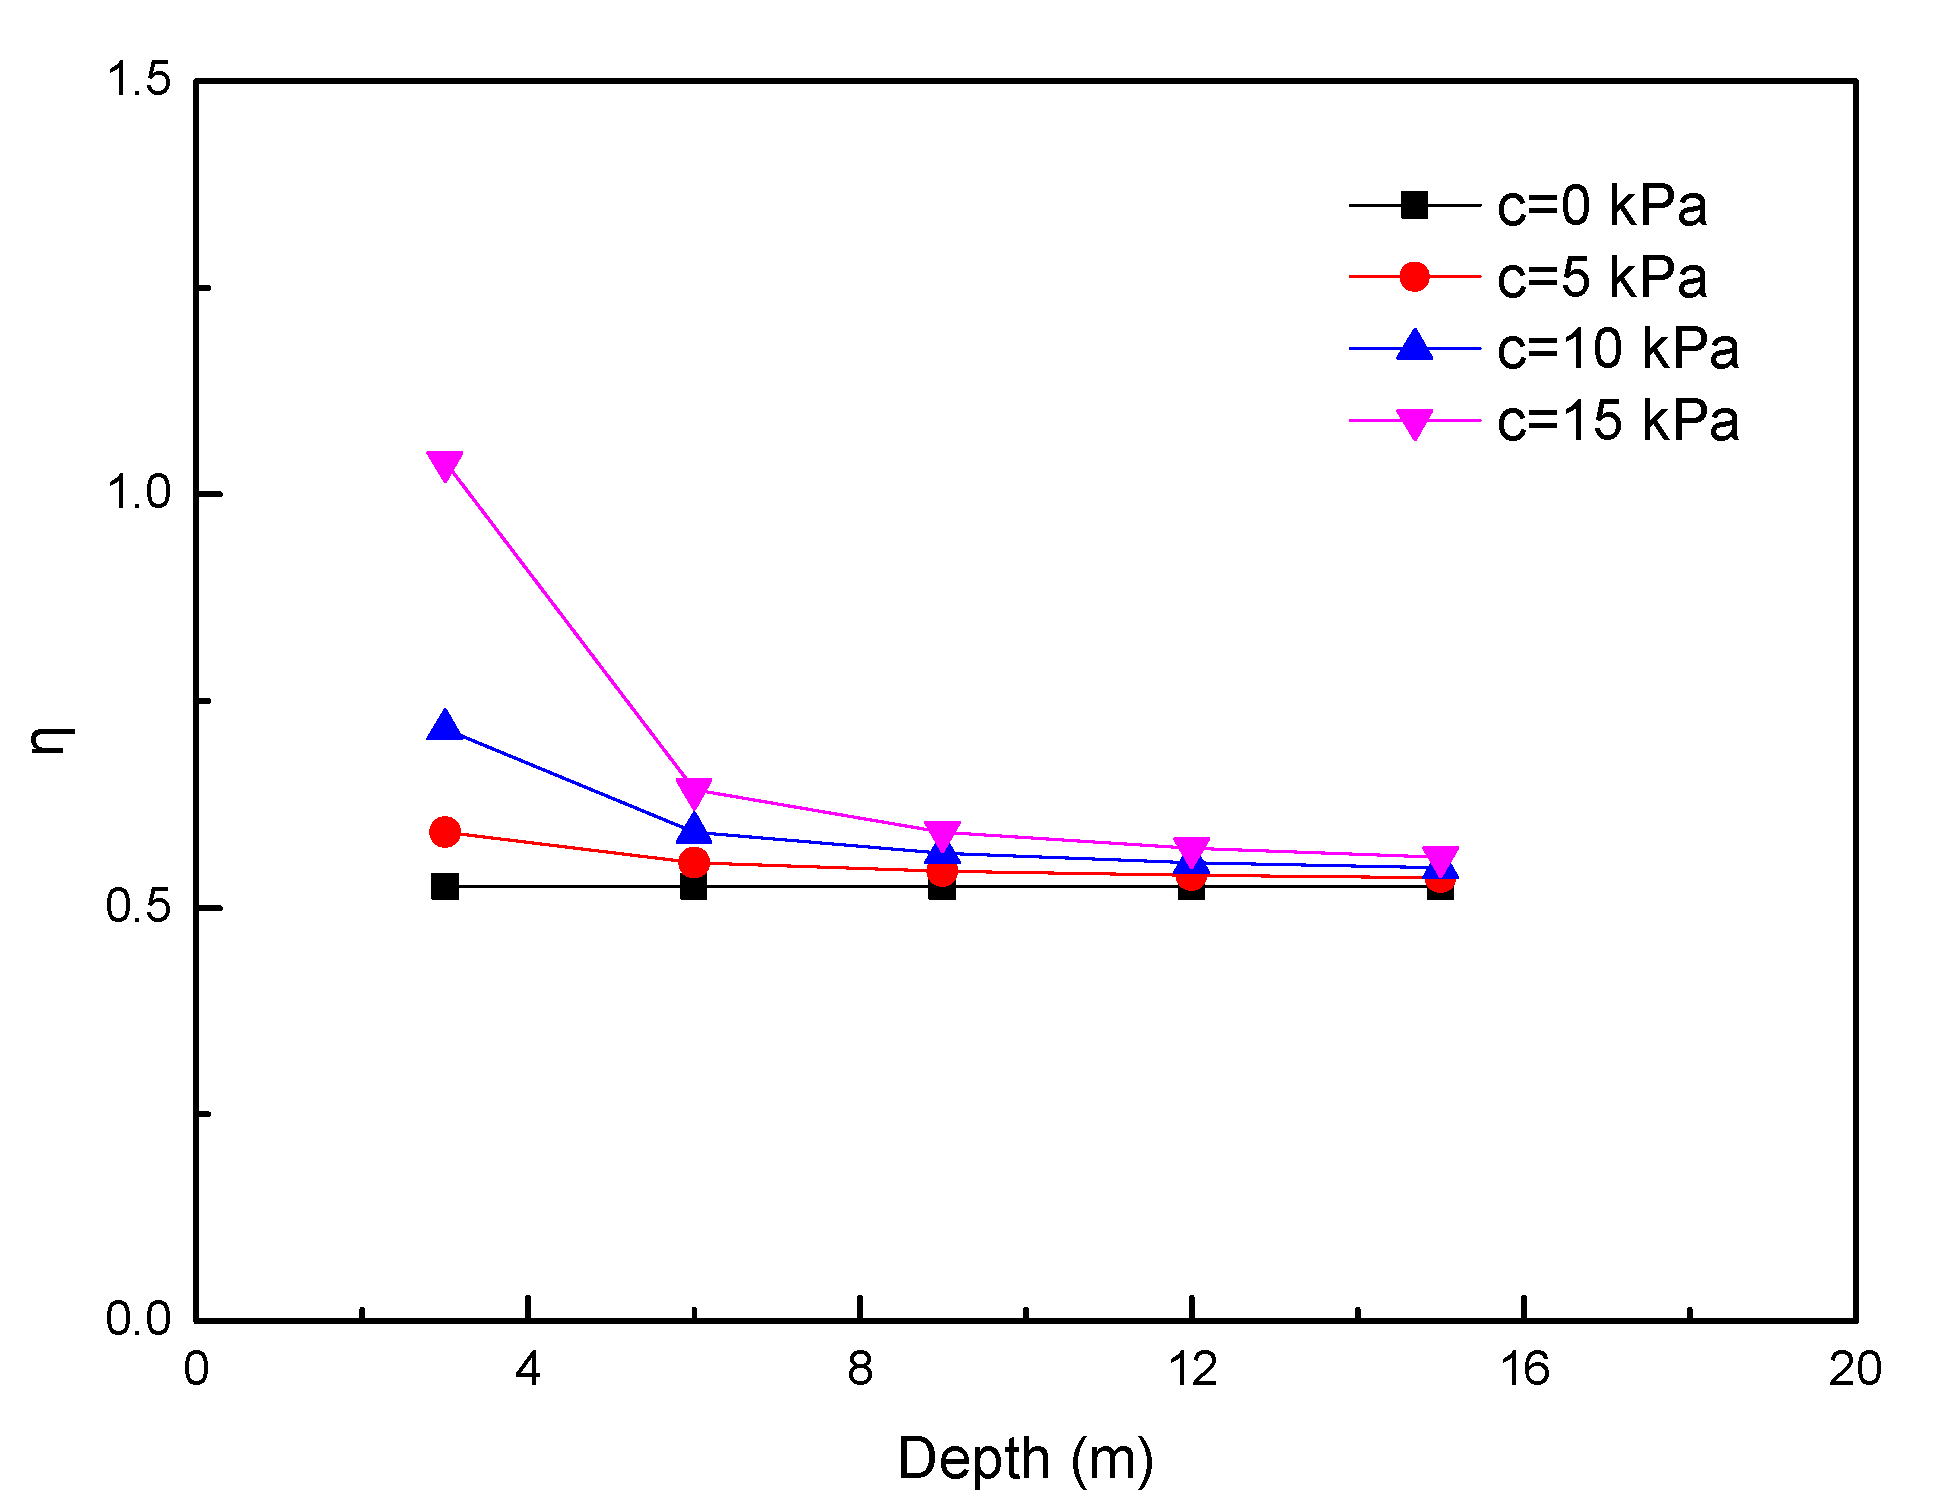
6.2. Influence of Cohesion
The cohesion is taken as 0 kPa, 5 kPa, 10 kPa, and 15 kPa, respectively, to analyze its influence on
η, as shown in
Figure 12.
In
Figure 12, under the same cohesion, except when the cohesion is 0 kPa,
η does not change with the depth. In other cases,
η decreases with the increase in depth. With the increase in cohesion,
η increases. In addition, when the depth is 3 m, when the cohesion is 15 kPa, and when
η is greater than 1, this indicates that the active earth pressure of the finite soil is greater than Rankine active earth pressure at that time. If the Rankine earth pressure is used for calculation, the calculated value is too small, which may easily cause engineering accidents and so special attention should be paid.
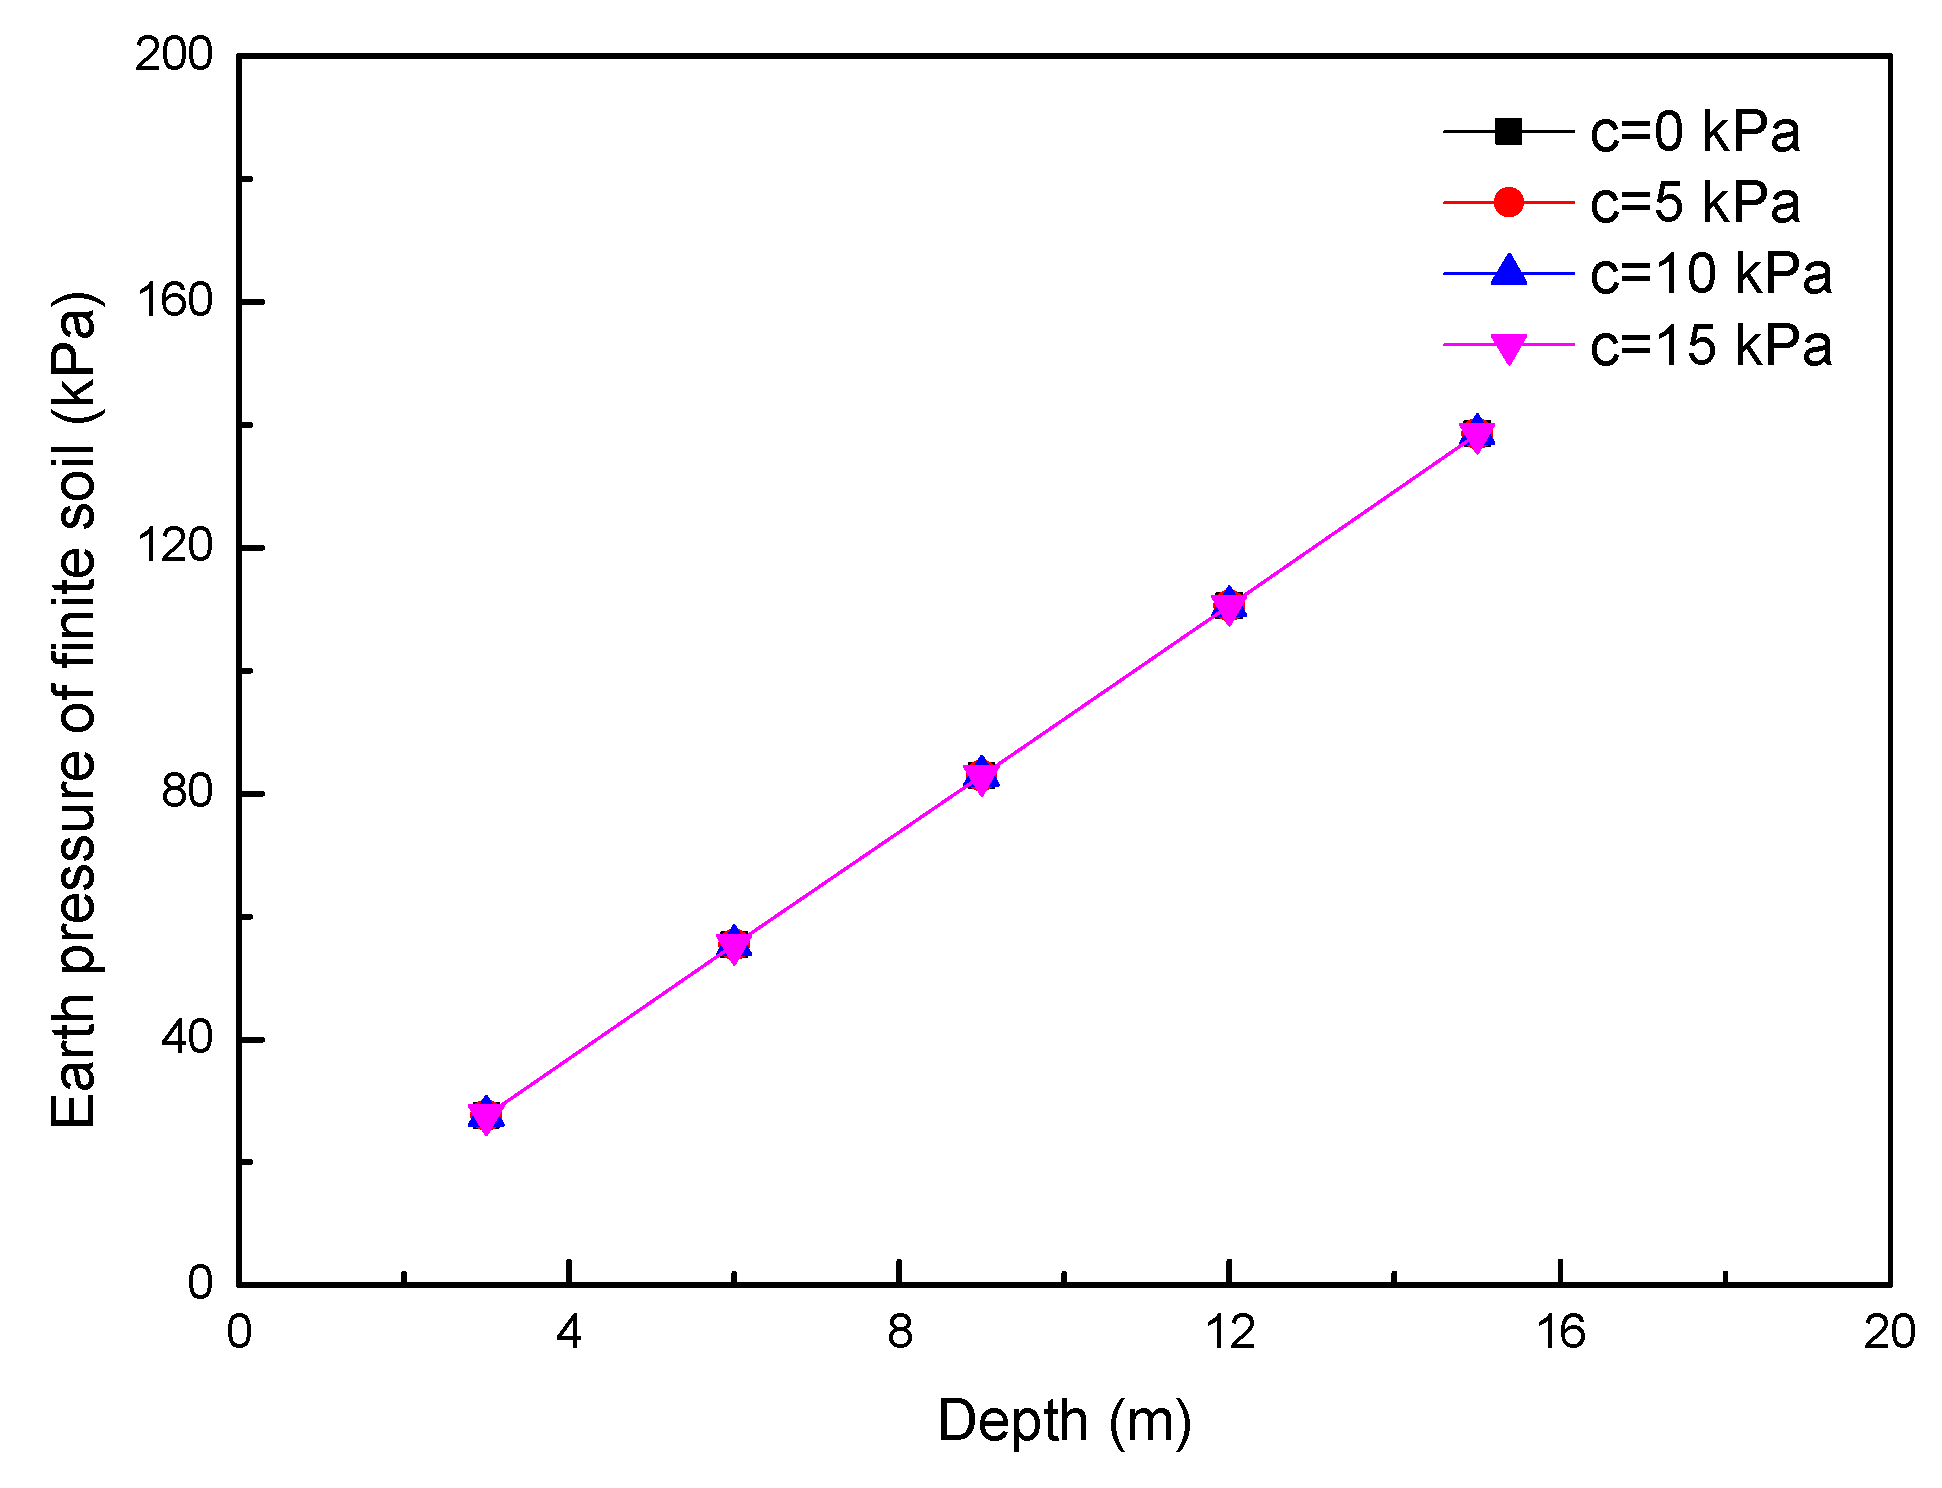
The cohesion is taken as 0 kPa, 5 kPa, 10 kPa, and 15 kPa, respectively, to analyze its influence on the earth pressure of finite soil, as shown in
Figure 13.
In
Figure 13, under the same cohesion, the earth pressure of finite soil increases with the increase in depth. In general, under the same displacement state, the change in cohesion has little effect on the earth pressure of finite soil, and the earth pressure of finite soil with different cohesion in the figure is almost the same.
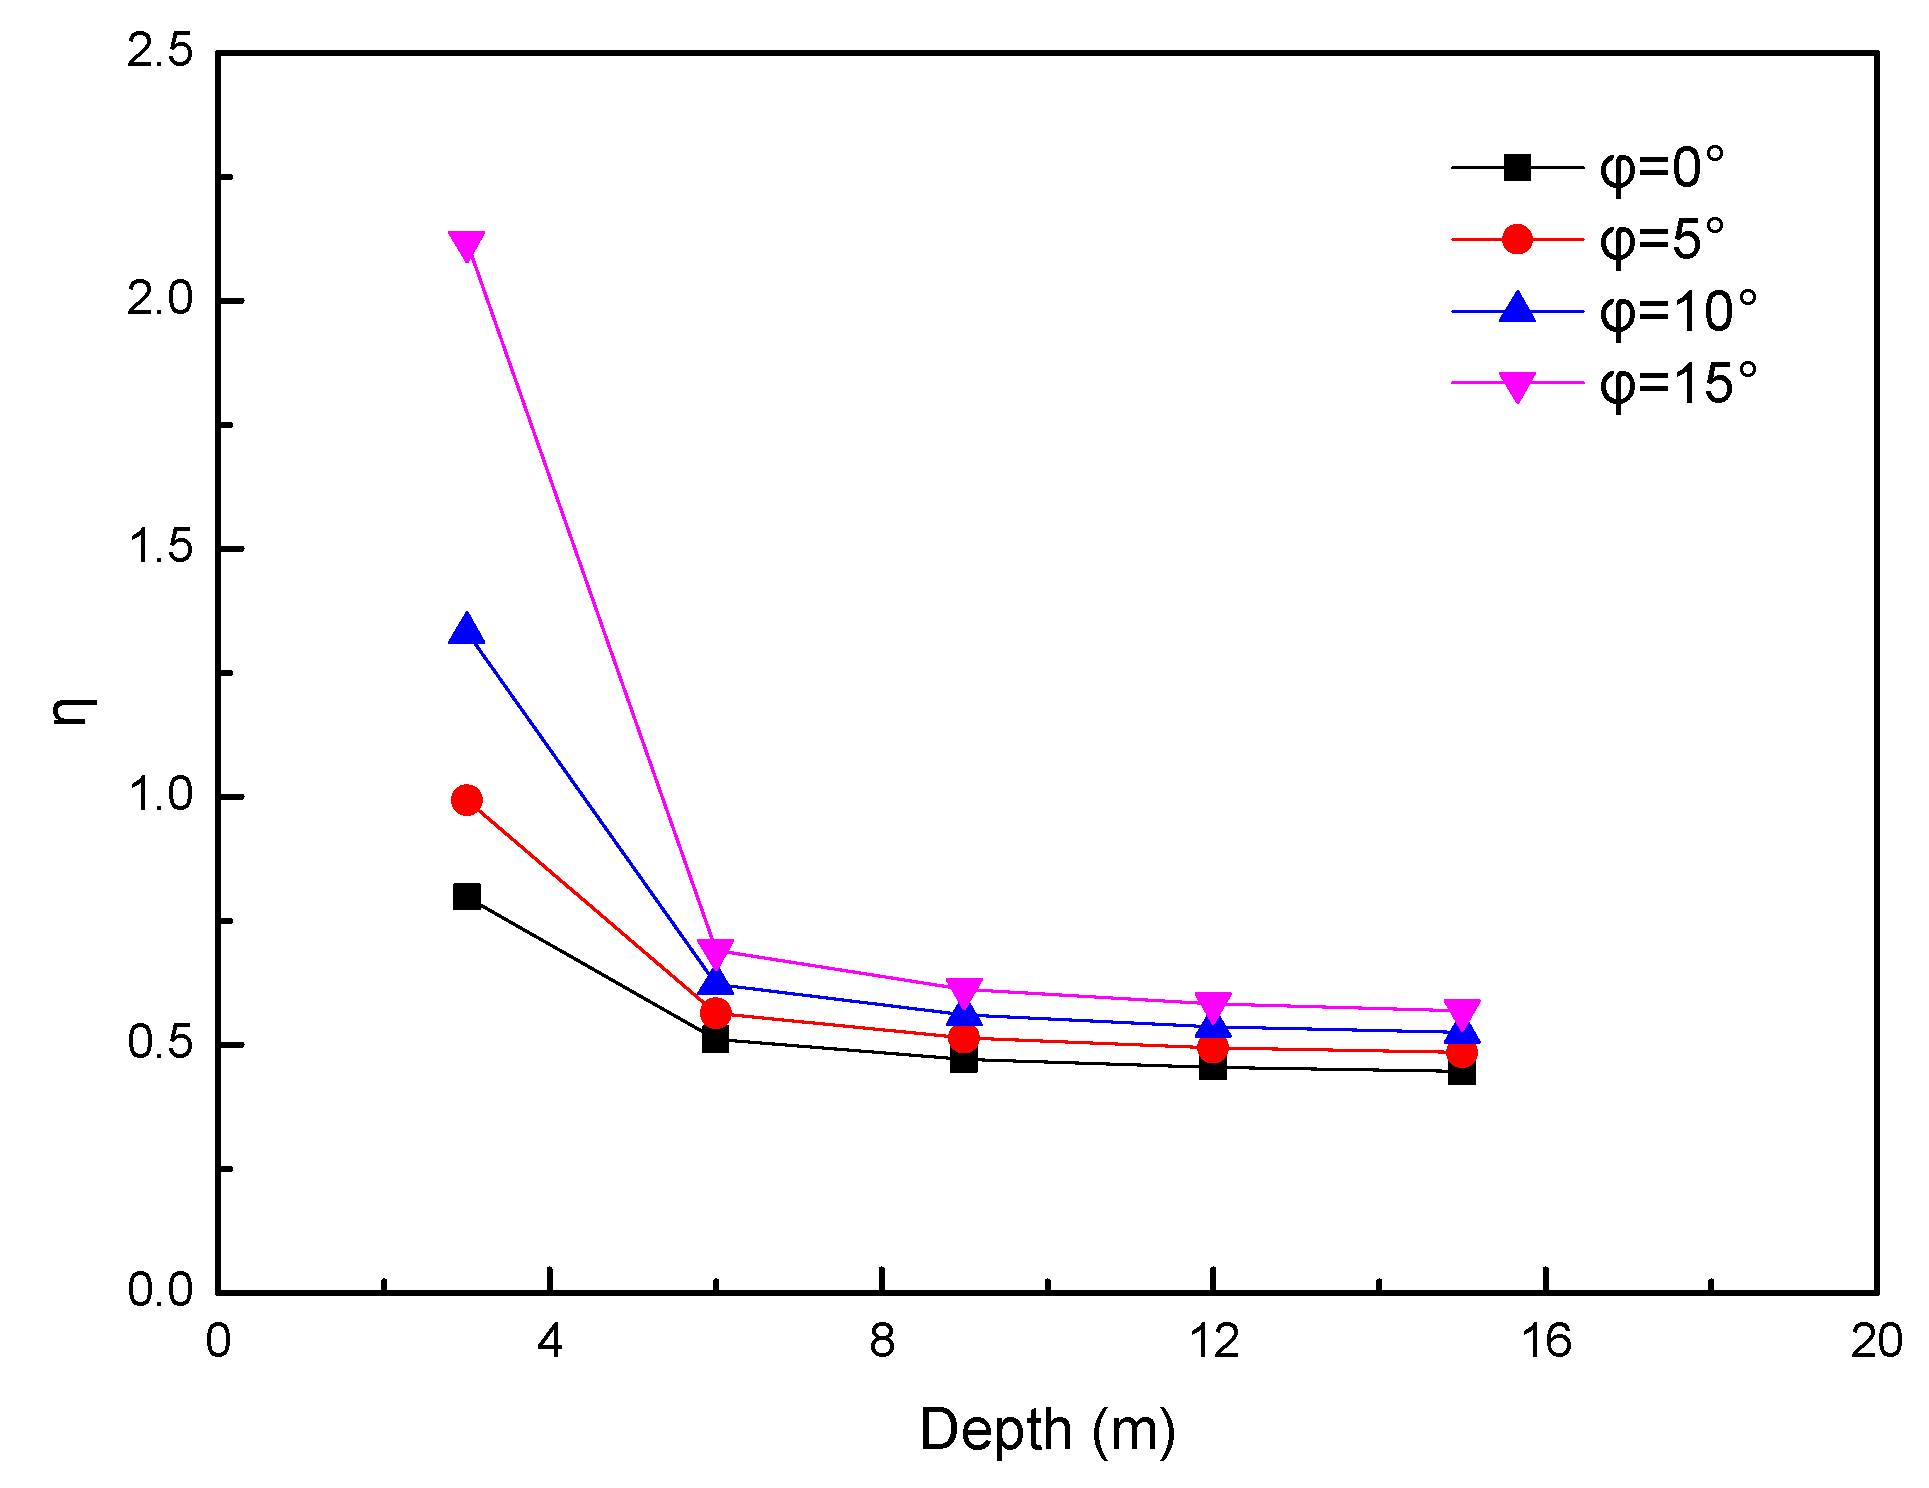
6.3. Influence of Internal Friction Angle
The internal friction angles are taken as 0°, 5°, 10°, and 15°, respectively, to analyze its influence on
η, as shown in
Figure 14.
In
Figure 14, under the same internal friction angle,
η decreases with the increase in depth. With the increase in internal friction angle,
η increases. In addition, when the depth is 3m, the internal friction angle is 10° and 15°,
η is greater than 1, indicating that the active earth pressure of the finite soil is greater than Rankine active earth pressure. The calculation of the Rankine earth pressure makes the calculated earth pressure too small, which is easy to cause engineering accidents and needs special attention.
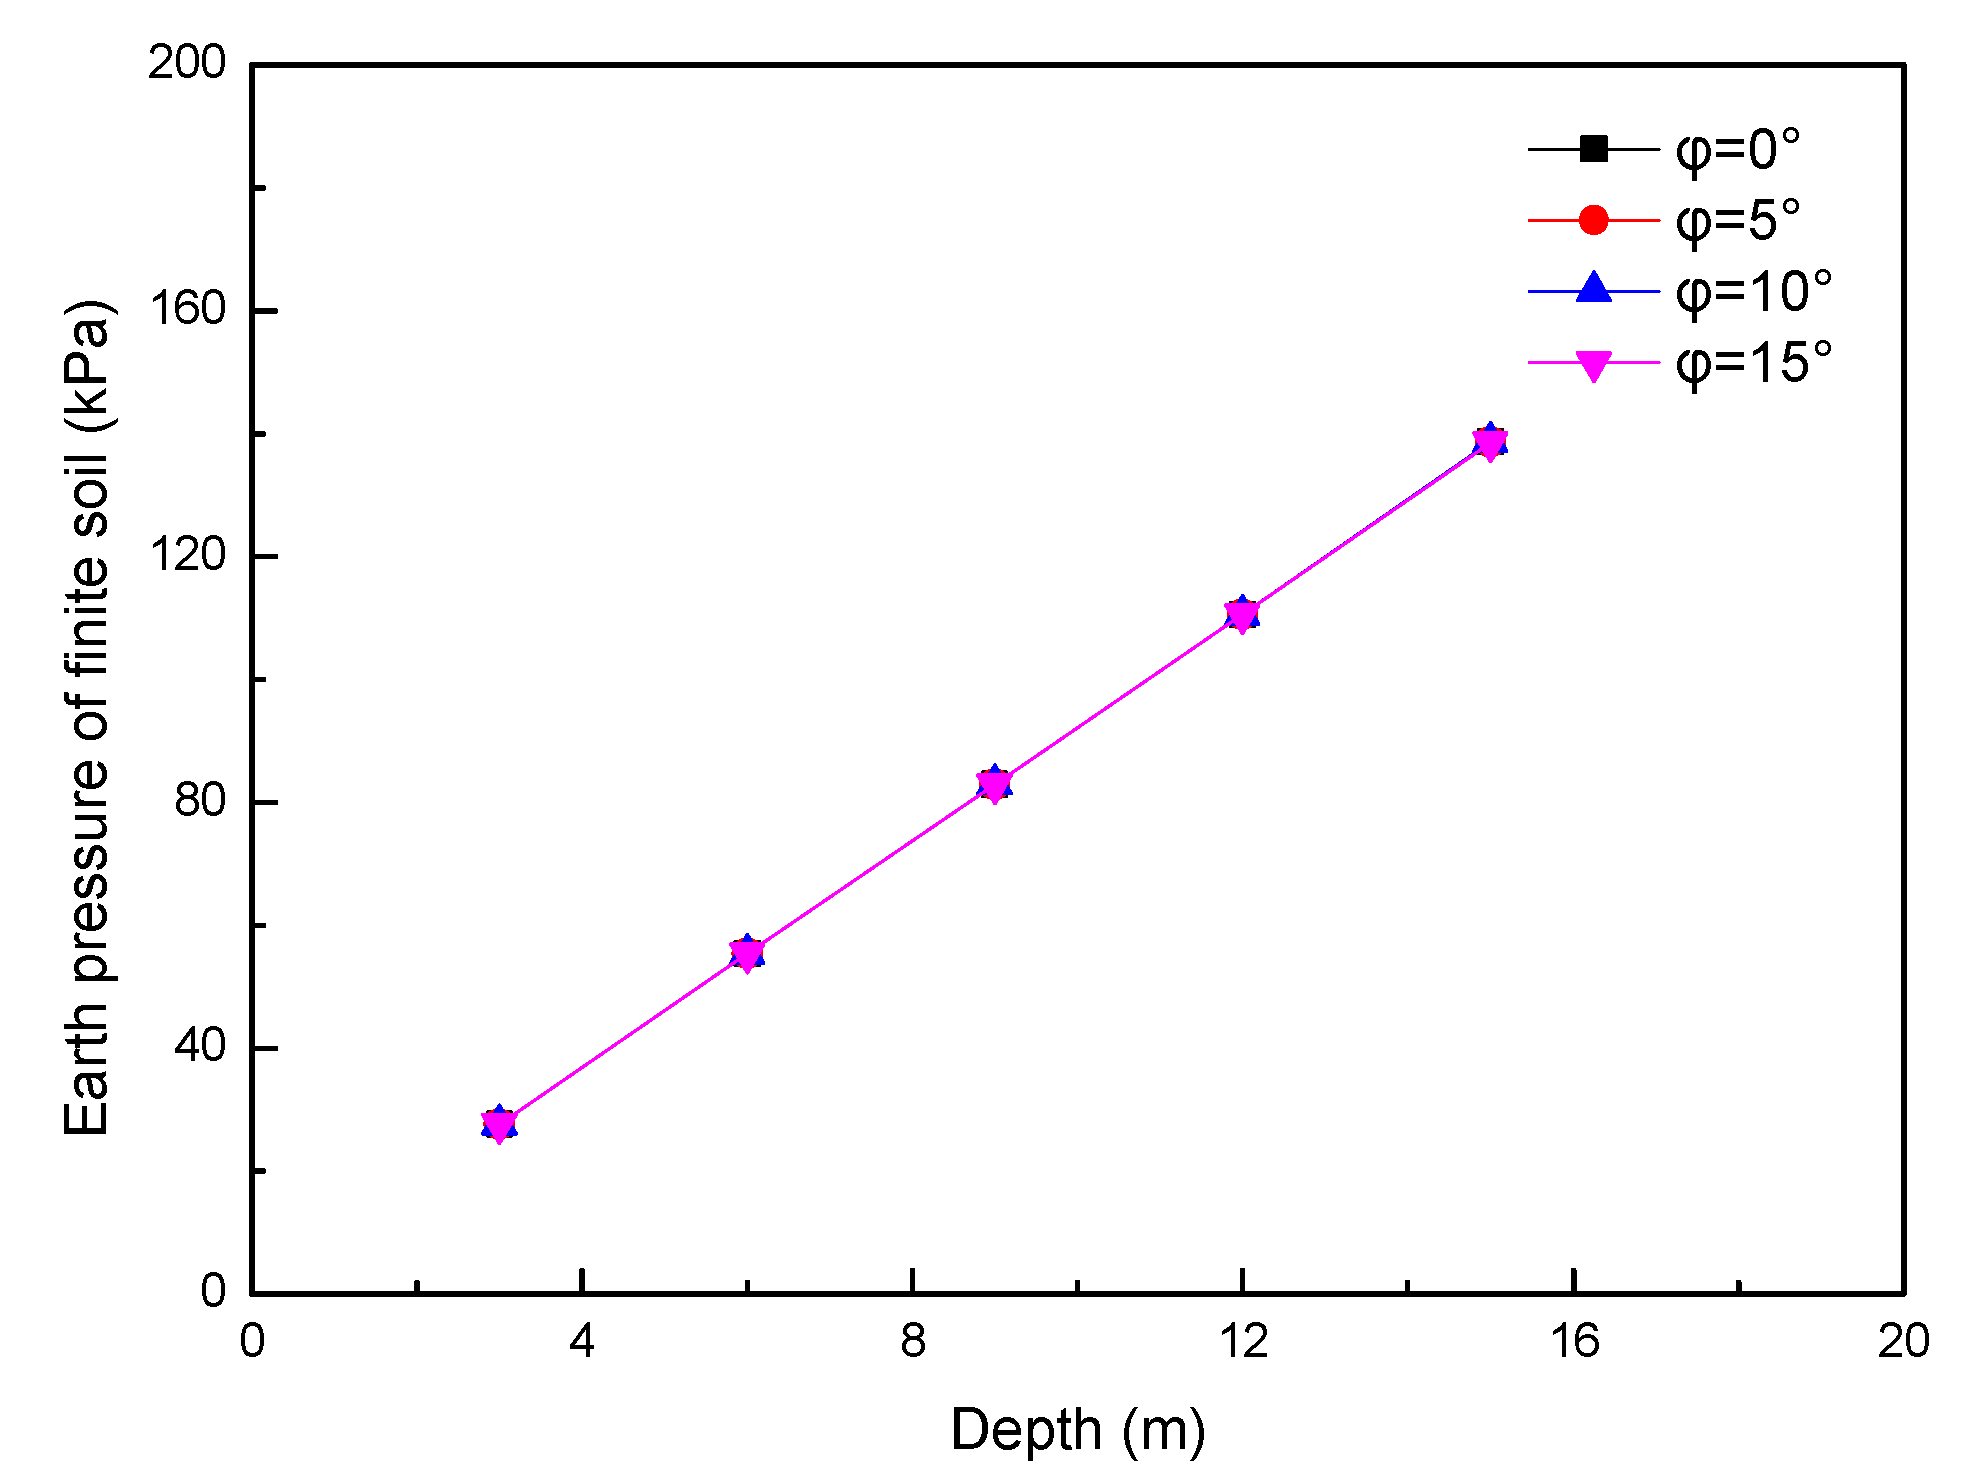
The internal friction angles are taken as 0°, 5°, 10°, and 15°, respectively, to analyze its influence on the earth pressure of finite soil, as shown in
Figure 15.
In
Figure 15, under the same internal friction angle, the earth pressure of finite soil increases with the increase in depth. In general, under the same displacement state, the change in the internal friction angle has little effect on the earth pressure of finite soil, and the earth pressure of finite soil with different internal friction angles in the figure is almost the same.
In this research, the displacement data obtained from the optical fiber test are used for the theoretical calculation formula, which is only to ensure the accuracy of the test. If the test does not require high accuracy, this part of the displacement test can be replaced by the inclinometer data in the subsequent research, and the displacement data can also be obtained by studying the deformation theory formula, which is not the focus of this paper.
7. Conclusions
- (1)
The calculation of Rankine active earth pressure in actual engineering is not suitable for the finite soil condition. In this research, at a depth of 15 m, the measured value of the No. 1 pile is 77.7 kPa, the measured value of the No. 2 pile is 79.8 kPa, the Rankine active earth pressure is 81.4 kPa, and the measured value of the earth pressure of finite soil is lower than the Rankine active earth pressure; if the Rankine active earth pressure is used to calculate the limit state, the soil has been damaged at this time, but the soil is not damaged in the actual project;
- (2)
The theoretical value of the earth pressure of finite soil under different excavation steps is slightly greater than the measured value, but the difference between the two is less than 10% so the rationality of this theoretical formula can be judged and the theoretical value greater than the measured value may be caused by soil parameters;
- (3)
The active earth pressure of the finite soil is greater than Rankine active earth pressure when η is greater than 1. In this research, at a depth of 3 m, when the width-to-depth ratio is 0.1–0.4, or the cohesion is 15 kPa, or the internal friction angle is 10° and 15°, the Rankine active earth pressure is less than the active earth pressure of the finite soil. In addition, the difference in the earth pressure of finite soil under different width-to-depth ratio would increase with depth, while the cohesion and internal friction angle had little effect on the earth pressure of finite soil.
Author Contributions
Conceptualization, H.H. and J.Z.; Data curation, H.H.; Formal analysis, H.H., F.Y. and H.T.; Funding acquisition, J.Z.; Investigation, H.H. and Y.Z.; Methodology, H.H., J.Z. and X.G.; Project administration, J.Z. and X.G.; Resources, J.Z. and X.G.; Software, H.H.; Supervision, H.H.; Validation, H.H.; Visualization, H.H.; Writing—original draft, H.H.; Writing—review and editing, F.Y., H.T., Y.Z. and J.Z. All authors have read and agreed to the published version of the manuscript.
Funding
This research was funded by National Natural Science Foundation of China (52108350).
Institutional Review Board Statement
Not applicable.
Informed Consent Statement
Not applicable.
Conflicts of Interest
The authors declare no conflict of interest.
References
- Debiasi, E.; Gajo, A.; Zonta, D. On the seismic response of shallow-buried rectangular structures. Tunn. Undergr. Space Technol. 2013, 38, 99–113. [Google Scholar] [CrossRef]
- Ertugrul, O.L. Numerical modeling of the seismic racking behavior of box culverts in dry cohesionless soils. KSCE J. Civ. Eng. 2016, 20, 1737–1746. [Google Scholar] [CrossRef]
- Zhou, J.; Gong, X.; Zhang, R.; Hesham El Naggar, M.; Wang, K. Field behavior of pre-bored grouted planted nodular pile embedded in deep clayey soil. Acta Geotech. 2020, 15, 1847–1857. [Google Scholar] [CrossRef]
- Zhou, J.; Yu, J.; Gong, X.; El Naggar, M.H.; Zhang, R. Field study on the behavior of pre-bored grouted planted pile with enlarged grout base. Acta Geotech. 2021, 16, 3327–3338. [Google Scholar] [CrossRef]
- Xu, S.; Ma, E.; Lai, J.; Yang, Y.; Liu, H.; Yang, C.; Hu, Q. Diseases failures characteristics and countermeasures of expressway tunnel of water-rich strata: A case study. Eng. Fail. Anal. 2022, 134, 106056. [Google Scholar] [CrossRef]
- Liao, S.; Wei, S.; Shen, S. Structural responses of existing metro stations to adjacent deep excavations in suzhou, China. J. Perform. Constr. Facil. 2016, 30, 04015089. [Google Scholar] [CrossRef]
- Yang, Q.; Li, M.; Chen, J. Influence of a flexible retaining wall on performance of an adjacent deep excavation. KSCE J. Civ. Eng. 2022, 26, 661–672. [Google Scholar] [CrossRef]
- Tsagareli, Z.V. Experimental investigation of the pressure of a loose medium on retaining walls with a vertical back face and horizontal backfill surface. Soil Mech. Found. Eng. 1965, 2, 197–200. [Google Scholar] [CrossRef]
- Wang, Y.; Wang, H.; Zhang, W. Distribution of earth pressure on a retaining wall. China Harb. Eng. 2000, 50, 83–88. [Google Scholar] [CrossRef]
- Peng, M.X.; Chen, J. Slip-line solution to active earth pressure on retaining walls. Geotechnique 2013, 63, 1008–1019. [Google Scholar] [CrossRef]
- Khosravi, M.H.; Kargar, A.R.; Amini, M. Active earth pressures for non-planar to planar slip surfaces considering soil arching. Int. J. Geotech. Eng. 2018, 14, 730–739. [Google Scholar] [CrossRef]
- Xu, J.; Wang, P.; Huang, F.; Yang, X. Active earth pressure of 3d earth retaining structure subjected to rainfall infiltration. Eng. Geol. 2021, 293, 106294. [Google Scholar] [CrossRef]
- Paik, K.H.; Salgado, R. Estimation of active earth pressure against rigid retaining walls considering arching effects. Geotechnique 2003, 53, 643–653. [Google Scholar] [CrossRef]
- Goel, S.; Patra, N.R. Effect of arching on active earth pressure for rigid retaining walls considering translation mode. Int. J. Geomech. 2008, 8, 123–133. [Google Scholar] [CrossRef]
- Patel, S.; Deb, K. Study of active earth pressure behind a vertical retaining wall subjected to rotation about the base. Int. J. Geomech. 2020, 20, 04020028. [Google Scholar] [CrossRef]
- Frydman, S.; Keissar, I. Earth pressure on retaining walls near rock faces. J. Geotech. Eng. 1987, 113, 586–599. [Google Scholar] [CrossRef]
- Take, W.A.; Valsangkar, A.J. Earth pressures on unyielding retaining walls of narrow backfill width. Can. Geotech. J. 2001, 38, 1220–1230. [Google Scholar] [CrossRef]
- Fan, C.; Fang, Y. Numerical solution of active earth pressures on rigid retaining walls built near rock faces. Comput. Geotech. 2010, 37, 1023–1029. [Google Scholar] [CrossRef]
- Yang, M.; Tang, X. Rigid retaining walls with narrow cohesionless backfills under various wall movement modes. Int. J. Geomech. 2017, 17, 04017098. [Google Scholar] [CrossRef]
- Gao, Y. The Calculation of Finite Earth Pressure. Build. Sci. 2000, 5, 53–56. (In Chinese) [Google Scholar] [CrossRef]
- Tang, Y.; Chen, J. A computational method of active earth pressure from finite soil body. Math. Probl. Eng. 2018, 2018, 9892376. [Google Scholar] [CrossRef]
- Xie, M.; Zheng, J.; Zhang, R.; Cui, L.; Miao, C. Active earth pressure on rigid retaining walls built near rock faces. Int. J. Geomech. 2020, 20, 04020061. [Google Scholar] [CrossRef]
- Zhang, C.; Zhu, H.; Liu, S.; Shi, B.; Cheng, G. Quantifying progressive failure of micro-anchored fiber optic cable–sand interface via high-resolution distributed strain sensing. Can. Geotech. J. 2020, 57, 871–881. [Google Scholar] [CrossRef]
- Zheng, Y.; Zhu, Z.; Xiao, W.; Deng, Q. Review of fiber optic sensors in geotechnical health monitoring. Opt. Fiber Technol. 2020, 54, 102127. [Google Scholar] [CrossRef]
- Yang, M.; Wang, L.; Zhao, M. A calculation model of the earth pressure for the limited soils considering the nonear influence of the displacement. Shuili Xuebao 2012, 43, 1121–1126. (In Chinese) [Google Scholar] [CrossRef]
- Caspe, M.S. Surface settlement adjacent to braced open cuts. J. Soil Mech. Found. Div. 1966, 92, 51–59. [Google Scholar] [CrossRef]
| Publisher’s Note: MDPI stays neutral with regard to jurisdictional claims in published maps and institutional affiliations. |
© 2022 by the authors. Licensee MDPI, Basel, Switzerland. This article is an open access article distributed under the terms and conditions of the Creative Commons Attribution (CC BY) license (https://creativecommons.org/licenses/by/4.0/).


