Article

A Graph-Based k-Nearest Neighbor (KNN) Approach for Predicting Phases in High-Entropy Alloys

by
Raheleh Ghouchan Nezhad Noor Nia
1,
Mehrdad Jalali
1,2,* and
Mahboobeh Houshmand
1
1
Department of Computer Engineering, Mashhad Branch, Islamic Azad University, Mashhad 9187147578, Iran
2
Institute of Functional Interfaces (IFG), Karlsruhe Institute of Technology (KIT), Hermann-Von Helmholtz-4 Platz 1, 76344 Eggenstein-Leopoldshafen, Germany
*
Author to whom correspondence should be addressed.
Appl. Sci. 2022, 12(16), 8021; https://doi.org/10.3390/app12168021
Submission received: 20 July 2022 / Revised: 9 August 2022 / Accepted: 9 August 2022 / Published: 10 August 2022
(This article belongs to the Special Issue Applied Artificial Intelligence (AI))

Abstract

:
Traditional techniques for detecting materials have been unable to coordinate with the advancement of material science today due to their low accuracy and high cost. Accordingly, machine learning (ML) improves prediction efficiency in material science and high-entropy alloys’ (HEAs’) phase prediction. Unlike traditional alloys, HEAs consist of at least five elements with equal or near-equal atomic sizes. In a previous approach, we presented an HEA interaction network based on its descriptors. In this study, the HEA phase is predicted using a graph-based k-nearest neighbor (KNN) approach. Each HEA compound has its phase, which includes five categories: FCC, BCC, HCP, Multiphase and Amorphous. A composition phase represents a state of matter with a certain energy level. Phase prediction is effective in determining its application. Each compound in the network has some neighbors, and the phase of a new compound can be predicted based on the phase of the most similar neighbors. The proposed approach is performed on the HEA network. The experimental results show that the accuracy of the proposed approach for predicting the phase of new alloys is 88.88%, which is higher than that of other ML methods.

1. Introduction

The structure of a material expresses elements in terms of size, crystallinity, etc. A material’s descriptors are measured to determine hardness, thermodynamics, and electricity. The performance of the material and the components depend on the application. Alloys are kinds of materials that consist of a mixture or solution of metal solid by basic metal with one or more metallic or non-metallic element. The aim of alloying is to improve material properties such as strength, hardness, and so on.
Unlike traditional alloys, HEAs consist of at least five elements with equal or similar atomic sizes. Since the mixing entropy of the alloys is maximized, they are called high-entropy alloys (HEAs) [1]. HEAs have unique physical and chemical properties that distinguish them from ordinary alloys. Moreover, hardness, high temperature strength, fatigue, and tensile strength are their mechanical features. HEAs are the subject of particular attention because of their unusual properties, which largely depend on the selection between three phases: solid solution (SS), inter-metallic compounds (IM), and mixed SS and IM (SS + IM). Ye et al. [1] reported HEA phase formation, which introduced new descriptors of the hardness and mechanical performance of HEAs at high temperatures. HEA applications are in high-temperature refractory, low-density, and lightweight materials. In another study performed by Risal et al. [2], six descriptors of HEAs were calculated which included VEC, δ , Δ χ , Δ S , Δ H , and T m e l t . The five thermodynamic parameters were input into the ML method in phase prediction. Feature selection was carried out in two ways: by including individuals rated separately from others, and subset evaluation, which eliminates irrelevant features through correlation methods [2].
Since mankind has always attempted to discover new materials, the ML revolution in the discovery of new materials with novel properties has led to its popularity in materials science [3]. ML has been used in the prediction of new compositions of HEAs with optimal properties [4]. An artificial neural network model has been proposed to predict the evolution of the eutectic HEA compound phase and the properties of the materials that it can stretch and deform. Eutectic HEAs are a homogeneous mixture of materials that melt or freeze at a unit temperature and form crystals simultaneously [5,6]. The artificial neural network method was used to identify a distinguished type of VEC, which is the agent for the stability of HEA phases. The ML perspective is data-driven, which is clustering and classification. Since the ML methods can learn, they can improve their accuracy in the face of unseen data over time [7]. Hence, ML has been become one of the principal technologies in materials informatics. The ML methods in phase prediction for HEAs are a proper alternative in terms of accuracy to traditional predicting methods. Another ML application is in metamaterials, the properties of which are not due to their chemistry, but rather to their shape and structure [8].
Based on a study performed by Agarwal and Rao [9], the neuro-fuzzy interface system was used to predict HEA phases by two types of inputs. The first one is elements of composition, and the second one is HEA descriptors. The descriptors δ , Δ H m i x ( kJ / mol ) , S c ( k B   p e r   a t o m ) , φ , ε R M S , and VEC provide good insights into phase formation. Krishna et al. [10] reported six different ML algorithms to predict the multiphase of eutectic HEAs which were considered the BCC and FCC phases in two different categories of solid solutions and inter-metallic solid solutions. The authors of [11] proposed a new method called MOFSocialNet. They created a social network based on a metal-organic framework (MOF). SNA tools have been used to extract groups of chemical MOF compounds named communities which have mostly similar functionalities. MOFs are different from HEAs in terms of descriptors, elements, and functionality.
Based on another study conducted by Wen et al. [12], ML strategies were used to identify useful HEAs. This model used ML methods to find high-hardness alloys, which are feature-oriented. The ML method was trained to map between hardness and descriptors.
The strength efficiency at the desired temperature was predicted using the regression method of random forest [13]. The model was used to select related HEA features and eliminate irrelevant properties. Based on another study performed by [14], a model was proposed to predict the solid solution strength or hardness of HEAs. It was based on ML feature selection and feature structures. The development of HEAs included phase formation and microstructures, different descriptors, and multiscaling [15]. A deep-learning-based model was proposed for HEA phase prediction, which optimized the hyper parameters through the Bayesian technique [16]. Based on another study conducted by Yan et al. [17], the gradient boosting model was proposed to determine a single-phase solid solution and non-single phase solid solution alloys. The proposed method was used to discover new metallic materials of HEAs. The correlation of experimental parameters while moving from medium to high entropy with a solid solution phase was focused on [18].
In our previous study [19], HEA descriptors were utilized to construct an HEA interaction network. Initially, HEA descriptors were investigated, and that each HEA composition has its own phase. The HEA interaction network was created based on six descriptors, including δ as atomic size difference, Δ H m i x ( kJ / mol ) as the mixing enthalpy, S c as the configurational entropy of mixing for the ideal solid solution, φ as a single dimensionless thermodynamic parameter for designing HEAs, ε R M S as the square root mean residual strain, and VEC as the valence electron concentration of the alloys. The descriptors’ similarity to a pair of compounds was calculated using content and structure similarity parameters. Then, an interaction network between each pair of HEA compositions was constructed, which was mapped to a social network graph. The strength of the relationship between the two compounds was determined by the similarity value called weight, where a stronger connection had greater weight. As ML methods are effective in social network analysis (SNA), the proposed method can also be effective for phase prediction in HEAs. To the best of our knowledge, other studies have not used any HEA phase prediction based on an HEA interaction network.
In this study, a new phase prediction method is presented for use when the phase of a compound is unknown. The proposed approach first finds the position and connections of the new compound in the HEA network. Then, it predicts the phase based on the nearest neighbor in the network. The proposed approach is a graph-based k-nearest neighbor (KNN) algorithm for phase prediction by supervised ML. The proposed method can predict compound phases, which are used in new alloys and alloy structure design. Therefore, accurate phase prediction plays an important role in the selection of a combination of elements to form HEAs with desirable properties.
The rest of this study is organized as follows: The definition of notations, the HEA interaction creation, and the process of the proposed approach using the graph-based KNN algorithm for phase prediction are introduced in Section 2. In Section 3, the experimental results are explained with an example of an unknown phase compound. Additionally, the proposed approach is compared with other ML methods. Finally, Section 4 concludes and outlines the future work to improve the proposed approach.

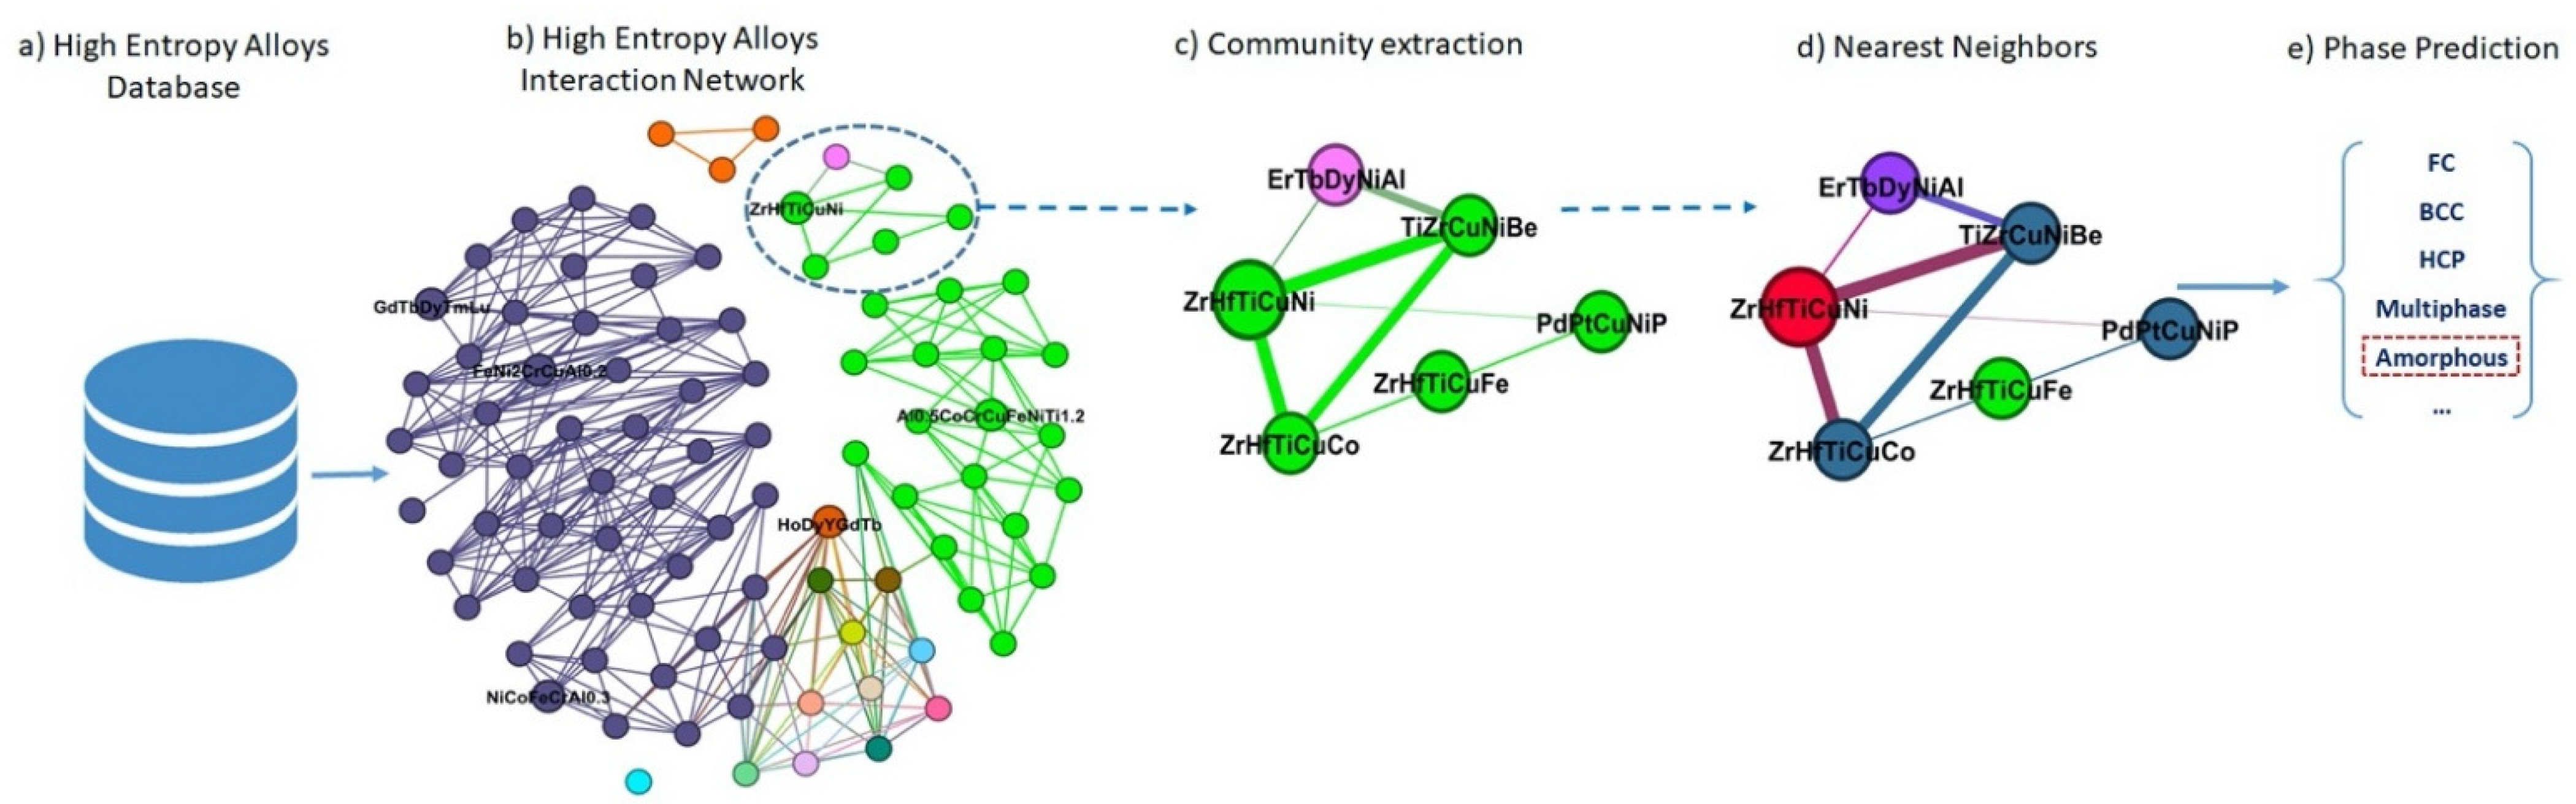
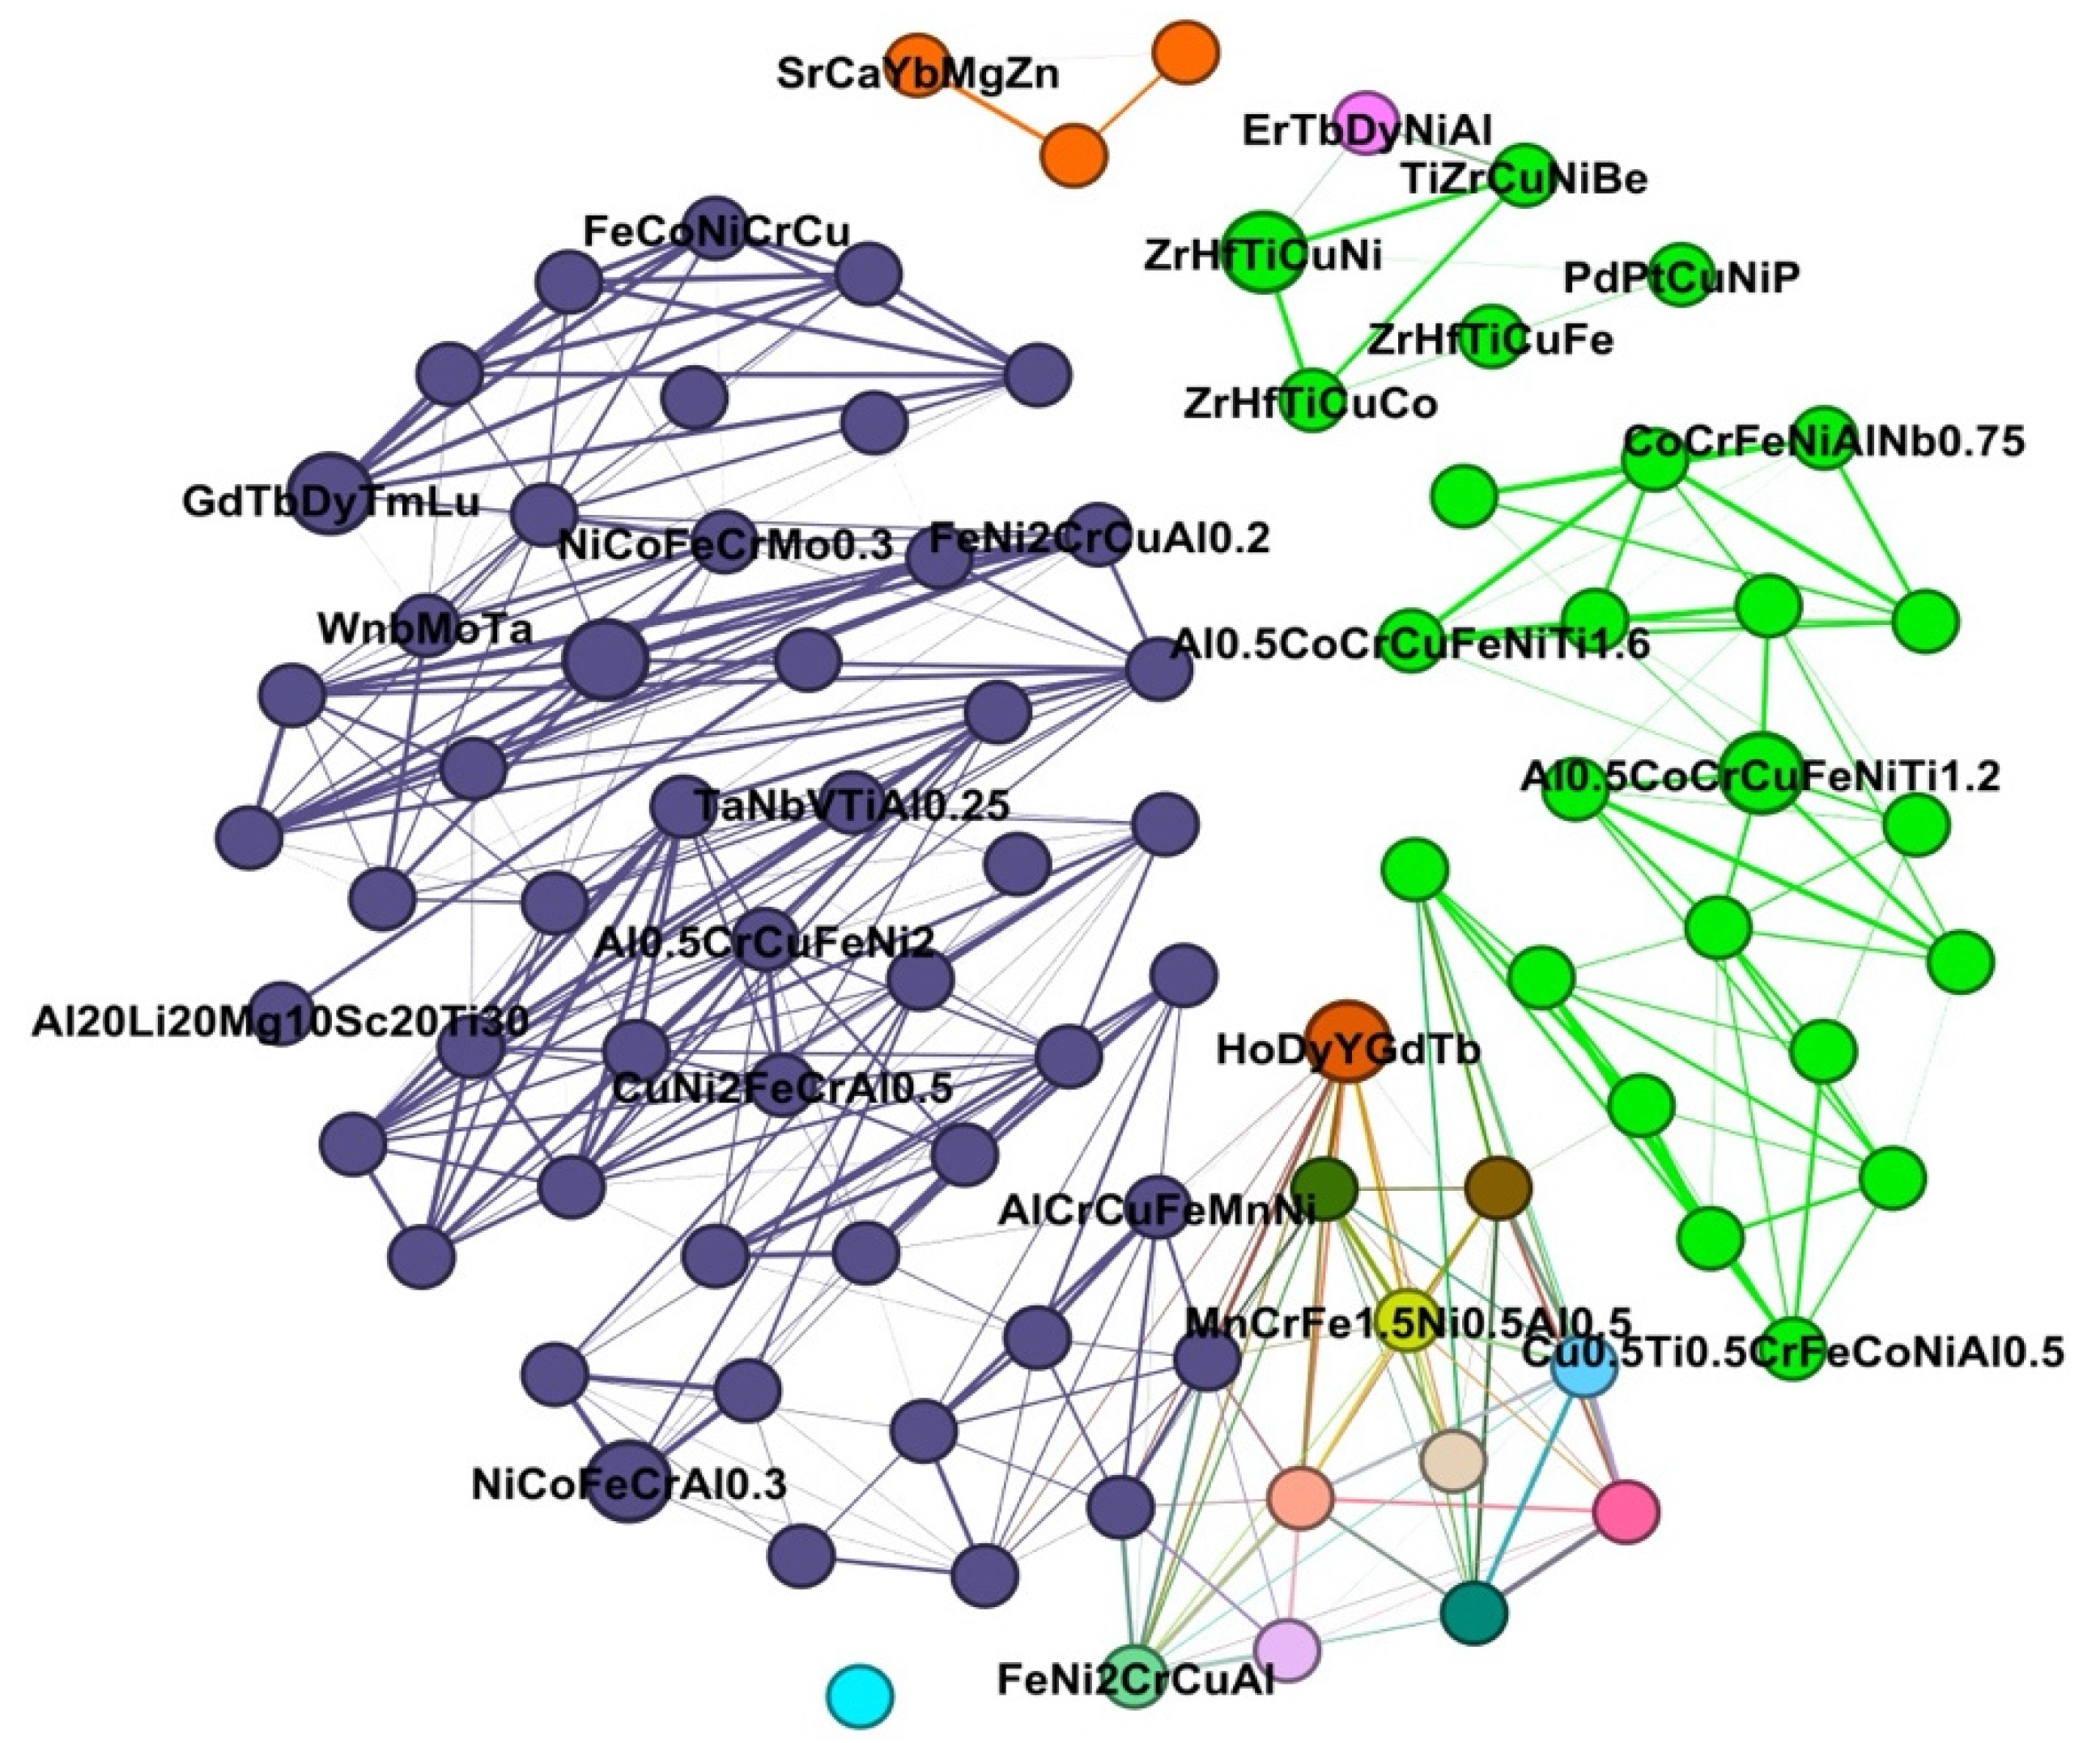
2. Materials and Methods

2.1. Theoretical Notation Definitions

Some required definitions and notations are given in the following.
  • Social network graph. A social network can be mapped to the graph G ( V , E ) , where V is the node set and E is the edge set.
  • Neighbors. A node u is a neighbor of node v in graph G = ( V , E ) if there is an edge { u , v } E .
  • HEA interaction network. The HEA compounds are nodes, and the interaction between two compounds are edges that are mapped into a social network [19].
  • Target compound. The node considered for phase prediction in the HEA interaction network is called the target compound.
  • Voting. The HEA compound is classified by a plurality vote of its neighbors in the KNN algorithm, with the HEA compound being assigned to the phase most common among its k-nearest neighbor.

2.2. Proposed Method

Each graph consists of nodes and edges that form a social network. Each node can be a member of the network that communicates with other members. This study used the HEA interaction network that was created in our previous work. To construct the HEA interaction network, the properties of each compound were first investigated, and the content cosine similarity of each pair of descriptors was calculated via Equation (1). Then, the structural Jaccard similarity of the descriptor of each compound was obtained via Equation (2). The hybrid similarity criterion was created from the cosine content similarity parameter and the Jacquard structural similarity parameter via Equation (3). The alpha coefficient determined the effect of each similarity parameter on the hybrid similarity. The similarity showed the weight between two compounds obtained from the hybrid similarity. A threshold (Th) was then applied to the HEA interaction network which was obtained by trial and error, and it eliminated weaker connections with less weight to obtain a network with strong connections. Relationships between HEA compounds were interactions based on hybrid similarity. Greater weight implied more similarities called strong connections. Thus, in the built-in HEA interaction network, each node represented an HEA compound, and their relationship was the hybrid similarity of the HEA compounds with each other [19].
c o n t e n t   c o s i n e   s i m i l a r i t y ( x , y ) = i ( x i y i ) i x i 2 i y i 2
s t r u c t u r a l   J a c c a r d   s i m i l a r i t y ( v i , v j ) = | N i   N j | | N i   N j |
H y b r i d   s i m i l a r i t y = α ( i ( x i y i ) i x i 2 i y i 2 ) + ( 1 α ) ( | N i   N j | | N i   N j | )
where x i represents the ith descriptor of the first compound, and y i is the ith descriptor of the second compound. Additionally, | N i   N j | denotes the common features of the two compounds, and | N i   N j | are all the descriptors. The N i is defined as N i = { j   |   e ( i , j ) T h } in the HEA interaction network.
We set T h   = 0.98 for content cosine similarity to determine more similar descriptors.
The traditional KNN algorithm is a lazy algorithm that does not make any models until the unseen data are imported. It uses the dataset to calculate the similarity between new data and records in the dataset. Then, it predicts an unseen data label by voting the most similar samples.
The novelty of this study is the HEA compound phase prediction via the graph-based k-nearest neighbor (KNN) algorithm using the HEA interaction network. The proposed approach first selects all the neighbors of each compound in the network. The compound neighbors are described as [ v 1 v 2 v n ] T , where the compounds v i s are sorted in a descending order based on their weight with the target compound. Then, we used the k first compounds of v i s and predicted the target compound phase by plurality vote. Figure 1 illustrates the proposed approach. The proposed method uses the set of related descriptors and creates an HEA interaction network based on the similarity between HEA compounds. The same colors in Figure 1b indicate the extracted communities from the HEA network. Figure 1c shows an extracted community as an example. Figure 1d illustrates the selection of the most similar neighbors of the target compound for phase prediction. Finally, it predicts the composition phase. The challenge considered is, if there are a compound’s neighbors in the testing set, it cannot used for voting in phase prediction because its phase is unknown due to their presence on the testing set. Therefore, to deal with this problem, the proposed approach must consider a condition that if a neighbor exists in the testing set, the proposed approach should increase the number of k for neighbors’ selection as long as all the selected neighbors are from the training set.
The dataset used in this study referred to Table 1 in [1] that the HEA interaction network is made on [19]. This dataset contained 90 HEA compounds with seven descriptors which were grouped into five phases including FCC, BCC, HCP, Multiphase, and Amorphous. The descriptors included δ , Δ H m i x ( kJ / mol ) , S c ( k B   p e r   a t o m ) , φ , ε R M S , and VEC, which expressed the atomic size difference, mixing enthalpy, configurational entropy, thermodynamic, energy storage density, and valence electron concentration, respectively.
The compounds connected to the target compound are called neighbors. The number of k was determined by the trial-and-error method. The number of k means the number of neighbors that were selected for voting. Since the model was trained according to the method described above, it predicted the phase.

2.3. Evaluation

The confusion matrix analyzes the expected number of phases. The confusion matrix (CM) of size n x n related to a classifier shows the predicted and truth classification, where n is the number of various classes [20]. The correct prediction rate was achieved using the accuracy parameter from CM via Equation (4), as follows [21]:
A c c u r a c y = T P + T N T P + T N + F P + F N × 100 %
where the True Positive (TP) is the proportion of positive predictions that were correctly classified; the True Negative (TN) is defined as the proportion of negative predictions that were correctly identified; the False Positive (FP) is the proportion of positive predictions that were incorrectly classified; and the False Negative (FN) is the proportion of negative predictions that were incorrectly identified [21].
The proposed approach was evaluated using the k-fold random subsampling method that randomly selected a testing set and a training set [22]. This method was repeated k times. The learning function was for each training set. Notice that the training set and testing set were independent, meaning both sets did not have any common compound [22].

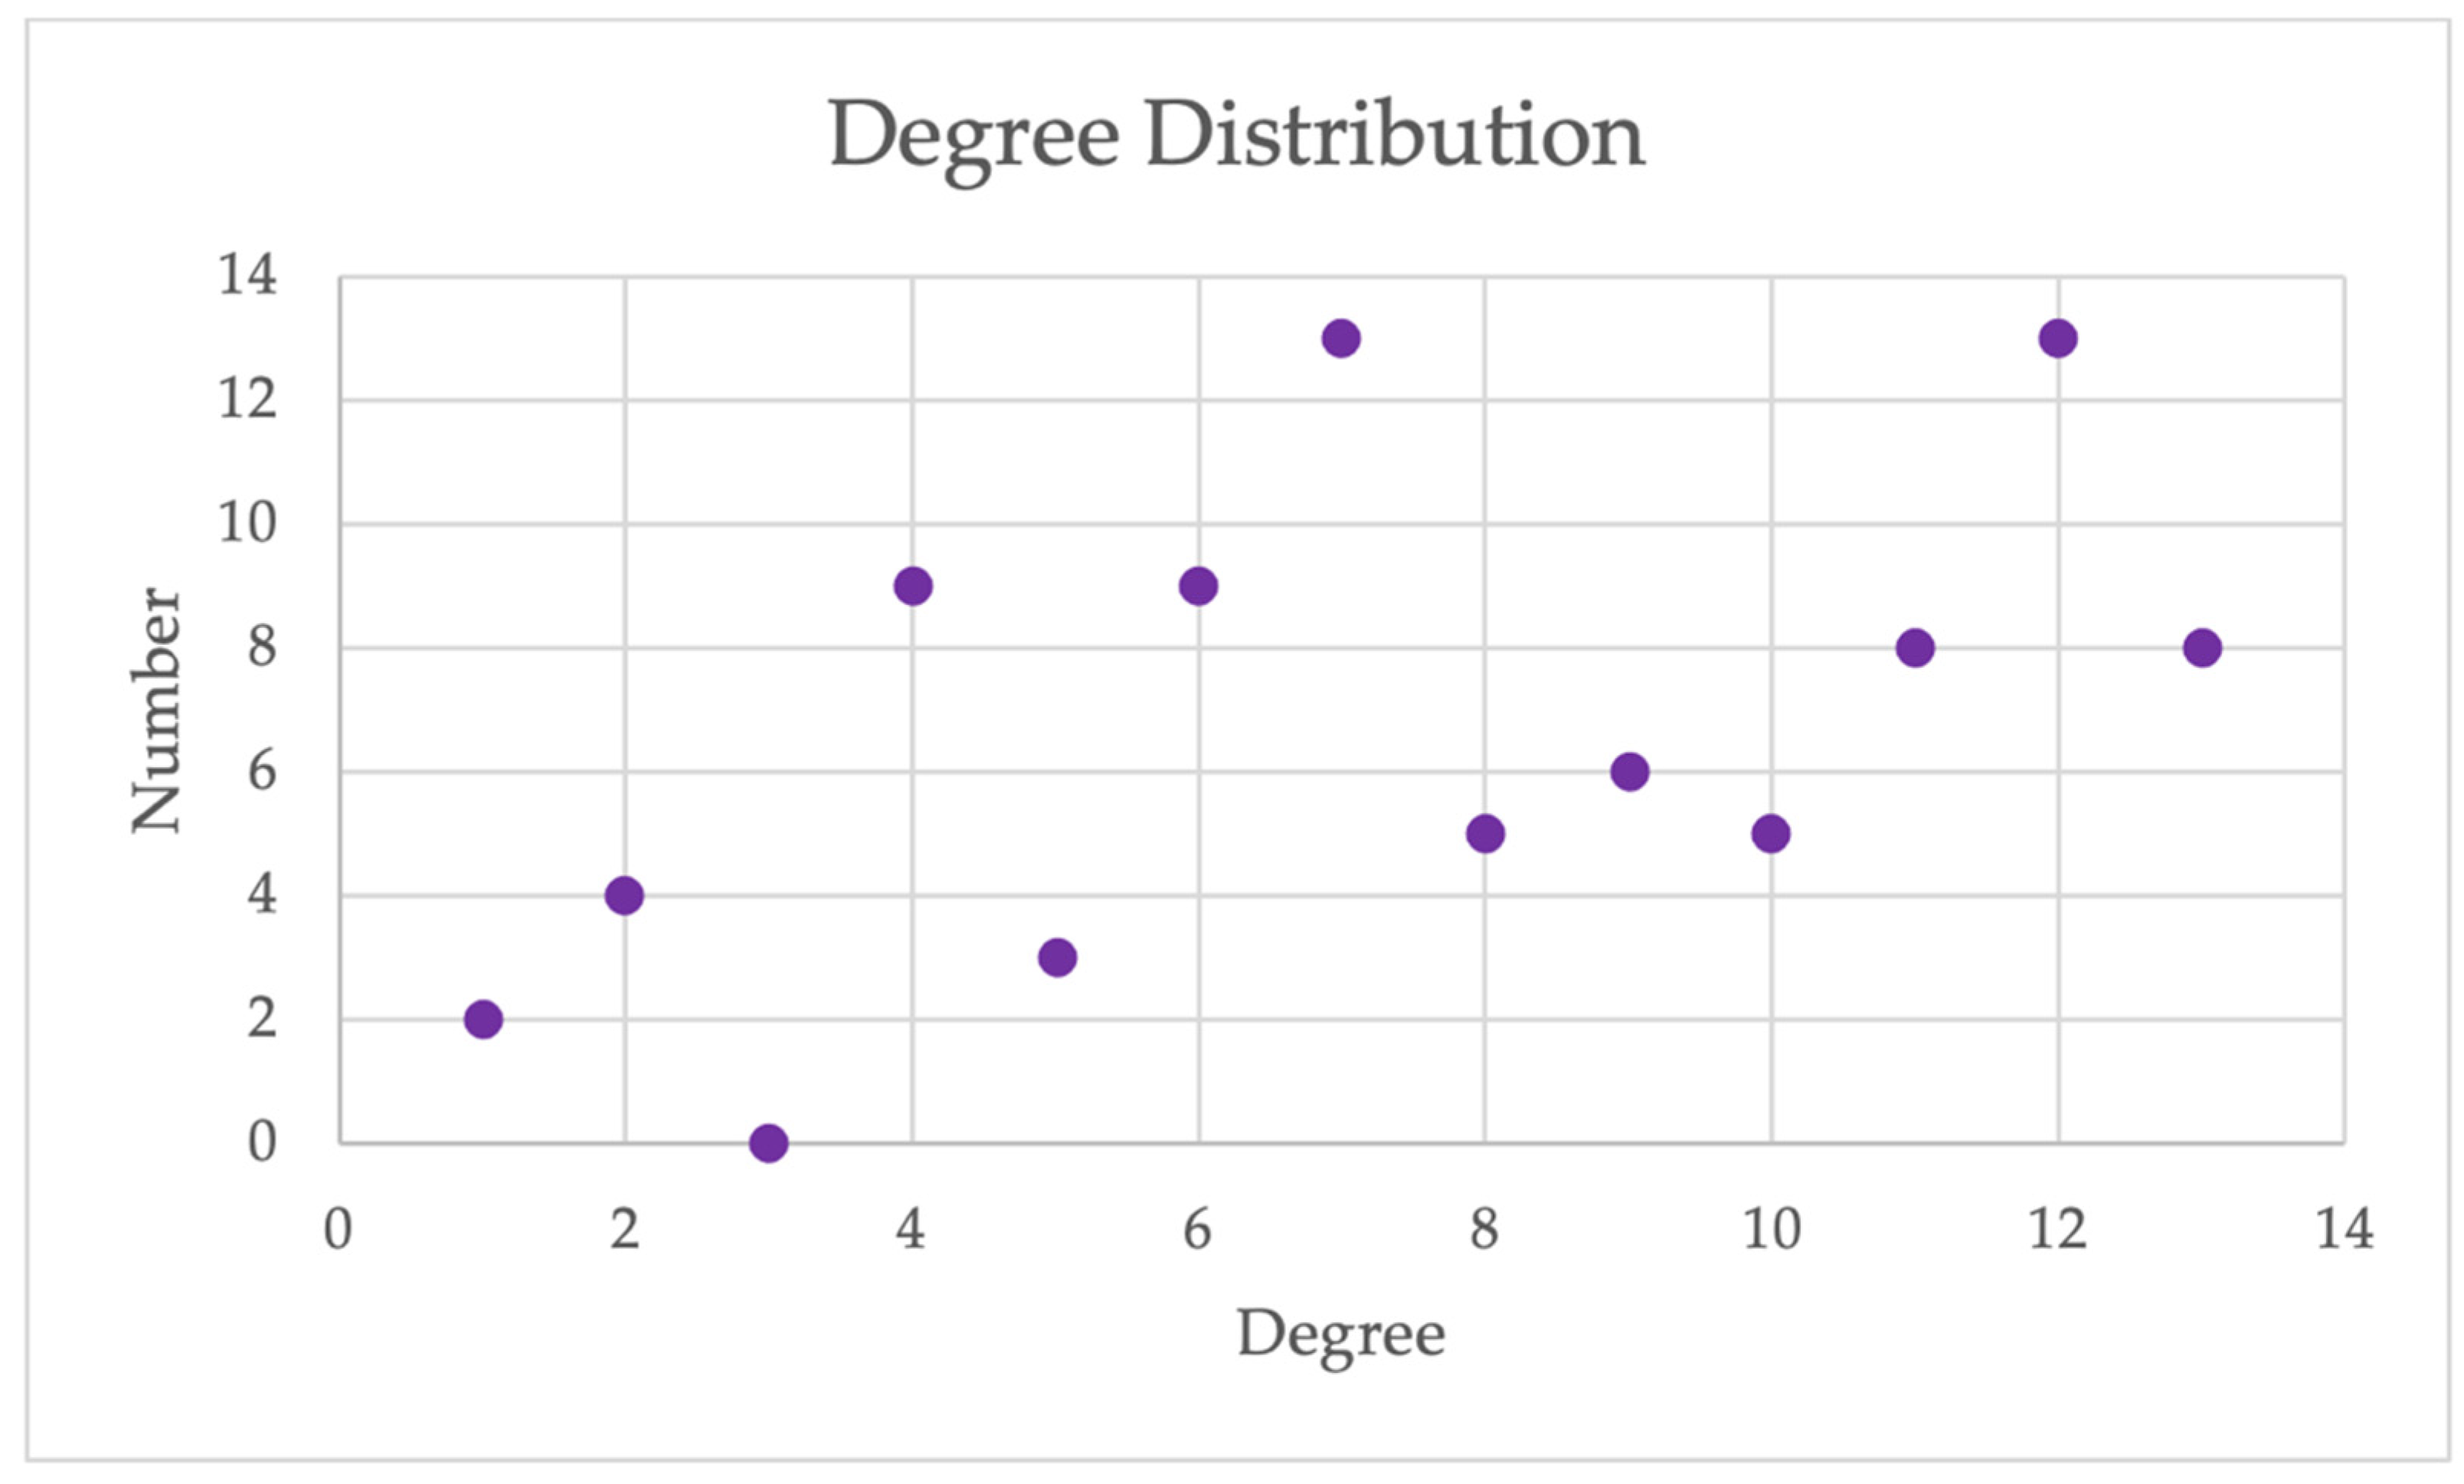
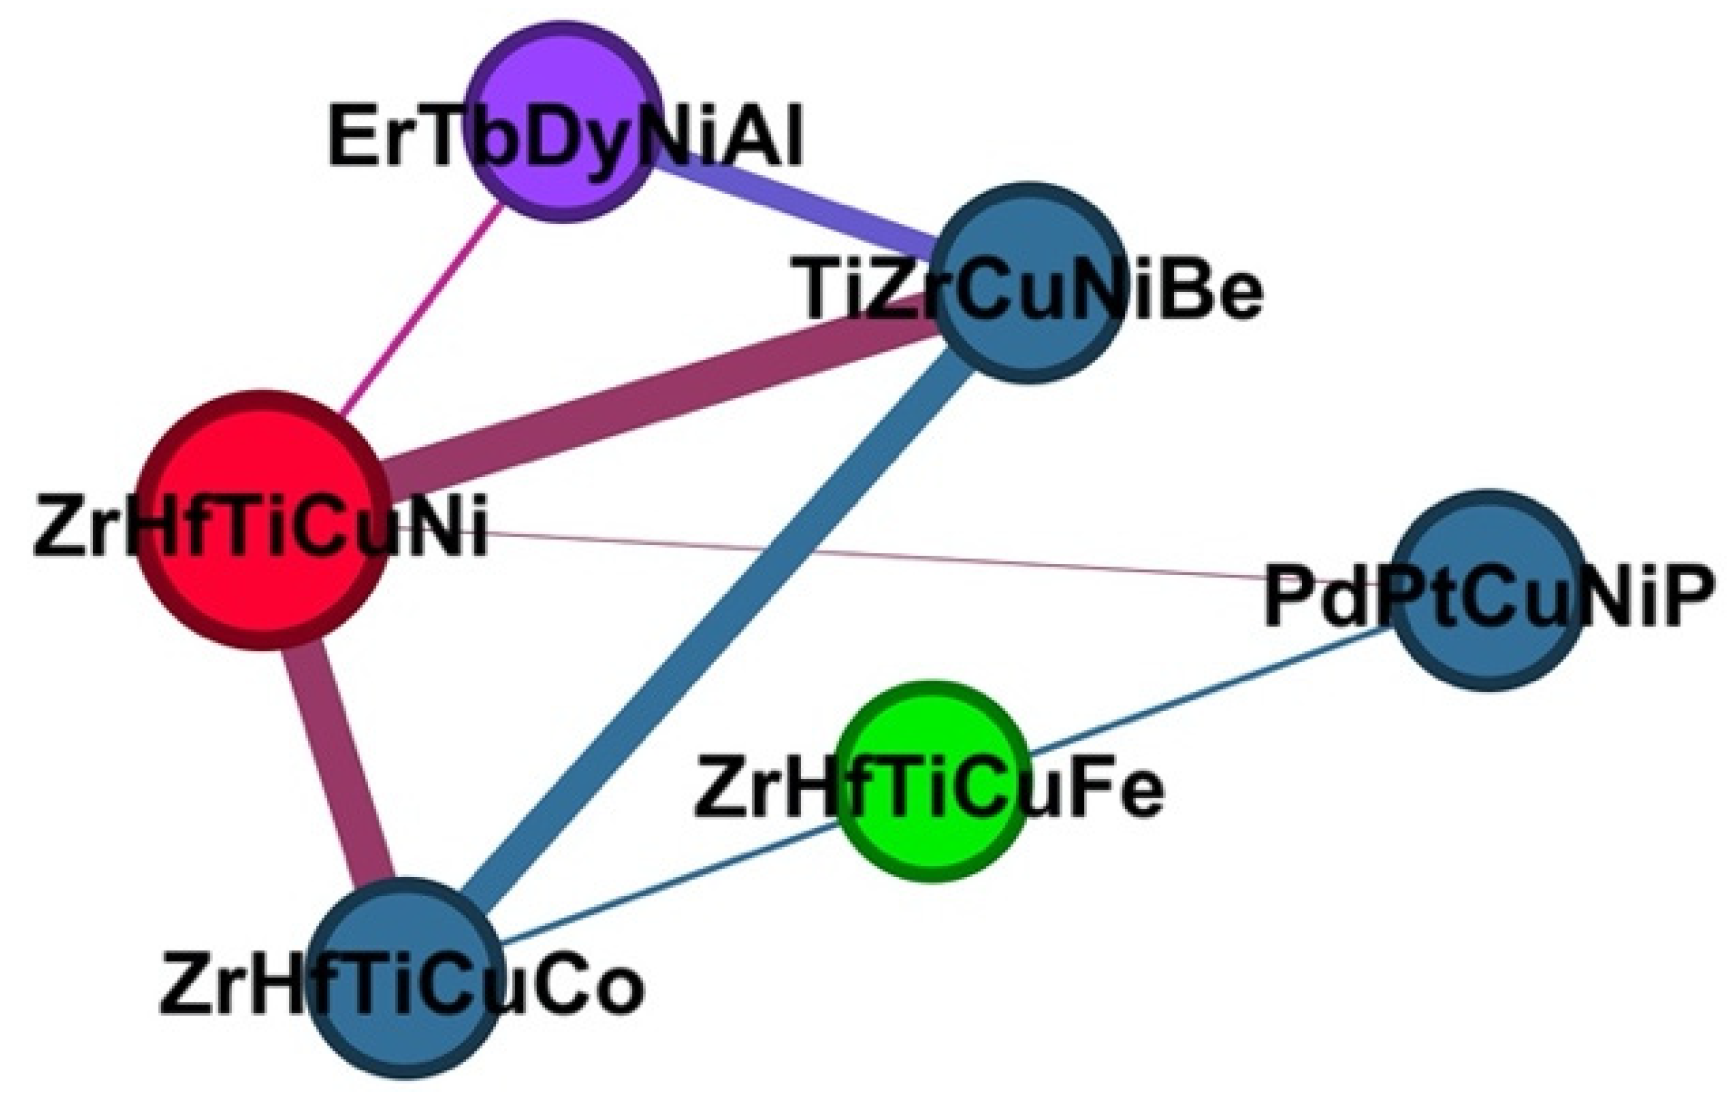
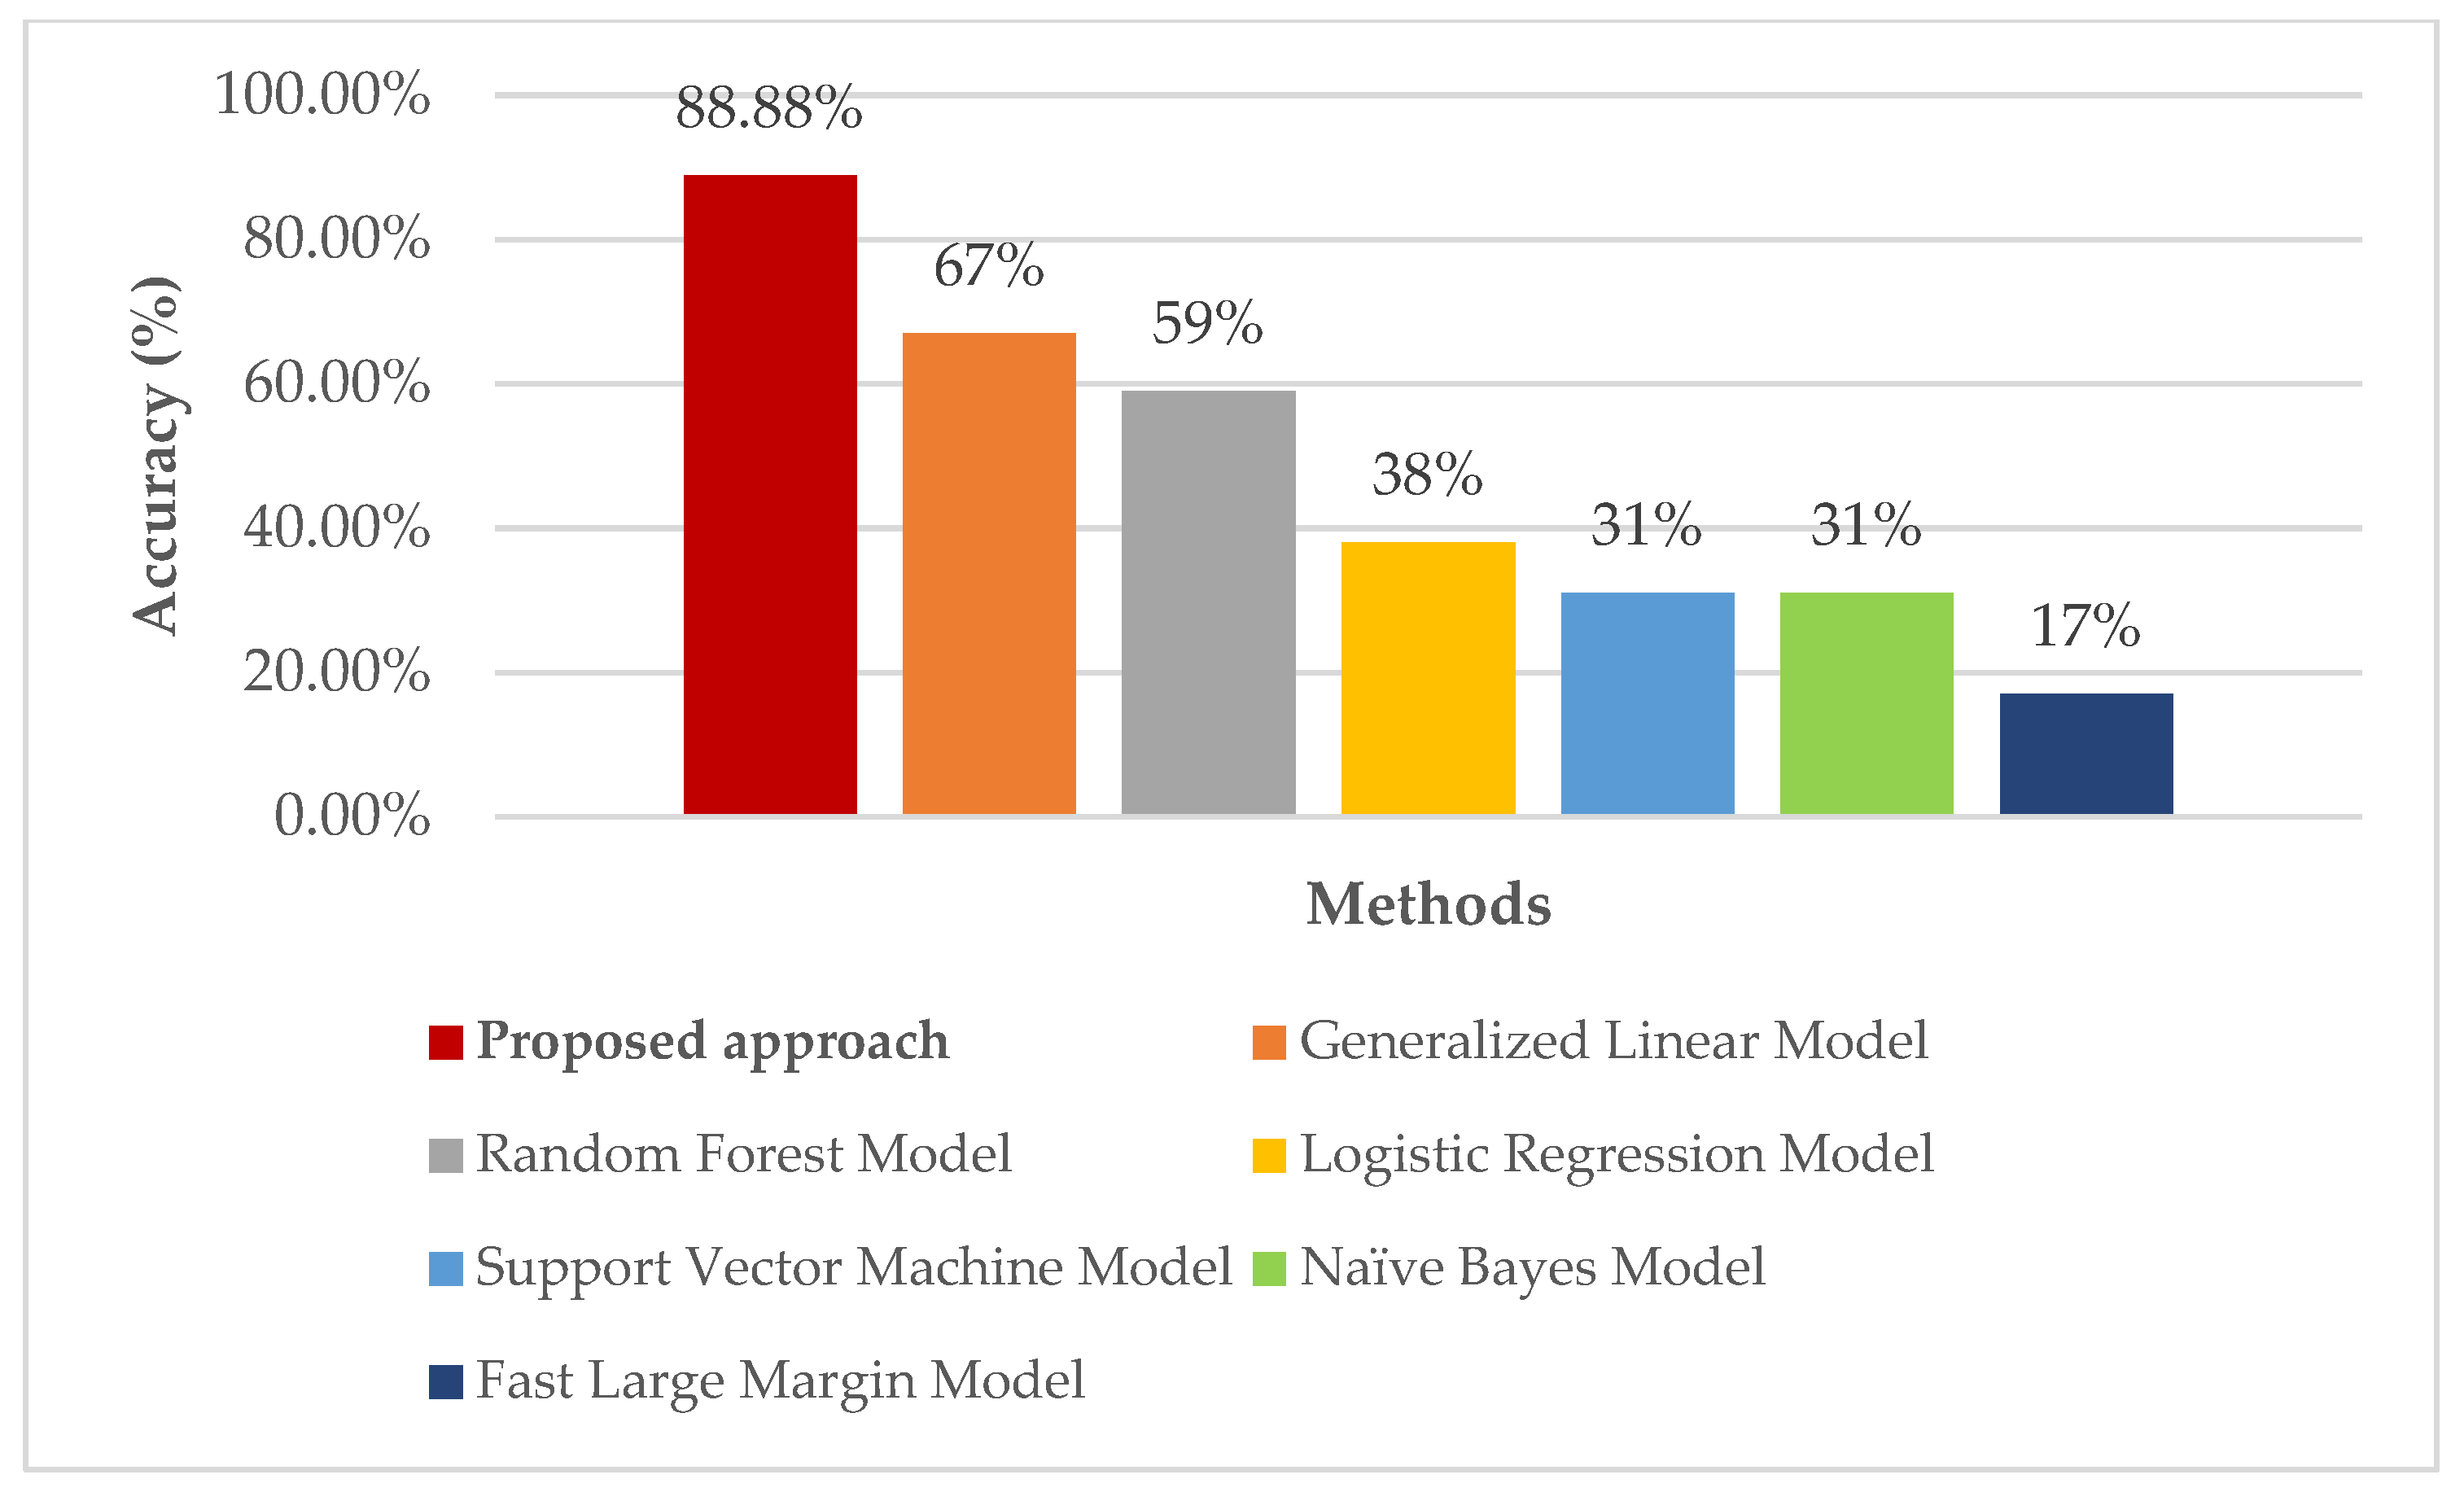
3. Results and Discussion

The HEA interaction network was created using Gephi software version 0.9 based on a Fruchterman Reingold layout, as shown in Figure 2. Each node in the HEA graph was a HEA compound. Figure 2 shows a portion of the HEA interaction network in which some connections were filtered for the clarity of the network presentation. As shown in Figure 2, each node in the HEA network is displayed in a specific color and size. Nodes with the same color placed in the same community are more similar. Using the communities in the HEA network, the nearest neighbors of each node were determined. The size of the node circle in Figure 2 indicates the number of connections for each compound to others. Each node with more relations to its neighbors is illustrated by a larger circle. The gradient color of each color for the edges in Figure 2 shows the strength of the connection. The strong relations are indicated by darker and thicker lines. The degree of a node in an HEA network is the number of connections it has to other nodes. The degree distribution is the probability of the distribution of these degrees over the whole network. The degree distribution shows the average connections of each node, which expresses the number of neighbors of each node. The HEA network degree distribution is shown in Figure 3 and was obtained at 8.212.
The KNN algorithm was applied to select the k-nearest neighbor algorithm in the HEA network. Finally, the phase was predicted with high precision via plurality voting. The value of k considered in this study was three, that is, three neighbors were used for phase prediction. Figure 4 is a portion of the network that shows the target node in red and its nearest neighbors in dark blue. It predicts the phase of the target node based on the nearest neighbors. The relation between the KNN-based ML approach’s accuracy and the HEA interaction network is finding the nearest neighbors in the network for phase prediction. Figure 4 is an example. Suppose that a new compound is introduced that is not available in the dataset, and its phase is unknown. The phase prediction process is such that first, the compound location is found in the interaction network to identify its connections with its neighbors. Then, the phase is predicted by KNN-based analysis. Assume that ZrHfTiCuNi in Figure 4 is a compound with an unknown phase. The compound ZrHfTiCuNi has four neighbors which are listed as follows: ErTbDyNiAl by weight 0.8192, TiZrCuNiBe by weight 0.9998, PdPtCuNiP by weight 0.8191, and ZrHfTiCuCo by weight 0.8498. The node’s neighbors list is sorted in descending order of their connection weight. It selects three of the nearest neighbors in dark blue. The proposed approach correctly predicts the ZrHfTiCuNi phase as Amorphous. Figure 4 shows the stronger connections of each compound with thicker lines, and the compound with the largest circle has more neighbors.
The accuracy of 88.88% was achieved using the k-fold random subsampling method. Model performance was used for 27 compounds in the testing set, of which, the phase of 18 compounds was correctly predicted, and 9 compounds were not correctly predicted based on the confusion matrix.
The proposed approach predicts the phase of unseen data. It was compared with six other methods, as shown in Figure 5. The Fast Large Margin model has one-fifth of the accuracy of the proposed approach, which had the worst accuracy in phase prediction. The Support Vector Machine (SVM) and Naïve Bayes model perform the prediction with equal accuracy, which is about twice that of the Fast Large Margin model. The SVM performed classification and regression in supervised learning. The Naïve Bayes Model is conditional-probability-based. The phase prediction by the Logistic Regression model is better than the Fast Large Margin model, the SVM, and the Naïve Bayes model. The Logistic Regression model predicts about 50% less accurately than the proposed approach. The Logistic Regression Model is proper for Boolean variables. The four mentioned methods have less than half the accuracy of the proposed approach. The Random Forest model and Generalized Linear model perform 11% and 19% less accurately than proposed approach. The Generalized Linear Model is linear regression generalization for data that do not have normal distribution. A regression is a hybrid learning method for the classification of data that are too great in number for a decision tree. The structure of a decision tree for learning time and classification is independent of the Random Forest model. The proposed approach outperforms all of the other methods supremely. The comparison in Figure 5 shows the proposed approach has a higher accuracy as compared to the other methods.

4. Conclusions and Future Directions

In this study, ML methods using the HEA interaction network were improved for phase prediction. A method presented in this study predicted the phase using the KNN algorithm based on a graph. The proposed approach was compared with six other methods, and the accuracy (88.88%) of the proposed approach was considerably higher than that of the others. The phase prediction with the proposed method was about 11% and 19% more accurate than the Generalized Linear model and Random Forest model, respectively. The HEA compound design and feature selection has potential scope. The compound phase expresses the state of matter that is affected in determining their application. The conclusions are explained as follows: (i) the proposed approach employed the HEA interaction network for phase prediction; (ii) neighbors with strong connections have more similarity to the target compound for prediction; (iii) the learning performance of the proposed approach is comparable to other ML methods; (iv) finally, phases were predicted and validated. The proposed approach is scalable on different datasets with accuracy preservation. Our future work will focus principally on raising the efficiency of the ML methods for HEA phase prediction and connection prediction.

Author Contributions

Conceptualization, R.G.N.N.N., M.J. and M.H.; methodology, R.G.N.N.N., M.J. and M.H.; software, R.G.N.N.N., M.J. and M.H.; validation, R.G.N.N.N., M.J. and M.H.; formal analysis, R.G.N.N.N., M.J. and M.H.; investigation, R.G.N.N.N., M.J. and M.H.; resources, R.G.N.N.N., M.J. and M.H.; data curation, R.G.N.N.N., M.J. and M.H.; writing--original draft preparation, R.G.N.N.N., M.J. and M.H.; writing—review and editing, R.G.N.N.N., M.J. and M.H.; visualization, R.G.N.N.N., M.J. and M.H.; supervision, M.J.; project administration, M.J.; funding acquisition, M.J. All authors have read and agreed to the published version of the manuscript.

Funding

This research received no external funding.

Institutional Review Board Statement

Institutional review board is not applicable to this study.

Informed Consent Statement

Information consent was obtained from all subjects involved in the study.

Data Availability Statement

Data availability is contained within the article.

Acknowledgments

The authors acknowledge funding by Federal Ministry of Education and Research of Germany for the project STREAM (“Semantische Repräsentation, Vernetzung und Kuratierung von qualitätsgesicherten Materialdaten”, ID: 16QK11C). Furthermore, the authors acknowledge support by the KIT-Publication Fund of the Karlsruhe Institute of Technology.

Conflicts of Interest

The authors declare no conflict of interest.

References

  1. Ye, Y.; Wang, Q.; Lu, J.; Liu, C.; Yang, Y. High-entropy alloy: Challenges and prospects. Mater. Today 2016, 19, 349–362. [Google Scholar] [CrossRef]
  2. Risal, S.; Zhu, W.; Guillen, P.; Sun, L. Improving phase prediction accuracy for high entropy alloys with machine learning. Comput. Mater. Sci. 2021, 192, 110389. [Google Scholar] [CrossRef]
  3. Sheng, G.; Liu, C.T. Phase stability in high entropy alloys: Formation of solid-solution phase or amorphous phase. Prog. Nat. Sci. Mater. Int. 2011, 21, 433–446. [Google Scholar]
  4. Chang, Y.-J.; Jui, C.-Y.; Lee, W.-J.; Yeh, A.-C. Prediction of the composition and hardness of high-entropy alloys by machine learning. JOM 2019, 71, 3433–3442. [Google Scholar] [CrossRef]
  5. Chanda, B.; Jana, P.P.; Das, J. A tool to predict the evolution of phase and Young’s modulus in high entropy alloys using artificial neural network. Comput. Mater. Sci. 2021, 197, 110619. [Google Scholar] [CrossRef]
  6. Dixit, S.; Singhal, V.; Agarwal, A.; Rao, A.P. Multi-label phase-prediction in high-entropy-alloys using Artificial-Neural-Network. Mater. Lett. 2020, 268, 127606. [Google Scholar] [CrossRef]
  7. Machaka, R. Machine learning-based prediction of phases in high-entropy alloys. Comput. Mater. Sci. 2021, 188, 110244. [Google Scholar] [CrossRef]
  8. Wu, L.; Liu, L.; Wang, Y.; Zhai, Z.; Zhuang, H.; Krishnaraju, D.; Wang, Q.; Jiang, H. A machine learning-based method to design modular metamaterials. Extrem. Mech. Lett. 2020, 36, 100657. [Google Scholar] [CrossRef]
  9. Agarwal, A.; Prasada Rao, A. Artificial intelligence predicts body-centered-cubic and face-centered-cubic phases in high-entropy alloys. JOM 2019, 71, 3424–3432. [Google Scholar] [CrossRef]
  10. Krishna, Y.V.; Jaiswal, U.K.; Rahul, M. Machine learning approach to predict new multiphase high entropy alloys. Scr. Mater. 2021, 197, 113804. [Google Scholar] [CrossRef]
  11. Jalali, M.; Tsotsalas, M.; Wöll, C. MOFSocialNet: Exploiting Metal-Organic Framework Relationships via Social Network Analysis. Nanomaterials 2022, 12, 704. [Google Scholar] [CrossRef] [PubMed]
  12. Rickman, J.; Balasubramanian, G.; Marvel, C.; Chan, H.; Burton, M.-T. Machine learning strategies for high-entropy alloys. J. Appl. Phys. 2020, 128, 221101. [Google Scholar] [CrossRef]
  13. Bhandari, U.; Rafi, M.R.; Zhang, C.; Yang, S. Yield strength prediction of high-entropy alloys using machine learning. Mater. Today Commun. 2021, 26, 101871. [Google Scholar] [CrossRef]
  14. Wen, C.; Wang, C.; Zhang, Y.; Antonov, S.; Xue, D.; Lookman, T.; Su, Y. Modeling solid solution strengthening in high entropy alloys using machine learning. Acta Mater. 2021, 212, 116917. [Google Scholar] [CrossRef]
  15. Qiao, L.; Liu, Y.; Zhu, J. A focused review on machine learning aided high-throughput methods in high entropy alloy. J. Alloys Compd. 2021, 877, 160295. [Google Scholar] [CrossRef]
  16. Lee, S.Y.; Byeon, S.; Kim, H.S.; Jin, H.; Lee, S. Deep learning-based phase prediction of high-entropy alloys: Optimization, generation, and explanation. Mater. Des. 2021, 197, 109260. [Google Scholar] [CrossRef]
  17. Yan, Y.; Lu, D.; Wang, K. Accelerated discovery of single-phase refractory high entropy alloys assisted by machine learning. Comput. Mater. Sci. 2021, 199, 110723. [Google Scholar] [CrossRef]
  18. Jaiswal, U.K.; Krishna, Y.V.; Rahul, M.; Phanikumar, G. Machine learning-enabled identification of new medium to high entropy alloys with solid solution phases. Comput. Mater. Sci. 2021, 197, 110623. [Google Scholar] [CrossRef]
  19. Ghouchan Nezhad Noor Nia, R.; Jalali, M.; Mail, M.; Ivanisenko, Y.; Kübel, C. Machine Learning Approach to Community Detection in a High-Entropy Alloy Interaction Network. ACS Omega 2022, 7, 12978–12992. [Google Scholar] [CrossRef]
  20. Visa, S.; Ramsay, B.; Ralescu, A.L.; Van Der Knaap, E. Confusion matrix-based feature selection. MAICS 2011, 710, 120–127. [Google Scholar]
  21. Armah, G.K.; Luo, G.; Qin, K. A deep analysis of the precision formula for imbalanced class distribution. Int. J. Mach. Learn. Comput. 2014, 4, 417–422. [Google Scholar] [CrossRef] [Green Version]
  22. Berrar, D. Cross-Validation. In Reference Module in Life Sciences; Elsevier: Amsterdam, The Netherlands, 2019. [Google Scholar]
Figure 1. An example of the proposed method for phase prediction in HEAs. In Step (a), we extracted the related features/descriptors from the HEA database, and then (b) created an interaction network based on the similarities between HEAs. (c) In this examplem ZrHfTiCuNi alloy is considered as a phase prediction sample, hence related community of this HEAs is extracted from the interaction network. (d) The ZrHfTiCuNi has four neighbors; therefore, three of them were selected which are highlighted in dark blue if k is three. (e) Finally, phase can be predicted by voting on neighbors’ labels as Amorphous for ZrHfTiCuNi.
Applsci 12 08021 g001
Figure 2. A portion of the HEA interaction network with Fruchterman Reingold layout. Nodes with a larger circle have more neighbors, which indicates a stronger relationship.
Applsci 12 08021 g002
Figure 3. The probability distribution of the degree of a node in an HEA network is the distribution of connections it has to other nodes which is called degree distribution.
Applsci 12 08021 g003
Figure 4. Part of the HEA interaction network with compounds neighbors. The ZrHFTiCuNi alloy is a sample with three of the most similar neighbors, as shown in dark blue.
Applsci 12 08021 g004
Figure 5. The comparison of the proposed approach comparison with other models; its prediction is more precise.
Applsci 12 08021 g005
Publisher’s Note: MDPI stays neutral with regard to jurisdictional claims in published maps and institutional affiliations.

