1. Introduction
Artificial neural networks (ANN) are an attempt to simulate the structure and functions of the brain specific to living organisms. A key feature of these is the fact that, starting from a lot of examples, a certain model of the problem can be synthesized. The neural network practically builds its own algorithm in solving a problem, if it is trained by providing multiple particular cases, from which it extracts the necessary information. Based on the collected data, the network is trained, i.e., the process behavior is memorized. During the work or reference stage, the network will use the acquired information to process similar situations like those involved in the training set. This represents the ability to generalize, based on which the ANN can operate correctly with data that were not presented during the training process [
1].
The most commonly used networks are those with forward propagation. They are characterized by the presence of a layer of input neurons, a number of hidden layers, and a layer of output neurons. Networks have the ability to learn from examples, which makes them highly flexible and stable in medical diagnosis. They have the ability to generalize and operate with data different from those presented in the training stage. The back propagation algorithm is also called the generalized delta algorithm because it extends the method of the adaline network (delta rule), and it is based on the difference between the desired and the real output, driven by the descending gradient method (the gradient tells us how a function varies in different directions). ANNs have been widely used not only in industry but also in scientific research to perform various tasks: data processing, shape recognition, and medical diagnosis. Neural networks were defined and introduced for the first time between 1950 and 1951 [
2]. They have been widely used in various fields such as cardiology, oncology, and ophthalmology. Due to their predictive role, they have been used to diagnose sick patients in clinical practice [
3,
4,
5,
6].
In ophthalmology, the detection of visual function abnormalities plays a key role in diagnosing eye diseases. Most neural networks have been used to measure retinal structures and visual function. Joseph Caprioli et al. [
7,
8,
9,
10,
11] used various artificial intelligence tools (neural networks and genetic algorithms) to determine a possible progression of the visual field in glaucoma patients, to classify changes in diabetic retinopathy (presence or absence of signs of retinopathy) and glaucoma stage [
1,
11,
12].
The most common use of neural networks in ophthalmology has been in early diagnosis of glaucoma, when a doubtful diagnosis occurred. Neural networks have played an essential role in determining the need for early antiglaucoma therapy to prevent disease progression [
13]. Applications that involve a neural network driven by data from medical records are intended to help physicians, not to replace them. A neural network generates a rule based on a large volume of input data. They provide the information needed for patient care and increase the amount of information available to a doctor. Developing a system that uses a neural network to help a physician is difficult because valid training data is needed, which the network can use to generate rules [
1].
In its simplest version, the structure of a neural network involves three layers. The network receives the input vector and propagates the signal forward, layer by layer, until the output is generated. The error signal is propagated back from the output layer to the input layer, adjusting the network weights. With a possible infinite number of neurons, the network can approximate any real constant function [
1].
However, the use of an additional layer can greatly decrease the number of neurons needed in the hidden layers and, obviously, can increase the modeling performance. The choice of the best number of hidden units depends on many factors: the size of the database, the type of activation function, the used training algorithm, etc. The only way to establish it is to try several networks with different numbers of hidden units and evaluate their performance [
13,
14].
The most commonly used type of neural network is the multilayer perceptron (MLP) and feed-forward neural network, its frequent use being based on simplicity and the good results it provides in most cases. It is considered to be a universal approximator because it can model (render) any type of function and the signals are transmitted inside the network in one direction only: from input to output. There are no loops, the output of each neuron does not affect that neuron. This architecture is called feed-forward.
The mean square error (MSE), the correlation coefficient (r2), and the percentage error Ep (%) are used as criteria for choosing the best topology. The key step is to validate the network, in which the answers given by them are verified by data in which they were not involved. The network topology was encoded by (m:n:p): m represents the number of neurons in the input layer, n the number of neurons in the hidden neuron layer, and p the number of neurons in the output layer.
A neural network is performing if MSE (mean square error) tends to zero and r2 (correlation coefficient) tends to 1.
Artificial intelligence (AI) is the fourth industry to revolutionize human history. AI tools have been highlighted for their efficiency in modeling and optimization, the most widely used being ANN, evolutionary algorithms, and fuzzy systems [
15]. Their application in medicine and especially in ophthalmology is a promising direction due to the predictions that could complete the clinical observations. Glaucoma is an eye disease that is difficult to understand, with difficulties in providing accurate and timely diagnosis and early prognosis. The most common use of neural networks in ophthalmology occurred in early diagnosis of glaucoma, when there is some doubt about the diagnosis. Neural networks have played a key role in determining the need for early antiglaucoma therapy to prevent disease progression. The first article that mentions the use of artificial neural networks is that of Anton A. et al., which consists of the use of ANN in interpreting the incipient perimeter lesions produced in glaucoma. The authors concluded that neural networks are able to differentiate incipient glaucoma lesions from those caused by other diseases with 97% accuracy [
16].
There is still no algorithm that can guarantee the creation of an optimal network, because optimizing the network architecture must meet several requirements:
- -
The “perfect” network must provide reliable predictions, avoid excessive training, ensure fast convergence, minimize training time, provide a better understanding of the process that generates data (facilitating the extraction of rules), and reduce time and the cost of data collection and processing
- -
An optimal network must be large enough to learn the basic function, and small enough to generalize successfully.
The most common use of neural networks in ophthalmology has been in early diagnosis of glaucoma, when there is some doubt about the diagnosis having a key role in determining the need to initiate early antiglaucoma therapy to prevent disease progression. In 2008, Parsaei H et al. used various artificial intelligence tools (neural networks and learning algorithms) to determine a possible visual field progression in glaucoma patients. Recent studies indicate that AI has an astounding potential to perform some tasks much better than human beings, especially in the image recognition field. The authors presented the basic workflow for building an AI model and systematically reviewed applications of AI in diagnosing eye diseases. [
10,
16,
17].
In 2014, Zhu et al. developed a neural network using a Bayesian function to establish the relationship between structure and visual function in glaucoma; the results showed that the network could improve the prediction of visual function. Based on the analysis of the literature, the same team shows that diabetes is an individual risk factor for the development of open-angle glaucoma [
18]. Another study conducted in 2008 by Parsaei H., Moradi P.H., and Parsaei Roya uses artificial neural networks to classify changes in the visual field in glaucoma by using classification tools and the results are comparable to global ones [
17].
An interesting study on the usefulness of ANN in ophthalmology can be found in a doctoral thesis conducted by Anton Apreutesei Nicoleta at UMF Iași. Artificial neural networks are used for the first time to demonstrate the relationship between glaucoma and diabetes, as well as to predict the progression of ocular changes in diabetes (diabetic retinopathy) in patients with glaucoma and diabetes. The constructed neural models demonstrated the possibility of their use in predicting MD (mean deviation) depreciation, the best results being obtained by using JEN networks (Jordan Elman type neural networks). Thus, the connection between diabetes and glaucoma is demonstrated by two types of applications of neural modeling: direct and reverse. By direct neuronal modeling, their influence on the ocular changes represented by the presence or absence of diabetic retinopathy is evaluated. Reverse modeling involves the inversion of some inputs and outputs: in this case the correlation was made between the mean deviation and the other characteristics at the input to which diabetic retinopathy was added. In this case, high accuracy was exhibited by Jordan Elman networks with the confidence interval of ±15% [
19].
The aim of this study was to construct neural models to predict the progression of glaucoma in patients associated with sleep apnea.
2. Materials and Methods
2.1. Study Group
The clinical study took place in the Ophthalmology Clinic of St. Spiridon Hospital and Oftaprof Clinic in Iaşi, during October 2018 and December 2019. The groups included patients with sleep apnea syndrome associated with glaucoma and dry eye syndrome. Neural network modeling was performed using the Neurosolutions commercial simulator. This can determine the number of hidden layers, the number of neurons in each layer, the different types of the activation function, and the driving algorithms. The built-in databases gather information on a group of patients with primitive open-angle glaucoma and normal-tension glaucoma, who have been associated with sleep apnea syndrome in various stages of severity (73 eyes).
The study was approved by the Ethics Commission of Sf. Spiridon University Hospital Iasi, approval no. 49/9.12.2018 in compliance with the ethical and deontological rules for medical and research practice. The study was conducted in accordance with the Helsinki Declaration and with several published principles.
All patients underwent the following determinations, according to a standardized protocol: the best corrected visual acuity (Snellen optotype), the Schirmer I test (without anesthetics); intraocular pressure (with the Goldmann applanation tonometry), OCT (optical coherence tomography Cirrus HD OCT Zeiss) with the evaluation of the optic nerve, macula, and measurement of the retinal nerve fiber layer, determination of the visual field (Humphrey perimeter—C24-2 program), measurement of the central corneal thickness (Tomey ultrasonic pachymeter), and the corneal hysteresis with ORA (ocular response analyzer, Reichert technology). Moreover, the respiratory functional parameters (apnea-hypopnea index—AHI) and body mass index were recorded. The age of the patients, sex, background data, and associated general conditions (hypertension, obesity, diabetes, etc.) were also recorded.
The data included in the database were divided as follows: 65 out of the 73 data points were used in the neural network training stage and 8 were kept for the testing stage. In total, 21 parameters were selected as input parameters for neural models, including: age of patients, BMI (body mass index), systolic and diastolic blood pressure, intraocular pressure, central corneal thickness, corneal biomechanical parameters (IOPcc, HC, CRF), AHI, desaturation index, nocturnal oxygen saturation, remaining AHI, type of apnea, and associated general conditions (diabetes, hypertension, obesity, COPD). The output parameters were: c/d ratio, modified visual field parameters (MD, PSD), OCT parameter (ocular computer tomography, ganglion cell layer thickness, linear CDR, and average GCL.
A new group of four patients was included in this study to make predictions with the best performing neural model. It included patients aged 75–88 years with sleep apnea syndrome, hypertension, three of them obese and without diabetes. The output parameters, c/d ratio, MD, PSD, linear CDR, and average GCL, were obtained from the neural model, which were then compared with the experimental values.
2.2. Neural Network Design
The most commonly used networks are those with forward propagation. They are characterized by the presence of a layer of input neurons, a number of hidden layers, and a layer of output neurons. Thus, networks have the ability to learn from examples, which makes them highly flexible and stable in medical diagnosis. They have the ability to generalize and operate with data different from those presented in the training stage.
In our study, artificial neural networks with forward propagation were built with 21 inputs, a layer with 7–35 hidden neurons, and 4 outputs. The method applied for the development of the network was trial and error.
Ep (%) were used as criteria for choosing the best network topology.
The network topology was coded by (m:n:p), where m represents the number of neurons in the input layer, n the number of neurons in the hidden neuron layer, and p represents the number of neurons in the output layer. A specialized software product, NeuroSolutions, was used to train neural networks. The generalization capacity of the constructed neural models was analyzed by the evolution of the MSE error on the validation data set. It has been established empirically that after about 50,000 epochs the performance of the models does not improve significantly, and the training process stopped at that moment. Accurate performance values differ from network to network, but an intuitive assessment can be made. Transfer functions such as SigmoidAxon were used, and the duration of the training process was less than 5 min. Modeling with neural networks involves going through a series of steps, the major ones being the training (learning the network) and validating the results of the network.
Modeling with neural networks involves the following steps, as described in
Figure 1. Input data with experimentally measured numerical values were considered as such, and those associated with the general condition of the patients were coded in a binary system (0/1).
2.3. Statistical Analysis
The database was created in the EXCEL program and was statistically processed with the SPSS 18.0 program. The ANOVA (analysis of variance) test, Student’s t test, χ2 test, Kruskal–Wallis test, non-parametric test comparing 3 or more groups, the study of the correlation between different phenomena performed using the “r” (Pearson) correlation coefficient, the receiver operating characteristic (ROC) curve highlighting the specificity/sensitivity balance as a prognostic factor, and logistic regression (multivariate analysis) were used as analytical tests.
4. Discussions
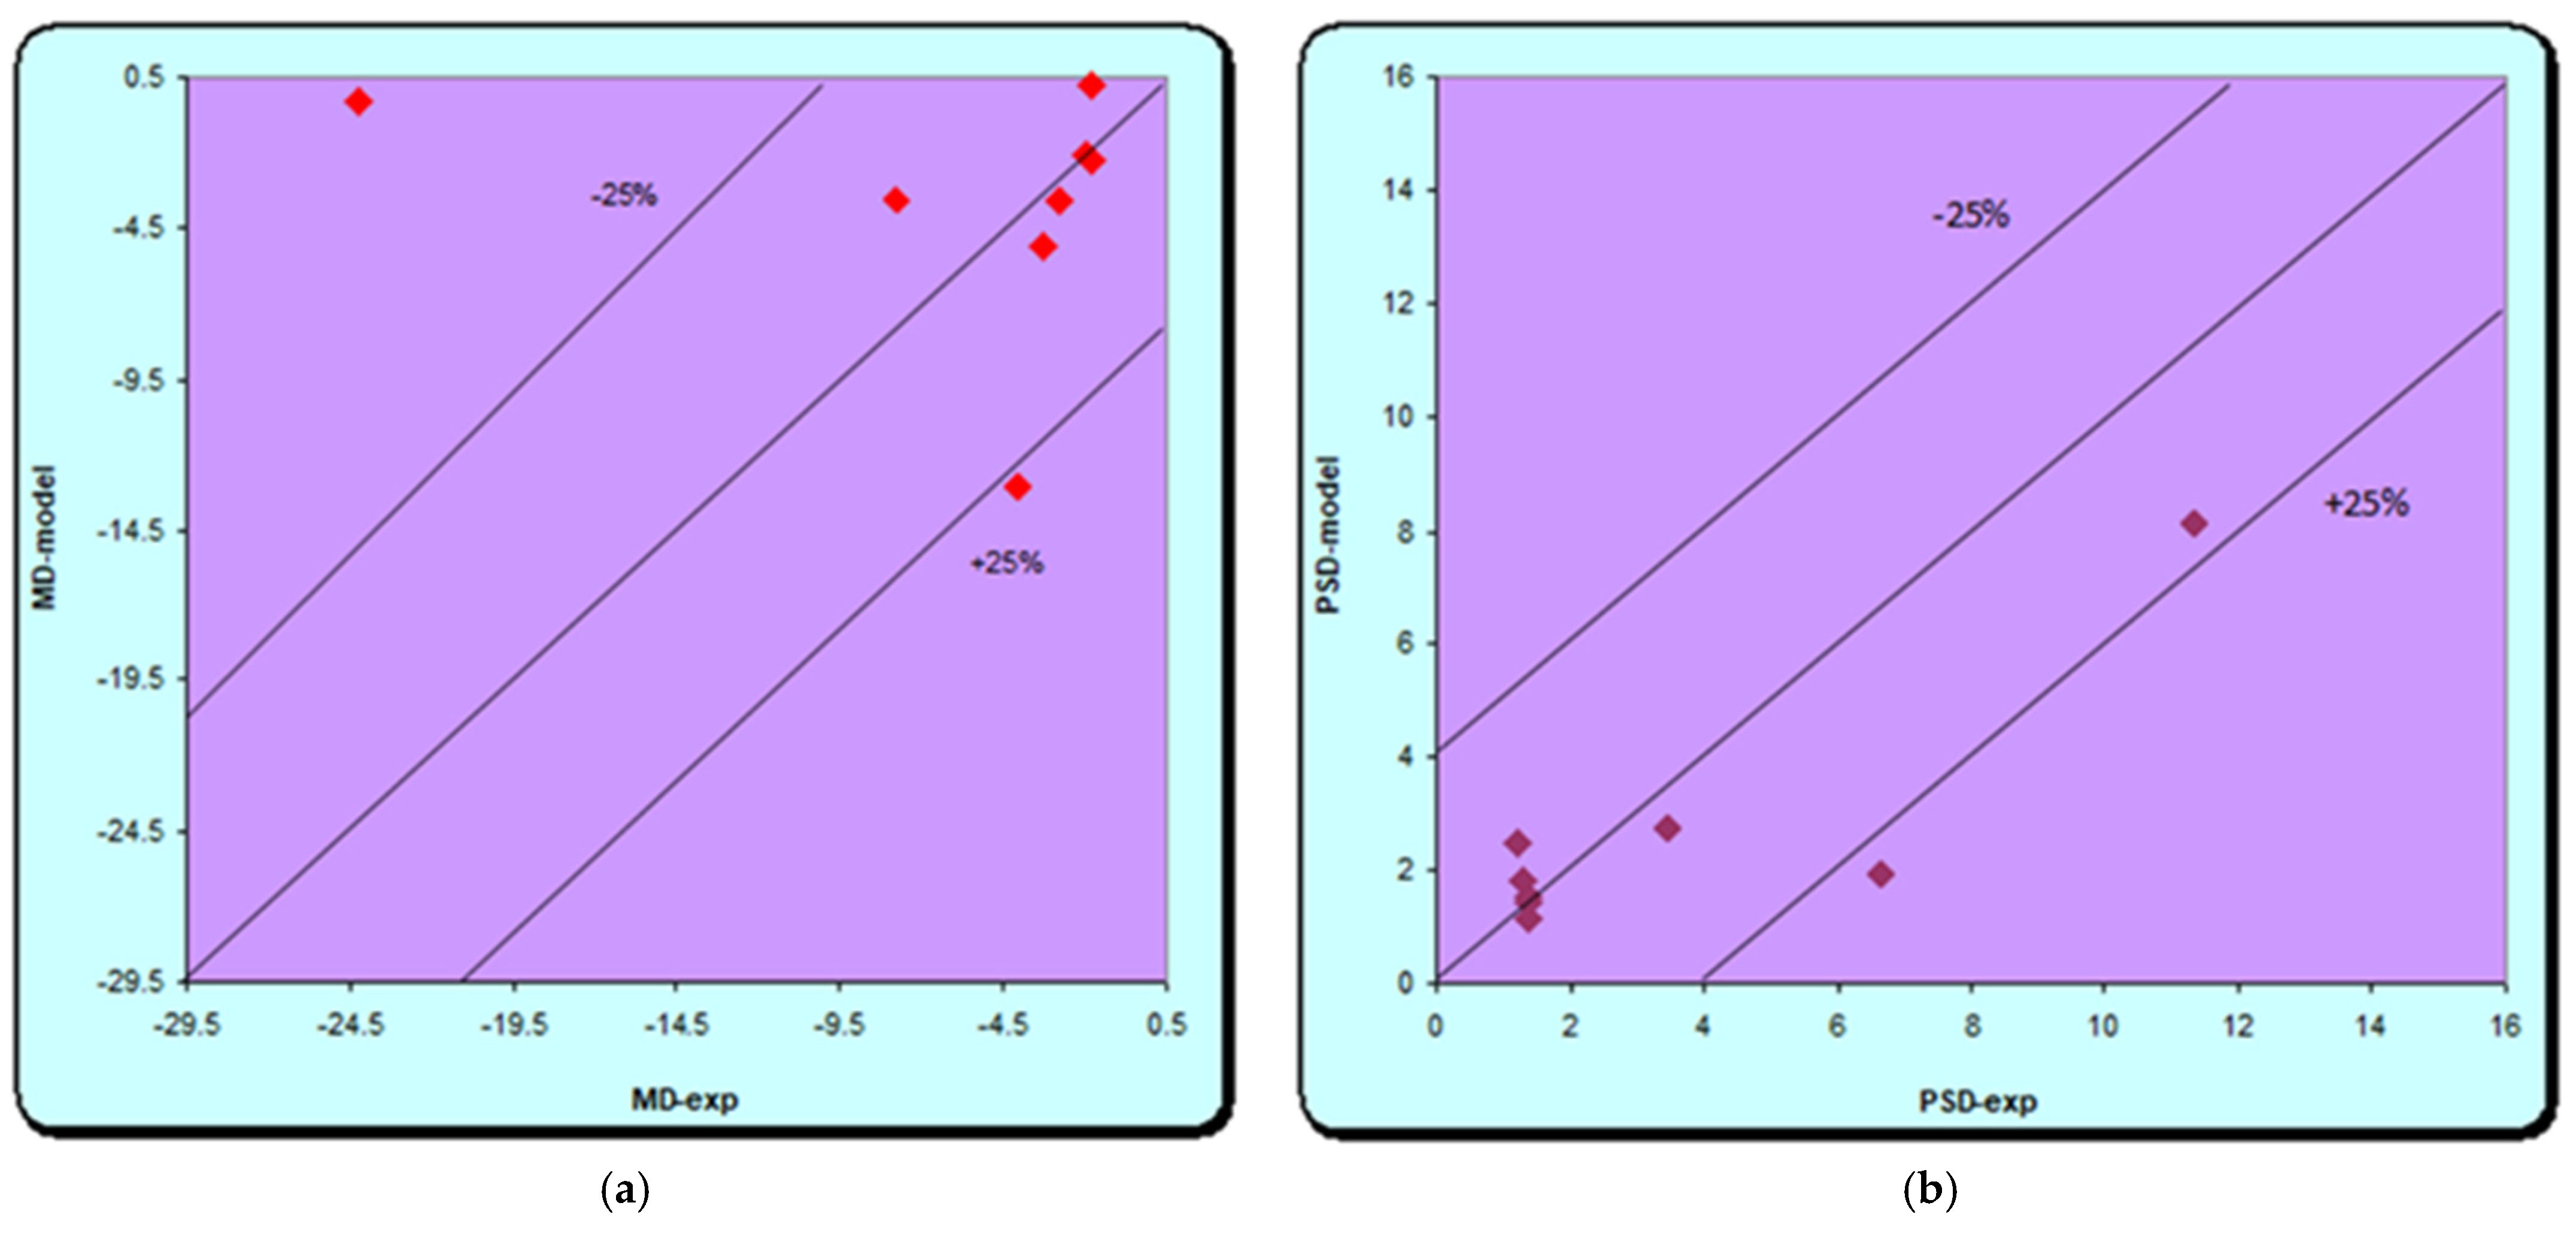
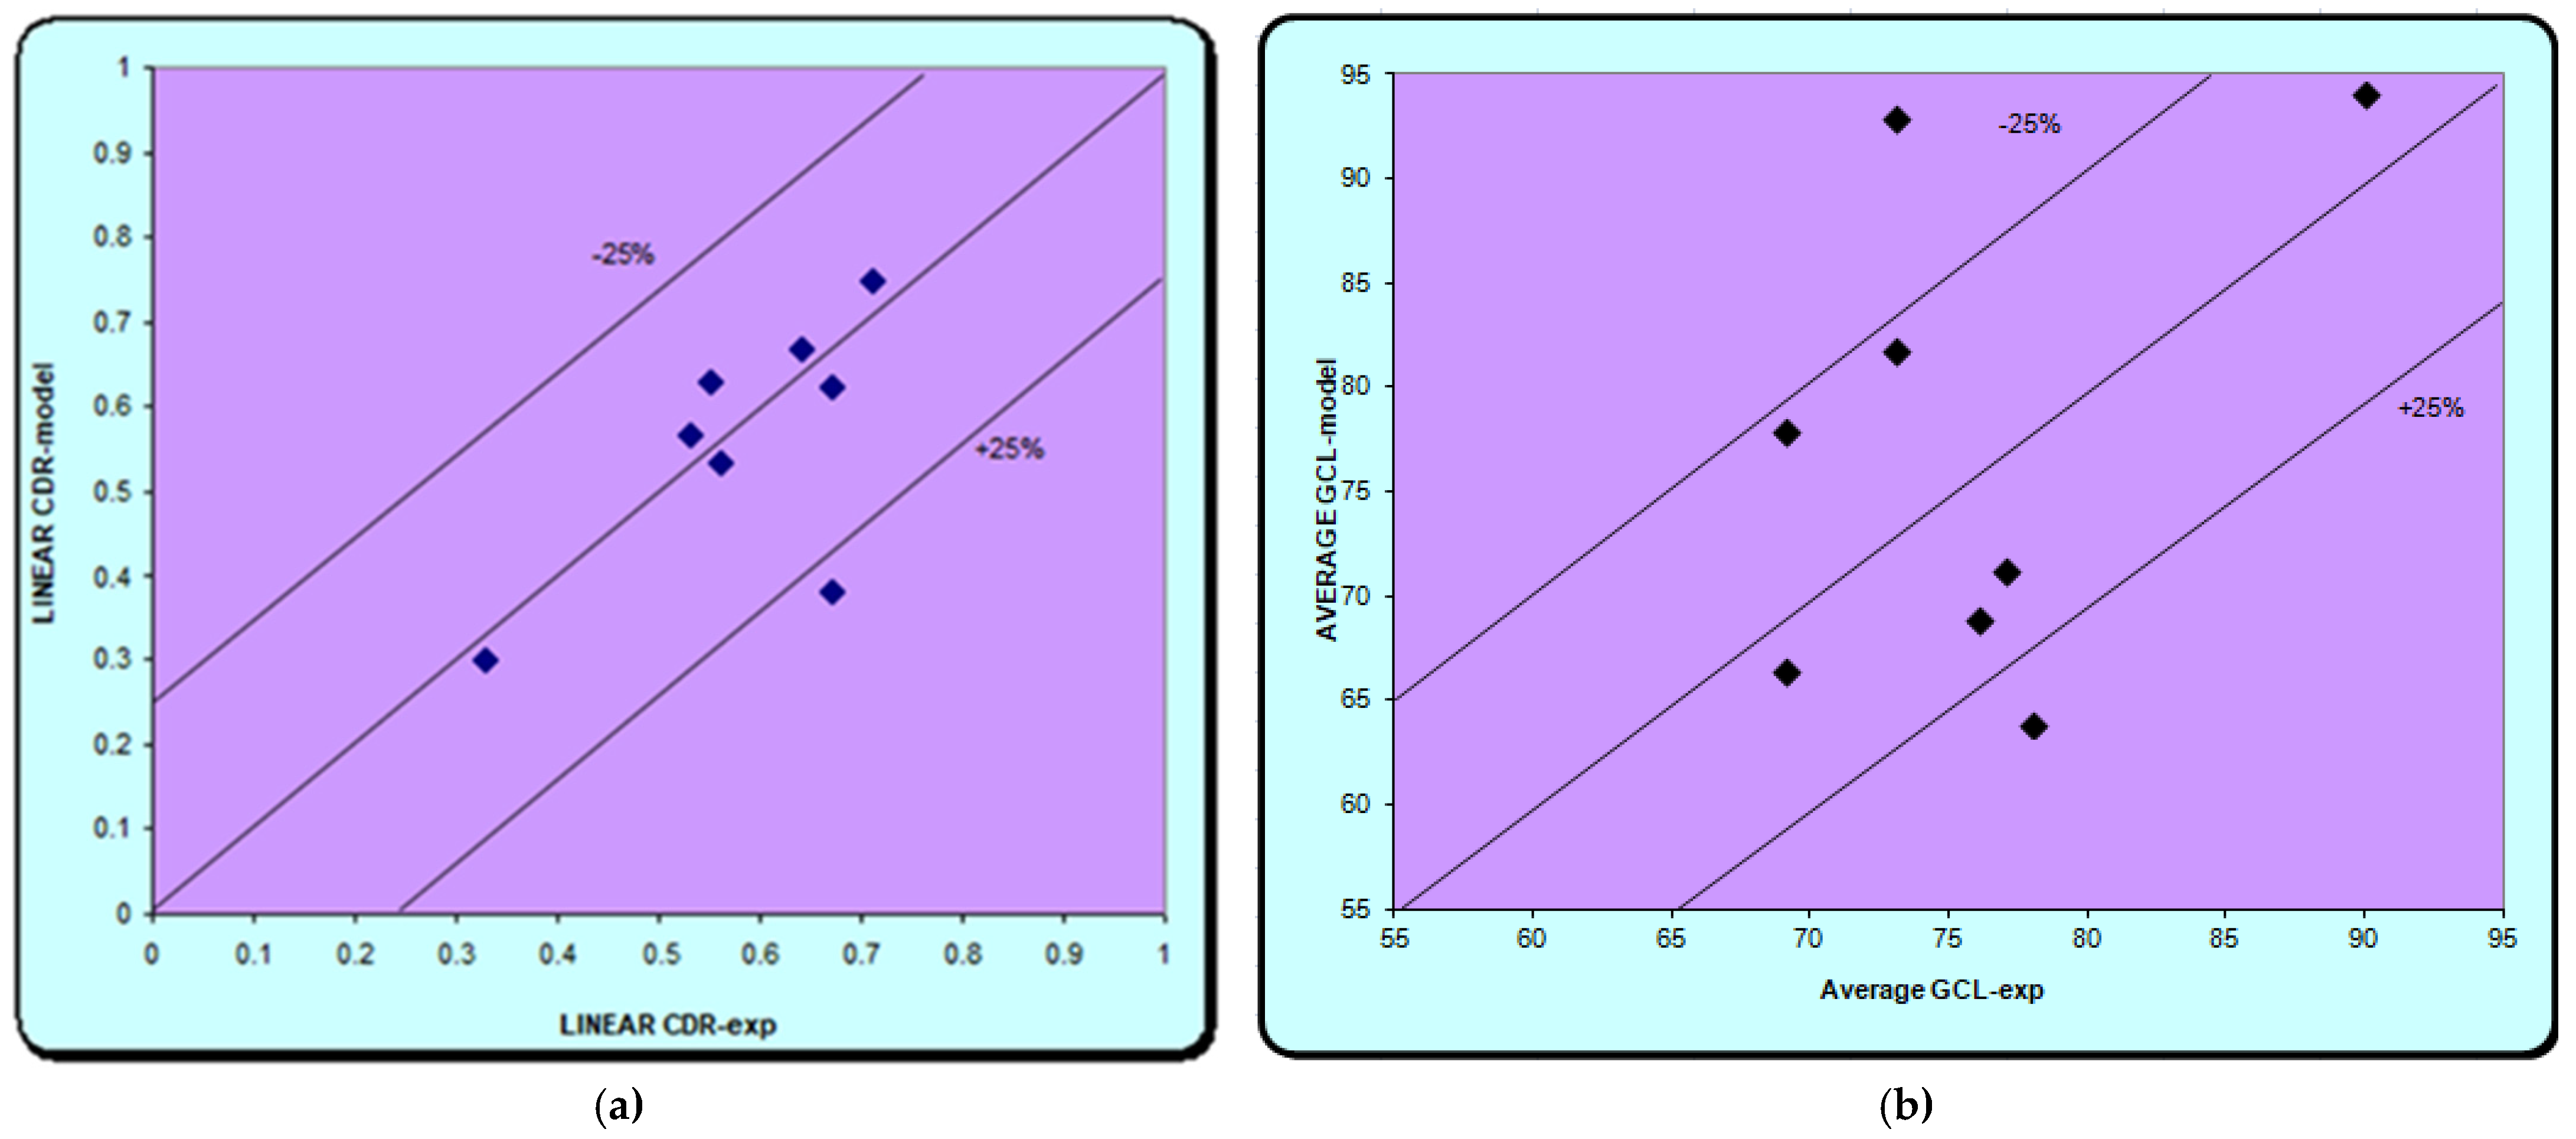
In our study, the used neural models demonstrated the possibility of their application in predicting glaucoma progression in patients with sleep apnea. The best results were obtained in both the training and the validation phase with the ANN network (21:35:4). Using a confidence interval of ±25%, we find that excellent results are obtained for both models (MD, PSD and C/D), except for the average GCL where the results are weaker. The high-performance network obtained was given new data for another group of patients, not used for training and validation in order to make predictions. Excellent similar results are achieved; thus, showing that there is a correlation between the data provided to the network and those obtained, except for the ganglion cell models. The results are similar to those in the literature. Relatively simple models were used in a study on groups of glaucoma and diabetes by Apreutesei et al., while advanced neural networks with one or two intermediate layers provided clinically significant data in direct modeling, with a 95% probability of correct answers. Reverse modeling in which MD depreciation was the output parameter was also performed. High accuracy was provided in this case by Jordan and Elman’s networks, with a confidence interval of ±15%. The neural models provided by them have demonstrated the possibility of their use in successfully predicting the connection between glaucoma and diabetes in a real clinical setting. The advantage of such neural networks is the ability to provide high accuracy in predicting glaucoma and retinal changes, using the characteristic clinical features of two conditions as input in a relatively short time [
20]. Another study that started from the same idea and used artificial intelligence tools (ED and SVM) to evaluate changes related to diabetic retinopathy (DR) (no changes, mild or moderate changes) in glaucoma patients and diabetes using intelligence tools is support vector machines (SVM) in combination with a powerful optimization algorithm—differential evolution (DE). The results were very good; in the test phase, an accuracy of 95.23% was obtained, only one sample being classified incorrectly. Thus, the efficacy of the classification algorithm (SVM), developed optimally with DE and used in predicting retinal changes related to diabetes, was demonstrated [
21].
As in previous studies, it can be used later in making predictions after establishing and validating the best performing model. In the present study, the best network was ANN (21:35:4) with 21 input neurons, 35 hidden neurons, and 4 outputs, by which predictions were made for new data not used in the training and validation stages. Input data includes clinical data for both glaucoma and sleep apnea syndrome. The output ones are represented by four parameters: c/d ratio, modified visual field parameters (MD, PSD), and OCT parameters (ocular computer tomography, ganglion cell layer thickness). The results are also excellent except for the Average GCL for which the errors are higher. In the case of the other parameters, the results are similar to the experimental ones. Similar to previous studies, the results obtained in this study are encouraging and demonstrate the possibility of using neural patterns in predicting glaucoma progression in patients associated with sleep apnea.
Various studies in the literature also demonstrate the successful use of these tools of artificial intelligence in ophthalmology: the evaluation of the visual field, optic nerve, retinal nerve fiber layer, thus, providing better accuracy in identifying progression in glaucoma and retinal changes in diabetes [
8,
10,
11]. The latest reviews provide an analysis of all studies in the literature that used artificial intelligence in ophthalmology, i.e., glaucoma, in predicting the progression of early changes that may occur in this disease, as well as for other conditions such as diabetic retinopathy, prematurity, age-related macular degeneration, etc. [
22,
23].
In the short term, artificial intelligence could pave the way for the first cost-effective glaucoma screening campaigns. In an ideal future scenario, there may also be clinical prognostic tools that inform patients about their overall prognosis and the expected clinical outcome with or without treatment.
5. Conclusions
The applied neural models showed the possibility of their use in predicting the progression of glaucoma in patients associated with sleep apnea. The best results were obtained with the neural model (21:35:4). In the validation stage, most of the output parameters calculated with the neural model were within a confidence interval of ±25%. These results demonstrate the connection between sleep apnea syndrome and glaucoma changes, as indicated in the literature.
Although we know that a database of thousands of data is needed to increase the accuracy of network prediction, the results of our study are promising and reinforce the claim that the use of artificial intelligence is useful in predicting the progression of glaucoma.
The main advantages of using these techniques in medical diagnosis enable: the ability to process a large amount of data, the low probability of neglecting relevant information, and the reduction in waiting time for diagnosis.


 ,
, 


