Article

Risk Assessment of Tunnel Face Instability under Multi Factor Coupling Based on Conditional Probability and Tunnel Construction Mechanics

1
Key Laboratory of Urban Underground Engineering of Ministry of Education, Beijing Jiaotong University, Beijing 100044, China
2
School of Civil Engineering, Beijing Jiaotong University, Beijing 100044, China
3
Beijing Municipal Construction Group Co., Ltd., Beijing 100045, China
*
Author to whom correspondence should be addressed.
Appl. Sci. 2022, 12(15), 7881; https://doi.org/10.3390/app12157881
Submission received: 31 May 2022 / Revised: 28 July 2022 / Accepted: 4 August 2022 / Published: 5 August 2022

Abstract

:
The factors leading to the collapse of tunnel face are diverse, and there is an interaction relationship between multiple influencing factors at the physical and mechanical level. By analyzing the coupling relationship between the factors affecting the instability of tunnel working face, this paper deduces the calculation method of the coupling effect of tunnel construction risk factors for a certain risk event based on conditional probability theory, and makes reasonable assumptions on the monitoring data and risk probability. Finally, it is verified by a model test. The results show that the tunnel construction risk factors have a coupling effect by affecting other risk factors or changing the physical and mechanical parameters of surrounding rock, in which the coupling amplification effect will significantly change the failure probability of the risk carrier, so it is unfavorable to the stability of the tunnel face. The coupling amplification effect of risk factors will cause the increase of tunnel face extrusion deformation. Even if it causes a small deformation increment, it can also make the transition of risk probability and grade of tunnel face unstable, and cause tunnel face instability collapse. The research results of this paper can quantitatively evaluate and predict the stability of the working face in the process of tunnel construction.

1. Introduction

The stability of tunnel face is related to the safety of tunnel construction. It has always been the focus of researchers in the field of tunnel engineering, and has produced a great deal of systematic research. Domestic and foreign researchers mainly use the limit analysis method and limit equilibrium method to study the limit support force of tunnel face. Leca [1] used the limit analysis method to establish the three-dimensional failure mode of tunnel face in a sandy soil layer, and obtained the maximum and minimum support force of tunnel face stability through analytical calculation. The research results of Leca, Soubra et al. [2] improved the failure mode of the tunnel face, realized the transition of the square cone in front of the tunnel face, and obtained the optimized upper bound solution. Mollon et al. [3] established the instability model of asymmetric extrusion deformation of tunnel face through theoretical analysis and a model test. Yasletty, Aldo and André [4] believe that compared with the analytical method, the numerical method can more truly evaluate the stability of shallow tunnel face and also believe that the ultimate support force and the ratio of soil cover thickness to tunnel diameter are positively correlated. Murayama [5], Jancsecz [6] and Broere [7] established the earlier limit equilibrium calculation model and limit support force calculation formula of tunnel face based on the limit equilibrium theory. On this basis, Wei Gang, Lei Mingfeng, Qiao Jinli and Hu Wenting [8,9,10,11,12,13] optimized and adjusted the calculation formula of ultimate support force of tunnel face, highlighting the influence of soil seepage and friction between soil particles on the calculation results. Through the preliminary basic theoretical research, some scholars such as Zhu Jianglin, Wang Bingyong and Wang Nianyi [14,15,16,17,18] have deduced the calculation formula and evaluation method of the tunnel face stability safety factor, which have been used in engineering practice. Kirsch, Du Jun and Tong Jianjun [19,20,21] analyzed the failure characteristics of tunnel face in sand layer and the influencing factors of tunnel face stability through a model test. Zhang et al. [22] proposed to modify the constitutive model of the smooth particle hydrodynamics (SPH) framework with softening function and a strain-dependent expansion model to simulate the collapse behavior of tunnel face, which was verified by a centrifugal model test.
Researchers have conducted a more comprehensive study on the failure characteristics, instability mechanism and key influencing factors of tunnel face, but the research results cannot directly and effectively guide tunnel construction. At present, deformation is generally used as the evaluation and control index of tunnel construction safety in the process of tunnel construction, because deformation is the result of the comprehensive action of surrounding rock properties, construction methods, support methods and space–time effects, and has intuitive and measurable characteristics. However, a small deformation increment may not necessarily attract the attention of tunnel constructors, and a series of potential risk consequences caused by it should be prevented. Therefore, this paper takes the intuitive and measurable tunnel face extrusion deformation as the starting point, combines the risk probability with tunnel construction mechanics, establishes the mapping relationship between the tunnel face extrusion deformation and the risk occurrence probability, makes a scientific and reasonable prediction of the tunnel face instability and collapse risk in the process of tunnel construction, puts the risk ahead and takes engineering measures in time.

2. Coupling Mechanism of Risk Factors in Tunnel Construction

2.1. Definition of Risk Factor Coupling in Tunnel Construction

At first, risk coupling was mostly used to measure the correlation of different financial risk types in the financial field. Researchers believe that there is a certain correlation between the influencing factors of two or even more financial risks, such as interest rate term structure, currency exchange rate, stock index price, commodity price, credit and liquidity factors. For example, the return of listed companies’ stocks contains credit risk information, while the return of a market securities portfolio contains market risk information. There is a certain correlation between the two financial data, which can be linear or nonlinear. Scientific and reasonable measurement of this correlation is conducive to reducing the uncertainty of credit risk or market risk and reducing investment loss.
In the field of tunnel engineering, there are many types of tunnel construction risks. Taking the tunnel engineering constructed by concealed excavation method as an example, its construction risks include: tunnel face collapse, ground collapse, initial support invasion limit, cracking or damage of surrounding existing buildings and structures, etc. As one of the commonly used evaluation indexes to measure and control the risk of tunnel construction, the deformation is the result of the comprehensive action of many factors. For example, the extrusion deformation of the tunnel face is the result of the joint action of soil excavation and support. Poor soil stability, an overly large excavation section, untimely support and unreinforced soil may lead to excessive extrusion deformation of the tunnel face, resulting in tunnel face collapse. Therefore, the coupling of tunnel construction risk factors is the result of mechanical coupling caused by the interaction and interaction of multiple factors. The forces of various risk factors act on rock, soil, structure, groundwater and other objects, resulting in different mechanical responses with coupling effects and nonlinear characteristics. The coupling amplification effect of risk factors is unfavorable to the safety of tunnel construction, which is more worthy of attention and research.

2.2. Analysis on the Coupling Mechanism of Risk Factors

We use risk flow to express the interaction between risk factors and the effect on the results. The coupling chain of tunnel construction risk factors includes risk factors, transmission media and risk carriers. The risk generated by a single risk factor flows through the transmission medium and acts on the risk carrier. On the other hand, there are two ways to couple the risk factors with them: one is to influence the risk causing factors to increase the risk flow nonlinearly and act on the risk carrier through the transmission medium; for the second, by changing the physical properties of the transmission medium, the transmission effect of the transmission medium increases nonlinearly.
In tunnel engineering, surrounding rock, as the transmission medium, plays the role of transmitting risk flow. Groundwater is the most common risk factor. Groundwater amplifies the risk of tunnel construction by reducing the engineering characteristics of surrounding rock. Groundwater will reduce the strength of the stratum by reducing mechanical parameters such as cohesion and friction angle. It also increases the overall density of the stratum, increasing the load acting on the structure. It will also change the properties of some strata. For example, dry natural loess has good performance, but its performance will be sharply reduced in case of water collapse, or sandy soil will be liquefied under dynamic action when its water content is high, etc.
From the perspective of risk, tunnel excavation is the risk factor of all tunnel construction risks, which causes the deformation of surrounding rock. The intrusion of groundwater reduces the mechanical parameters of surrounding rock, makes the self-stability ability of surrounding rock worse, indirectly increases the disturbance and deformation of surrounding rock caused by tunnel excavation, and finally causes engineering accidents such as surface collapse, tunnel collapse, mud inrush and water inrush at tunnel face.
For example, the Humaling tunnel of Lanzhou Chongqing railway encountered water-rich silty fine sand stratum in the excavation process. The existence of groundwater further reduces the self-stabilization ability of surrounding rock after tunnel excavation. The tunnel face is unstable, which is particularly prone to collapse. There are frequent phenomena such as water gushing from the bottom plate, sand gushing from the tunnel face, water gushing and special water pockets, which greatly increases the construction difficulty and seriously restricts the construction progress. The tunnel finally took 8 years to complete the connection, resulting in huge construction safety risks and construction delay risks. Reviewing the project, it can be found that the core factor causing a series of problems in the construction process was the water-bearing silty fine sand stratum. When the silty fine sand is in the wet state, the internal friction angle is about 38°, and it is slightly viscous, with certain uprightness and shear strength. However, similar to most sandy soils, the properties of silty fine sand are extremely sensitive to the change of water content. When the silty fine sand changes from wet to dry, with the disappearance of matrix suction, the cohesion of silty fine sand will decrease, and when the silty fine sand enters the saturated state, it will soften and muddy rapidly, which is extremely unfavorable to the construction of underground engineering.

3. Calculation Method of Risk Factor Coupling Coefficient

3.1. Basic Assumptions of Risk Factor Coupling Coefficient

The coupling effect of risk factors is studied by using conditional probability. Firstly, the coupling coefficient of risk factors is defined and meets some basic assumptions. The minimum causal unit is assumed, as shown in Figure 1. Event C is the result, event Γ1 (c) and Γ2 (c) is the factor causing event C, abbreviated as Γ1 and Γ2. Figure 1a shows the case with only one factor and Figure 1b shows the case with two factors. It is assumed that the system in Figure 1a is S C and Figure 1b is   S C . On this basis, the following assumptions are made, as shown in Table 1.
Assumption 1.
When the risk factors (Γ) do not exist, the system risk is 0.
During risk analysis, according to the amount of information available, an event C may be in three states of “occurred”, “not occurred” and “uncertain”, which are respectively expressed as:
      P C = 0 ,                 C : N o t   o c c u r r e d 0 < P C < 1       C : u n c e r t a i n P C = 1 ,             C :   o c c u r r e d      
When discussing a set of n events, there may be 3n possible state combinations for the events in this set, which is called a “situation”. “No risk factors occur” refers to a situation in which all the causes obtained through causal analysis are in the state of non-occurrence. Which is expressed as:
S C : P Γ 1 ¯ = 1           S C : P Γ 1 ¯   Γ 2 ¯ = 1        
All factor events in Figure 1 Γi(c) is the obvious cause of the result event C, so when all factors do not occur, the occurrence probability of event C should be the basic probability BPc0 determined by the hidden cause. However, under the condition of relatively complete causal analysis, the basic probability BPc0 is generally small, and its impact on system risk is very limited. Therefore, for the sake of simplifying the model, BPc0 = 0 can be assumed. Basic Assumption 1 can be expressed as:
S C : P C Γ 1 = P C | Γ 1 ¯ = 0         S C : P C Γ 1 Γ 2 = P C | Γ 1 ¯   Γ 2 ¯ = 0    
Assumption 2.
When a risk factor changes from non-occurrence to occurrence, the risk of the system will not be reduced.
The meaning of basic Assumption 2 is that risk factors are factors that have an adverse impact on system security, and the occurrence of a risk factor cannot make the system safer. In other words, comparing the risk of the system when the risk factor occurs with the risk when it does not occur, the former should be greater than the latter, or at least not less than the latter. Due to the relativity of risk factors, this nature should be established in all parts of the system. It can be inferred that when the risk factor occurs, the probability of all subsequent events is greater than when it does not occur. Under the condition of satisfying basic Assumption 1, basic Assumption 2 is naturally established in S C and can be expressed as the following formula in S C .
P C Γ 1 Γ 2 = P C | Γ 1 Γ 2 m a x P C | Γ 1 ¯ Γ 2 , P C | Γ 1   Γ 2 ¯
Assumption 3.
Under the same objective situation, the risk of the system remains unchanged and has nothing to do with the result of causal analysis.
Basic Assumption 3 is closely related to the objective existence of risk factors. For the same result event C, the causes of different causal analysis may be different, but these different analysis results objectively correspond to the same event. For example, S C and S C can be regarded as two different causal analyses of the same event, but both appear Γ1 this factor. The following two situations exist in S C and S C respectively.
S C : P Γ 1 ¯ = p 1           S C : P Γ 1 Γ 2   Γ 1 Γ 2 ¯ = p 1    
For any causal analysis example, the hidden cause is in an uncertain state. Due to factors Γ2 is an explicit cause in S C , but it exists as an implicit cause in S C . Therefore, the second formula of Formula (5) corresponds to the same objective situation. Then, according to basic Assumption 3, the following formula holds:
P C Γ 1 = P C | Γ 1 p 1 = P C Γ 1 Γ 2   Γ 1 Γ 2 ¯ = P C | Γ 1 Γ 2   Γ 1 Γ 2 ¯ p 1 = P C | Γ 1 Γ 2 P Γ 2 p 1 + P C | Γ 1 Γ 2 ¯ P Γ 2 ¯ p 1
Substitute Equation (4) into Equation (6) to obtain:
P C | Γ 1 P C | Γ 1 Γ 2 ¯ P Γ 2 + P C | Γ 1 Γ 2 ¯ P Γ 2 ¯ = P C | Γ 1 Γ 2 ¯  
Similarly:
P C | Γ 2 P C | Γ 1 ¯   Γ 2 P Γ 1 + P C | Γ 1 ¯   Γ 2 P Γ 1 ¯ = P C | Γ 1 ¯   Γ 2  
Assumption 4.
When the state of all factors is unknown, the risk of a system will not be reduced after adding risk factors to the system without considering the coupling effect.
The causes of an event always exist objectively and are inexhaustible. The work of causal analysis is only to reveal and screen out the dominant factors in these causes. Then, adding risk factors to a system is essentially a further causal analysis. This behavior only reveals more information in the system without any interference with the system itself. Therefore, the system risk should remain unchanged in this case. The above expression can be expressed as:
P C Ω Γ = P C | Γ 1 P Γ 1 + P C | Γ 1 ¯ P Γ 1 ¯ = P C Ω Γ = P C | Γ 1 Γ 2 P Γ 1 P Γ 2 + P C | Γ 1 Γ 2 ¯ P Γ 1 P Γ 2 ¯ + P C | Γ 1 ¯   Γ 2 P Γ 1 ¯ P Γ 2 + P C | Γ 1 ¯   Γ 2 ¯ P Γ 1 ¯ P Γ 2 ¯  
where the angle mark “Ω” represents that the system is in any condition. Substituting Equations (3) and (6) into Equation (9), we can get:
P C | Γ 1 ¯   Γ 2 P Γ 1 ¯ P Γ 2 = 0  
This result is undoubtedly unreasonable. Through the analysis, it can be found that the reason for this result is the simplification of the basic probability in basic Assumption 1, which is not in line with the objective situation. This term in Equation (10) is rounded off by basic Assumption 1 as part of the basic probability in S C , but in S C , this part of the probability is explicitly expressed because S C changes from implicit cause to explicit cause, resulting in this unreasonable result. If the basic probability rounded off by basic Assumption 1 is expressed as B P C and B P C in S C and S C respectively, Equation (9) can be rewritten as:
P C Ω Γ = P C | Γ 1 P Γ 1 + B P C = P C Ω Γ = P C | Γ 1 Γ 2 P Γ 1 P Γ 2 + P C | Γ 1 Γ 2 ¯ P Γ 1 P Γ 2 ¯ + P C | Γ 1 ¯   Γ 2 P Γ 1 ¯ P Γ 2 + B P C  
From the relationship between the basic probability and the completeness of causal analysis, we can know that B P C B P C . At the same time, after substituting Equation (6) into (11) and eliminating the term, we can get:
B P C = P C | Γ 1 ¯   Γ 2 P Γ 1 ¯ P Γ 2 + B P C B P C    
It can be deduced that:
P C | Γ 1 ¯   Γ 2 P Γ 1 ¯ P Γ 2 0      
This result is reasonable. If we want to solve the logical problem in Equation (10) under the condition that basic Assumption 1 is true, a feasible method is to make Equation (10) an inequality. That is:
P C Ω Γ = P C | Γ 1 P Γ 1 P C | Γ 1 Γ 2 P Γ 1 P Γ 2 + P C | Γ 1 Γ 2 ¯ P Γ 1 P Γ 2 ¯ + P C | Γ 1 ¯   Γ 2 P Γ 1 ¯ P Γ 2 = P C Ω Γ        
Similarly:
P C | Γ 1 Γ 2 P Γ 1 P Γ 2 + P C | Γ 1 Γ 2 ¯ P Γ 1 P Γ 2 ¯ + P C | Γ 1 ¯   Γ 2 P Γ 1 ¯ P Γ 2 m a x P C | Γ 1 P Γ 1 , P C | Γ 2 P Γ 2    
In the above assumptions, except basic Assumption 1, other assumptions are based on the basic concept of causality and probability theory and are derived through logical derivation. Based on the above basic assumptions, the coupling coefficient can be defined.

3.2. Calculation Formula of Risk Factor Coupling Coefficient
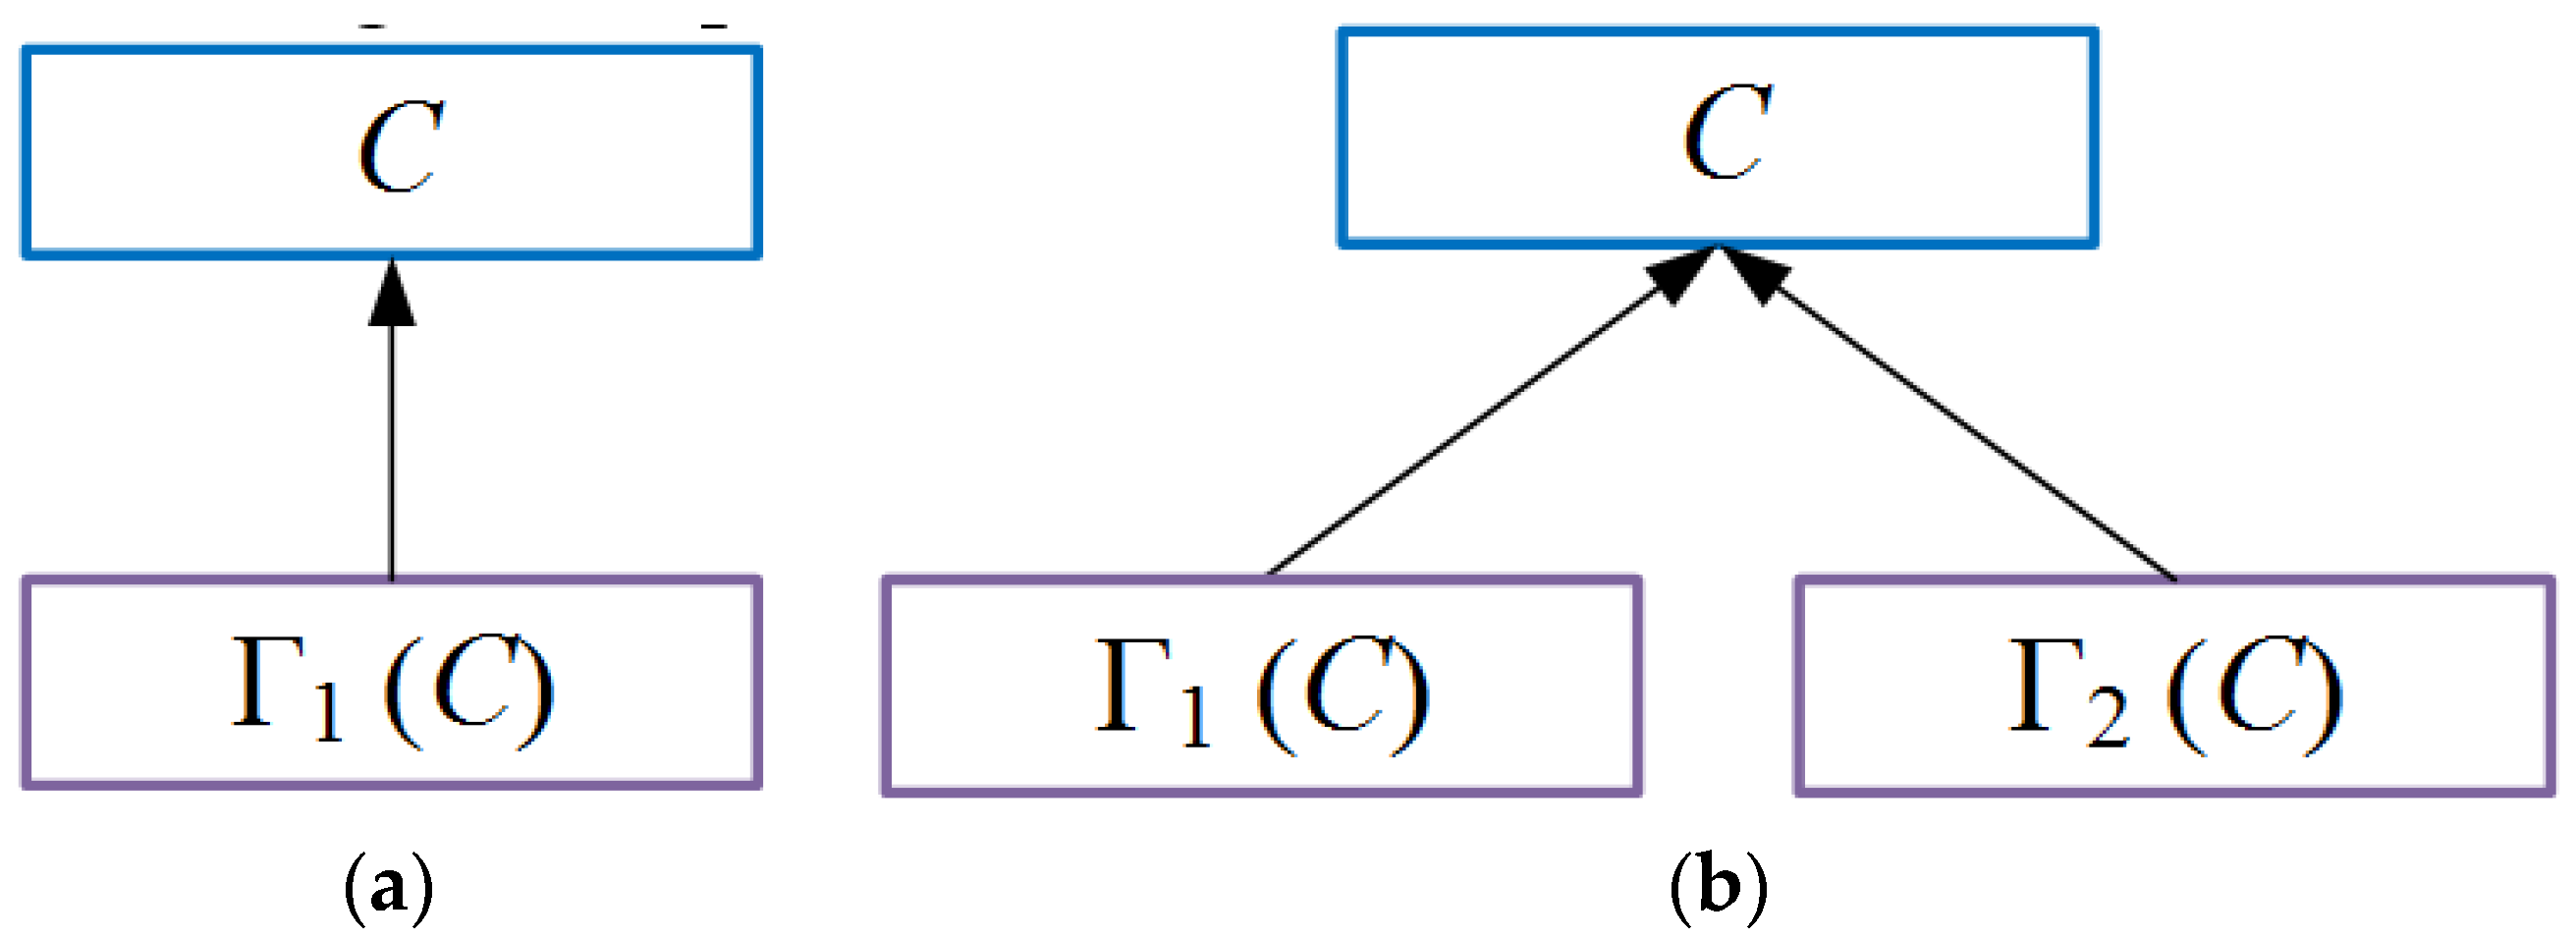
Based on the above basic assumptions, the calculation formula of risk factor coupling amplification factor can be deduced. β represents the coupling coefficient, C is the risk event, Γ1 and Γ2 is the risk factor.
β Γ 1 , Γ 2 = P C | Γ 1 Γ 2 m a x P C | Γ 1 Γ 2 ¯ , P C | Γ 1 ¯   Γ 2 P C | Γ 1 Γ 2    
Its meaning is:
(1)
When the coupling coefficient is 1, it means that the coupling effect is great, so that Γ1 and Γ2. When it happens together, C almost becomes an inevitable event.
(2)
When the coupling coefficient is 0, it represents no coupling effect, Γ1 and Γ2 co-occurrence or single occurrence has the same impact on C.

4. Conversion Calculation between Monitoring Data and Risk Probability

The calculation formula of the coupling coefficient of the two risk factors has been given in Section 2.2, in which the risk factors need to be used Γ1 (c) and Γ2 (c), and what we get through numerical calculation or model test is the extrusion deformation of the tunnel face. Therefore, it is necessary to give the conversion relationship between the deformation and the risk occurrence probability. Gong [23] gave the conversion relationship between the deformation of risk event monitoring and the probability of loss event in the safety review study of subway station construction scheme, as shown in Table 2.
Professor Pietro Lunardi of Italy proposed in the ADECO-RS method that the strength and deformation characteristics of the core soil in front of the tunnel are the fundamental reasons for the tunnel deformation. Pre-convergence deformation and face extrusion deformation are the main mechanical indexes to measure the stability of the face. Because the extrusion deformation of the face is easy to monitor, this paper takes it as the evaluation index of the stability of the face.
According to the definition in Table 2 and referring to the provisions on risk occurrence probability in code for risk management of underground engineering construction of urban rail transit GB50652-2011, we can define the corresponding relationship between tunnel face collapse and risk event probability. For the limit value of the extrusion deformation of the tunnel face, 80% is the alarm value and 70% is the early warning value, as shown in Table 3. In the table, when the extrusion deformation of the tunnel face is within the range, the corresponding risk probability is calculated according to the linear difference method. In addition, the higher the risk level, the greater the risk probability and loss.

5. Determination of Extrusion Deformation Limit Value of Tunnel Face

According to the law of large numbers, if you want to know the probability of tunnel face collapse caused by extrusion deformation value m of a tunnel face, you need to carry out many numerical calculation or perform a model test.
Next, we determined the limit value of extrusion deformation of tunnel face through a model test. The model was designed with reference to the D1 entrance and exit of Niujie station of Beijing Metro Line 19. The excavation section size of the tunnel is 7.8 m high, 7.52 m wide, and the buried depth is about 10 m. The horseshoe section was constructed by the CRD method. The inner layer of the tunnel construction range is mainly silty clay, silt and silty fine sand.

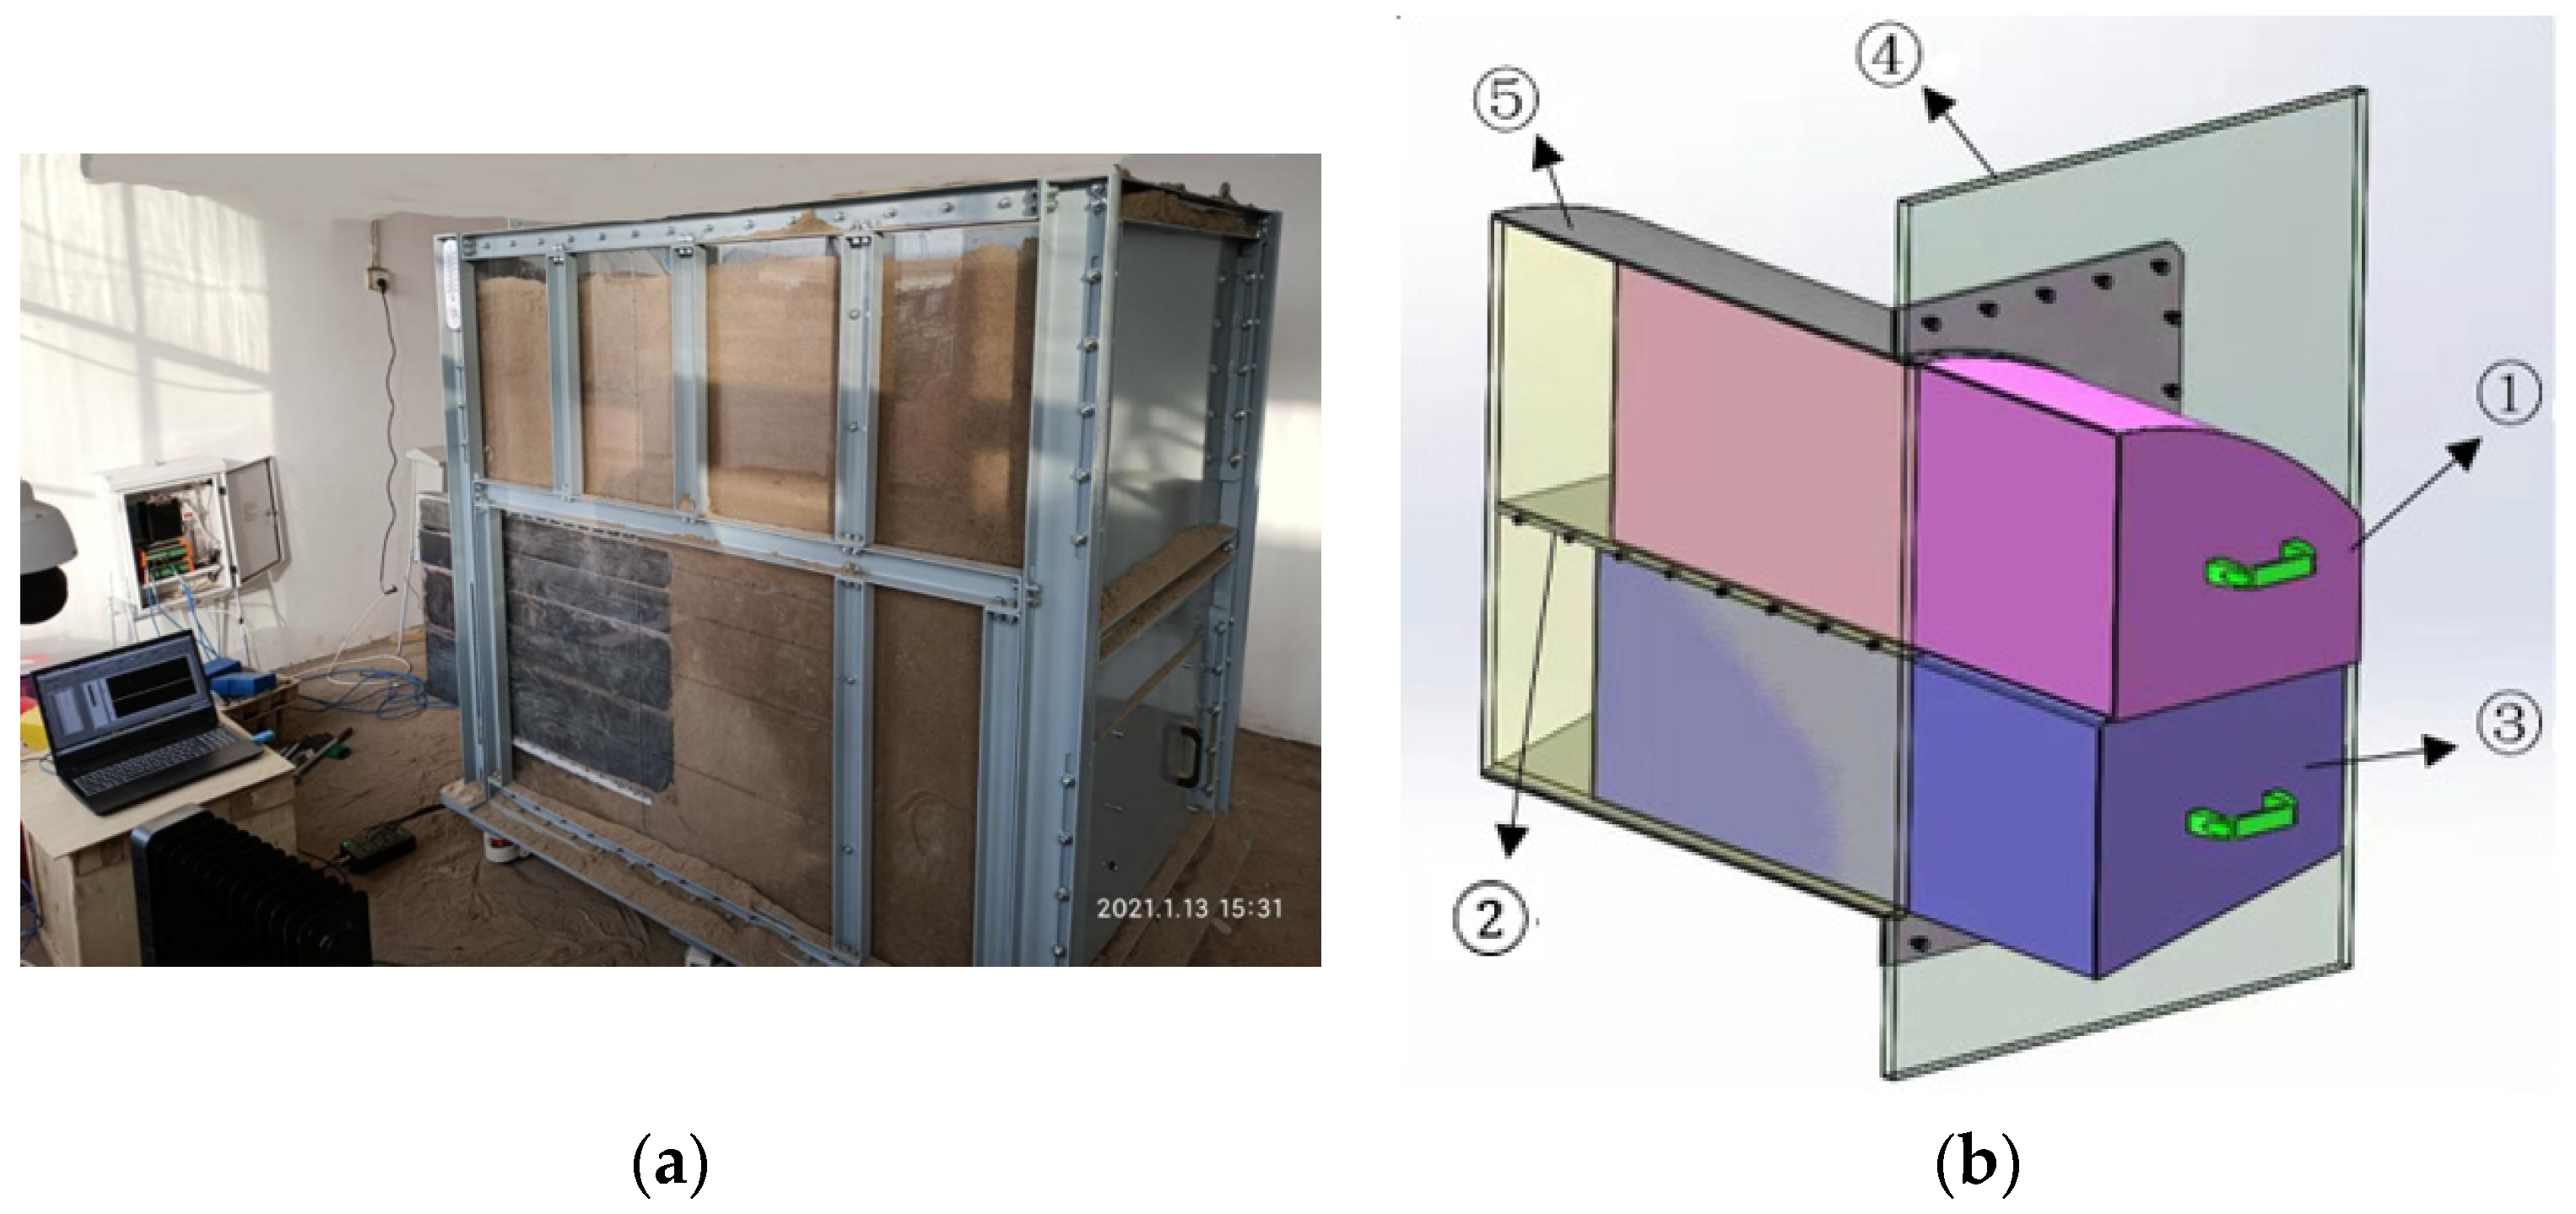
5.1. Experimental Model Design

The geometric similarity ratio of the model is 1:10. In order to facilitate the observation of the stratum deformation in front of the tunnel face during the test, the field test adopted a 1/2 tunnel model, the symmetric plane was 2 cm thick tempered glass, and the standard scale was pasted to facilitate the measurement of the deformation of the soil mass on the tunnel face, shown in Figure 2.
The tunnel model was mainly composed of five parts: ① upper pilot tunnel block, ② CRD temporary middle diaphragm and diaphragm, ③ lower pilot tunnel block, ④ tunnel lining fixing plate and ⑤ tunnel lining. The tunnel lining material was replaced by a circular steel shell with a thickness of 1 cm and a length of 80 cm. It was fixed with the tunnel lining fixing plate through bolt connection. CRD temporary middle partition and diaphragm were 80 cm long and made of plexiglass plate and steel plate, respectively. The excavated materials were the upper and lower pilot tunnel blocks, with a length of 100 cm. The length of the unlined section was simulated by adjusting the length of the pilot tunnel block beyond the lining, and the pilot tunnel block was extracted at a uniform speed to realize the process of gradual release of in situ stress. In Niujie station stratum, silty clay, silt and silty fine sand are staggered with certain randomness. These soil layers were simulated as an equivalent material, and sand was selected as the stratum material of the model test. The similarity ratio of sand bulk density was 1:1, the similarity ratio of Poisson’s ratio and internal friction angle was 1:1, and the similarity ratio of compression modulus and cohesion was 1:10. The particle composition of sand is shown in Table 4.

5.2. Test Process

(1)
Assemble the box and install the tunnel lining.
(2)
Fill the soil in layers and compact it. The filling height is 10 cm. Fill it to the top of the test area. After filling, it will stand for three days.
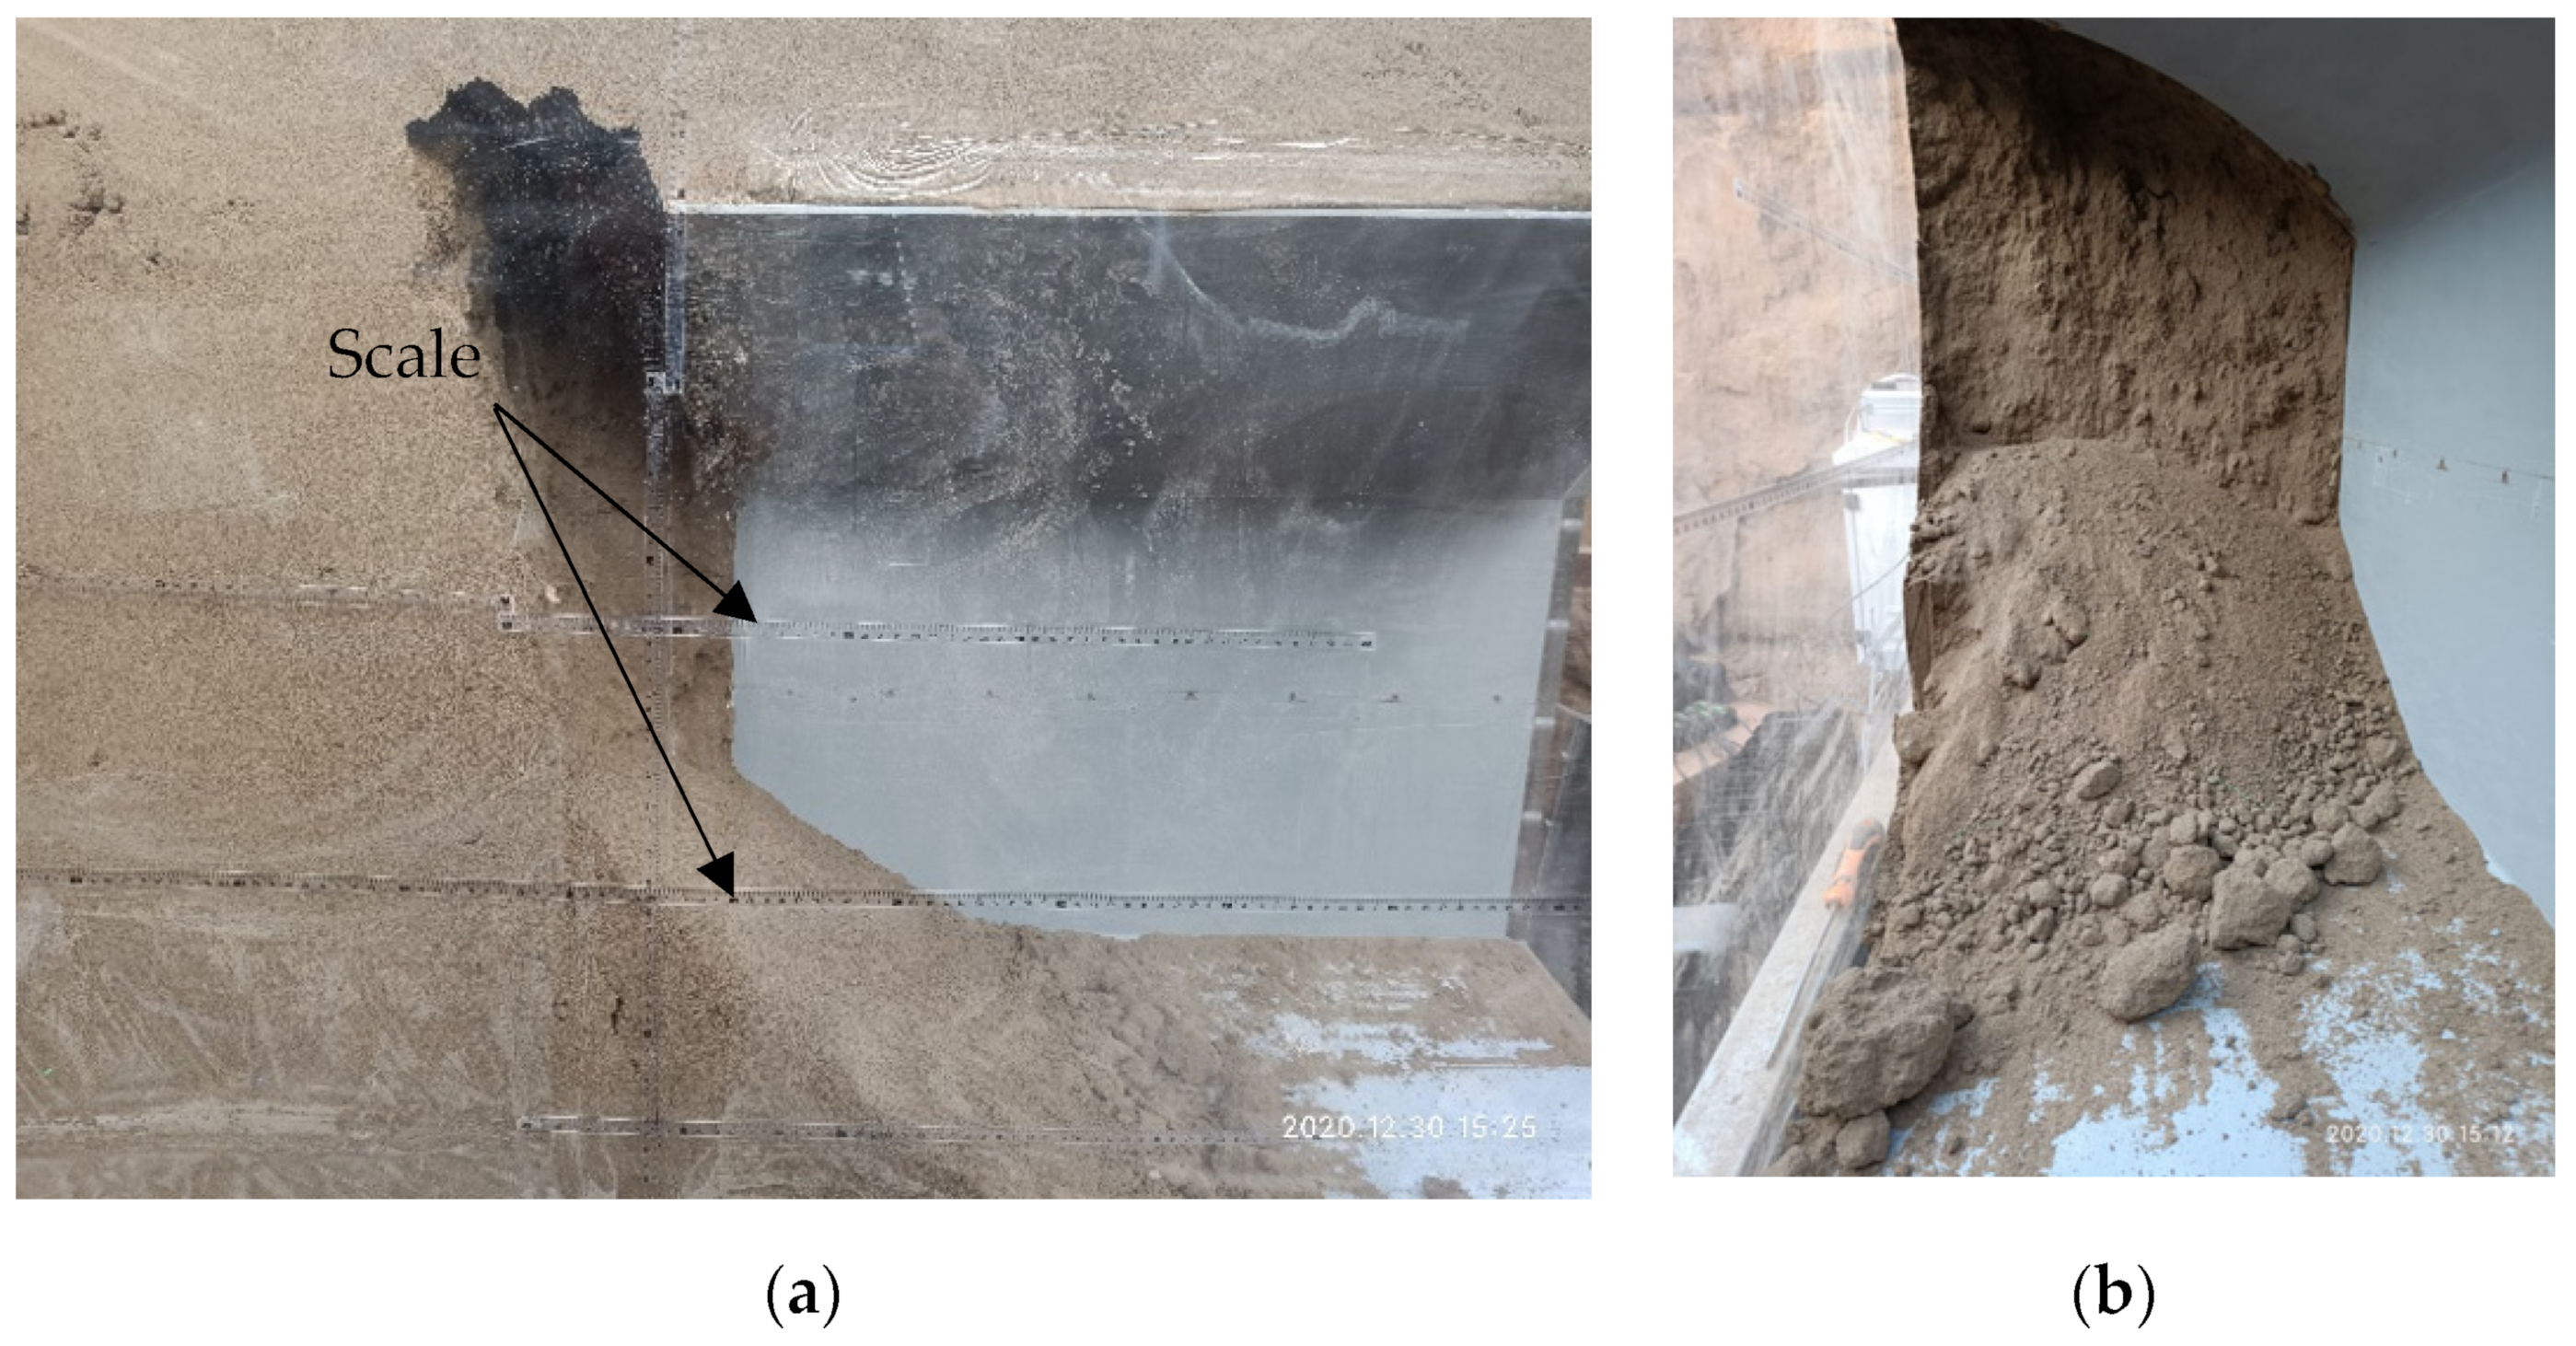
(3)
Extract the pilot tunnel block at a uniform speed and retreat to the specified position to realize the gradual release of in-situ stress. Observe the deformation and instability of the tunnel face and record it. Simulate three working conditions, observe and record the variation law of extrusion deformation of tunnel face under each working condition.
Condition Γ1: No advance reinforcement, full section excavation and initial support closure.
Condition Γ2: There is no advance reinforcement, CRD method excavation, and the initial support is not closed.
Condition Γ1 + Γ2: There is no advance pre reinforcement, full face excavation, and the initial support is not closed.

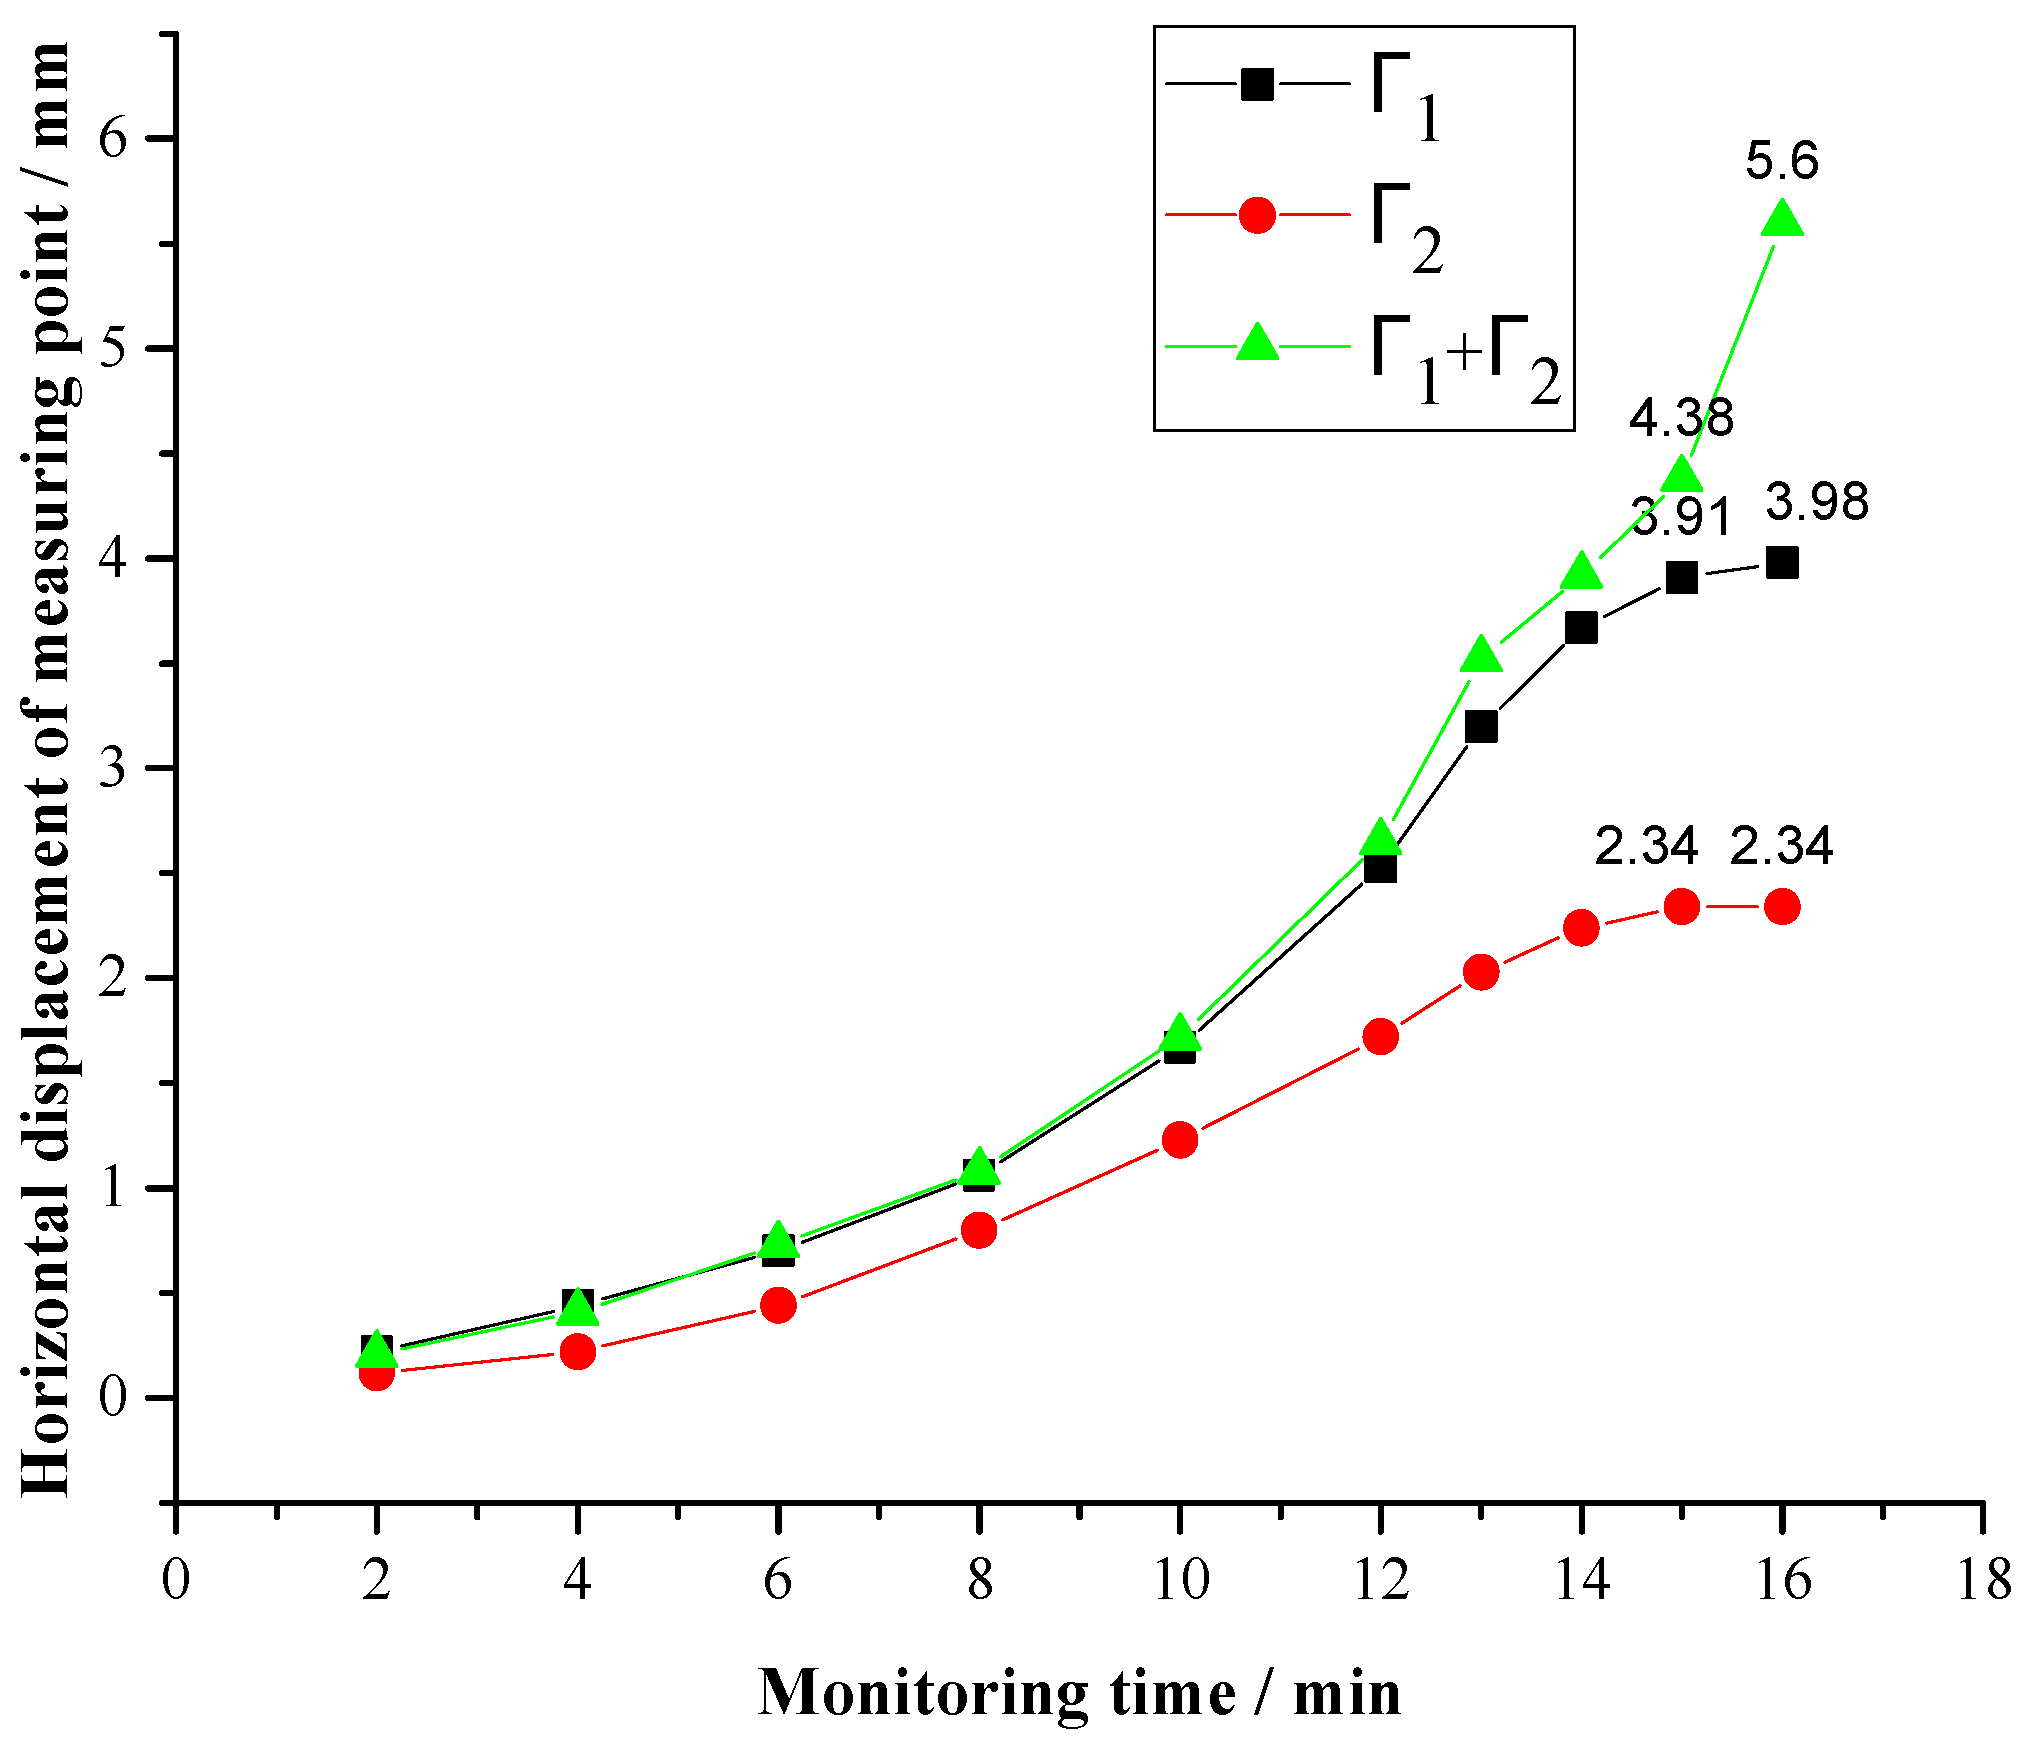
5.3. Analysis of Test Results

Taking the central point on the central axis of the tunnel face as the monitoring point, we compared the difference of horizontal displacement of the tunnel face under three conditions, as shown in Figure 3. After the start of the test, with the withdrawal of the pilot tunnel block, the horizontal displacement of the monitoring point increases gradually under the three conditions, and the displacement rate is also increasing. During the whole monitoring period, the absolute value of horizontal displacement and displacement growth rate of monitoring points in condition Γ1 + Γ2 > condition Γ1 > condition Γ2. After 13 min, the growth rate of horizontal displacement at the monitoring points of condition Γ1 and condition Γ2 slows down and gradually converges. The maximum horizontal displacement of the monitoring point in condition Γ1 is 3.3 mm, and the maximum horizontal displacement of the monitoring point in condition Γ2 is 2.34 mm. The growth rate of the horizontal displacement of the monitoring point in condition Γ1 + Γ2 does not decrease but increases. At 16 min, the maximum displacement reaches 5.6 mm. Then the sand on the vault suddenly falls, causing the tunnel face to collapse, with a large collapse range. The maximum sliding distance of the horizontal sand is 20.7 cm, and the vertical collapse height is 76.9 cm, 54.2 cm beyond the boundary of the tunnel excavation contour line, as shown in Figure 4.
According to the results of the model test, the maximum horizontal displacement of 5.6 mm at the monitoring point of condition Γ1 + Γ2 can be taken as the limit deformation value of tunnel face collapse, and the conversion relationship between tunnel face extrusion deformation and collapse risk probability can be obtained, as shown in Table 5.
Combined with Figure 4 and Table 5, the risk probability and risk level of tunnel face collapse under three conditions can be evaluated in real time, as shown in Table 6.
The factor causing the instability of the tunnel face in condition Γ1 is the change of excavation method, from CRD excavation to full-face excavation. It can be seen from Table 6 that with the passage of time, the risk probability of tunnel instability gradually increases, and finally it is 2.14%, and the risk level increases from level 2 to level 3. The factor causing the instability of the tunnel face in condition Γ2 is that the initial support is not closed in time. It has little impact on the instability of the tunnel face, and the risk level is always Level 2. When two factors exist at the same time, such as condition Γ1 + Γ2, it can be seen that with the passage of time, the risk probability of tunnel instability increases rapidly, and the risk level increases from level 2 to level 4.
In working condition Γ1 + Γ2, when the test is carried out from 12 min to 14 min and from 14 min to 16 min, the extrusion deformation of the tunnel face only increases by 1.27 mm and 1.68 mm, but the risk of face collapse increases sharply, and the risk level jumps from level 2 to level 3 and level 3 to level 4, respectively.
According to the calculation method of risk factor coupling coefficient in Section 2.2, the risk probability obtained from the test of two risk factors of full section excavation and initial support not closed in time is substituted into Formula (16) for calculation. β12) = 90%−2.14%/90% = 0.97, indicating that the coupling coefficient of the two risk factors of full section excavation and initial support not closed in time is 0.97, which belongs to strong coupling. The two risks are positively correlated and have coupling amplification effect. The simultaneous occurrence of these two risk factors should be avoided in tunnel construction.

6. Conclusions

Taking the risk event of tunnel face collapse as the research object, this paper analyzes the coupling mechanism and coupling amplification effect of multiple risk factors, and draws the following research conclusions:
(1)
The coupling of tunnel construction risk factors is a nonlinear mechanical effect caused by the interaction of multiple factors. It has the effect of coupling amplifi-cation and coupling reduction. The coupling amplification effect is disadvantageous to the safety of tunnel construction, which is the focus of research.
(2)
In tunnel engineering, the risk factors transmit the risk flow to the risk carrier through the surrounding rock. Multiple risk factors produce risk coupling amplification effect by influencing other risk factors or changing the physical and mechanical parameters of surrounding rock, which eventually leads to the occurrence of tunnel construction accidents.
(3)
In this paper, the quantifiable and monitorable tunnel face extrusion deformation is linked with the risk probability, which can quantitatively analyze the risk probability of tunnel face collapse under the coupling of multiple factors. Under the coupling action of multiple factors, a measurable deformation index of the tunnel has a small increment, and its risk probability may have a grade transition. For example, if full face excavation Γ 1 and initial support are not closed in time Γ 2 these two risk factors appear at the same time. The extrusion deformation of tunnel face has only increased by 1.62 mm, but the risk of face collapse has increased sharply, and the risk level has jumped from level 3 to level 4.
(4)
This paper presents the calculation method of the coupling coefficient of two risk factors, which can quantitatively evaluate the coupling effect between the two risk factors. For the risk event of tunnel face collapse, the coupling amplification coefficient of the two risk factors of full section excavation and initial support not closed in time is 0.97, which has a strong coupling effect and amplification effect.
The evaluation method of the coupling effect between the risk factors of tunnel construction provided in this paper is feasible, and the factors with strong coupling effect should be avoided at the same time in tunnel construction, which is conducive to improving the safety management level of tunnel construction. However, the assumption of the transformation between monitoring data and risk probability in this paper is based on the previous research results, and there are still limitations. There is a lack of a large number of numerical calculations or model tests for probability statistics, which can be further studied.

Author Contributions

Conceptualization, M.H. and Z.Z.; data curation, Z.Z.; funding acquisition, M.H.; investigation, Y.S.; software, S.G.; supervision, M.H.; validation, C.Y.; writing—original draft, Z.Z.; writing—review and editing, Z.Z. All authors have read and agreed to the published version of the manuscript.

Funding

The authors acknowledge the financial support provided by The Fundamental Research Funds for the Central Universities 2021YJS116 and the National key R & D program funding (2018YFC0808701).

Institutional Review Board Statement

The study did not require ethical approval.

Informed Consent Statement

Not applicable.

Data Availability Statement

The data used to support the findings of this study are included in the article. Some or all data, models or codes generated or used during the study are available from the corresponding author by request.

Conflicts of Interest

The authors declare no conflict of interest.

References

  1. Leca, E.; Dormieux, L. Upper and lower bound solutions for the face stability of shallow circular tunnel in frictional material. Geotechnique 1990, 40, 581–606. [Google Scholar] [CrossRef] [Green Version]
  2. Soubral, A.H. Three-dimensional face stability analysis of shallow circular tunnels In Proceedings of the International Conference on Geotechnical and Geological Engineering, Melbourne, Australia, 19–24 November 2000.
  3. Mollon, G.; Dias, D.; Soubra, A.H. Face Stability Analysis of Circular Tunnels Driven by a Pressurized Shield. J. Geotech. Geoenviron. Eng. 2010, 136, 215–229. [Google Scholar] [CrossRef] [Green Version]
  4. Hernández, Y.Z.; Farfán, A.D.; Assis, A.P. Three-dimensional analysis of excavation face stability of shallow tunnels. Tunn. Undergr. Space Technol. 2019, 92, 103062. [Google Scholar] [CrossRef]
  5. Murayama, S.; Endo, M.; Hashiba, T.; Yamamoto, K.; Sasaki, H. Geotechnical aspects for the excavating performance of the shield machines. In Proceedings of the 21st Annual Lecture in Meeting of Japan Society of Civil Engineers, Tokyo, Japan, 1966. [Google Scholar]
  6. Jancsecs, S.; Steiner, W. Face support for a large mix-shield in hrterogeneous ground conditions. In Proceedings of the Institute of Mining and Metallurgy and British Tunneling Society, London, UK, 5–7 July 1994; pp. 531–549. [Google Scholar]
  7. Broere, W. Tunnel Face Stability and New CPT Applications; Delft University of Technology: Delft, The Netherlands, 2001. [Google Scholar]
  8. Wei, G.; Feng, H. Calculation of minimum support pressure of pipe jacking excavation face in sandy soil. J. Undergr. Space Eng. 2007, 5, 903–908. [Google Scholar]
  9. Mingfeng, L.; Limin, P.; Chenghua, S. Calculation and analysis of ultimate support force of shield tunnel excavation face under the condition of facing slope. J. Geotech. Eng. 2010, 32, 488–492. [Google Scholar]
  10. Jinli, Q.; Yitong, Z.; Jian, G. Stability analysis of excavation face of multi-layer soil shield tunnel considering seepage. Rock Soil Mech. 2010, 31, 1497–1502. [Google Scholar]
  11. Wenting, H.; Xilin, L.; Maosong, H. Three dimensional limit equilibrium solution of limit support pressure on excavation face of shield tunnel. J. Undergr. Space Eng. 2011, 7, 853–856. [Google Scholar]
  12. Zheng, C.; Ping, H.; Dumin, Y. Upper limit analysis of tunnel face stability under advanced support. Rock Soil Mech. 2019, 40, 2154–2162. [Google Scholar]
  13. Kan, H.; Yonglin, A.; Jian, Y. Influence of seepage force on tunnel face stability of NATM tunnel. J. Cent. South Univ. 2019, 50, 1221–1228. [Google Scholar]
  14. Jianglin, Z. Study on Stability of Tunnel Face with Large Section in Shallow Broken Section; Hunan University of Science and Technology: Xiangtan, China, 2019. [Google Scholar]
  15. Hanyuan, L. Stability analysis of shallow tunnel face under pure clay condition. J. Railw. Sci. Eng. 2020, 17, 3150–3156. [Google Scholar]
  16. Xiuying, W.; Kai, L.; Lijuan, W.; Weihan, Z.; Xindong, W. Study on ultimate support pressure of tunnel face in soft surrounding rock. Railw. Trans. 2019, 41, 110–117. [Google Scholar]
  17. Bingyong, W.; Jianqi, W.; Weixing, W.; Weijun, M. Study on tunnel face instability mechanism of shallow buried large section tunnel in Loess Plateau. J. Railw. Eng. 2020, 37, 67–72. [Google Scholar]
  18. Mingnian, W.; Xiao, Z.; Siguang, Z.; Zhilong, W.; Dagang, L.; Jianjun, T. Study on design method of advance support system for mechanized full section construction of tunnel in soft surrounding rock. Railw. Trans. 2020, 42, 146–154. [Google Scholar]
  19. Kirsch, A. Experimental investigation of face stability of shallow tunnels in sand. Acta Geotech. 2010, 5, 43–62. [Google Scholar] [CrossRef] [Green Version]
  20. Jun, D.; Zhirong, M.; Lilei, F.; Yongzhao, C. Study on stability of tunnel face in shallow soft surrounding rock based on strength reduction method. Mod. Tunn. Technol. 2020, 57, 51–57. [Google Scholar]
  21. Jianjun, T. Study on failure mode and influencing factors of tunnel face in sandy surrounding rock. Subgrade Eng. 2010, 4, 72–74. [Google Scholar]
  22. Zhang, Z.; Jin, X.; Luo, W. Numerical Study on the Collapse Behaviors of Shallow Tunnel Faces under Open-Face Excavation Condition Using Mesh-Free Method. J. Eng. Mech. 2019, 145, 04019085. [Google Scholar] [CrossRef]
  23. Peisong, G. Study on Safety Review of Subway Station Construction Scheme; Huazhong University of Science and Technology: Wuhan, China, 2016. [Google Scholar]
Figure 1. Minimum causal unit. (a) Single factor; (b) Two factors.
Applsci 12 07881 g001
Figure 2. Test model device. (a) Model test device; (b) Model design drawing.
Applsci 12 07881 g002
Figure 3. Variation curve of horizontal displacement of measuring points on tunnel face under three conditions.
Applsci 12 07881 g003
Figure 4. Deformation of tunnel face under condition Γ1 + Γ2. (a) Lateral view; (b) Front view.
Applsci 12 07881 g004
Table 1. Basic assumptions.
NumberDescribe
1When the risk factors (Γ) do not exist, the system risk is 0.
2When a risk factor changes from non-occurrence to occurrence, the risk of the system will not be reduced.
3Under the same objective situation, the risk of the system remains unchanged and has nothing to do with the result of causal analysis.
4When the state of all factors is unknown, the risk of a system will not be reduced after adding risk factors to the system without considering the coupling effect.
Table 2. Definition of occurrence degree of omen event and possibility of loss event.
Omen EventLoss EventEvaluation Value
[0, 79%] Alarm valueImpossible[0, 10)
Rare[10, 100)
Occasionally[100, 1000)
[80%, 99%] Alarm valuePossible[1000, 10,000)
[100%, +∞] Alarm valueFrequent[10,000, +∞)
Table 3. Definition table of extrusion deformation and risk probability of tunnel face.
Extrusion Deformation of Tunnel FacePossibility of Tunnel Face Collapse RiskProbability of Risk OccurrenceRisk Level
[0, 79%] Limit valueRare<0.0011
Occasionally[0.001~0.01)2
[80, 100%] Limit valuePossible[0.01~0.1)3
[100%, +∞] Limit valueFrequent[0.1~1)4
Table 4. Particle composition of test formation material.
Particle Diameter/mm2~0.50.5~0.250.25~0.075<0.075Natural Moisture Content/%Name
Mass proportion/%9.939.644.75.816.02Medium sand
Table 5. Definition table of extrusion deformation and risk probability of tunnel face collapse.
Extrusion Deformation of Tunnel Face/mmRisk Possibility of Tunnel Face CollapseProbability of Risk OccurrenceRisk Level
0~3.92Rare<0.0011
Occasionally[0.001~0.01)2
3.92~4.48Possible[0.01~0.1)3
4.48~5.6Frequent[0.1~1)4
Table 6. Risk assessment of tunnel face collapse and instability.
Monitoring Time/min8121416
Condition Γ1Extrusion deformation of tunnel face/mm1.062.533.673.98
Risk probability/%0.270.640.932.14
Risk level2223
Condition Γ2Extrusion deformation of tunnel face/mm0.81.722.242.34
Risk probability/%0.20.40.570.59
Risk level2222
Condition Γ1 + Γ2Extrusion deformation of tunnel face/mm1.082.653.925.6
Risk probability/%0.270.671090
Risk level2234
Publisher’s Note: MDPI stays neutral with regard to jurisdictional claims in published maps and institutional affiliations.

