1. Introduction
Water-polo is an aquatic sport characterized by a number of complex movements that require the contribution and the coordination of all human body segments [
1]. Players make frequent changes in movement, speed, and direction to maintain position in the water, to block opponents, and to execute counter-attacks [
2,
3], with the ultimate intention of making effective shots and scoring goals [
4,
5].
Several studies have focused on analyzing and evaluating the different determinants of performance in water-polo. Motor performance and athletic techniques were analyzed, such as the vertical thrust both on the water and dry land (vertical jump) [
1,
6], different crawl swimming styles were compared [
3], and a very specific technique of water-polo, the eggbeater kick, was analyzed [
7]. Physiological indices [
8] and body composition [
9] were also evaluated during high-intensity training in elite male water-polo athletes.
Considering that shooting is the crucial action that allows to score and therefore to win the game [
4], different studies have focused on this specific phase. The effectiveness of the shot is influenced by the power, accuracy, fatigue, position of the player, and the defensive pressure of the opponents. Therefore, both tactical and technical factors are involved.
The analysis of tactical factors was performed by investigating games of the European and/or World Championships [
4,
5,
10,
11,
12], of the Brazilian National Tournament [
13], and comparing elite water and sub-elite polo games [
14]. Among the technical parameters, the throwing velocity [
4,
5,
15,
16,
17,
18] and shooting accuracy [
4] were considered as primary indicators.
Throwing velocity of the ball, direction, and power are indeed important determinants of the effectiveness of the shot. They are the result of the kinematics and kinetics of the upper body. However, only a few papers addressed the evaluation of upper limb kinematics in water-polo players. In [
19], the linear displacement, velocity, and acceleration of the ball, wrist, elbow, and shoulder joints were investigated, considering the water-polo overarm throwing gesture. Moreover, shoulder and elbow angular kinematics, and head height were compared in elite and sub-elite players, while performing penalty shots without the goal keeper [
16]. Finally, the resultant joint forces and torques in shoulder, elbow, and wrist joints were assessed during penalty shots using an inverse dynamic approach [
20], while electromyographic activity of selected shoulder and arm muscles were recorded while players executed penalty, overhead, backhand, and push shots [
21].
To authors’ knowledge, in previous literature research there is no kinematic analysis involving female players, nor any consideration of different types of shots. The principal aim of the current work is the description and comparison of throwing kinematics (throwing velocity, shoulder angle, elbow angle) in three different types of water-polo shots performed by female players. A second aim was to evaluate the throwing accuracy in terms of precision score [
21] in the three different shots.
2. Materials and Methods
Experimental tests were conducted on female players, considering three different types of shots. Upper-limb kinematics, power and shot precision were monitored during experimental tests and compared before and after 45 days of a specific training program previously scheduled with the team trainer. The correlation between angular kinematics (shoulder and elbow angles) and throwing velocity was also analyzed.
2.1. Subjects
Eleven female players (age: 22.3 ± 3.5 years; body mass: 63.5 ± 5.2 kg; height: 169.1 ± 3.6 cm) voluntarily participated in the study. Based on the classification criteria suggested by [
22], participants’ experience can be classified in the Tier 2-Trained/Developmental tier. The following inclusion criteria were considered for the recruitment:
Age under 30 years.
No declared musculoskeletal diseases at shoulder and elbow joints (injuries, surgery, fractures, pain requiring the continuous use of analgesics or muscle relaxants) in the last five years.
At least three years of water-polo experience in the B-level regional championship.
Participation into a water-polo team playing in the regional championship organized by the Italian Swimming Federation when performing the experimental tests.
The aim of the study and the experimental procedure were clearly explained to the participants. Written informed consent was obtained from all participants before starting the experimental test and the training program. The study was approved by the Local Institutional Review Board. All procedures conformed to the Helsinki Declaration.
2.2. Instruments
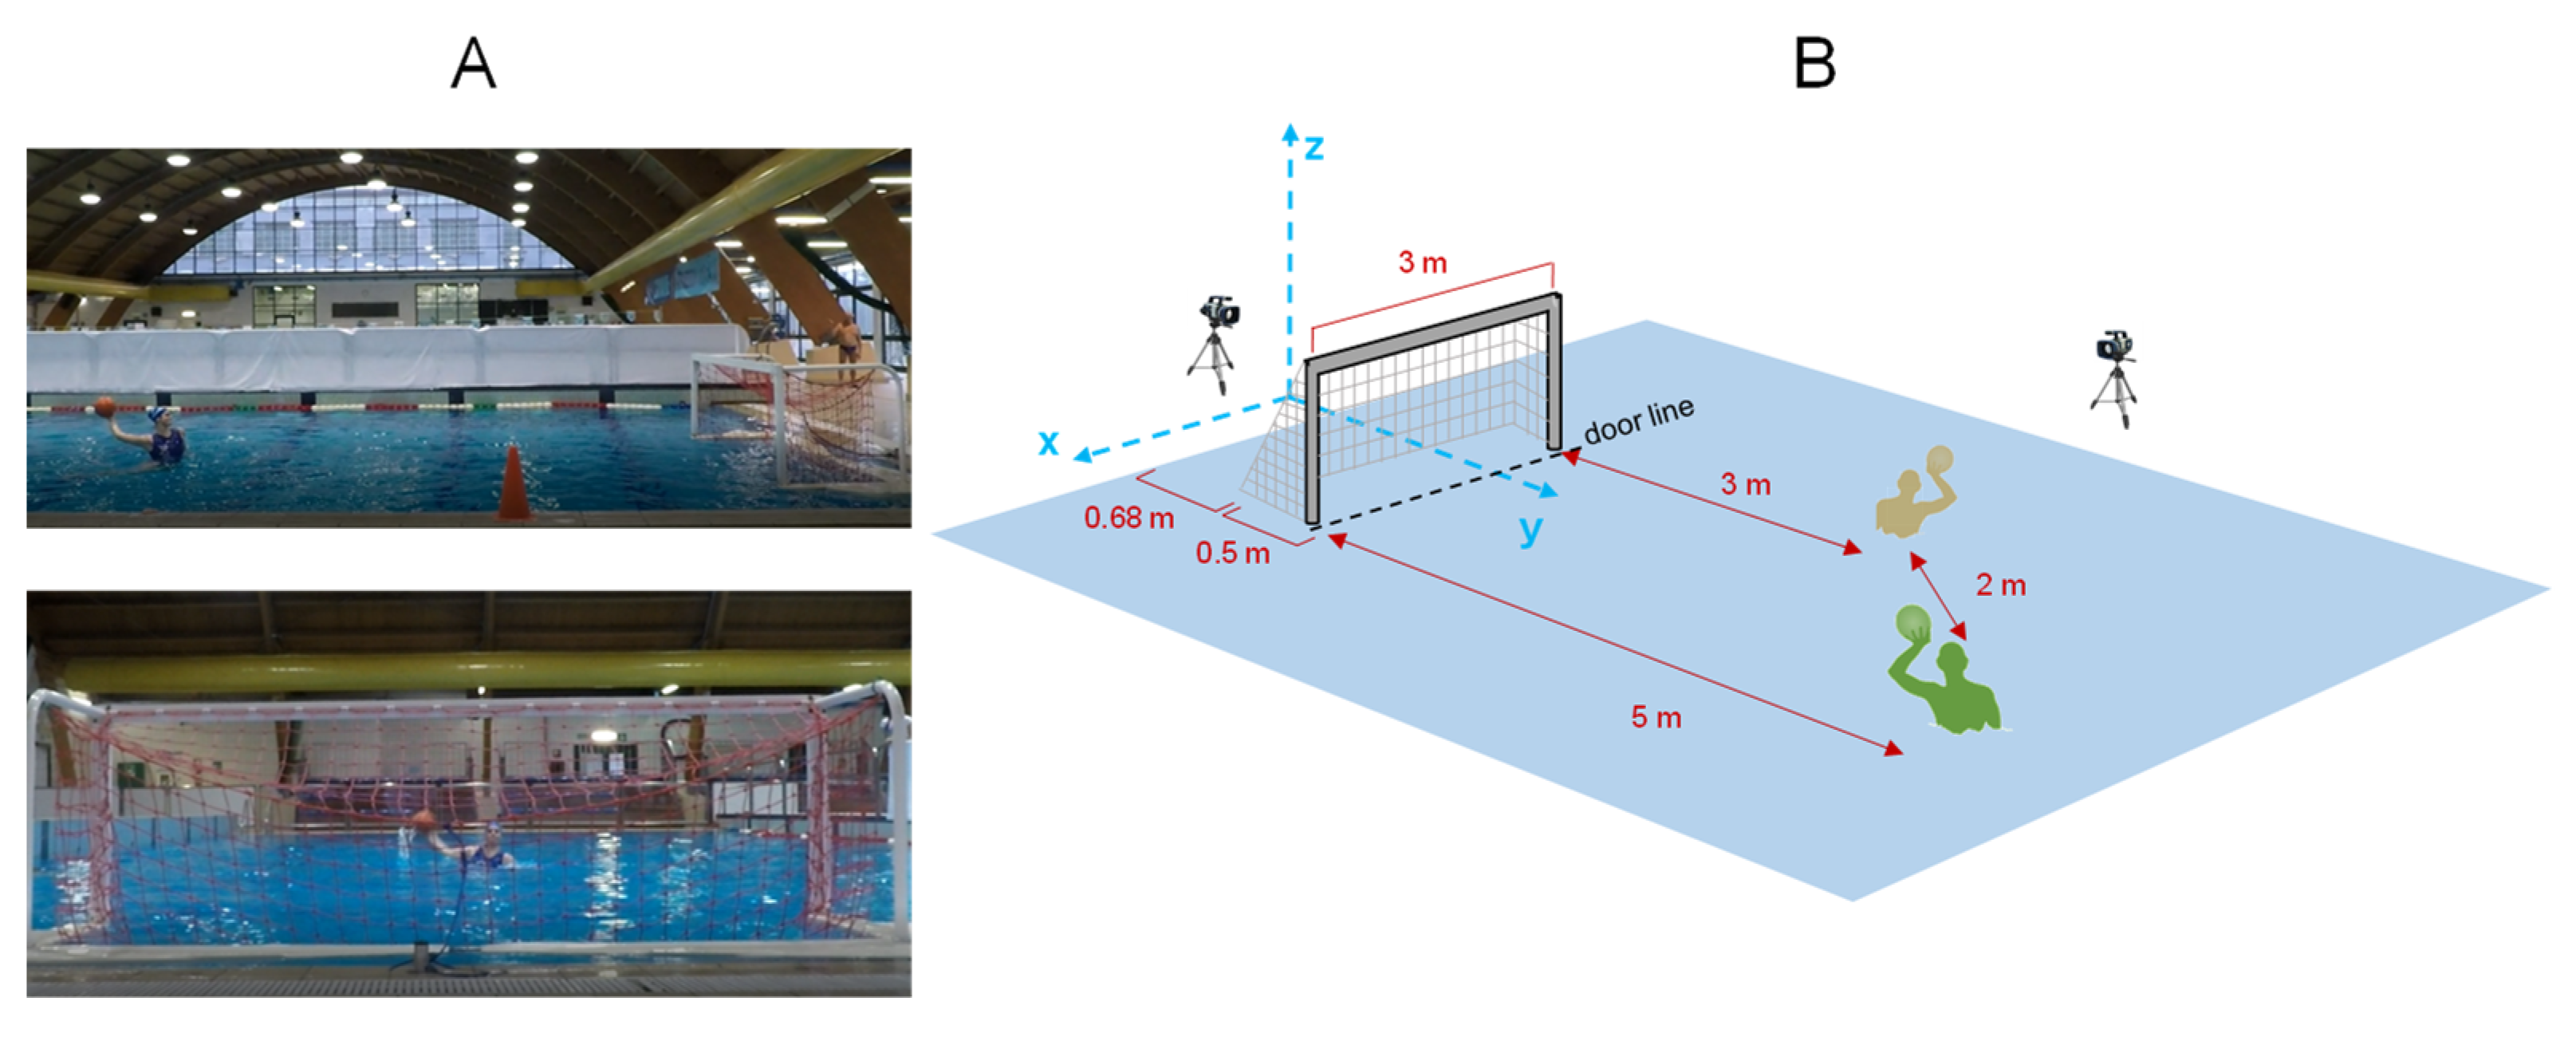
Experimental tests were conducted in the indoor swimming pool of the “Aquatica Torino Center” (Turin, Italy). Two Action Camera GoPro Hero 4 Silver cameras (30 Hz and 1080 p for the calibration procedure, 120 Hz and 720 p for the data acquisition) were used for the video recording and the software
Simi Motion (Simi Reality Motion Systems GmbH© 2022, Germany) was adopted for the video elaboration. The two cameras were positioned with frontal and lateral views of the subject for the 3D reconstruction. A PVC customized panel with eight reference points was used for the calibration procedure, while an external white and intermittent light was used for the synchronization of the two cameras. The left panel of
Figure 1 (
Figure 1A) depicts one player from lateral and frontal views during the test; the right panel (
Figure 1B) represents a 3D scheme of the capture volume describing the distances, the video-cameras’ locations, and subjects’ positions during the tests. The global reference system XYZ was defined in correspondence with the water-polo door.
One arena water-polo ball for women (650–660 mm circumference, 105 mm radius, 400–424 g mass) and one certificated water-polo door (3 m inside length, 0.9 m inside height, 0.5 m depth) were used during the testing trials. In addition, a medicine ball (1 kg mass) was adopted during the training exercise.
2.3. Experimental Design
2.3.1. Calibration Procedure
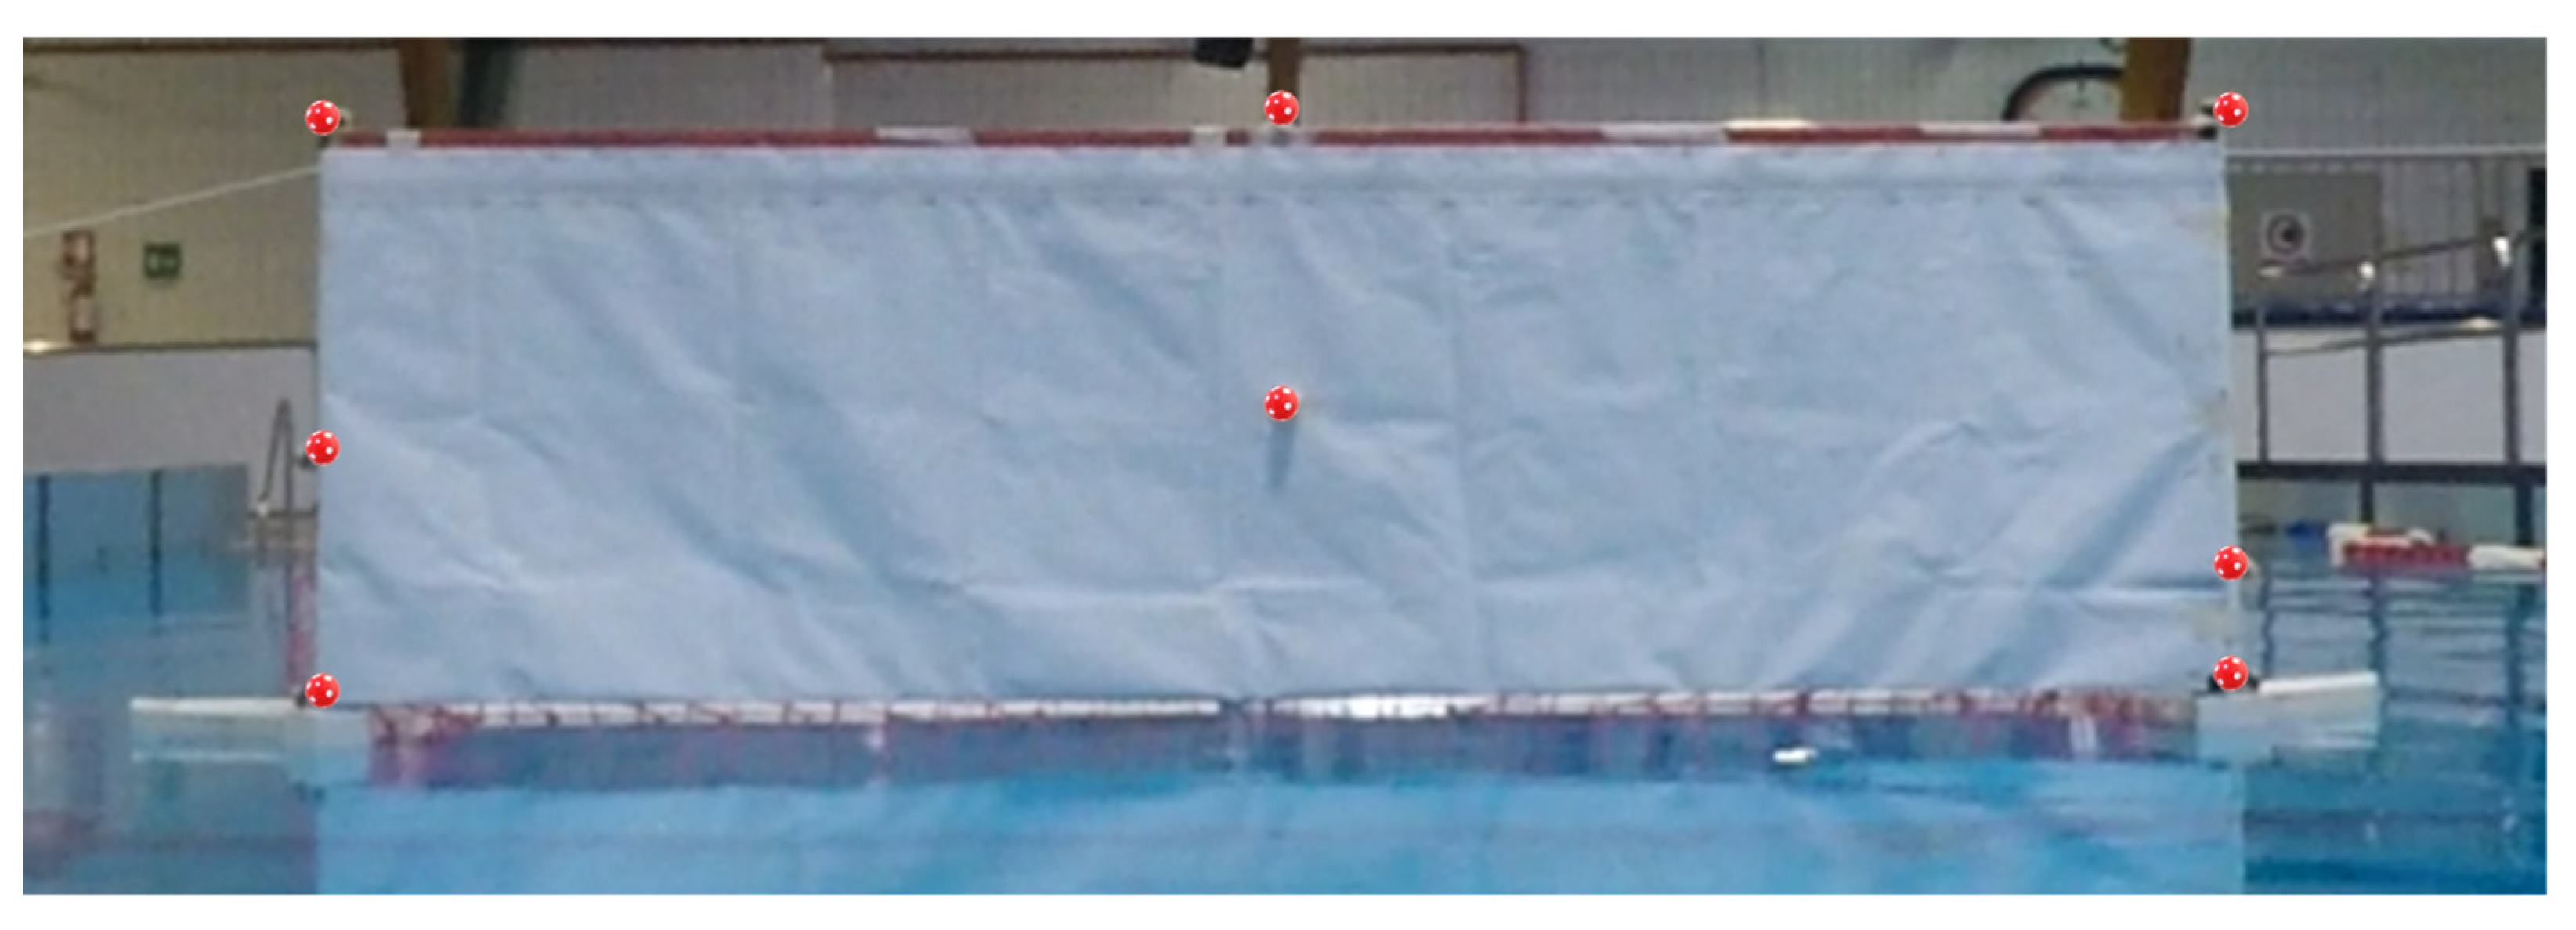
A 3D calibration was implemented and conducted before the testing trials (
Figure 2). A customized PVC panel with eight reference points at a predefined distance was developed. Small tennis balls were positioned in correspondence with the reference points (red color) to guarantee the acquisition from both cameras. The panel was positioned on the water-polo door and several calibration trials were recorded. In particular, the water-polo door with the customized panel was positioned in front of the first camera at four measured distances, then it was rotated 90° and positioned in front of the second camera at four measured distances. This procedure allowed to consider a large amount of calibration points, covering all the capture volume.
2.3.2. Experimental Test
The experimental tests were conducted in two different experimental sessions, before (Pre) and after (Post) a training program of 45 days. Testing trials required the subject to execute three different types of shots: penalty shot, passing-spontaneous shot, and passing-feint-shot.
Penalty shot (PS): the player is positioned at 5 m from the door line. When receiving the external signal (whistle), she takes the ball, lifts the ball over her head, performs a lateral rotation of the trunk and of the shoulder, carries the ball behind the head, rotates the trunk and the shoulder medially, extends the elbow, and flexes the wrist while shooting the ball. This sequence of movements contributes to enhance the power of the shot.
Passing-spontaneous shot (PSS): the player is positioned at 5 m from the door line; after the external whistle she receives the ball from another player positioned 2 m away from her position (
Figure 1B), then she performs the same sequence of movements of the PS.
Passing-feint shot (PFS): the player is positioned at 5 m from the door line; after the external whistle, she receives the ball from another player positioned 2 m away from her position (
Figure 1B), makes a feint before performing the PS sequence of movements.
The subjects were asked to perform shots aiming at the door, with their highest precision and maximum power. For each subject and for each type of shot, three trials were recorded and considered for data processing. The second and the third shots were realized with the assistance of another player, since they involved the passing phase. The pairing players and passing player were randomized, but they remained unchanged before and after the training session.
2.3.3. Training Exercise
A training program was defined in collaboration with the personal trainer of the water-polo team with particular interest in power and precision throwing performance. The traditional training program was proposed four days a week with two hours for each training session. Two exercises for power and two exercises for precision were added to the traditional training. The study protocol imposed on the volunteers the following training frequency: four days a week, three hours for each training session. Considering the weekly program, two days were selected for the power exercises and two days for the precision exercises.
Power exercises. The first exercise was conducted in water; the players juggled the medical ball in groups. The second exercise was conducted on dry land. The player was positioned 1.5 m from the wall and she performed a static frontal lunge with the rear knee on the floor. From that position, the player juggled the medical ball on the wall.
Precision exercises. The first exercise was conducted in water; the player performed a set of free shots using the water-polo ball. The second exercise was performed on dry land; the player was positioned 1.5 m from the wall and she performed a static frontal lunge with the rear knee on the floor and the homolateral arm extended over the head. From that position, the player juggled the water-polo ball and hit a target positioned on the wall.
2.4. Signal Processing and Data Analysis
Video recordings were edited with the software Wondershare Filmora 11 (Wondershare Technology), to reduce the fisheye, and converted into an avi format. Calibration data were also processed for the setting of a global reference system. Video data were post-processed with Simi Motion to track the ball trajectory and calculate 3D values of position, velocity, and acceleration of the ball. Five parameters were estimated: shoulder and elbow angles, maximum velocity of the ball, throwing power, and shot precision score, as detailed below. Customized Matlab® routines were developed to implement data analysis.
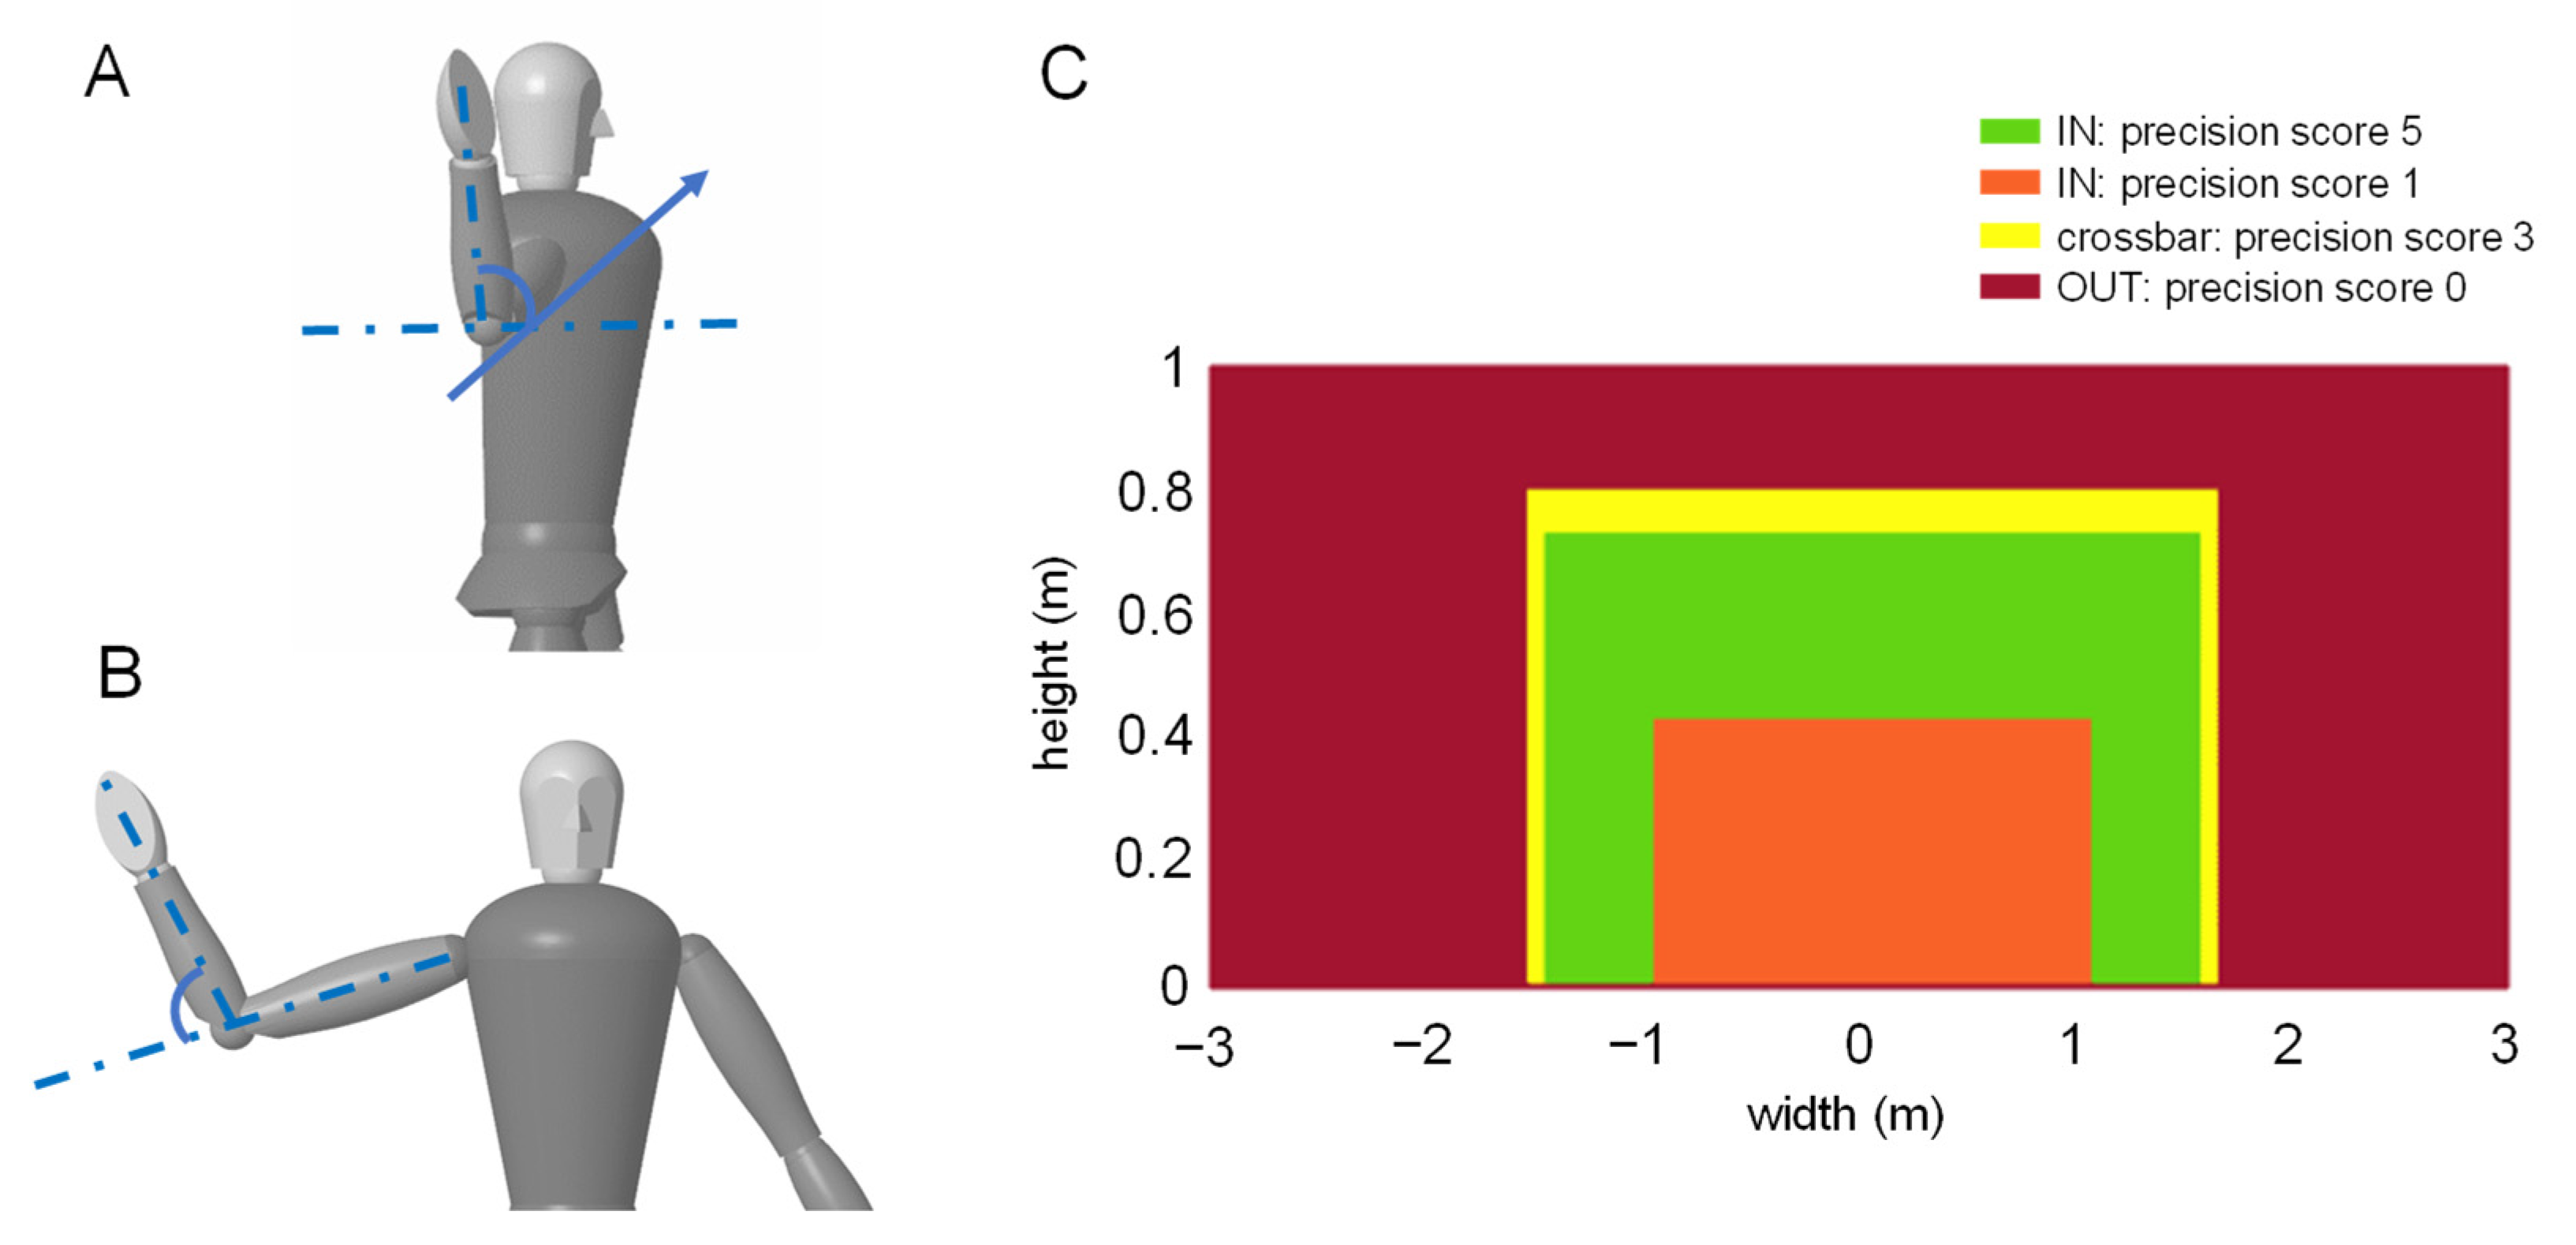
Shoulder and Elbow Joint Kinematics. The kinematics of the shoulder and elbow joints at the throwing phase (instant of separation of the ball from the player’s hand) were estimated from the video data with
Simi Motion. Considering the typical kinematics of overarm throwing, the internal/external shoulder rotation and the elbow flexion/extension were calculated [
23,
24]. In particular, the internal/external rotation angle of the shoulder was estimated as the angle between the plane defined by the shoulder–elbow–wrist joints and the horizontal plane (
Figure 3A). The elbow flexion/extension angle was obtained as the angle between the axis crossing the shoulder and the elbow joints and the axis crossing the elbow and the wrist joints (
Figure 3B) [
23,
24].
Velocity and Power. Through a preliminary evaluation of kinematic data along the different directions, the
y-axis (direction of the shot) was selected as the most representative direction. The maximum velocity of the ball along the
y-axis was estimated. Moreover, considering the throwing phase, the power was calculated through the simplified mathematical model:
where
F is the dot product between the mass of the ball (
m) and the acceleration of the ball along the
y-axis (
a) at the instant of throwing, and
Vmaxy is the maximum velocity of the ball along the
y-axis.
Shot Precision Score. The 3D coordinates of water-polo door corners were estimated from the video tracking for the calculation of the precision score. A customized algorithm was implemented and weighted scores were assigned to different throwing areas, as reported in
Figure 3C. Shots inside the perimeter of the door were scored higher than those to the center, as proposed by Yaghoubi and colleagues in a previous study [
21]. Four areas were identified:
Area 1 (green): predefined area with 0.5 m distance from goalposts and 0.3 m distance from the crossbar, precision score 5.
Area 2 (yellow): crossbar and goalposts of the water-polo door, precision score 3.
Area 3 (orange): center of the water-polo door, precision score 1.
Area 4 (red): out of the water-polo door, precision score 0.
A statistical analysis was implemented for the comparison of the biomechanical parameters of interest. The hypothesis of normality of their distribution was rejected with the Shapiro-Wilk test (α < 0.05). The three types of shots were considered separately and compared. For each parameter, the median value of the three valid trials was obtained for each subject, then median and interquartile range values were calculated among the population. A paired Wilcoxon signed rank test with level of significance α = 0.05 was implemented to test the differences between
Pre and
Post results. Moreover, the Spearman correlation coefficient was calculated between the elbow and shoulder angles, and between each of them and the maximum velocity along the
y-axis. Consistently with the literature, the positive correlation was considered strong with a coefficient of correlation R ≥ 0.7 [
25]. A linear regression analysis was used to model slopes from the kinematic and velocity data dispersion and the ANCOVA test was implemented to verify the statistical difference between the modeled regression lines before and after the training program.
3. Results
Results are reported for the three types of shots. The median and interquartile range (IQR) values of each biomechanical parameter are reported in
Table 1, both before and after the training program.
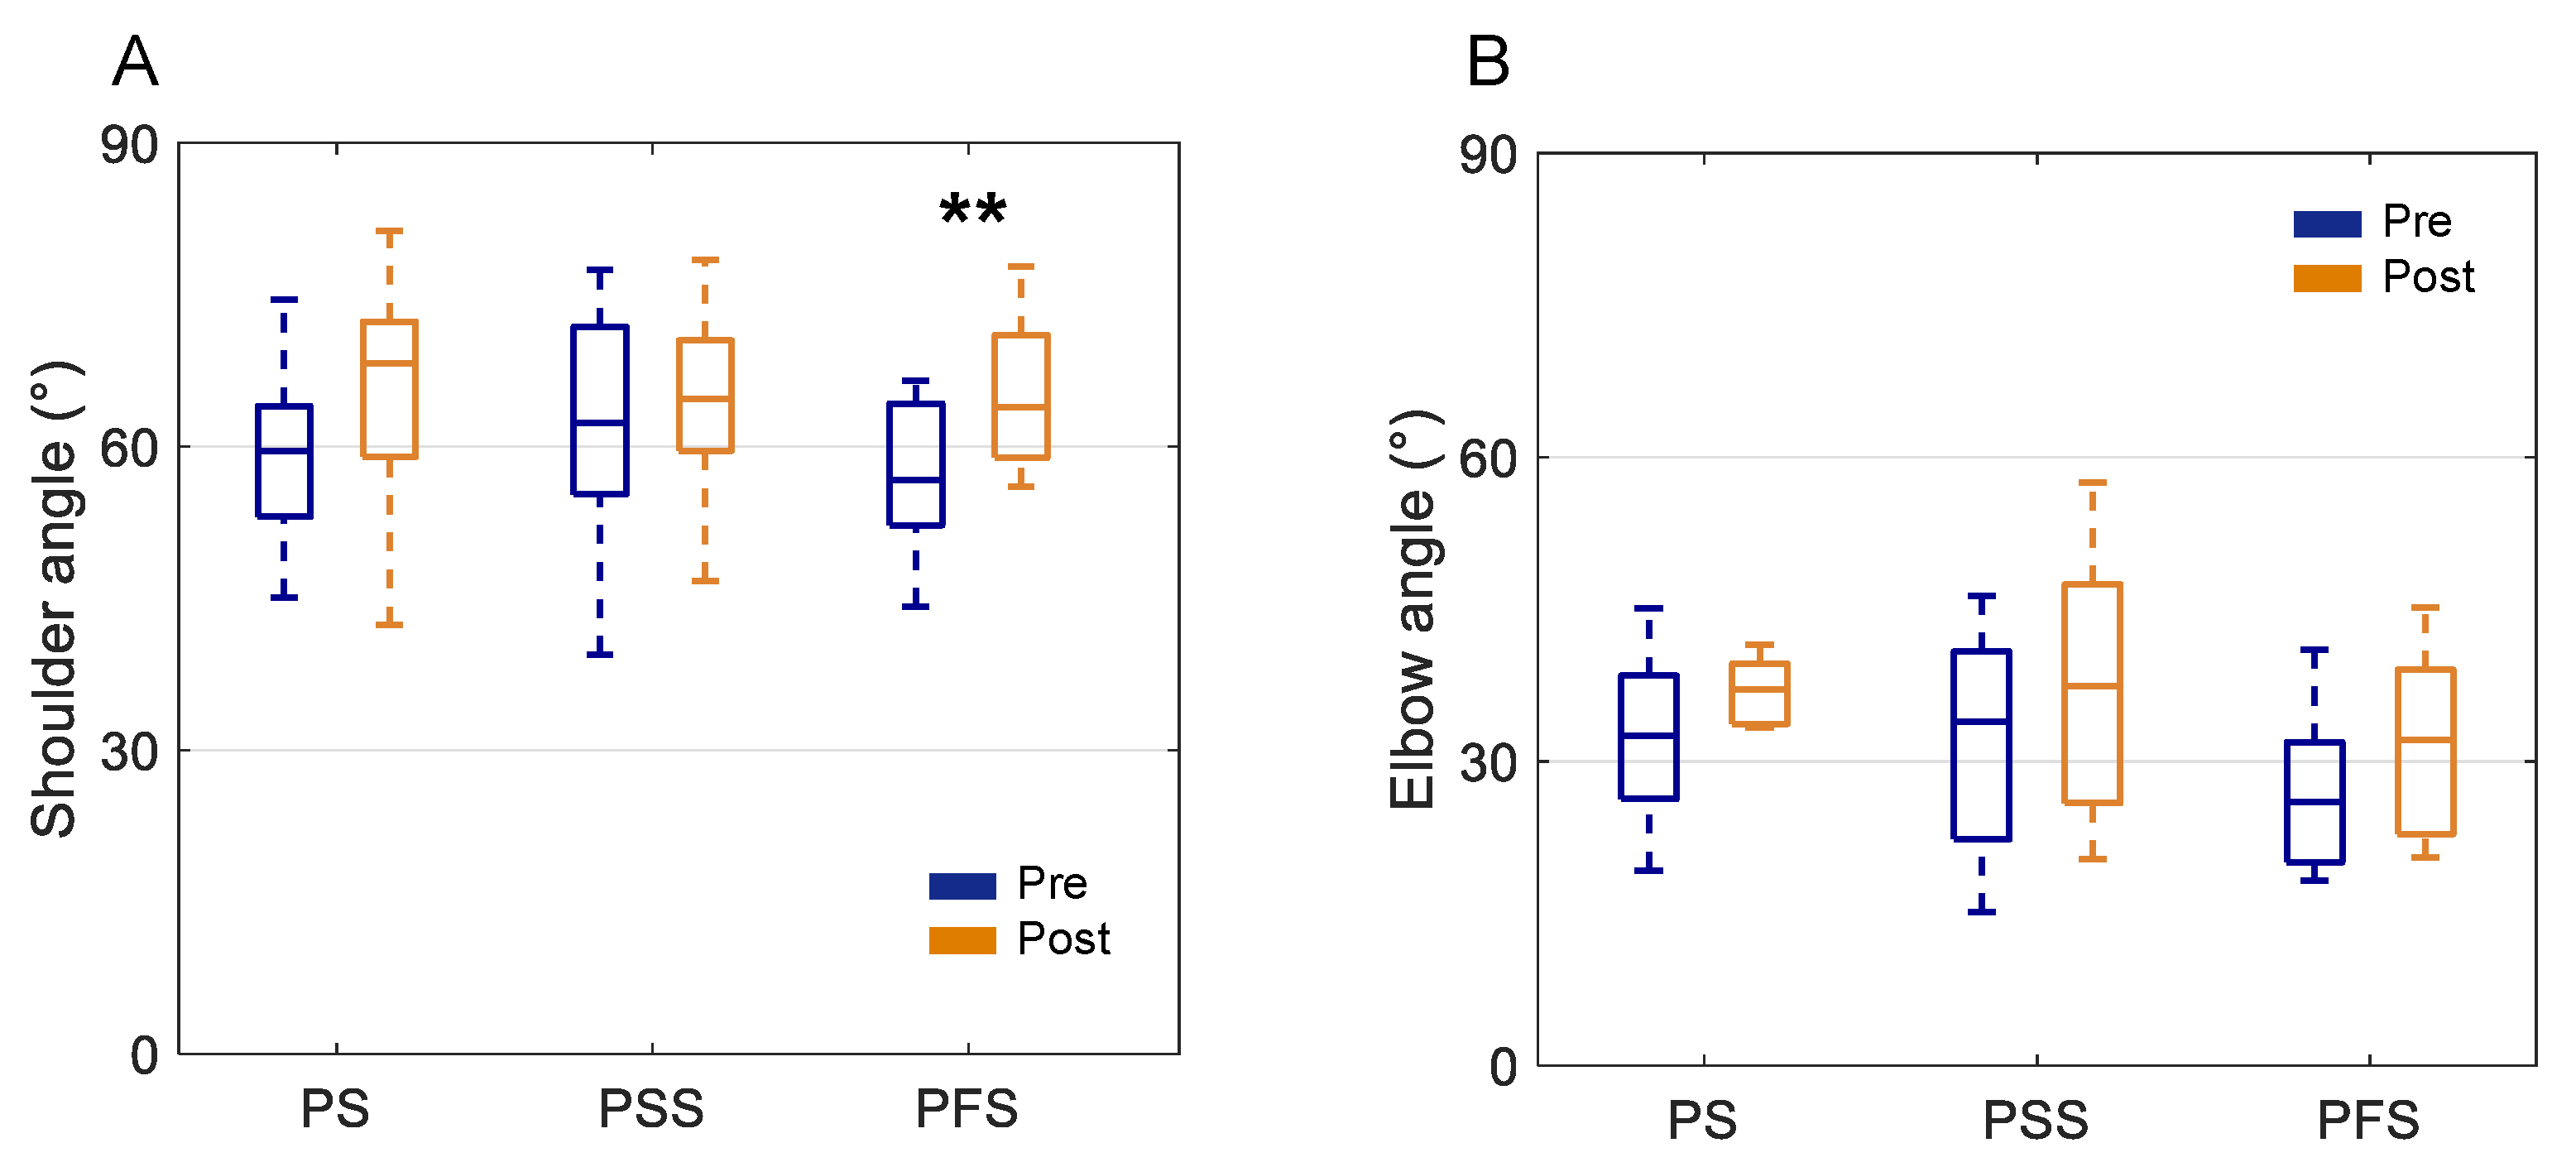
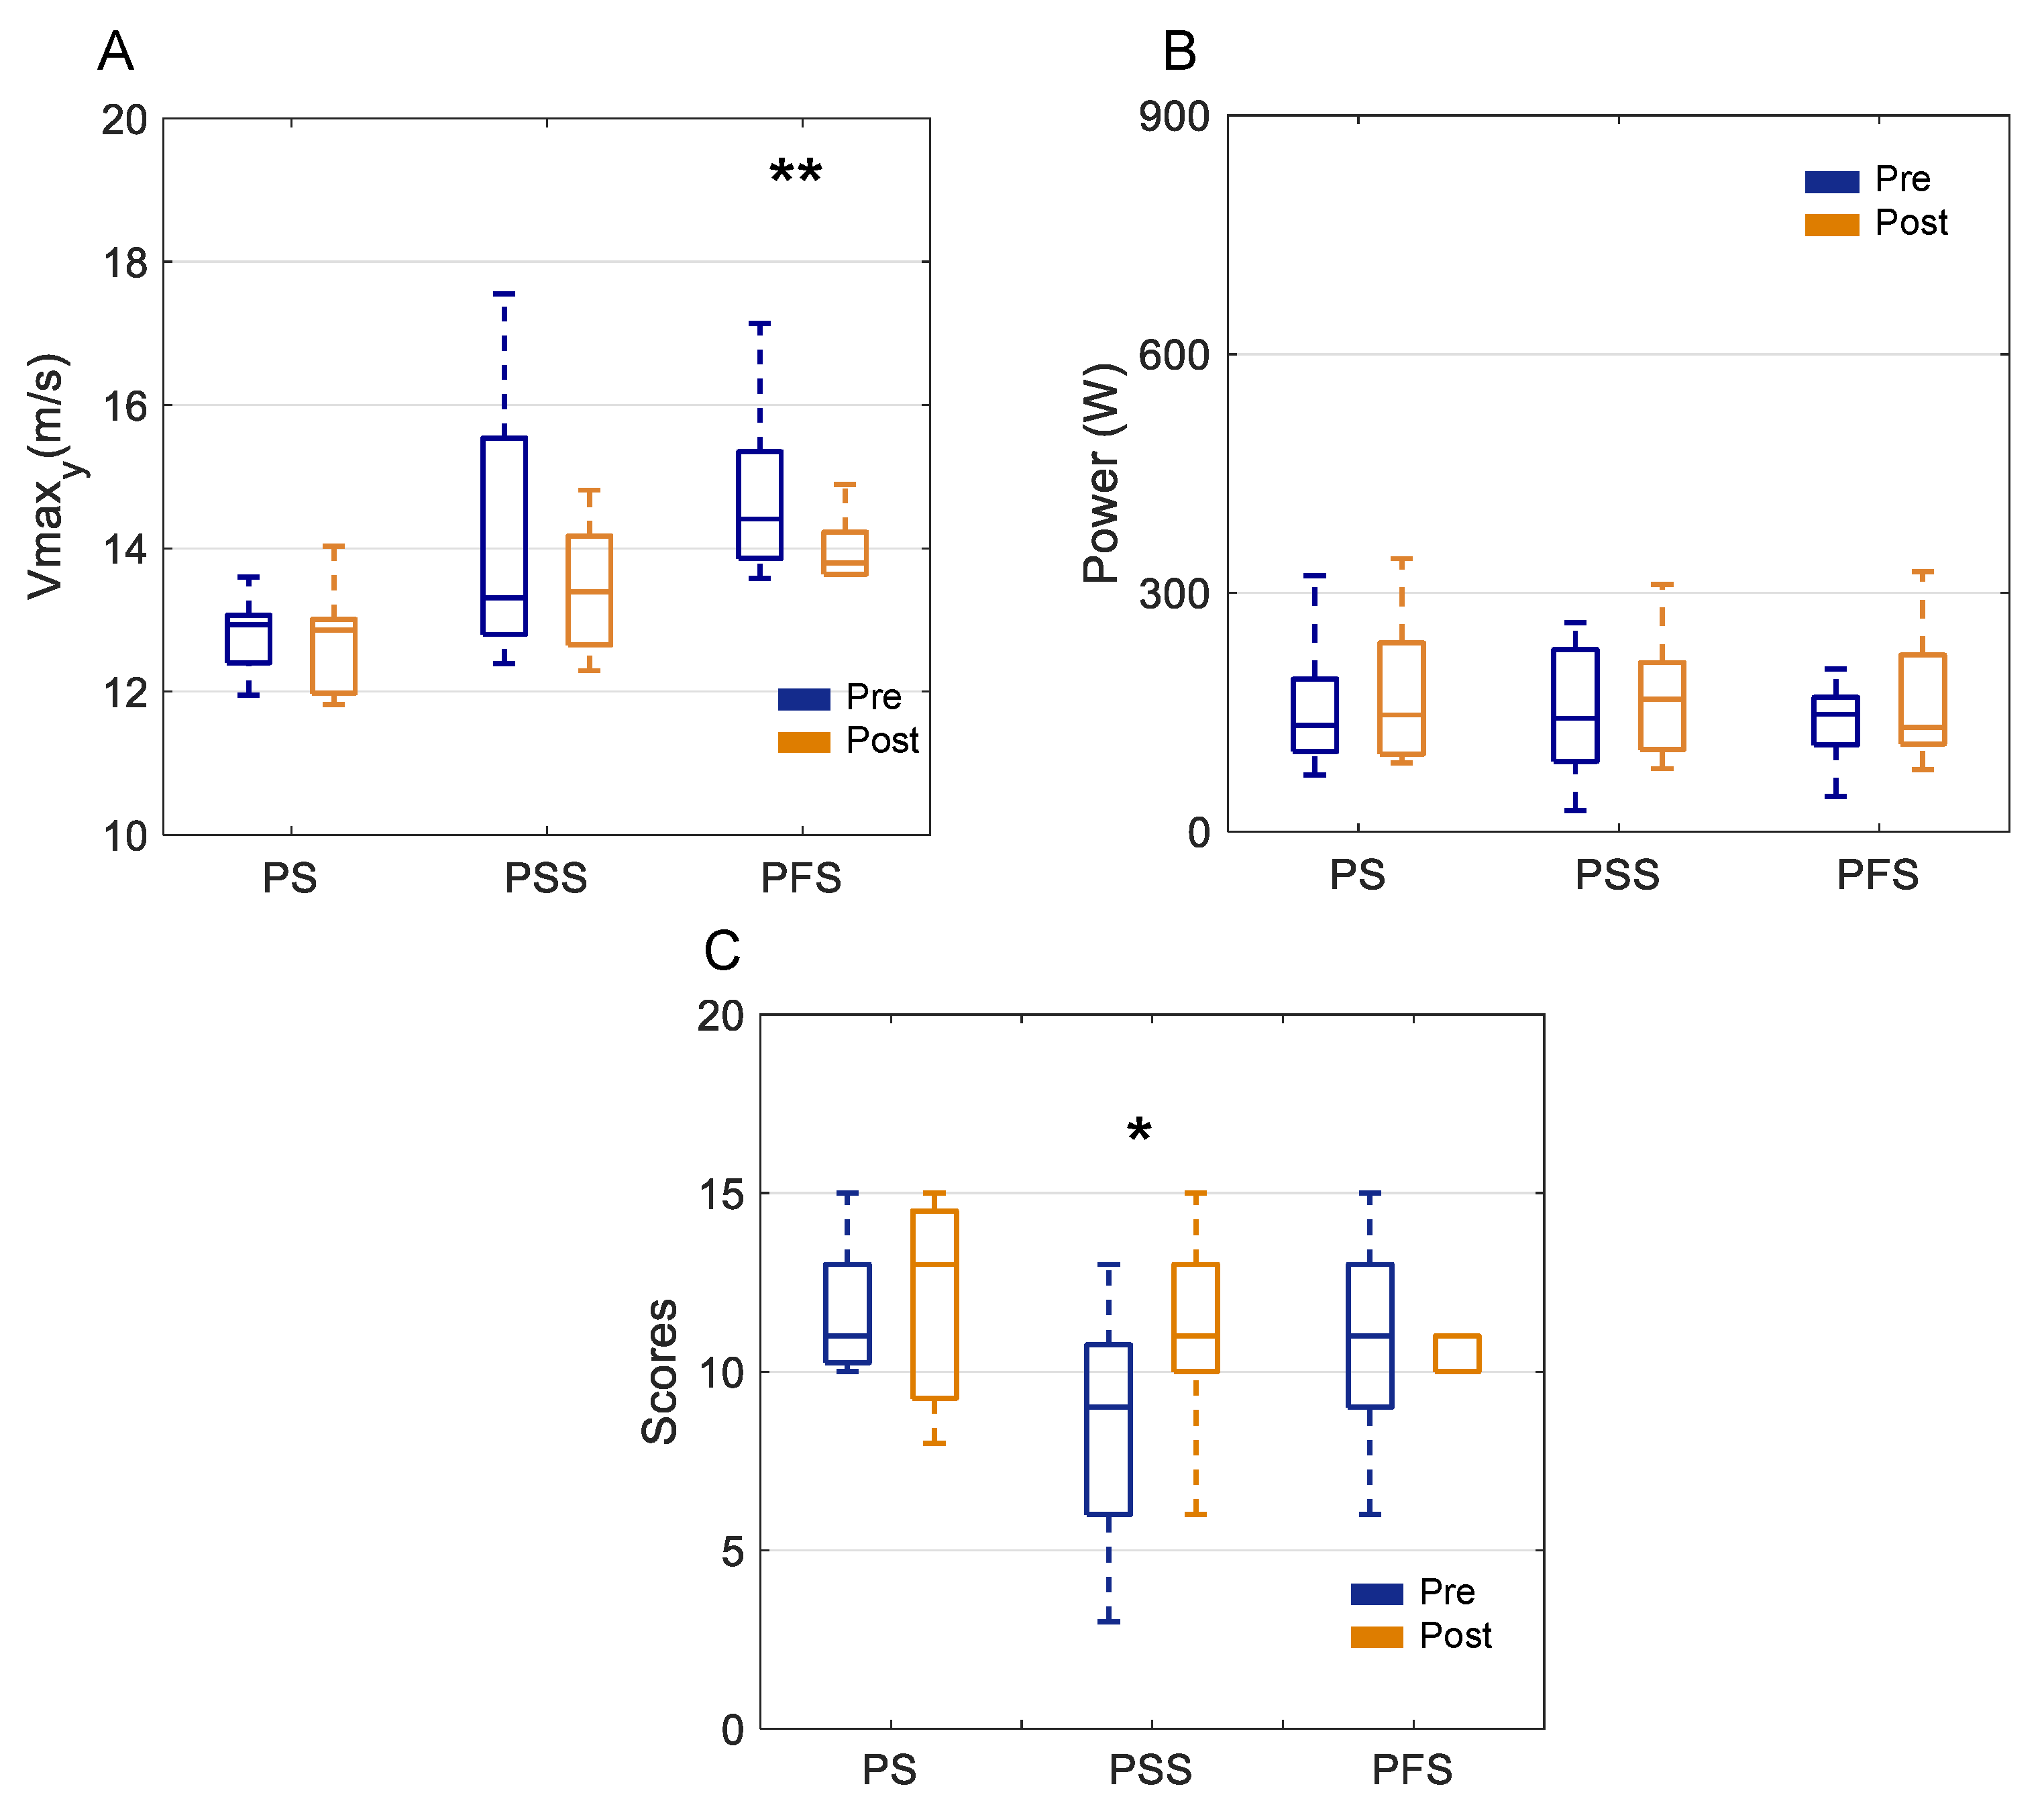
In PFS, the shoulder angle increased by 7° after the training (
p-value = 0.003), while the maximum velocity
Vmaxy resulted lower (14.7 m/s before the training, 13.9 m/s after the training,
p-value = 0.005). In the PSS shot, the precision score shows an increase of 2 scores after the training (
p-value = 0.05). No statistical differences were obtained in the comparison of elbow angles and power results. The Pre- and Post-training results are also graphically compared through boxplots.
Figure 4 shows the shoulder (A) and elbow (B) angles at the throwing phase, while
Figure 5 depicts the maximum velocity (A), the power estimated at the throwing phase (B), and the precision score (C).
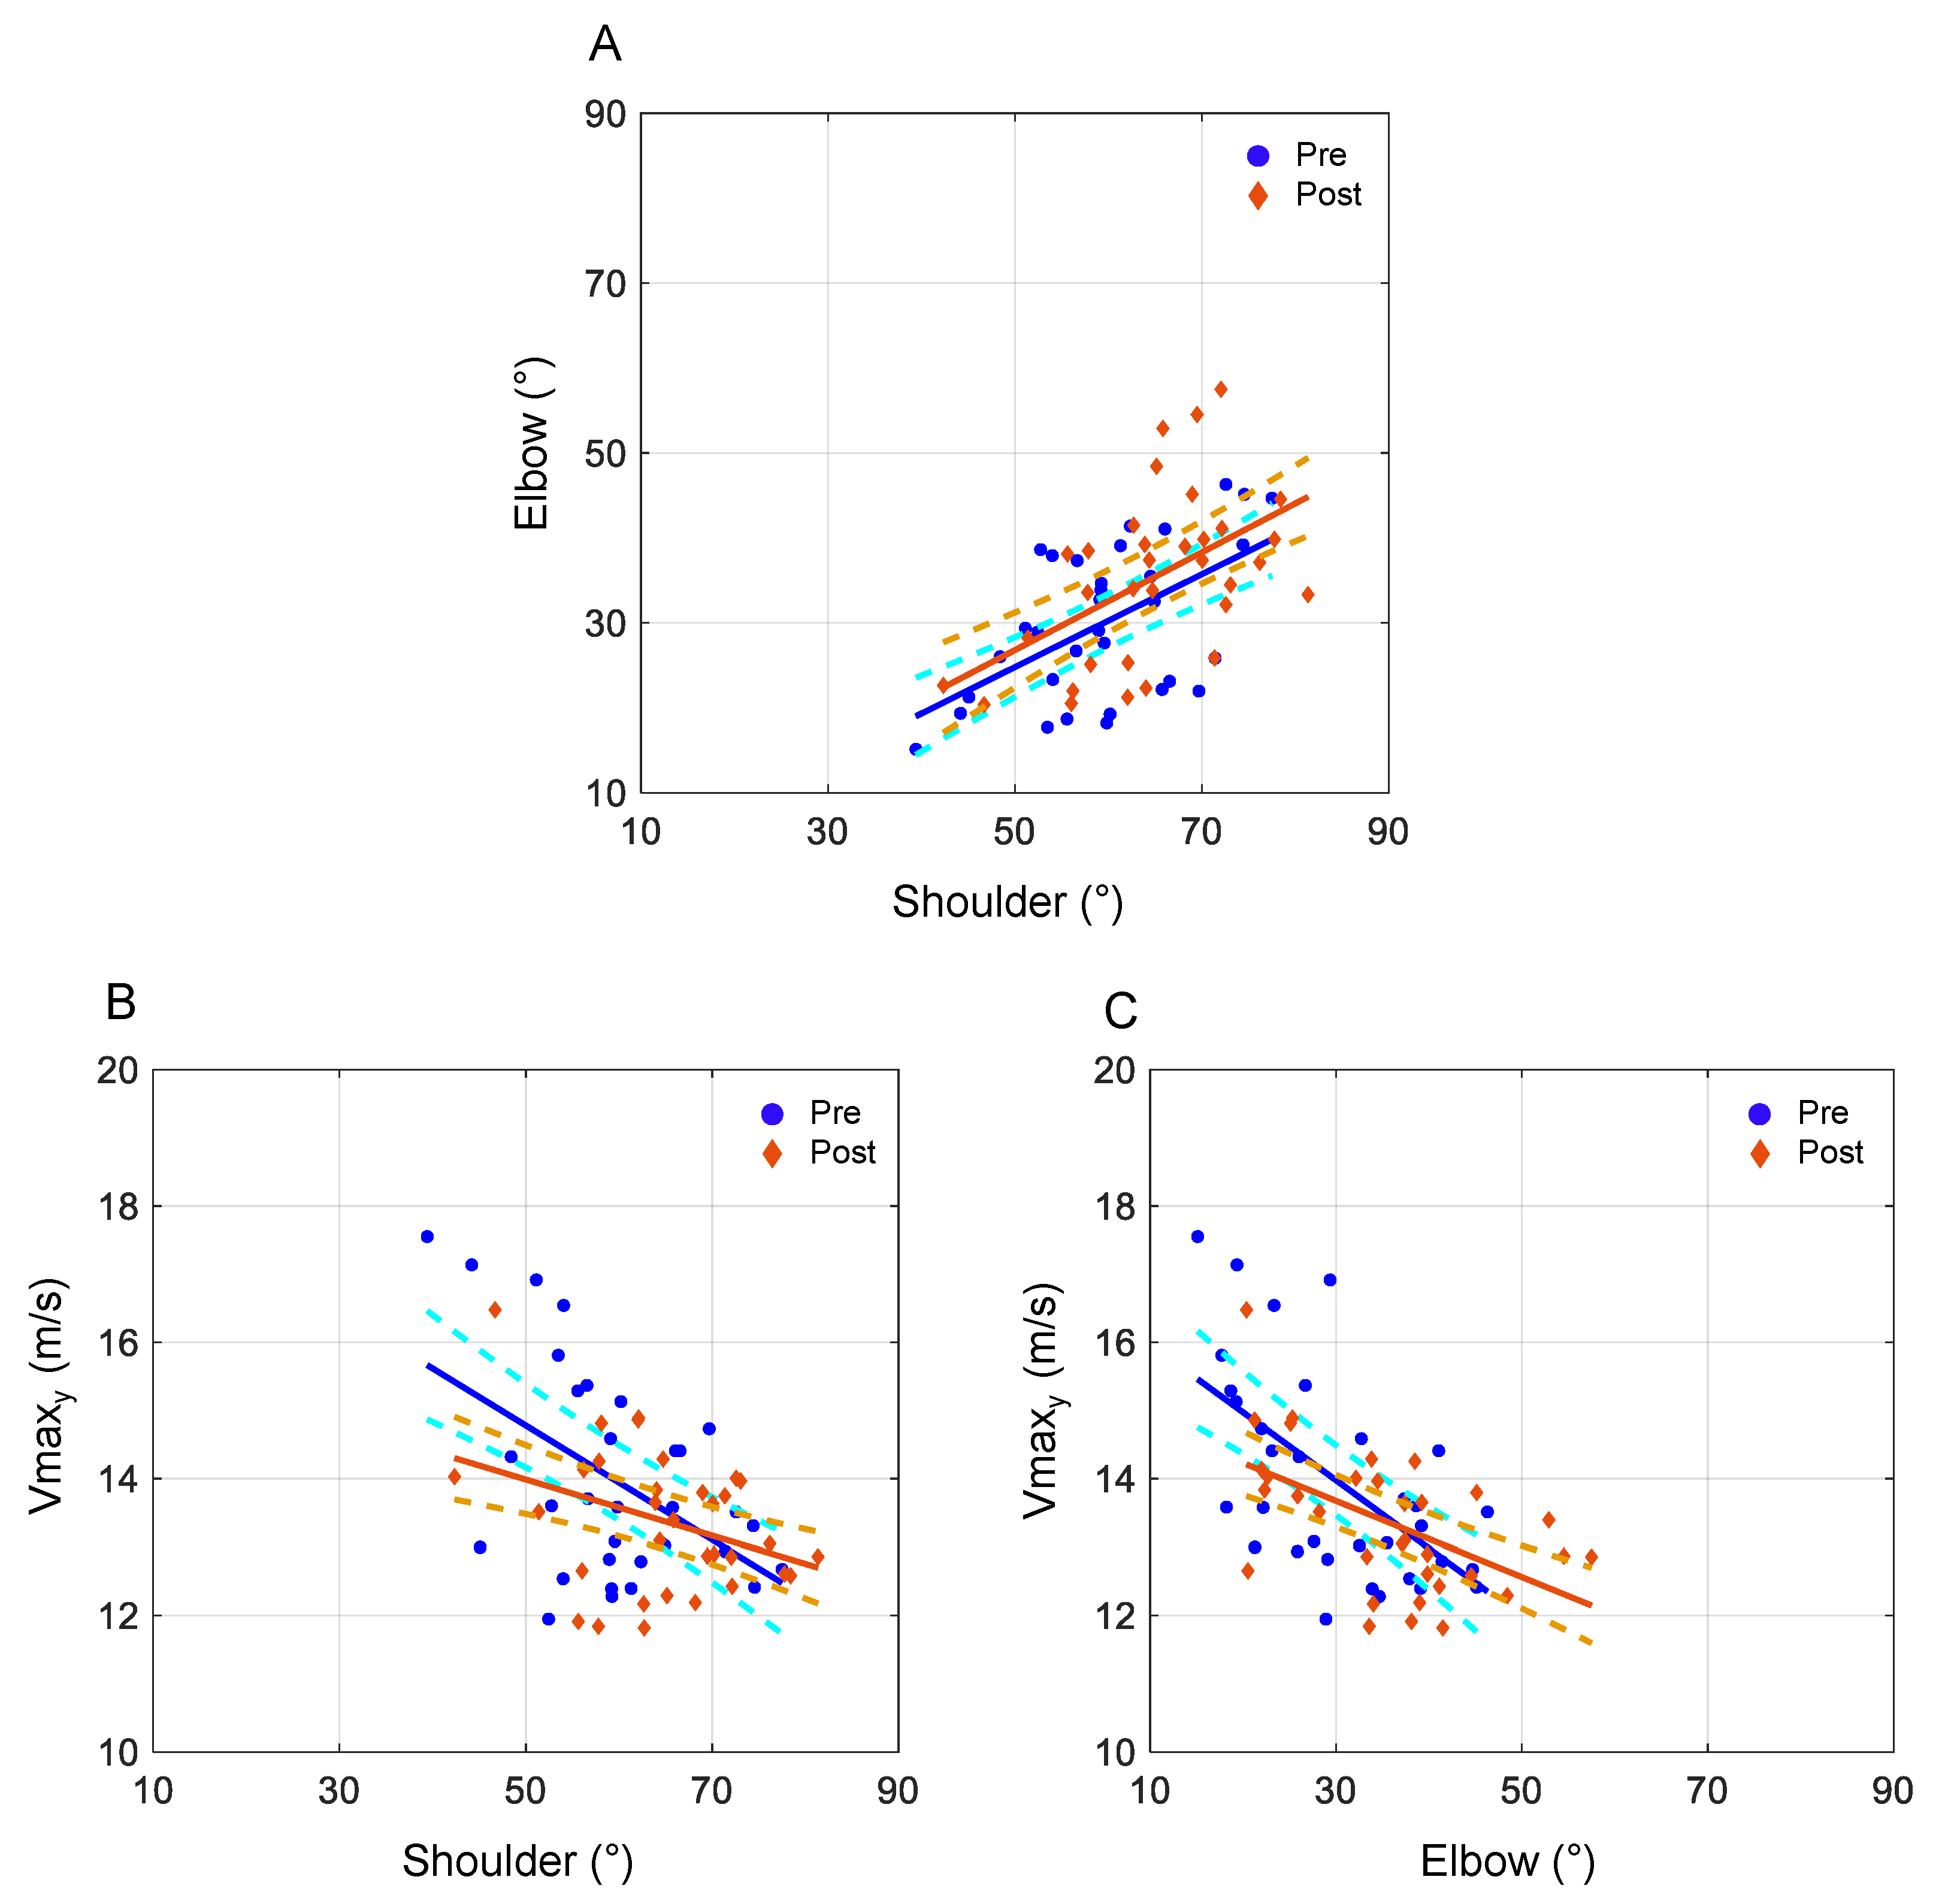
Figure 6 shows the regression analysis between the shoulder and elbow angles and between each of these angles and the maximum velocity (along the
y-axis), before and after training. The R values of correlation are reported in
Table 2. The analysis of the Shoulder–Elbow kinematic correlation revealed a positive R value (R = 0.47 before training; R = 0.51 after the training), while negative R values resulted in the correlation between kinematic angles and maximum velocity. In particular, a moderate correlation was found between the elbow angle and the velocity (R = −0.56, both before and after the training), while a weak correlation was found between the shoulder angle and the velocity (R = −0.36 before the training, R = −0.24 after the training). No statistical differences were found between regression lines before and after the training program.
4. Discussion
The present study proposed the comparative analysis of throwing kinematics in three different types of water-polo shots and the biomechanical investigation of the throwing performance in female water-polo players. Experimental tests were conducted before and after a specific training program. Similarly to other studies that focused on the effect of high-intensity training on performance in water-polo players [
15,
26], it was not possible to establish a control group, due to the limited number of players. We will discuss results obtained in two different experimental sessions,
Pre and
Post the additional training program, but due to the lack of the control group it is not possible to infer the effectiveness of the specific training program.
For each shot type (PS, PSS, PFS), the main findings highlight differences in shoulder kinematics, throwing velocity, and precision score for specific types of shot after training, while power does not show significant changes.
Based on previous studies, it is widely accepted that the throwing velocity of the ball and the player’s vertical jumping ability are essential skills for shooting in water-polo [
18]. For this reason, the throwing velocity was considered the kinematic parameter of interest. The current study presented the maximum velocity calculated along the
y-axis (
Figure 5A). Values are comparable to results presented by McCluskey et al. [
17] and Platanou et al. [
18] who analyzed the relationship between the throwing velocity and anthropometric characteristics in female water-polo players. McCluskey et al. [
17] found a median value of throwing velocity of 15.3 m/s when performing free-style penalty shot, while an average value of 15.5 m/s was found by Platanou et al. [
18]. In the present study, all the three types of shots presented comparable values of throwing velocity. No differences were pointed out in the comparison between
Pre and
Post training for the PS and PSS shots, while the PFS shot showed a significant reduction in the maximum velocity after the training (14.7 m/s before the training, 13.9 m/s after the training,
p-value = 0.005). The advantage of faster shots is related to the smaller time of interception by the opposing team, independently from the precision [
17], but the request for a more precise shot might influence the throwing velocity with a reduction in maximum values.
Considering the shoulder angular kinematics, all the three shots revealed results comparable with average values of 65° obtained in [
24]. In particular, the most similar value was obtained in the PSS after the training program. In addition, in the PFS shot the shoulder rotation was increased (7° greater in the
Post training test,
p-value = 0.003) after the training program, while no significant differences were obtained in the PS and PSS shots. Considering the elbow angle, Van den Tillaar et al. [
24] found an average value of 46°. In the present study, all the shot conditions revealed lower elbow angles, but the most similar was obtained in the PSS shot after the training session (37.4°). Moreover, a moderate correlation between shoulder rotation and elbow flexion was confirmed in all the three types of shots, both before (R = 0.47) and after the training (R = 0.51). This result demonstrates the influence of each joint on the rotation and on the final position of the upper limb during the movement.
The increase in shoulder angle and the reduction in ball velocity after the training can be explained by the request for a higher precision in performing the shot. Current findings are in agreement with previous literature. Van den Tillaar et al. [
24] stressed the relationship between upper arm kinematics and throwing performance. The current results of a negative moderate correlation between the ball velocity and the elbow angle (R = −0.56), and of a negative weak correlation between the ball velocity and the shoulder angle (R = −0.36) agree with the results obtained in [
24]. Results demonstrate the relationship of elbow angles to the throwing performance: subjects who perform faster shots present smaller elbow angles at the ball release, allowing ball acceleration over a longer trajectory [
24]. This correlation is depicted in all the three types of shots and it is maintained also after the training program (no statistical differences between regression lines).
As reported in
Table 1, in all shots the players obtained a good final precision score, but the highest score was obtained in the PS shot after the training session. After the training, the precision score slightly increased for the PSS shot (
p-value = 0.05), while no significant variations were obtained for the other two types of shots. Finally, no significant differences emerged in the comparison of power data at the throwing phase. This finding can be explained by the large variability in data recorded among the participants, which reflects the different level of expertise, and the mathematical assumptions adopted for the schematization of the power calculation.
Some limitations of the present research can be pointed out and they are mainly determined by the fact that the tests were performed in ecological conditions and recordings were made using only two cameras and without the use of markers. For this reason, only internal/external rotation of the shoulder and flexion/extension of the elbow were monitored. Due to the complexity of movements and joint coordination, some biomechanical and environmental parameters that might influence the gesture of throwing the ball were not measured and discussed in the regression analysis. The procedure adopted for measuring the shoulder rotation angle (considering the angle between the plane that contains the center of wrist, elbow, and shoulder joints and the horizontal plane), is appropriate only if the trunk is in the vertical position and the forearm is not fully extended. Considering the kinematics of the overarm throwing, and in particular the ball acceleration and release phases, the trunk has eventually only small flexion/extension angles and the forearm is never fully extended [
24]. Nevertheless, also small trunk angles affect the measured shoulder rotation angle. In addition, the absence of a control group and the short period of training between the two test sessions are important limits for the assessment of the training program effectiveness. Moreover, the indirect assessment of the throwing force could lead to a less accurate estimation of shot power, resulting in a large variability among participants.


