
Experimental Study on Bearing Capacity of Compression Members of Space Grid Structures Reinforced by RPC

Abstract
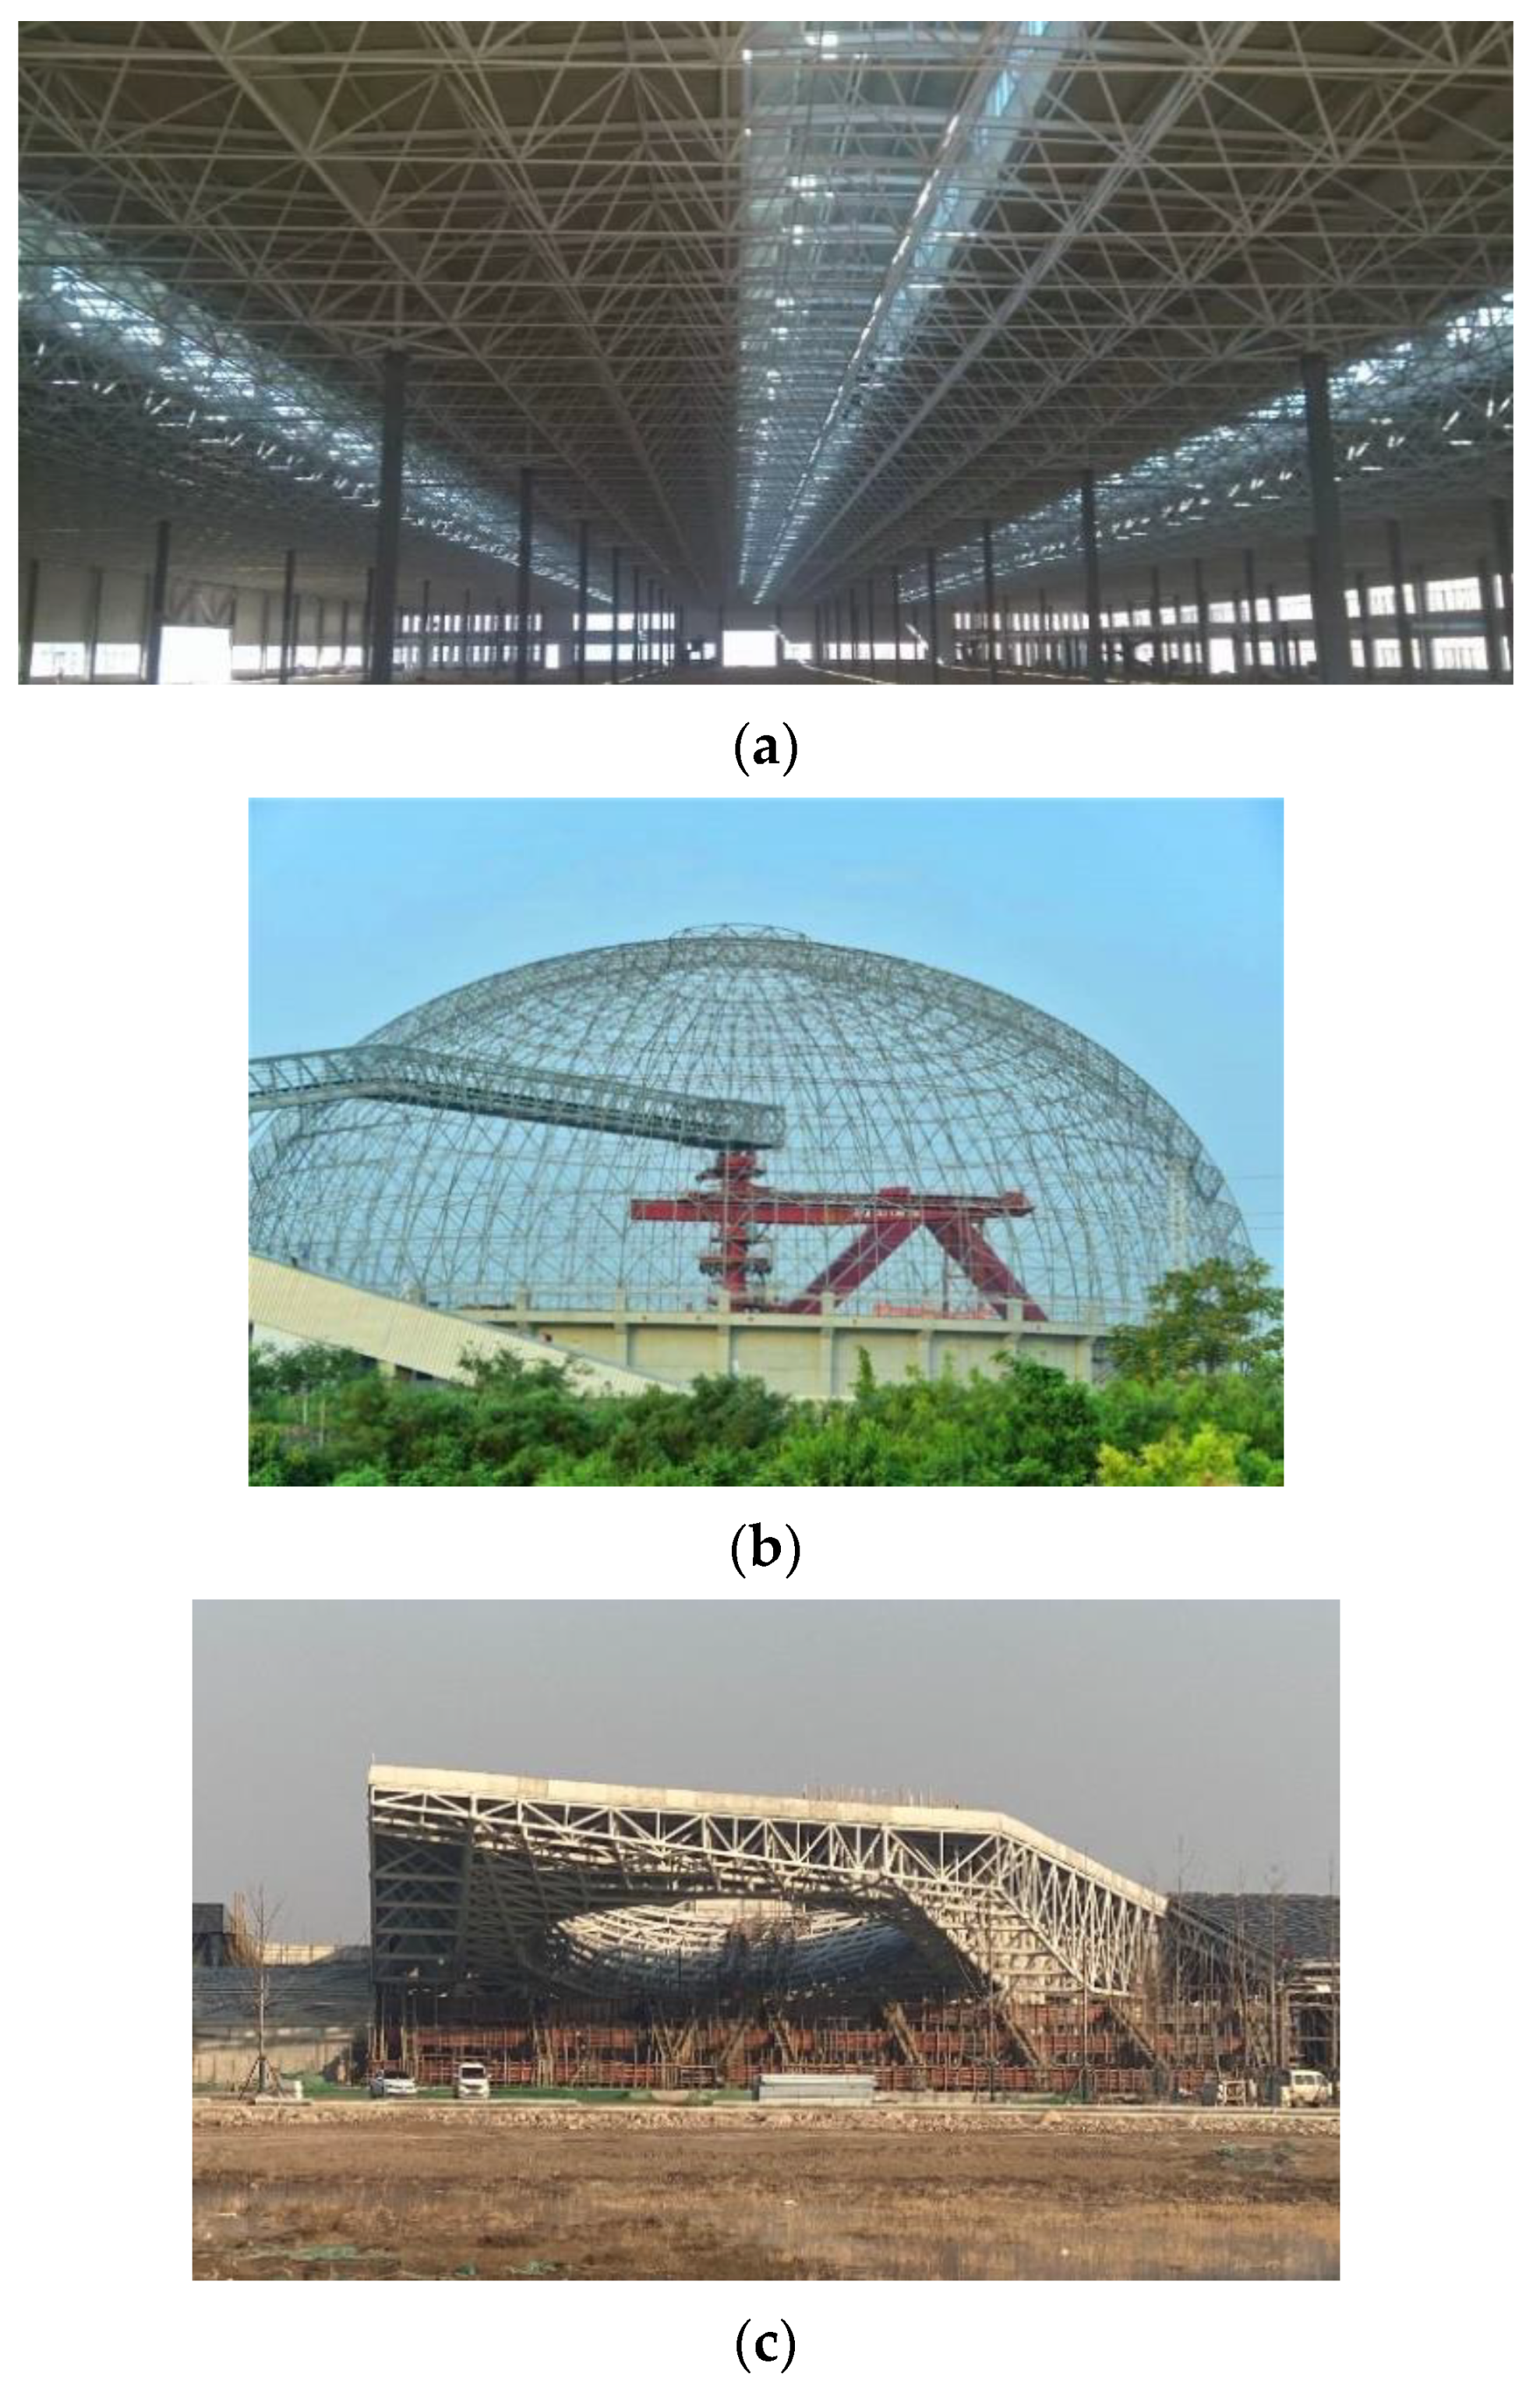
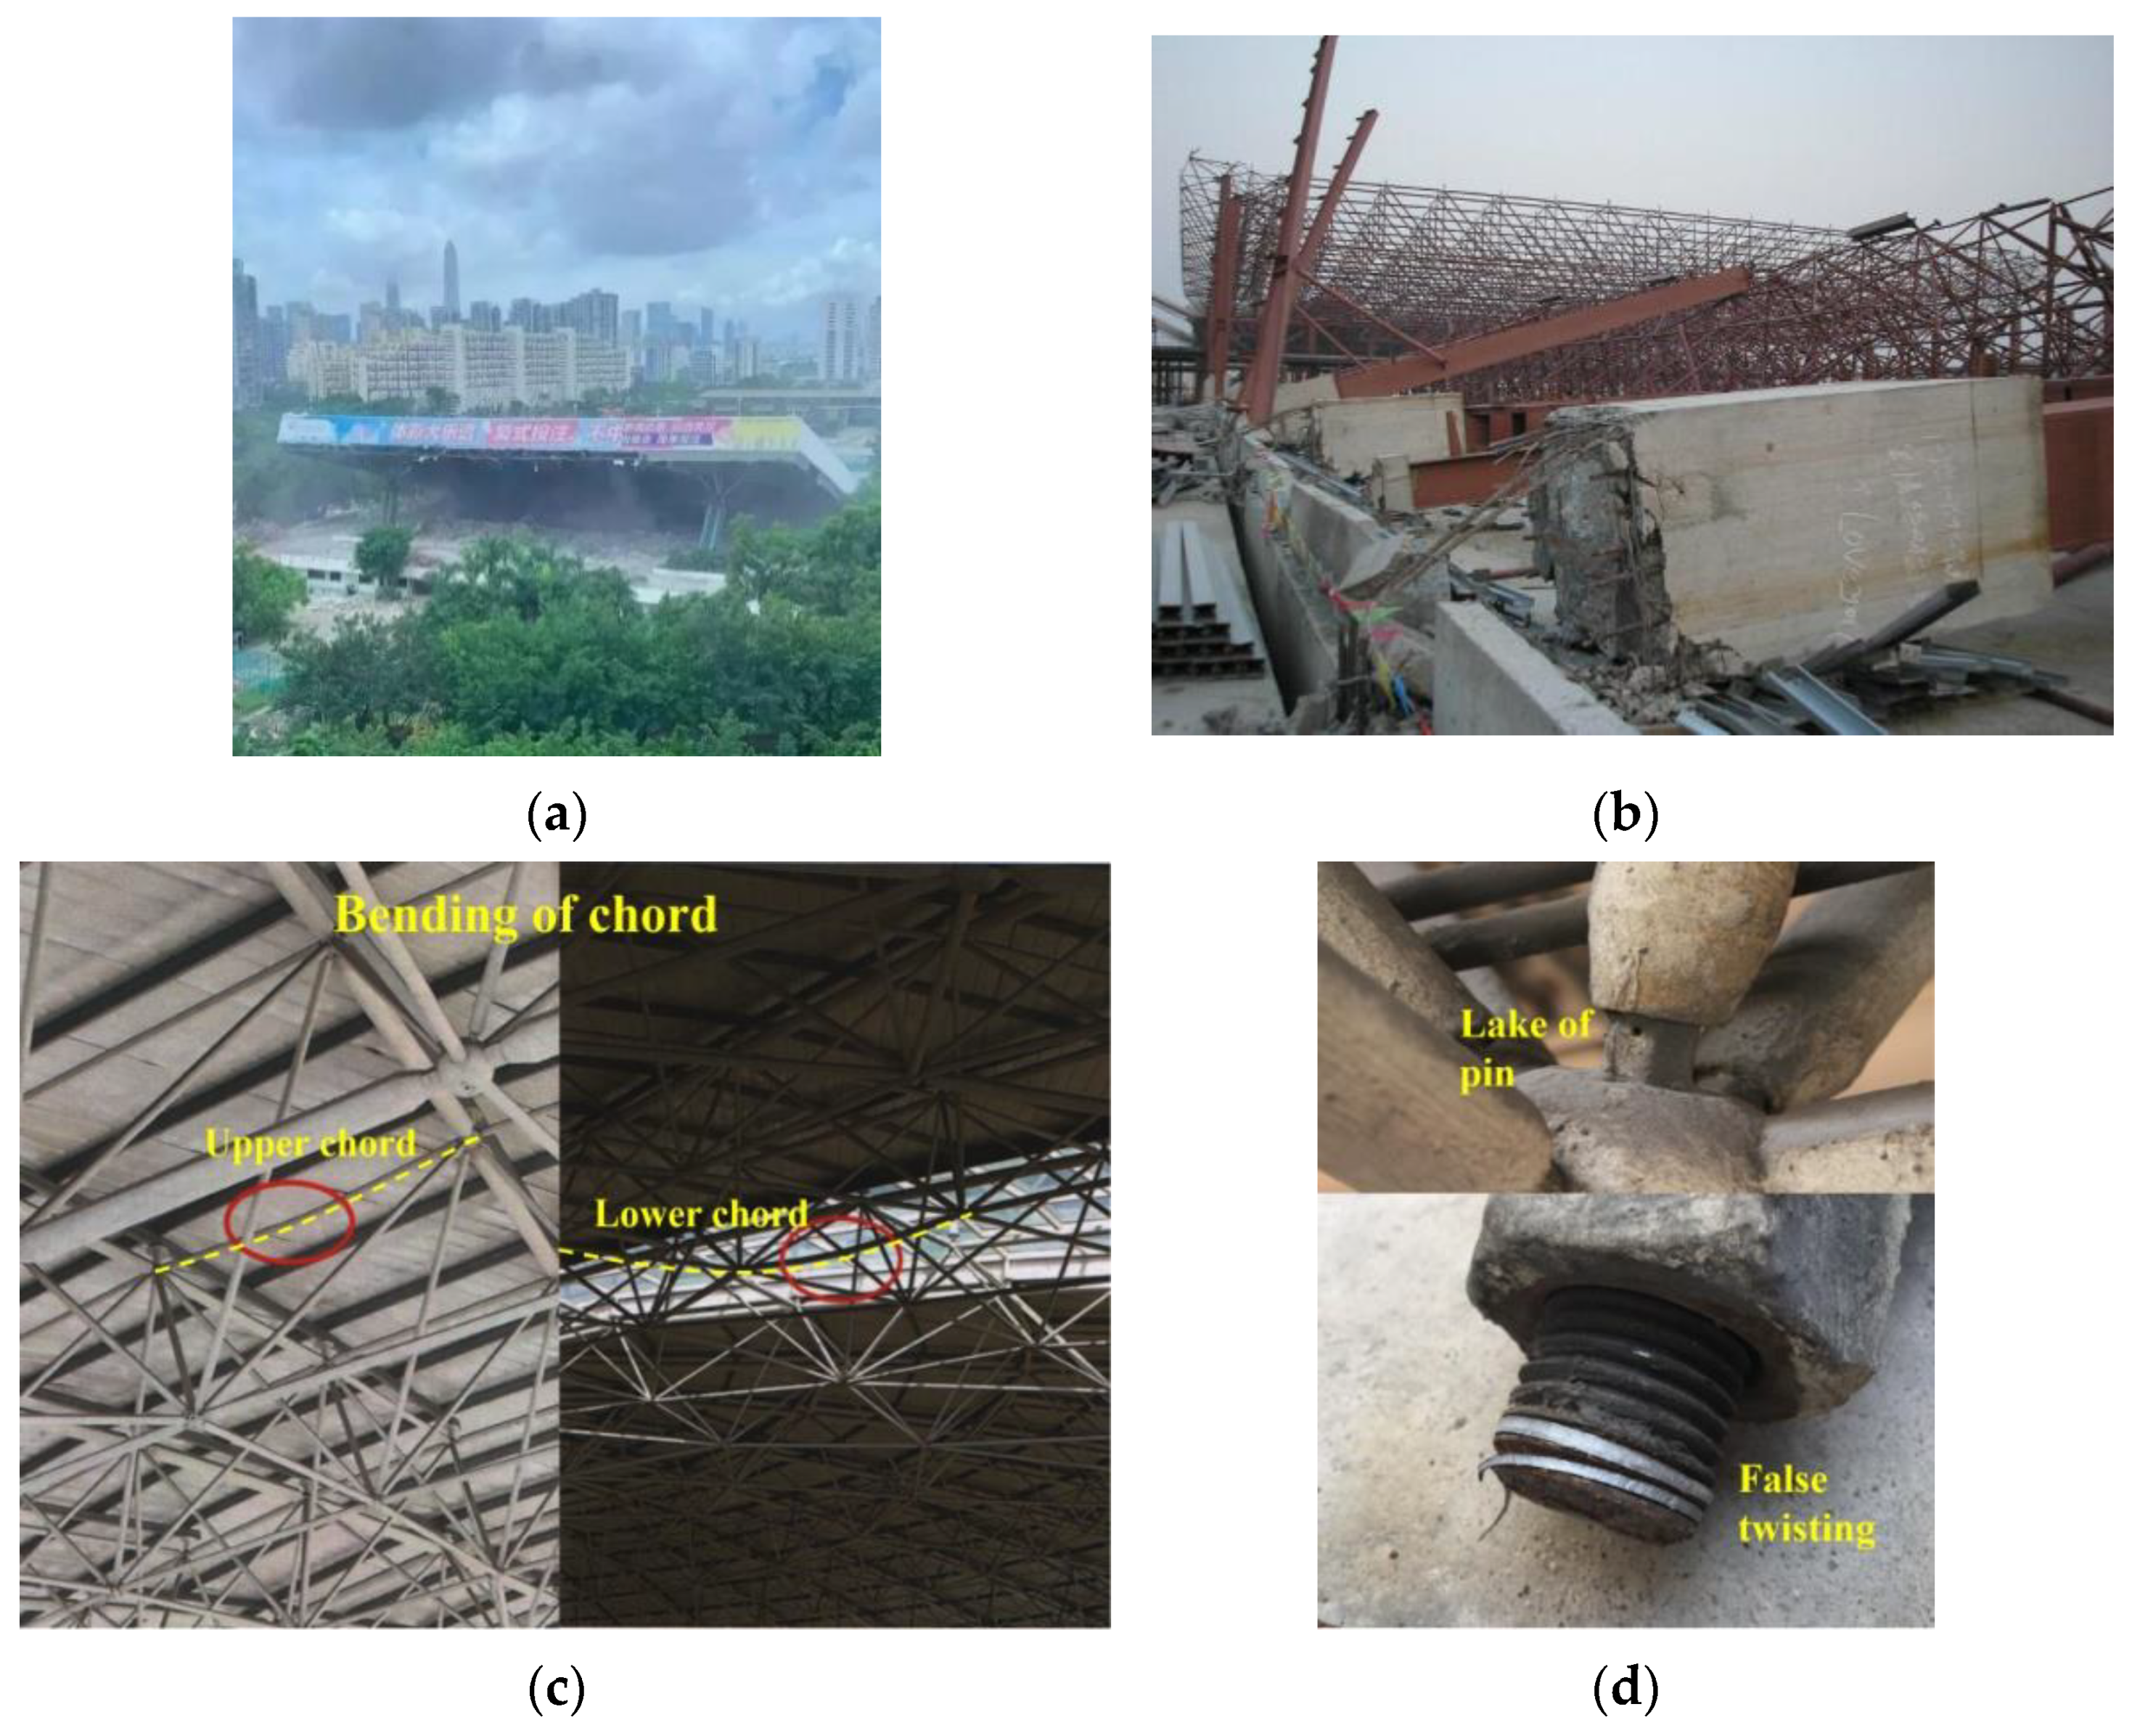
:1. Introduction
2. Experimental Program
2.1. Specimen Design
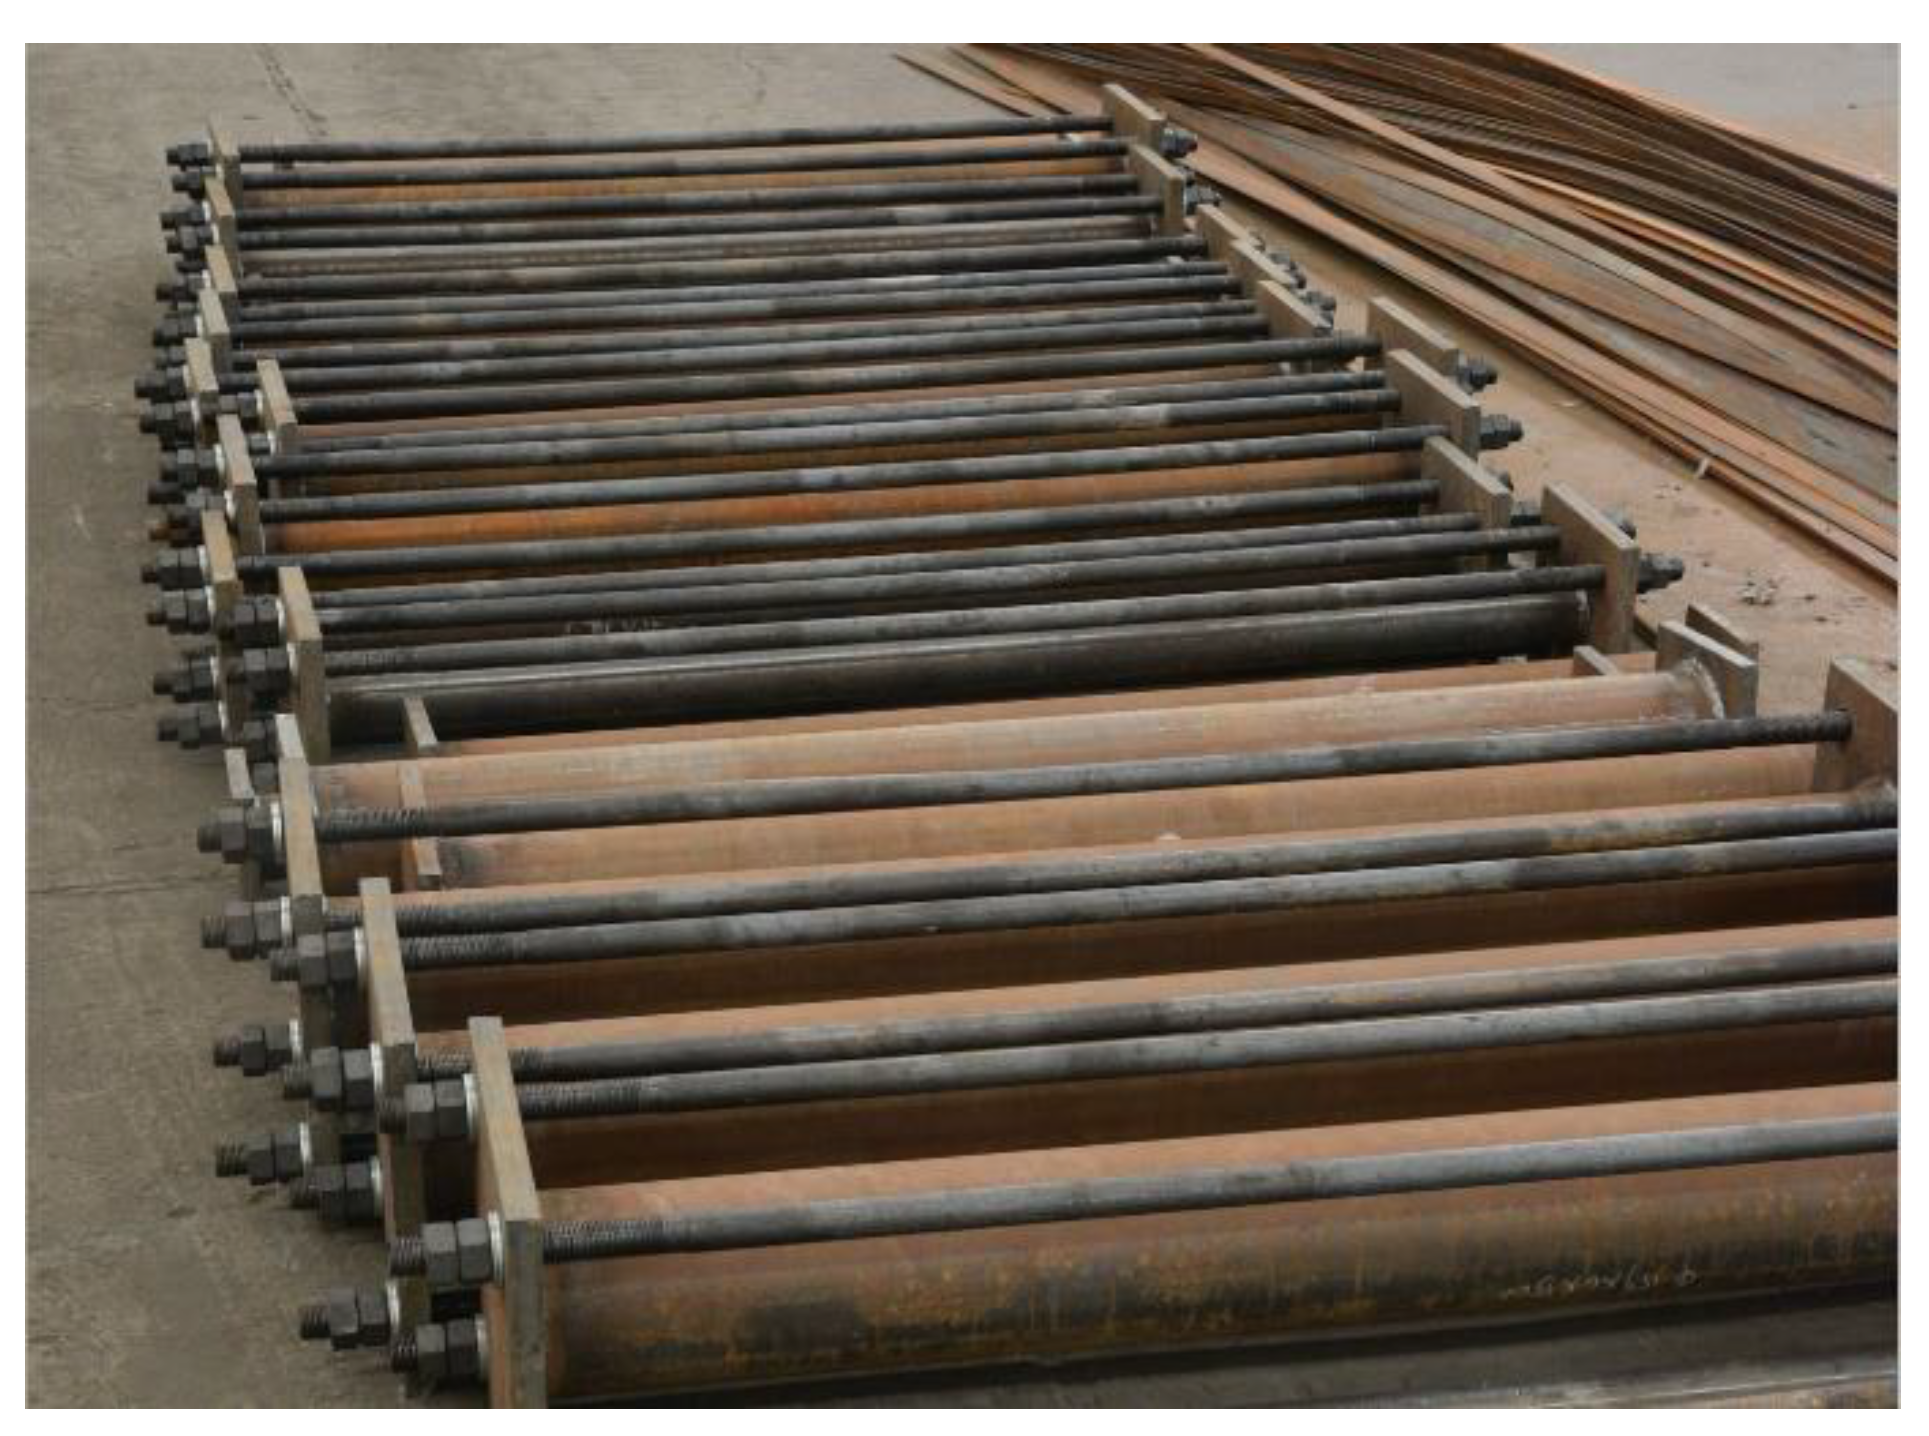
2.2. Specimen Making
2.2.1. Preliminary Processing
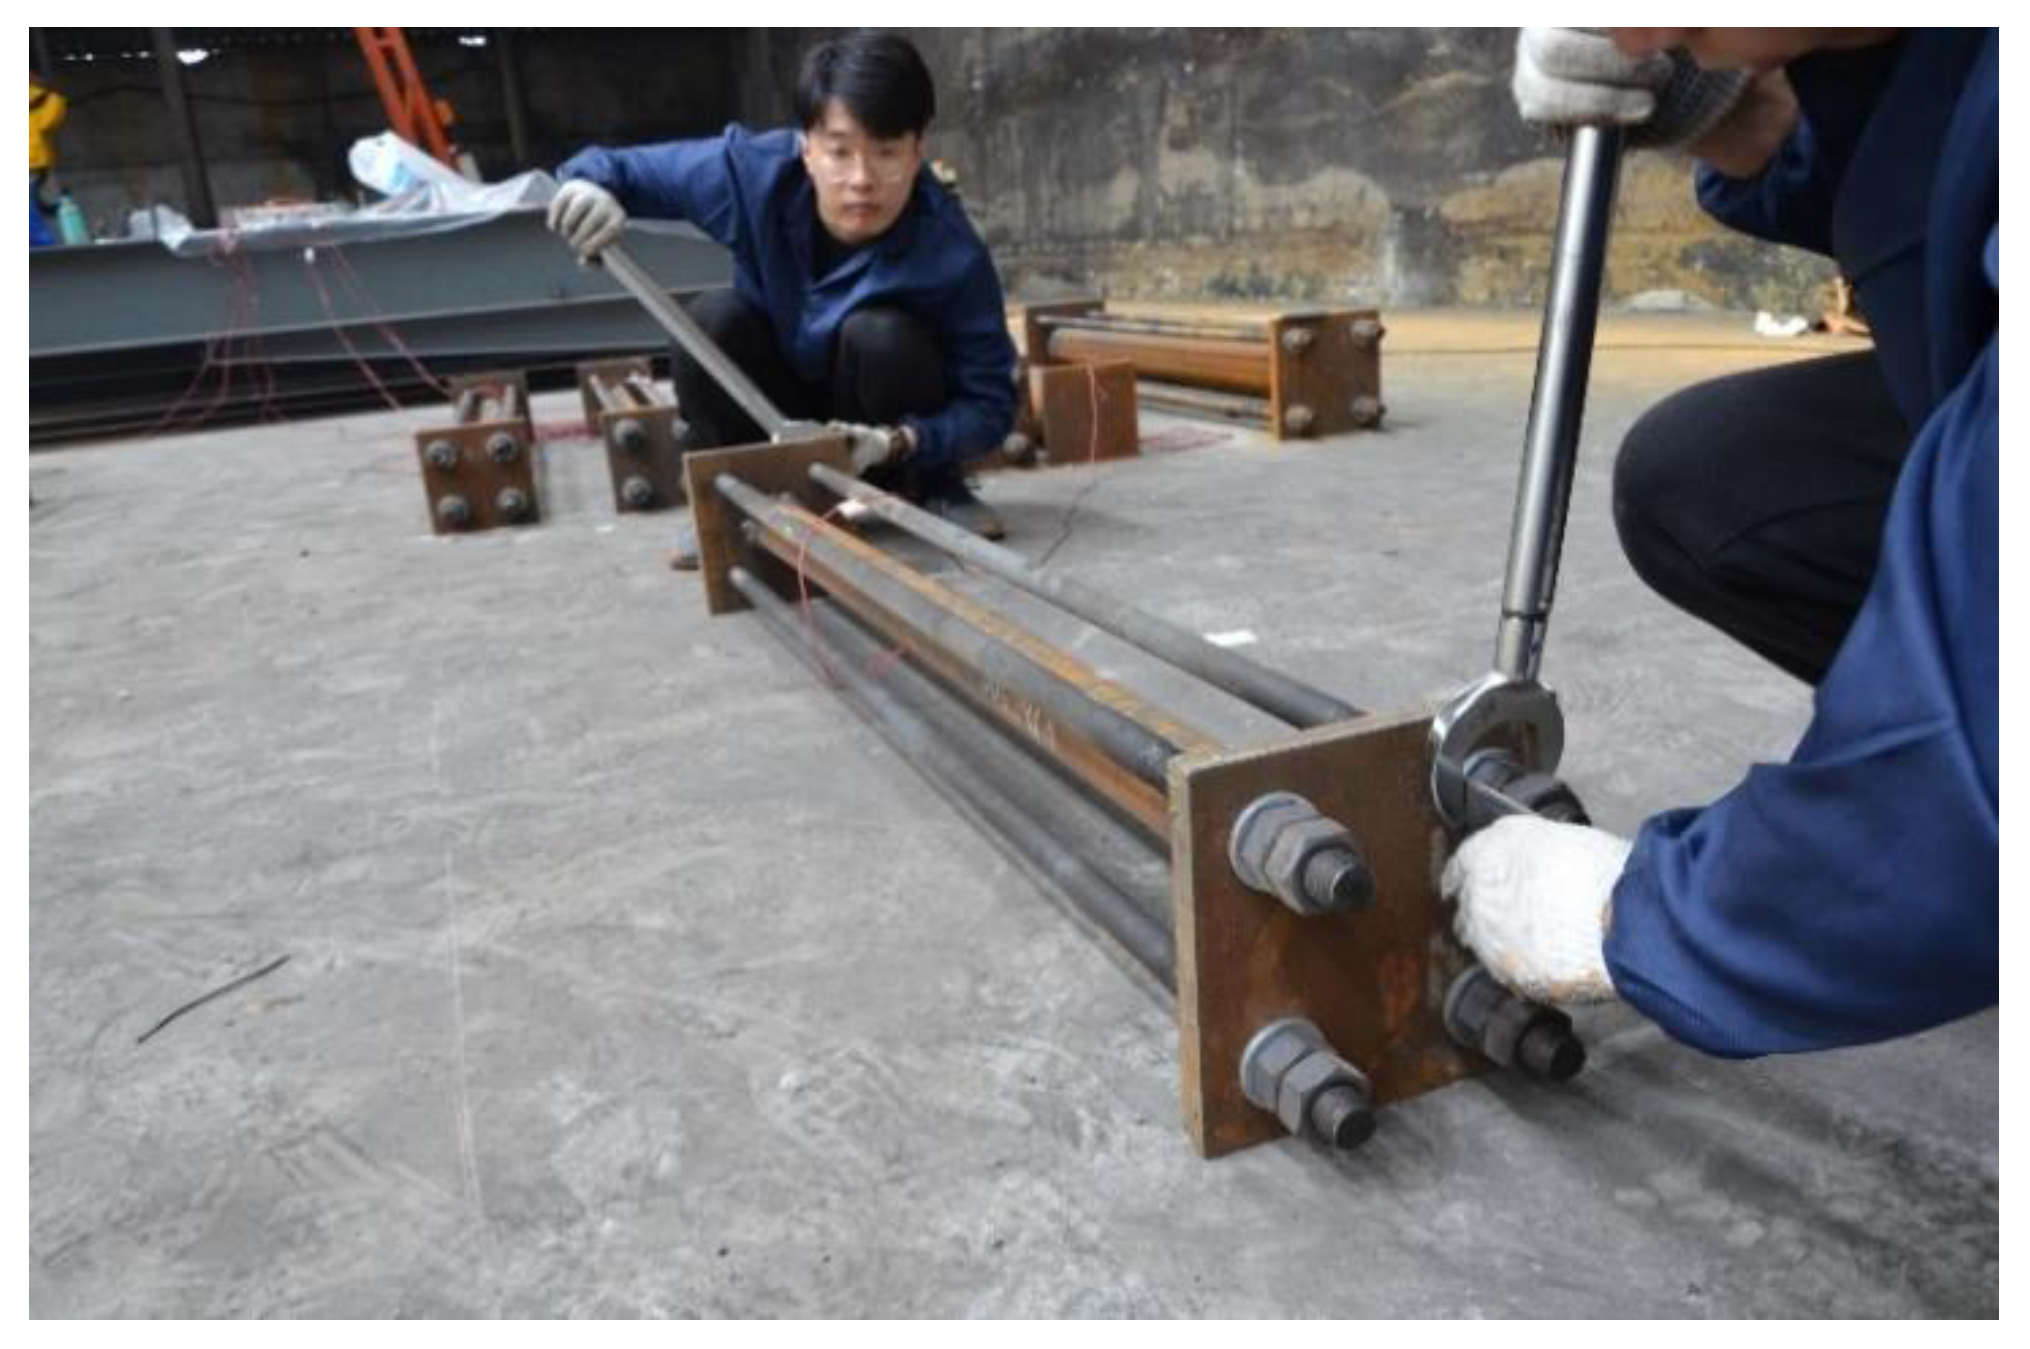
2.2.2. Prestress Applying
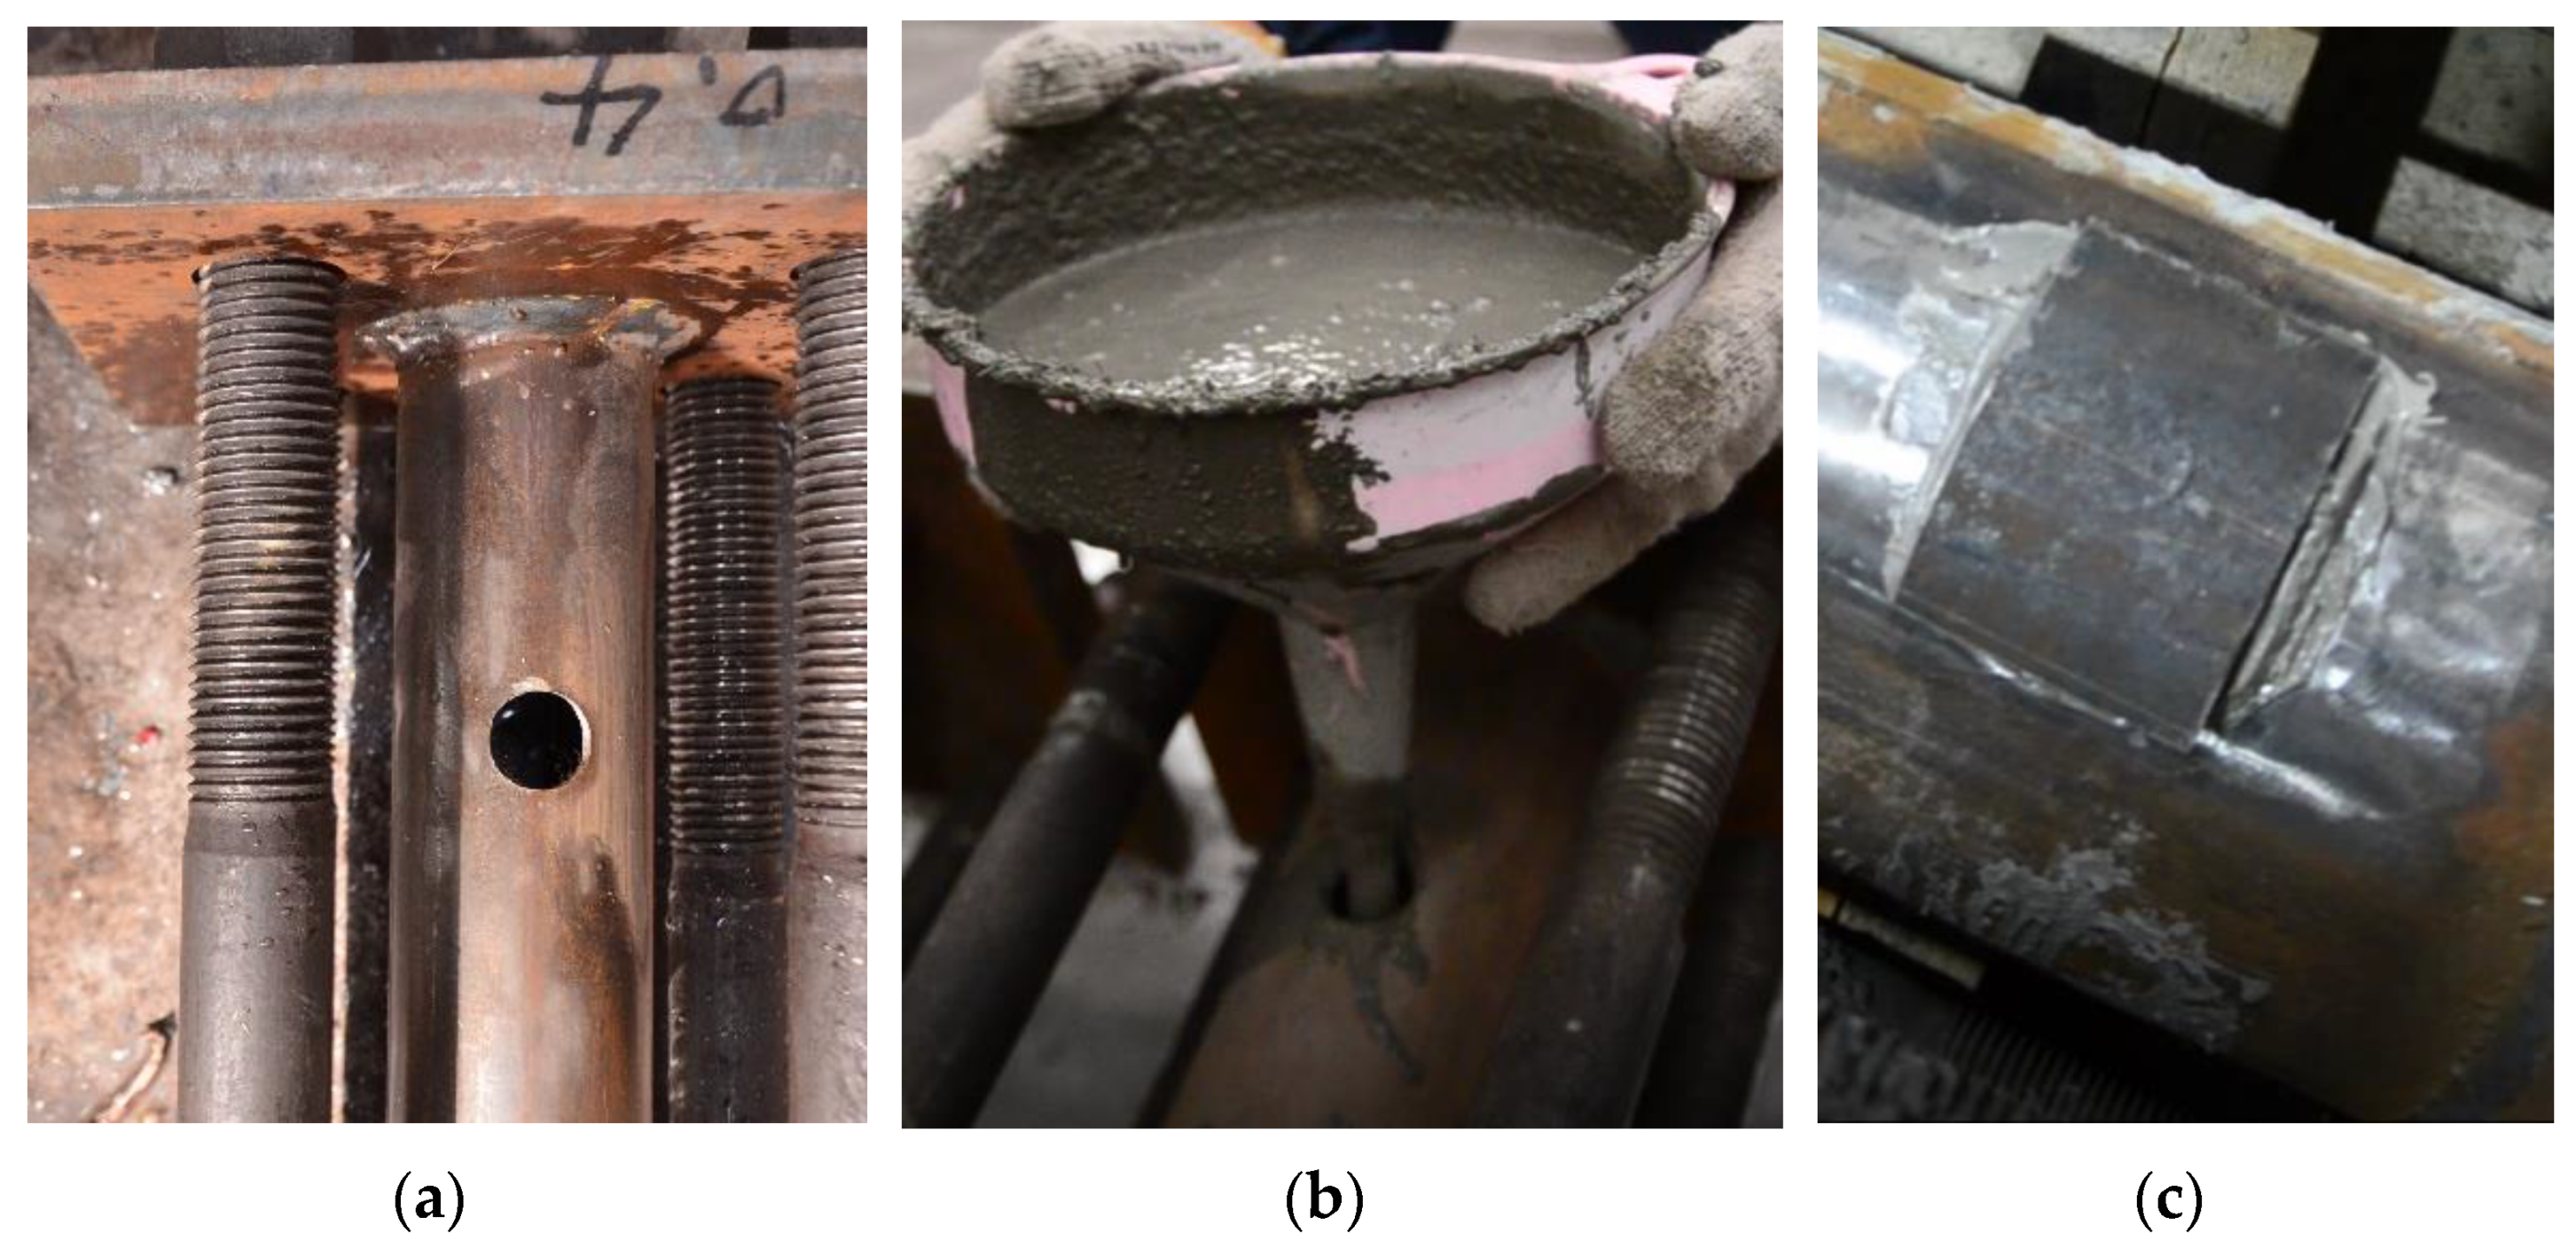
2.2.3. RPC Grouting
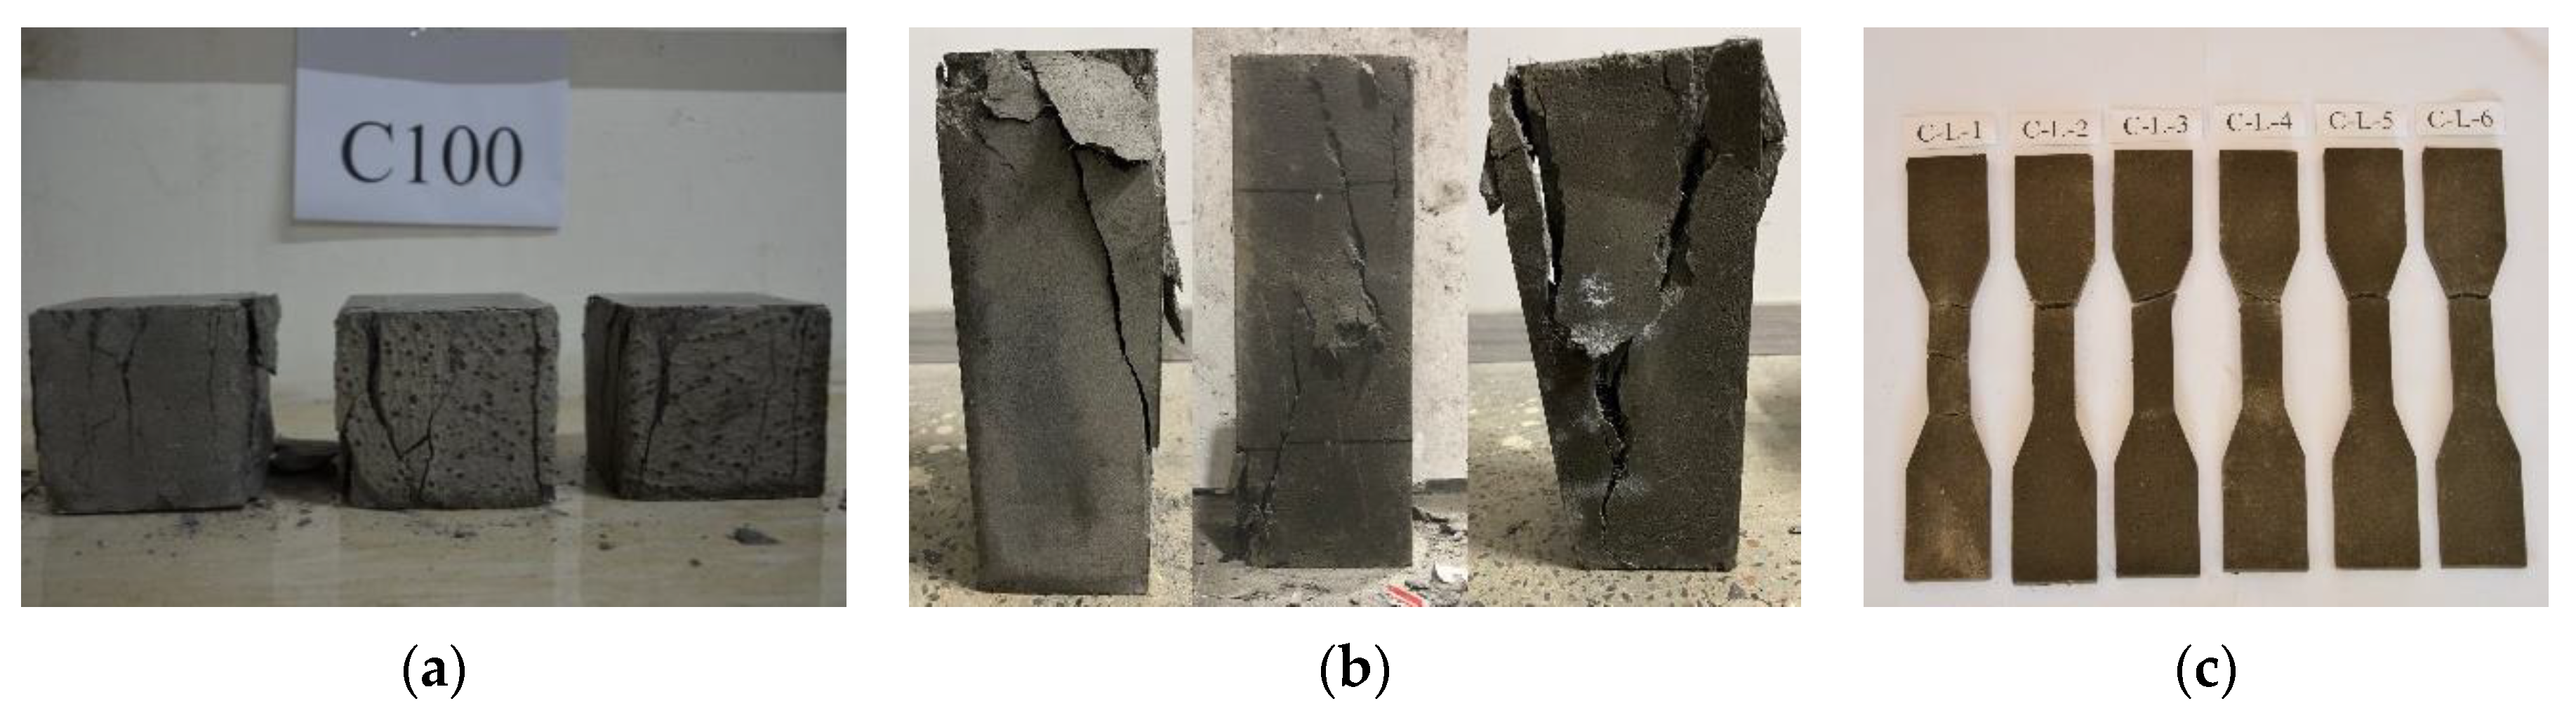
2.3. Material Properties
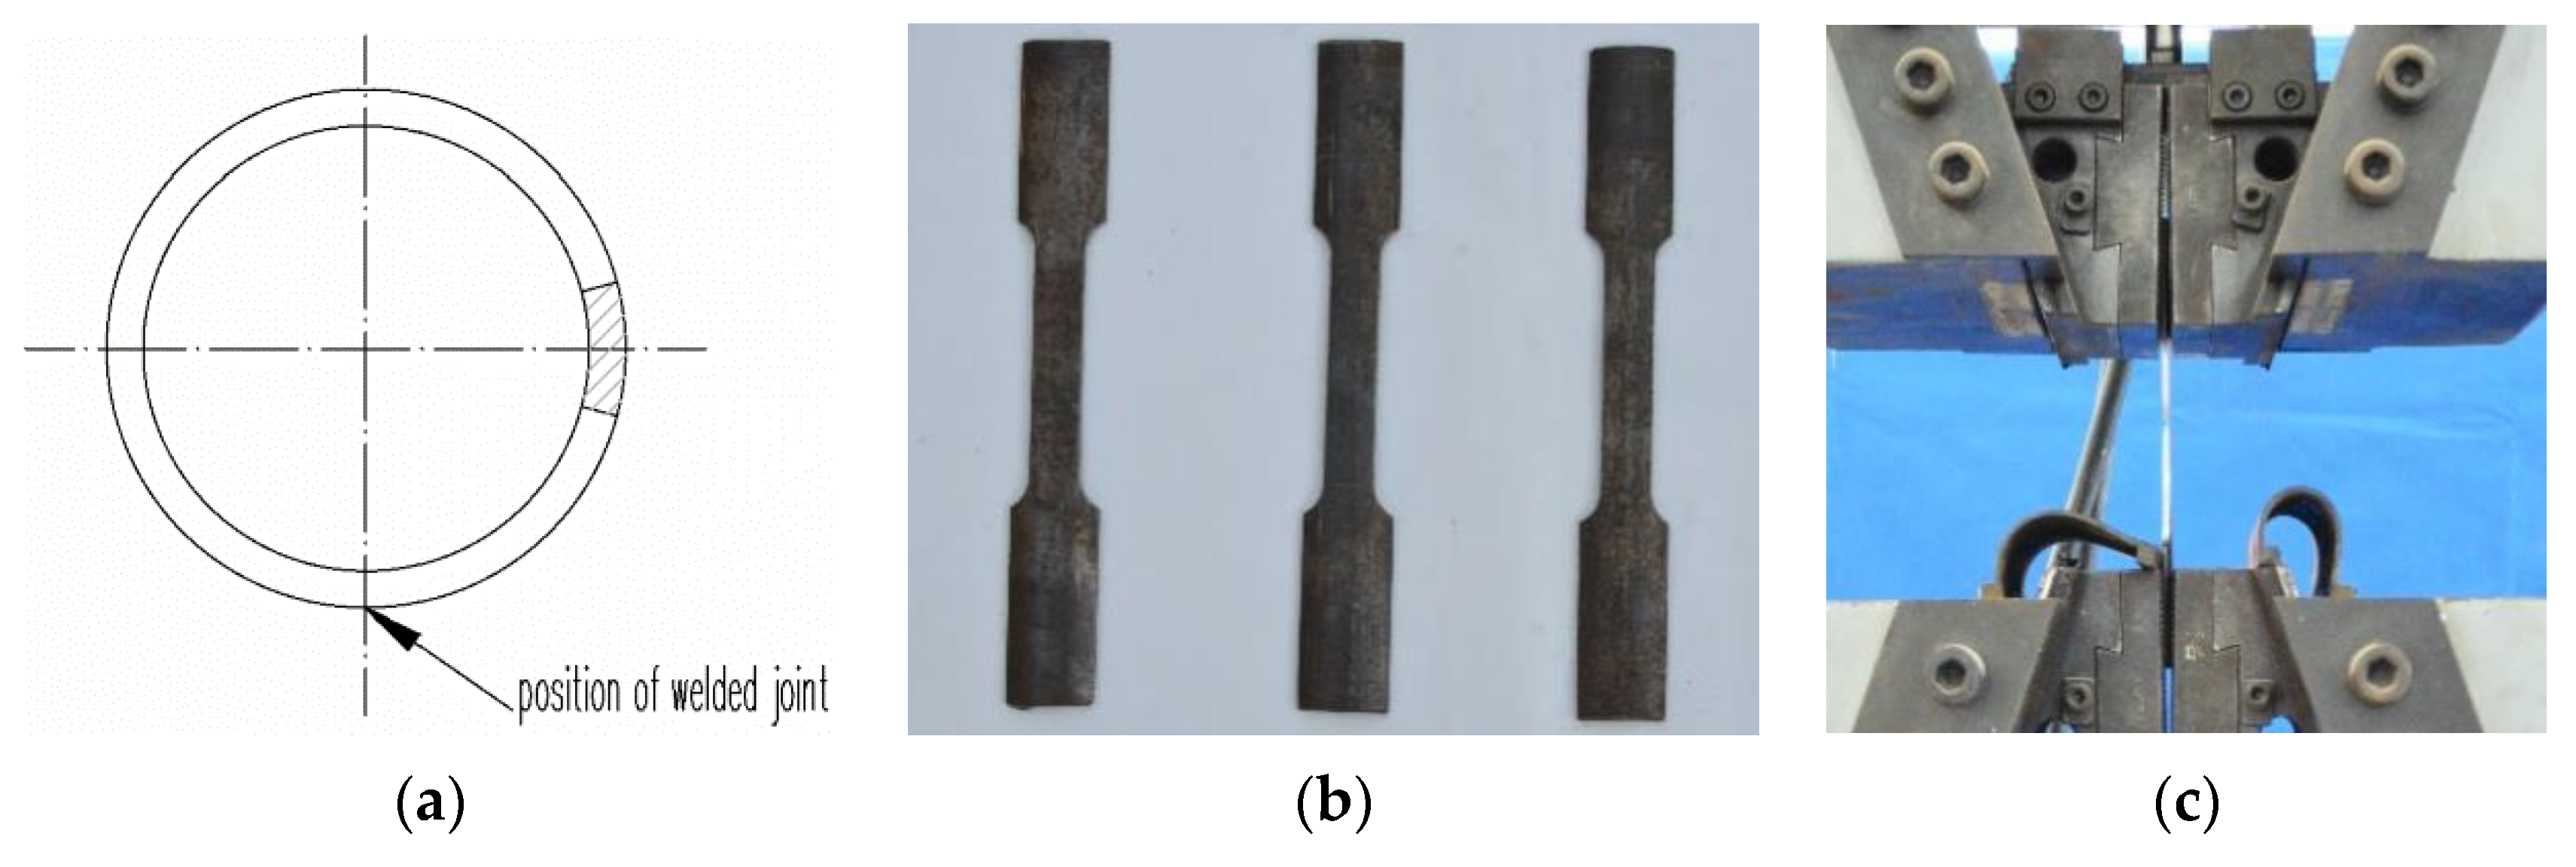
2.3.1. Steel
2.3.2. RPC
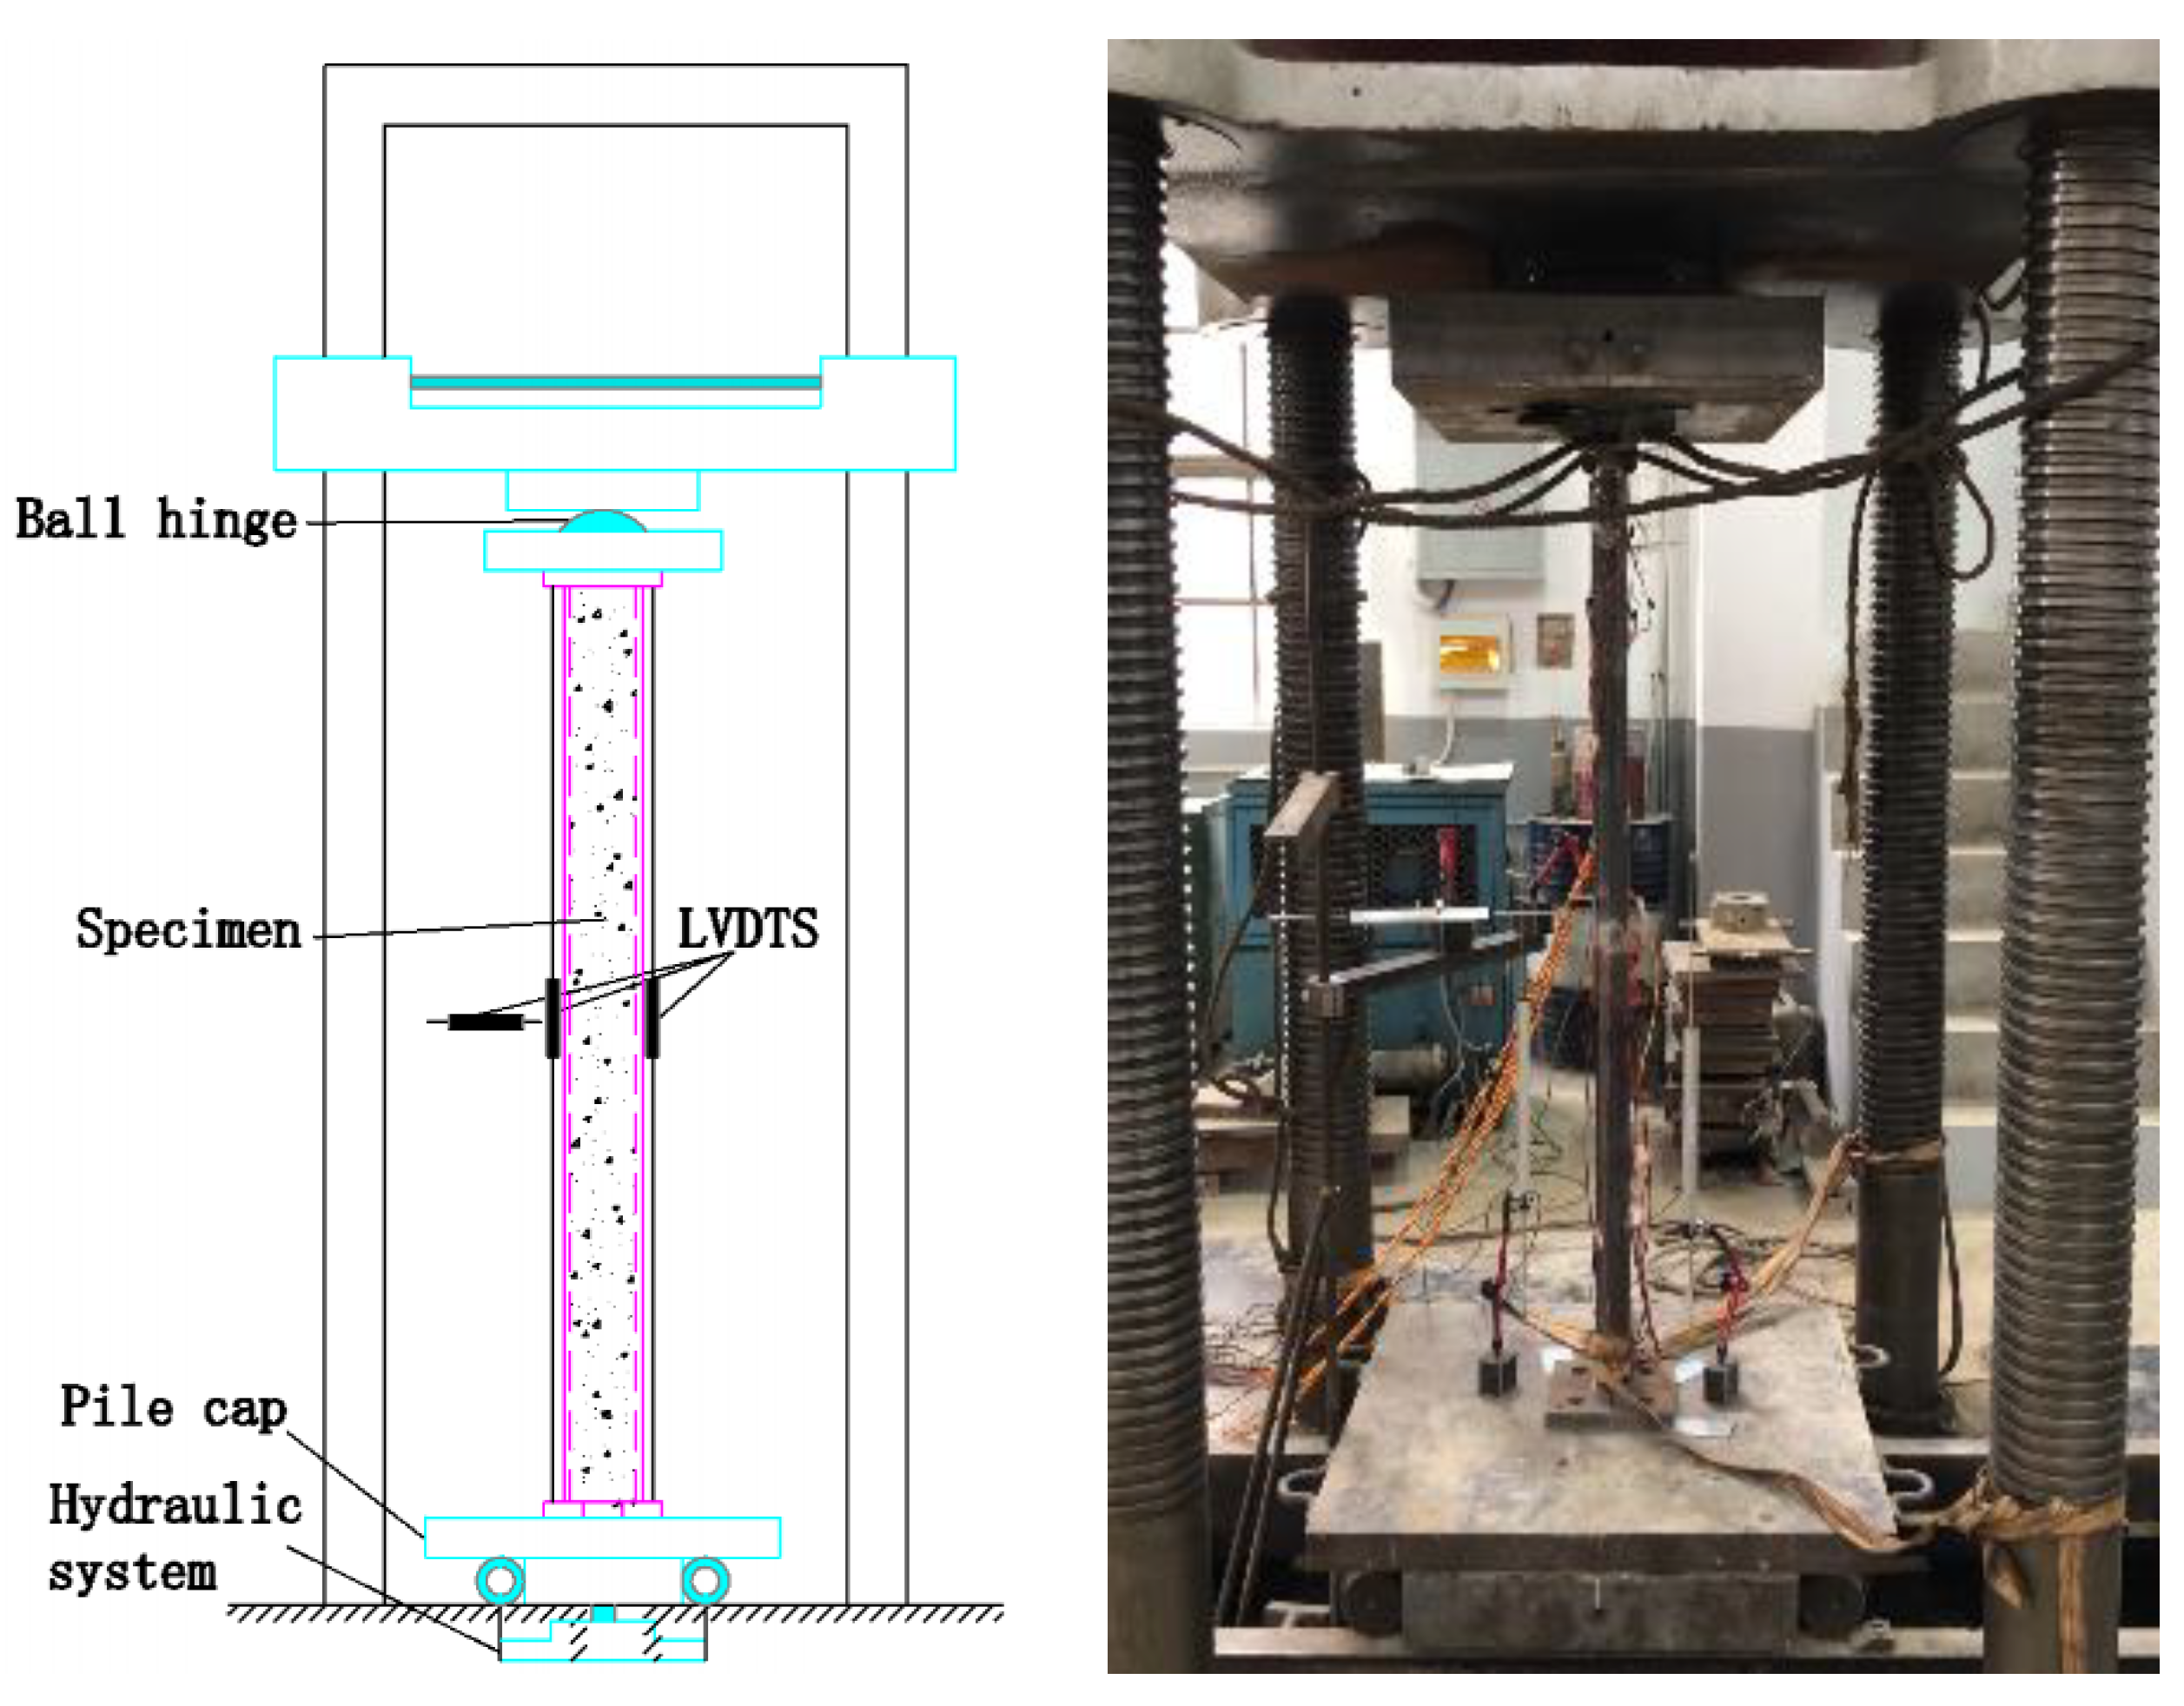
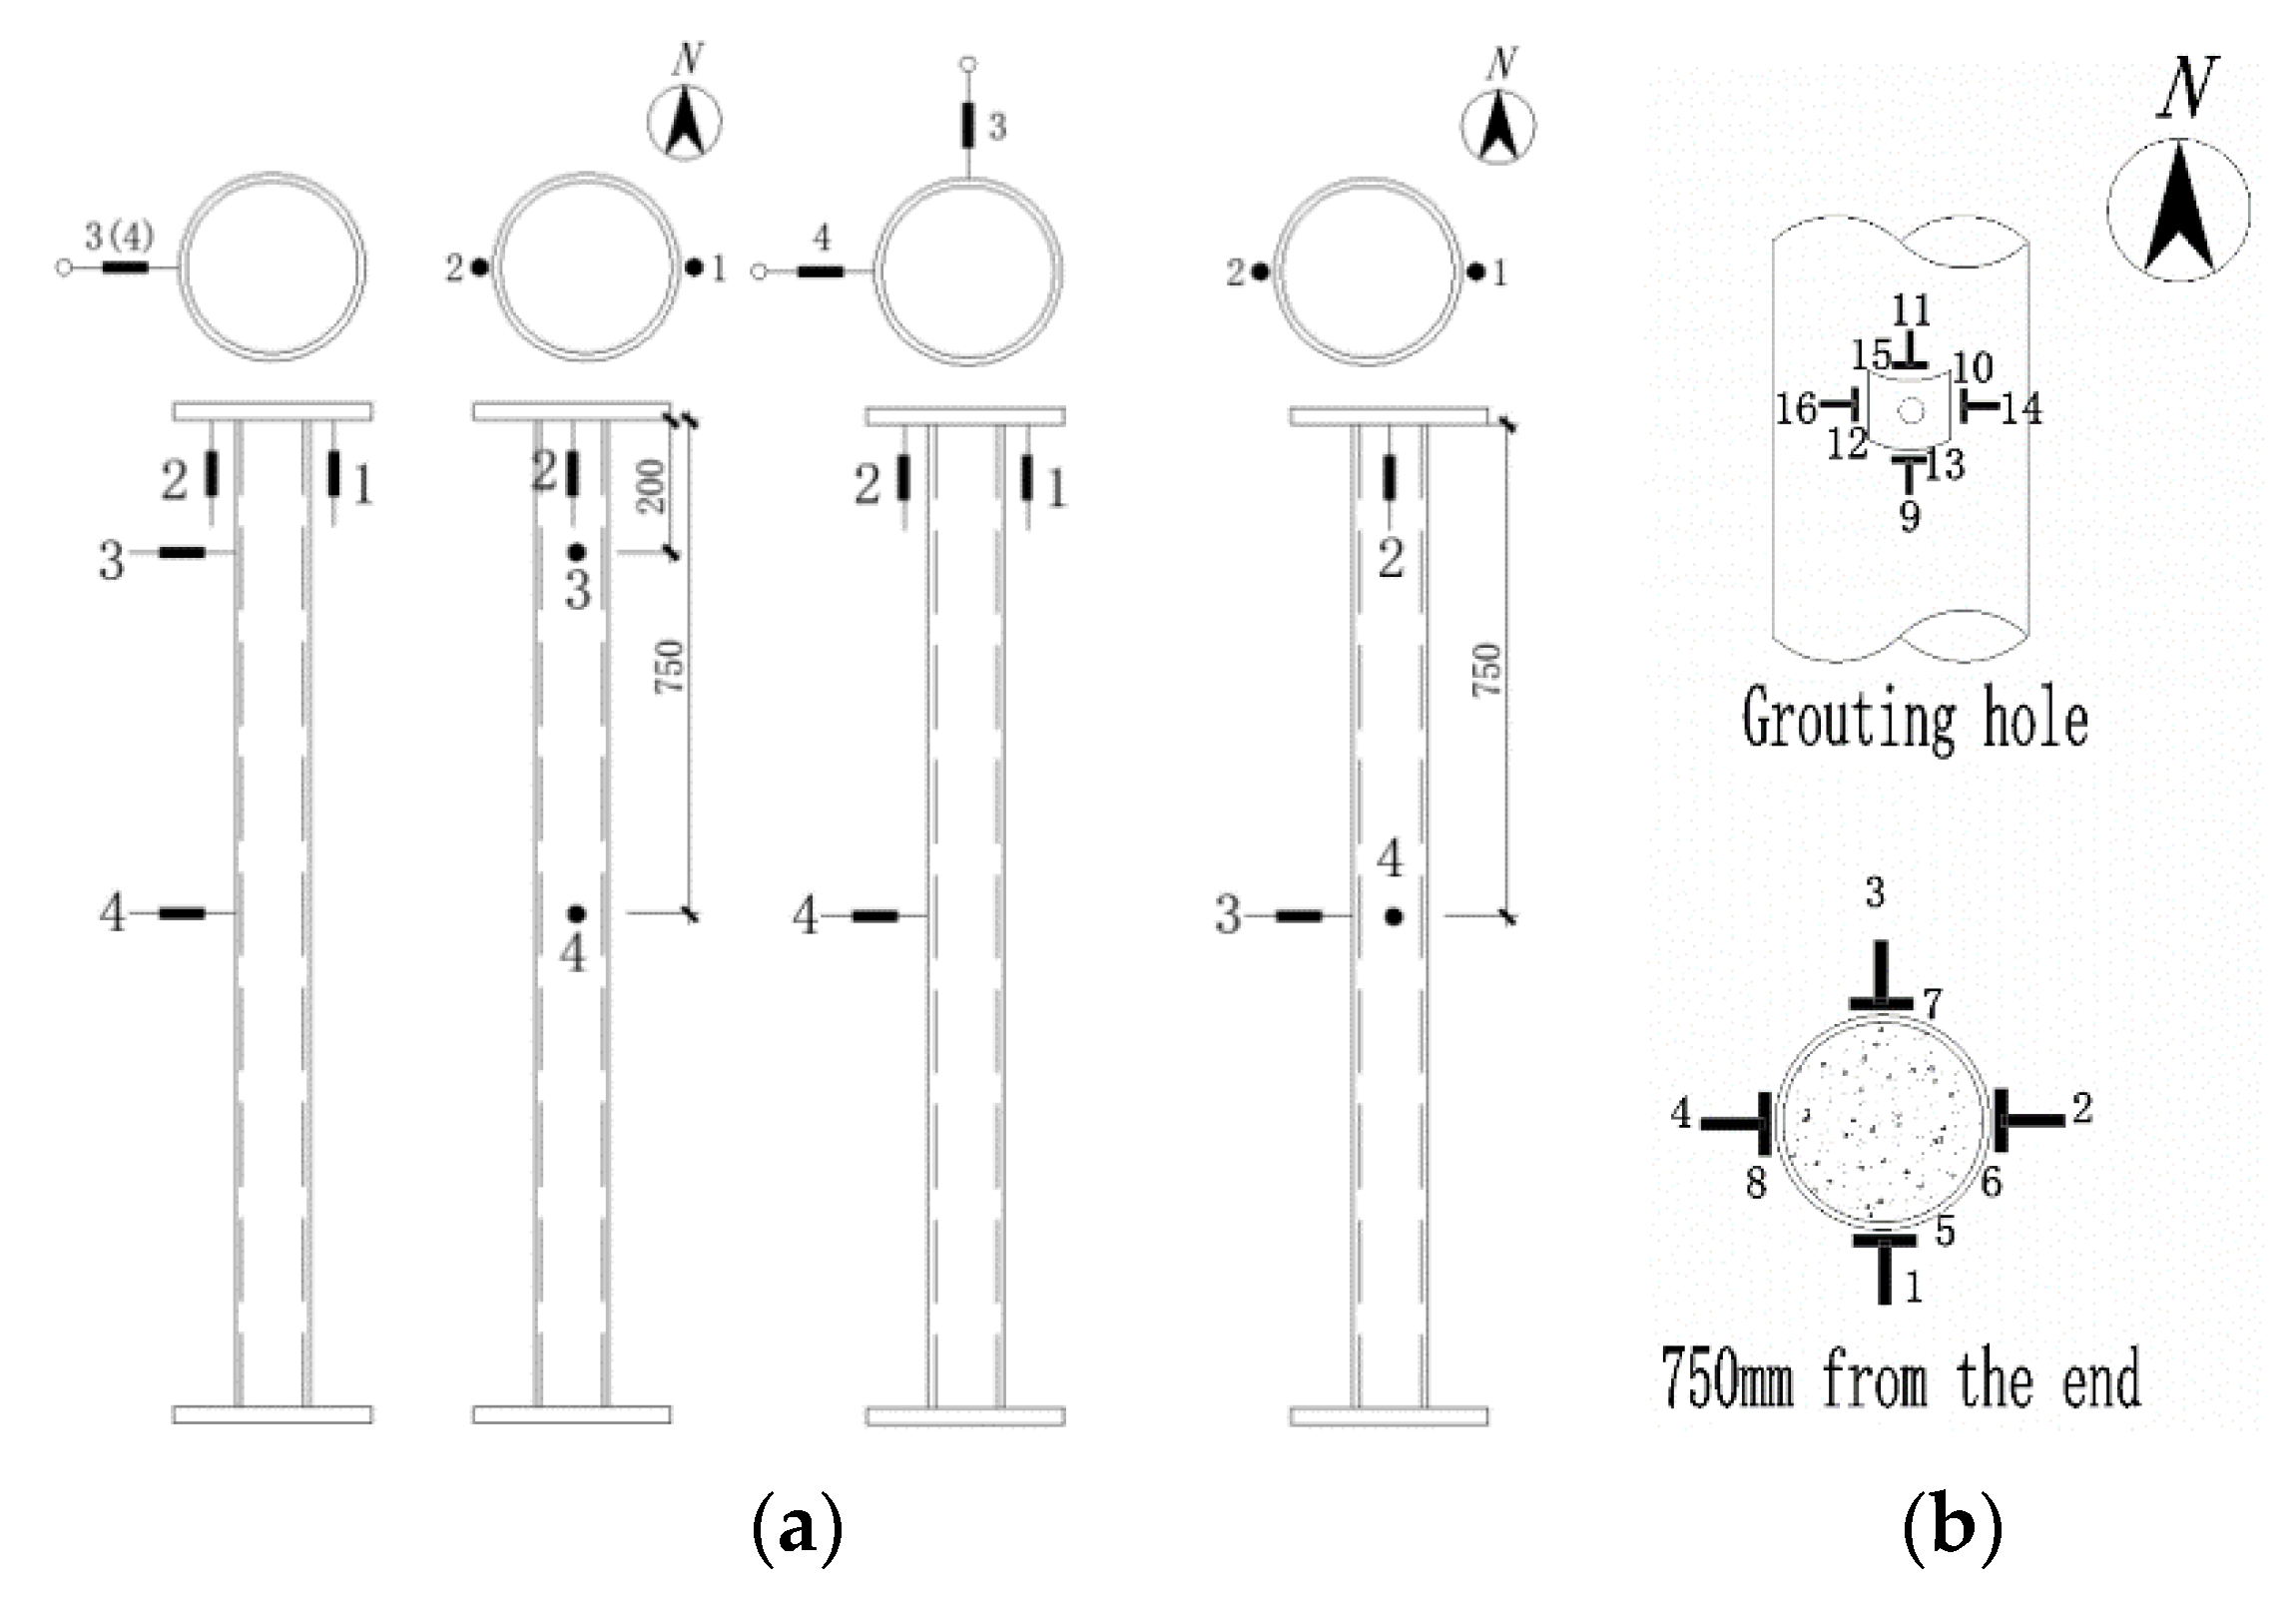
2.4. Test Setup and Instrumentation
2.5. Loading System
3. Experimental Results
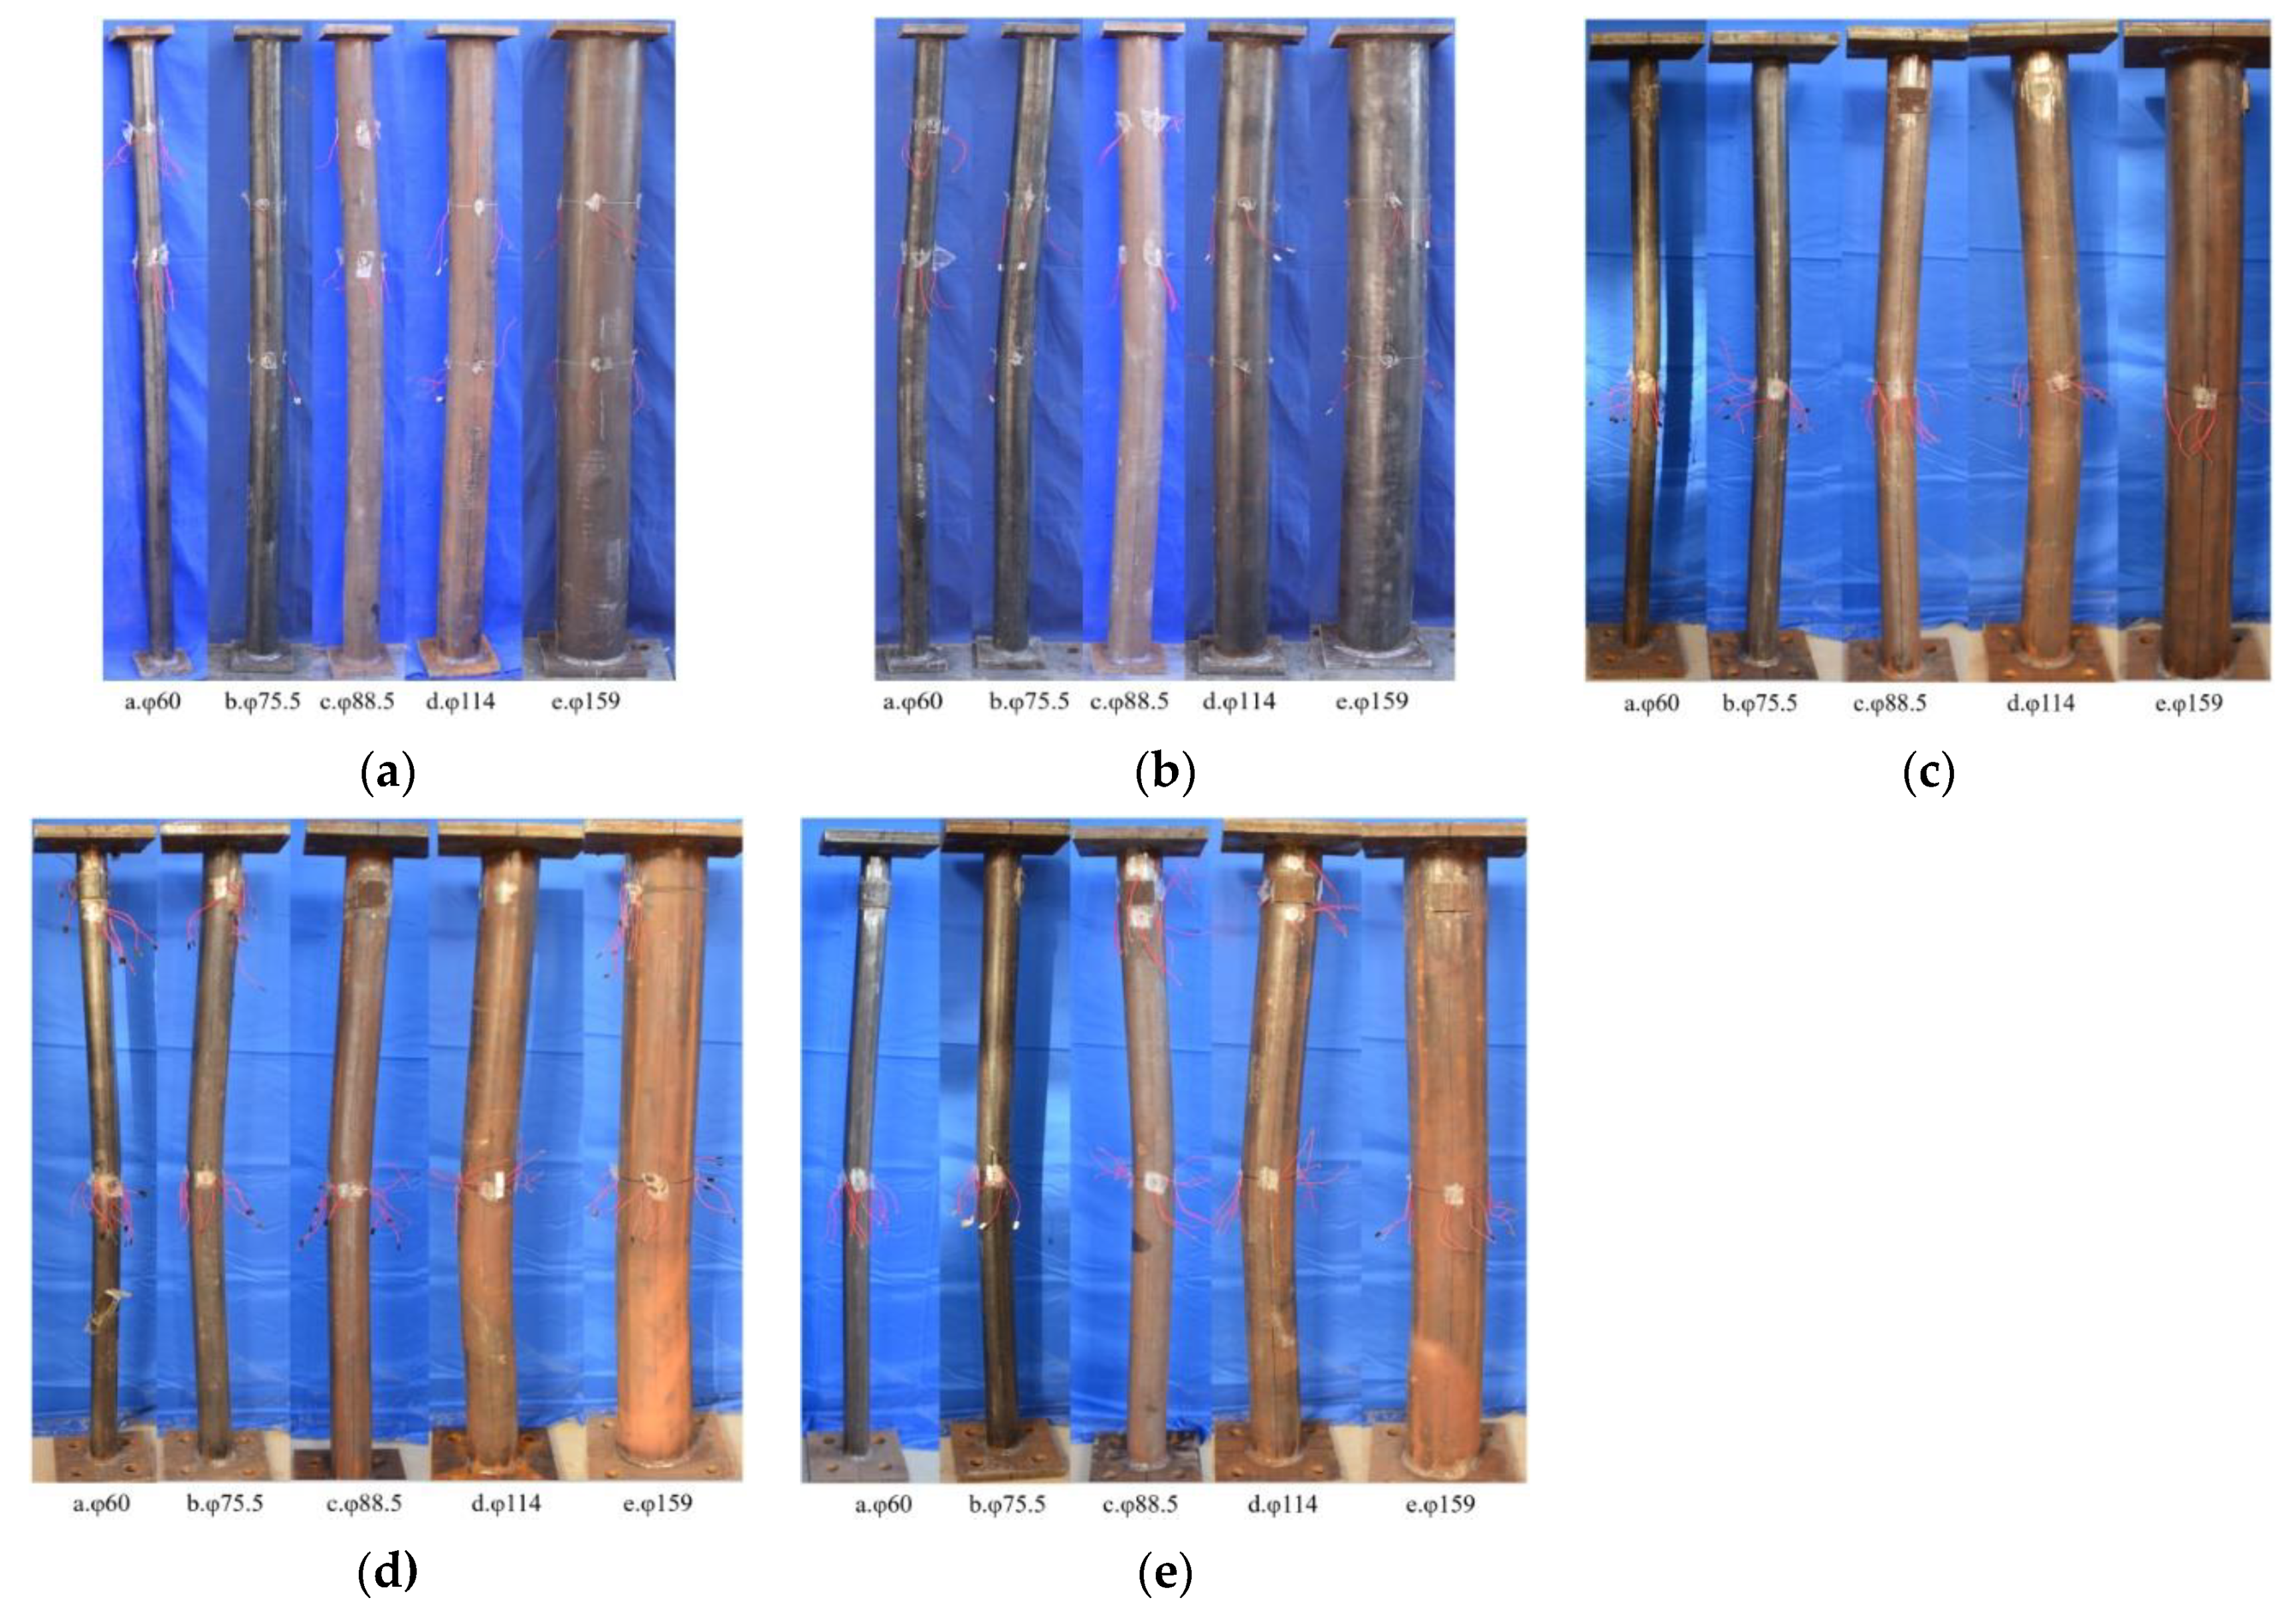
3.1. Failure Mode
3.2. Load Capacities
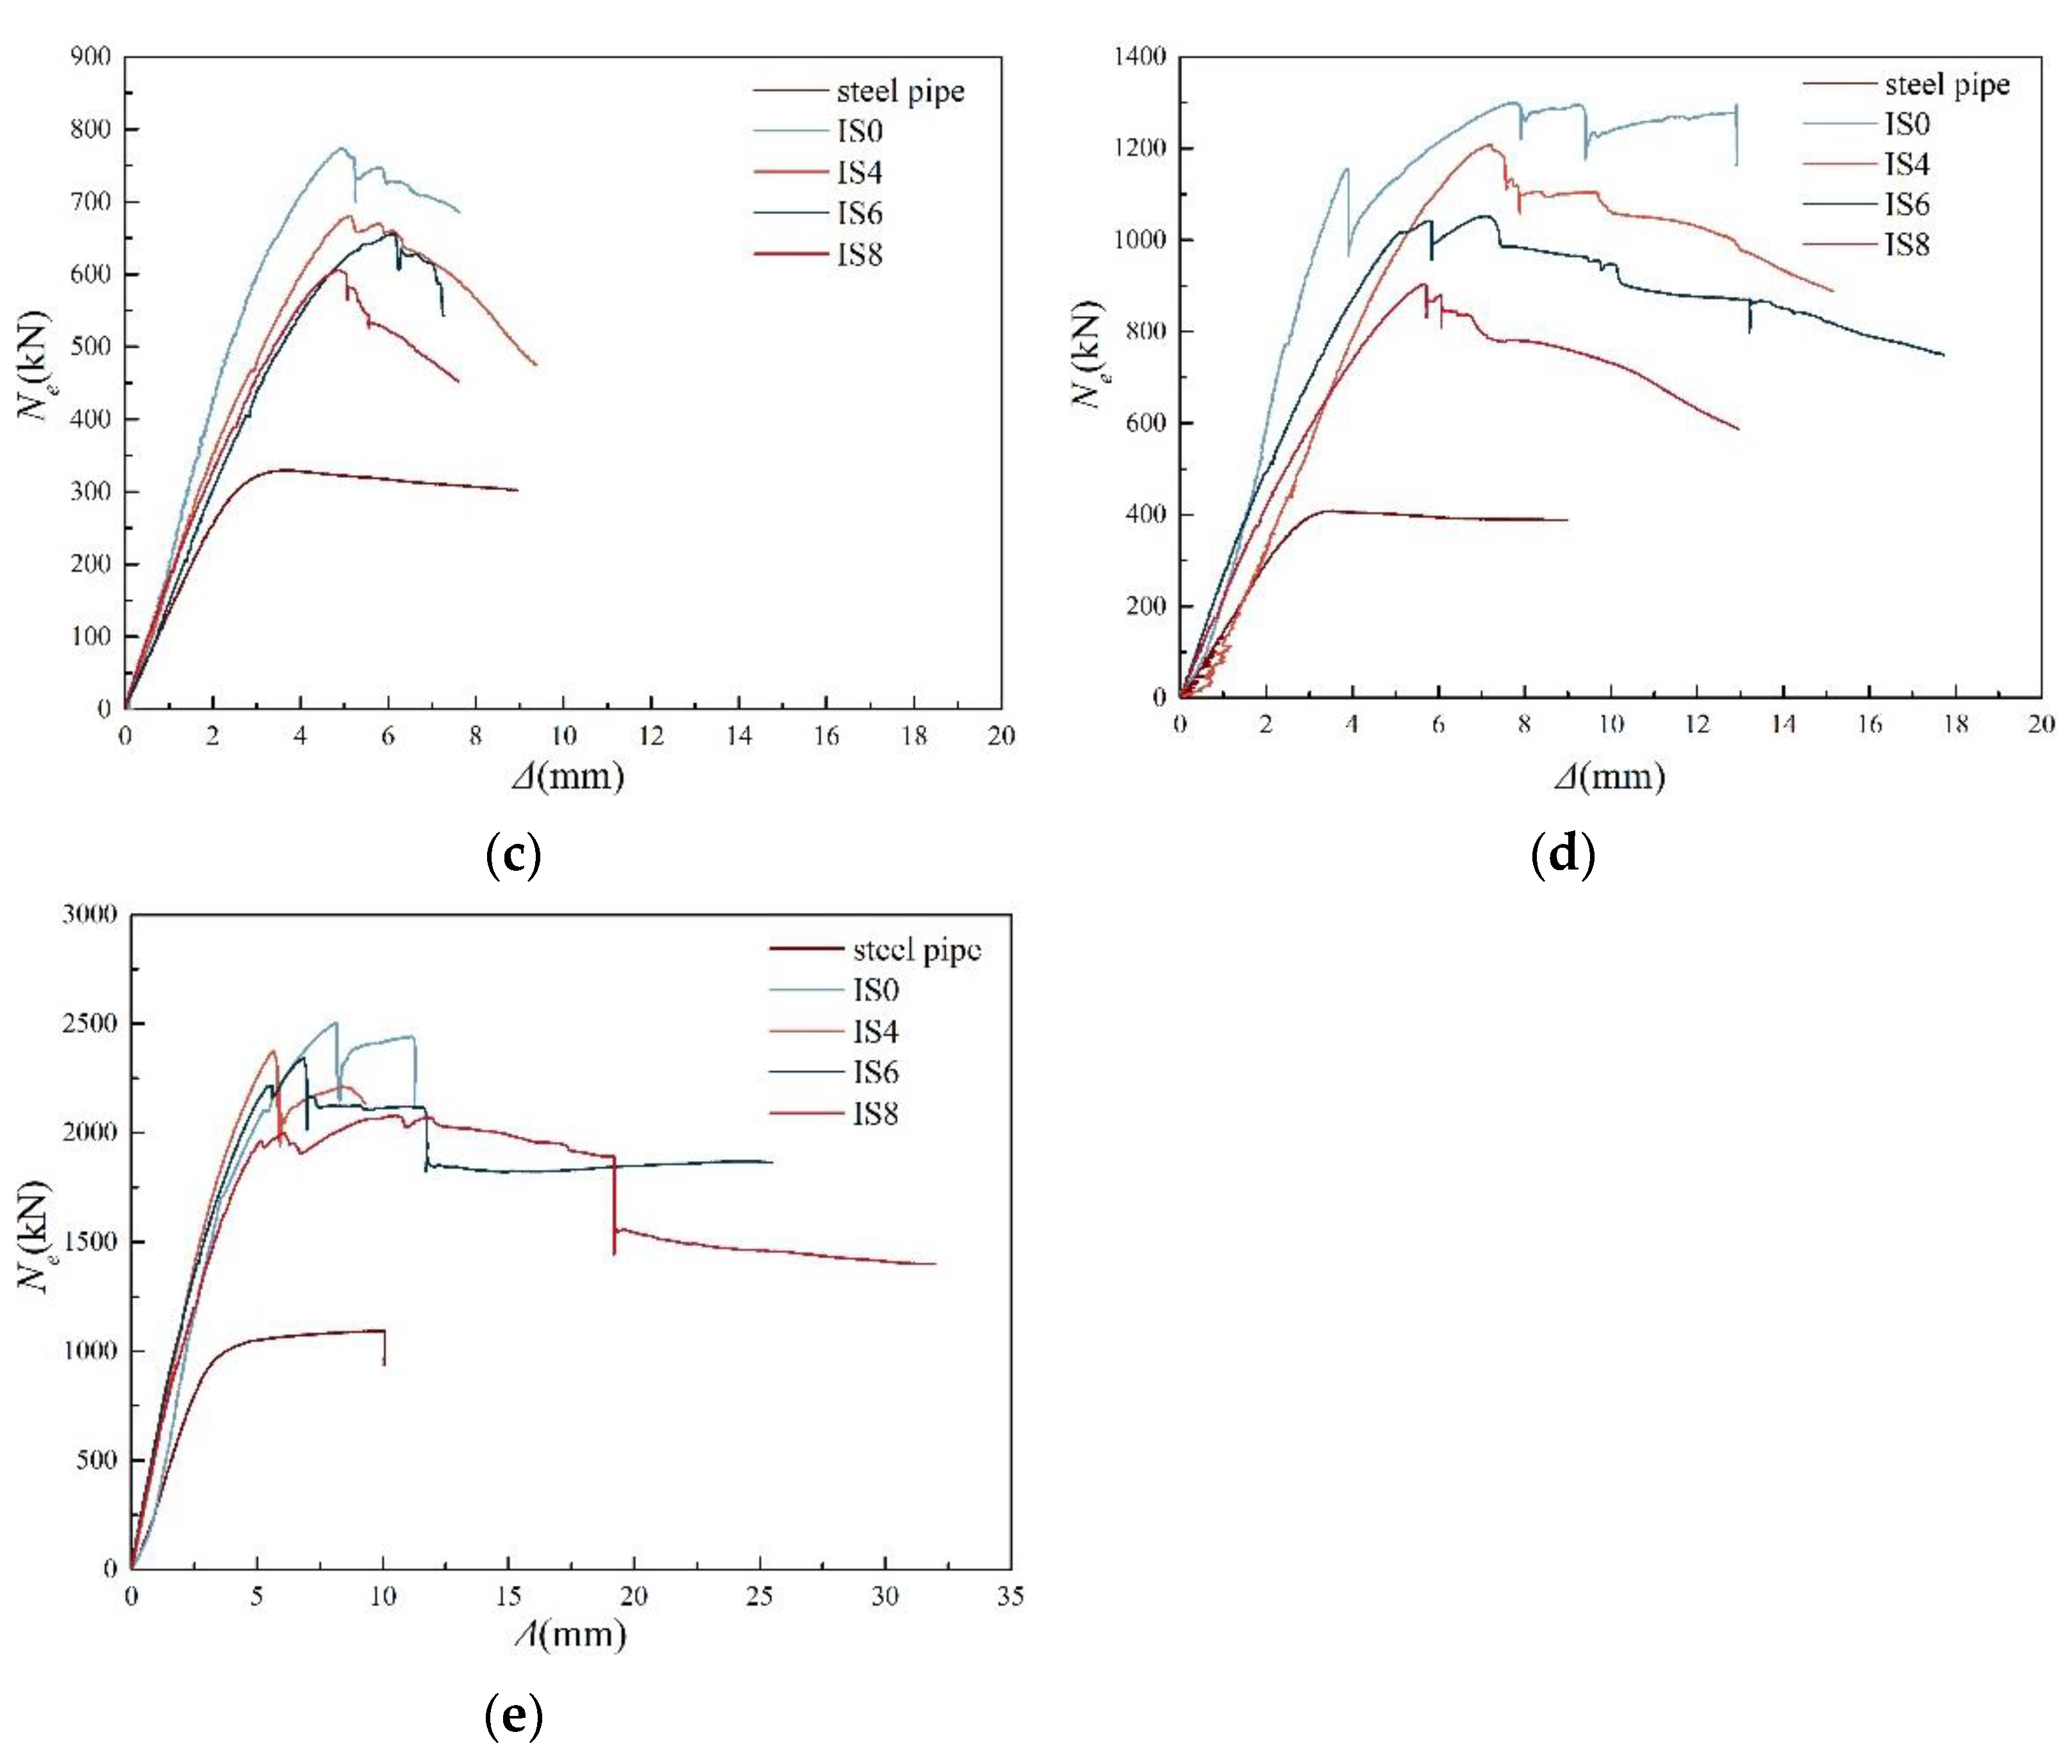
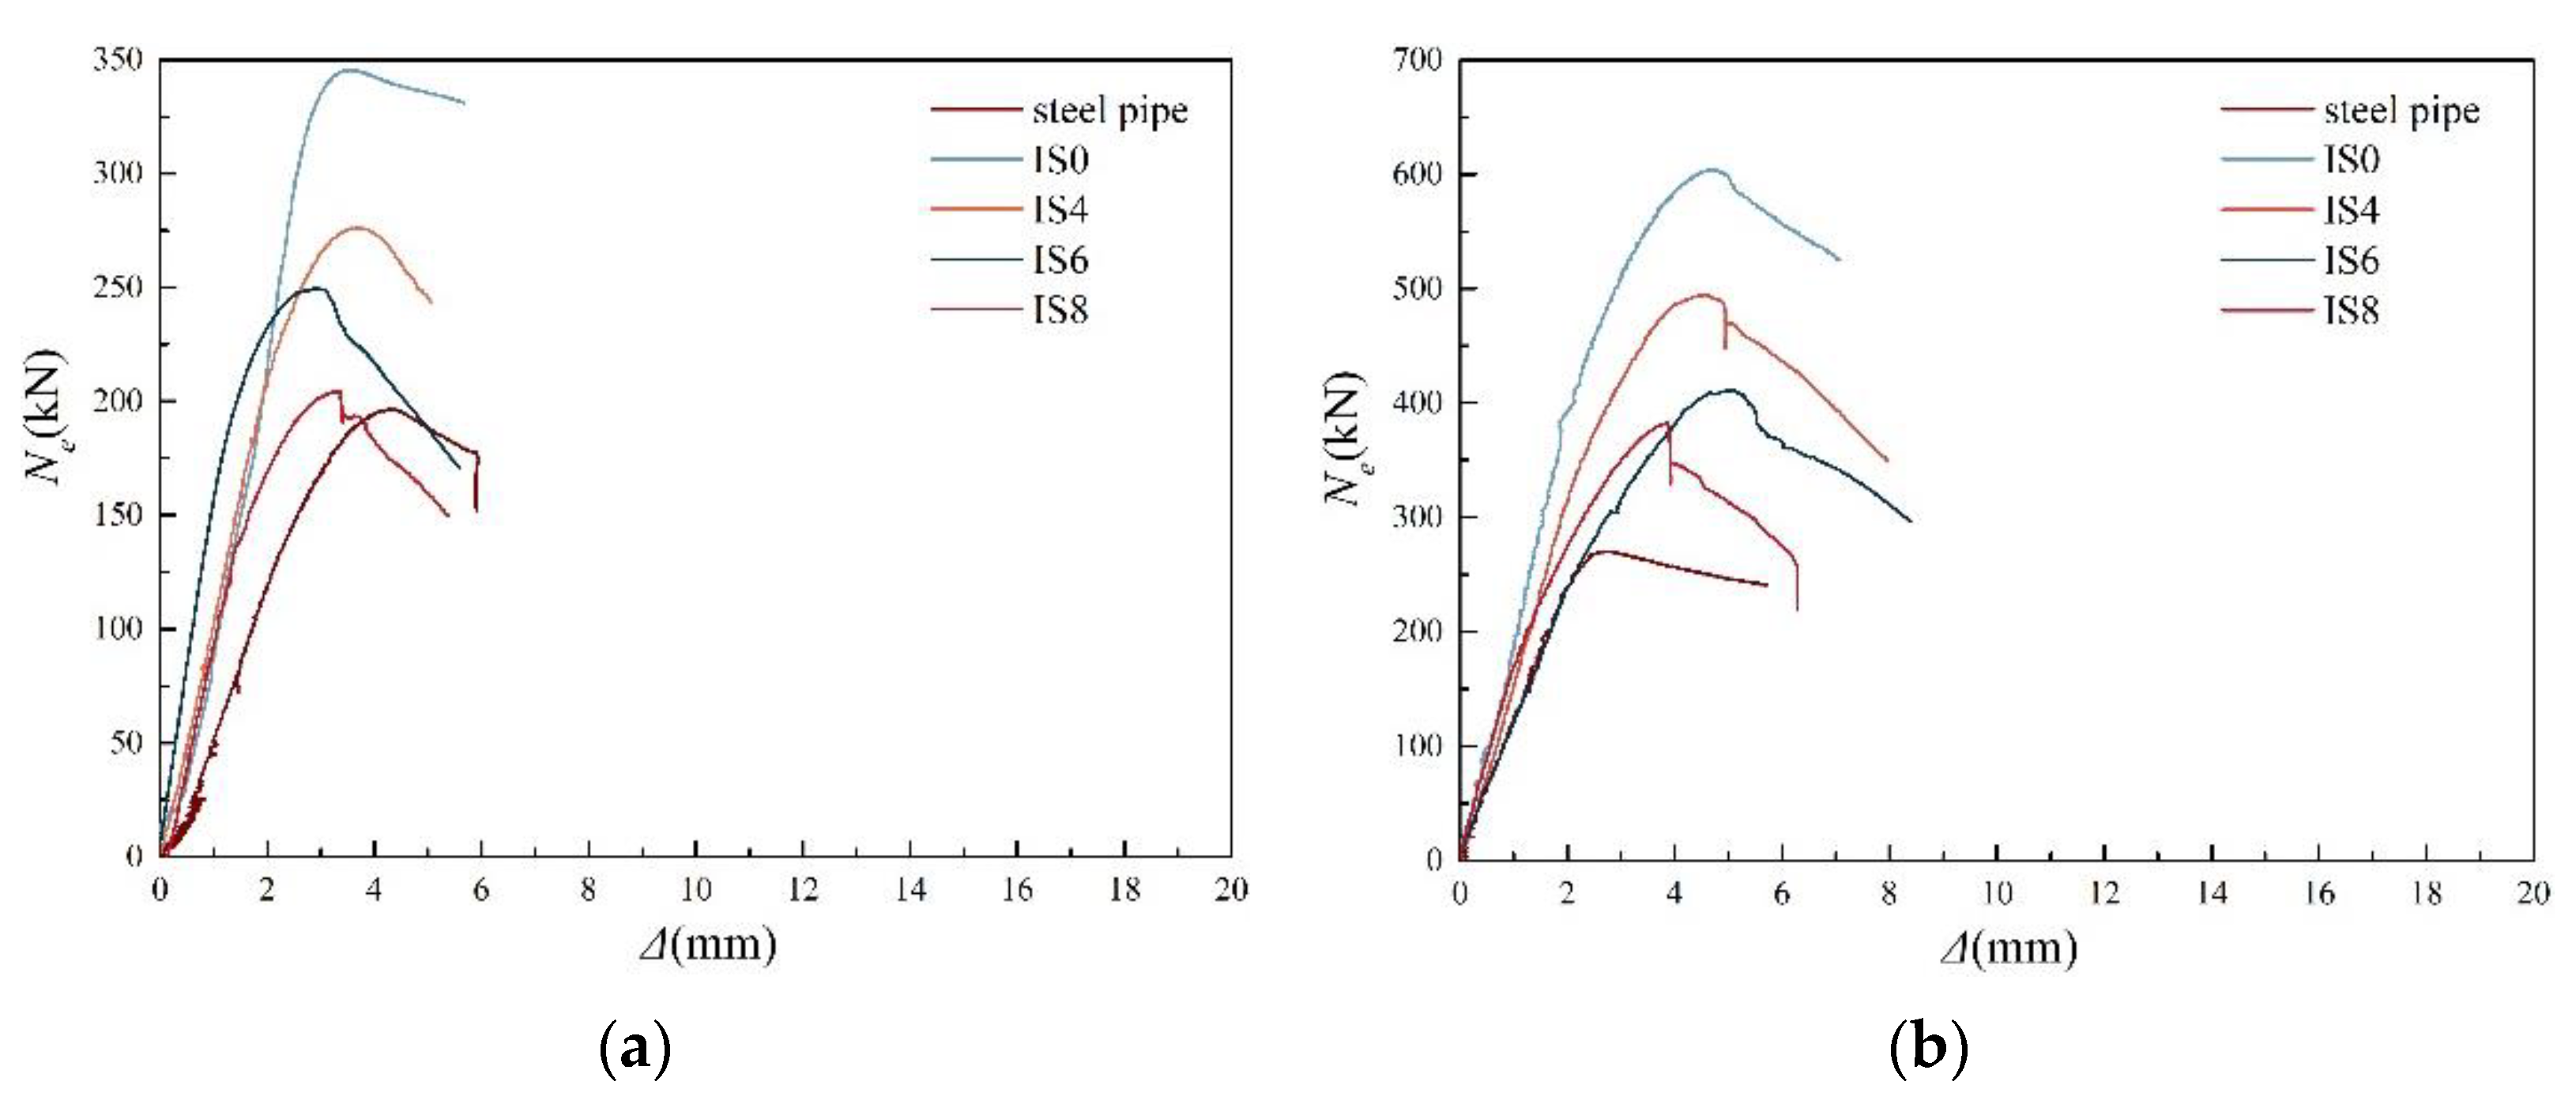
3.3. Load-Displacement Curves
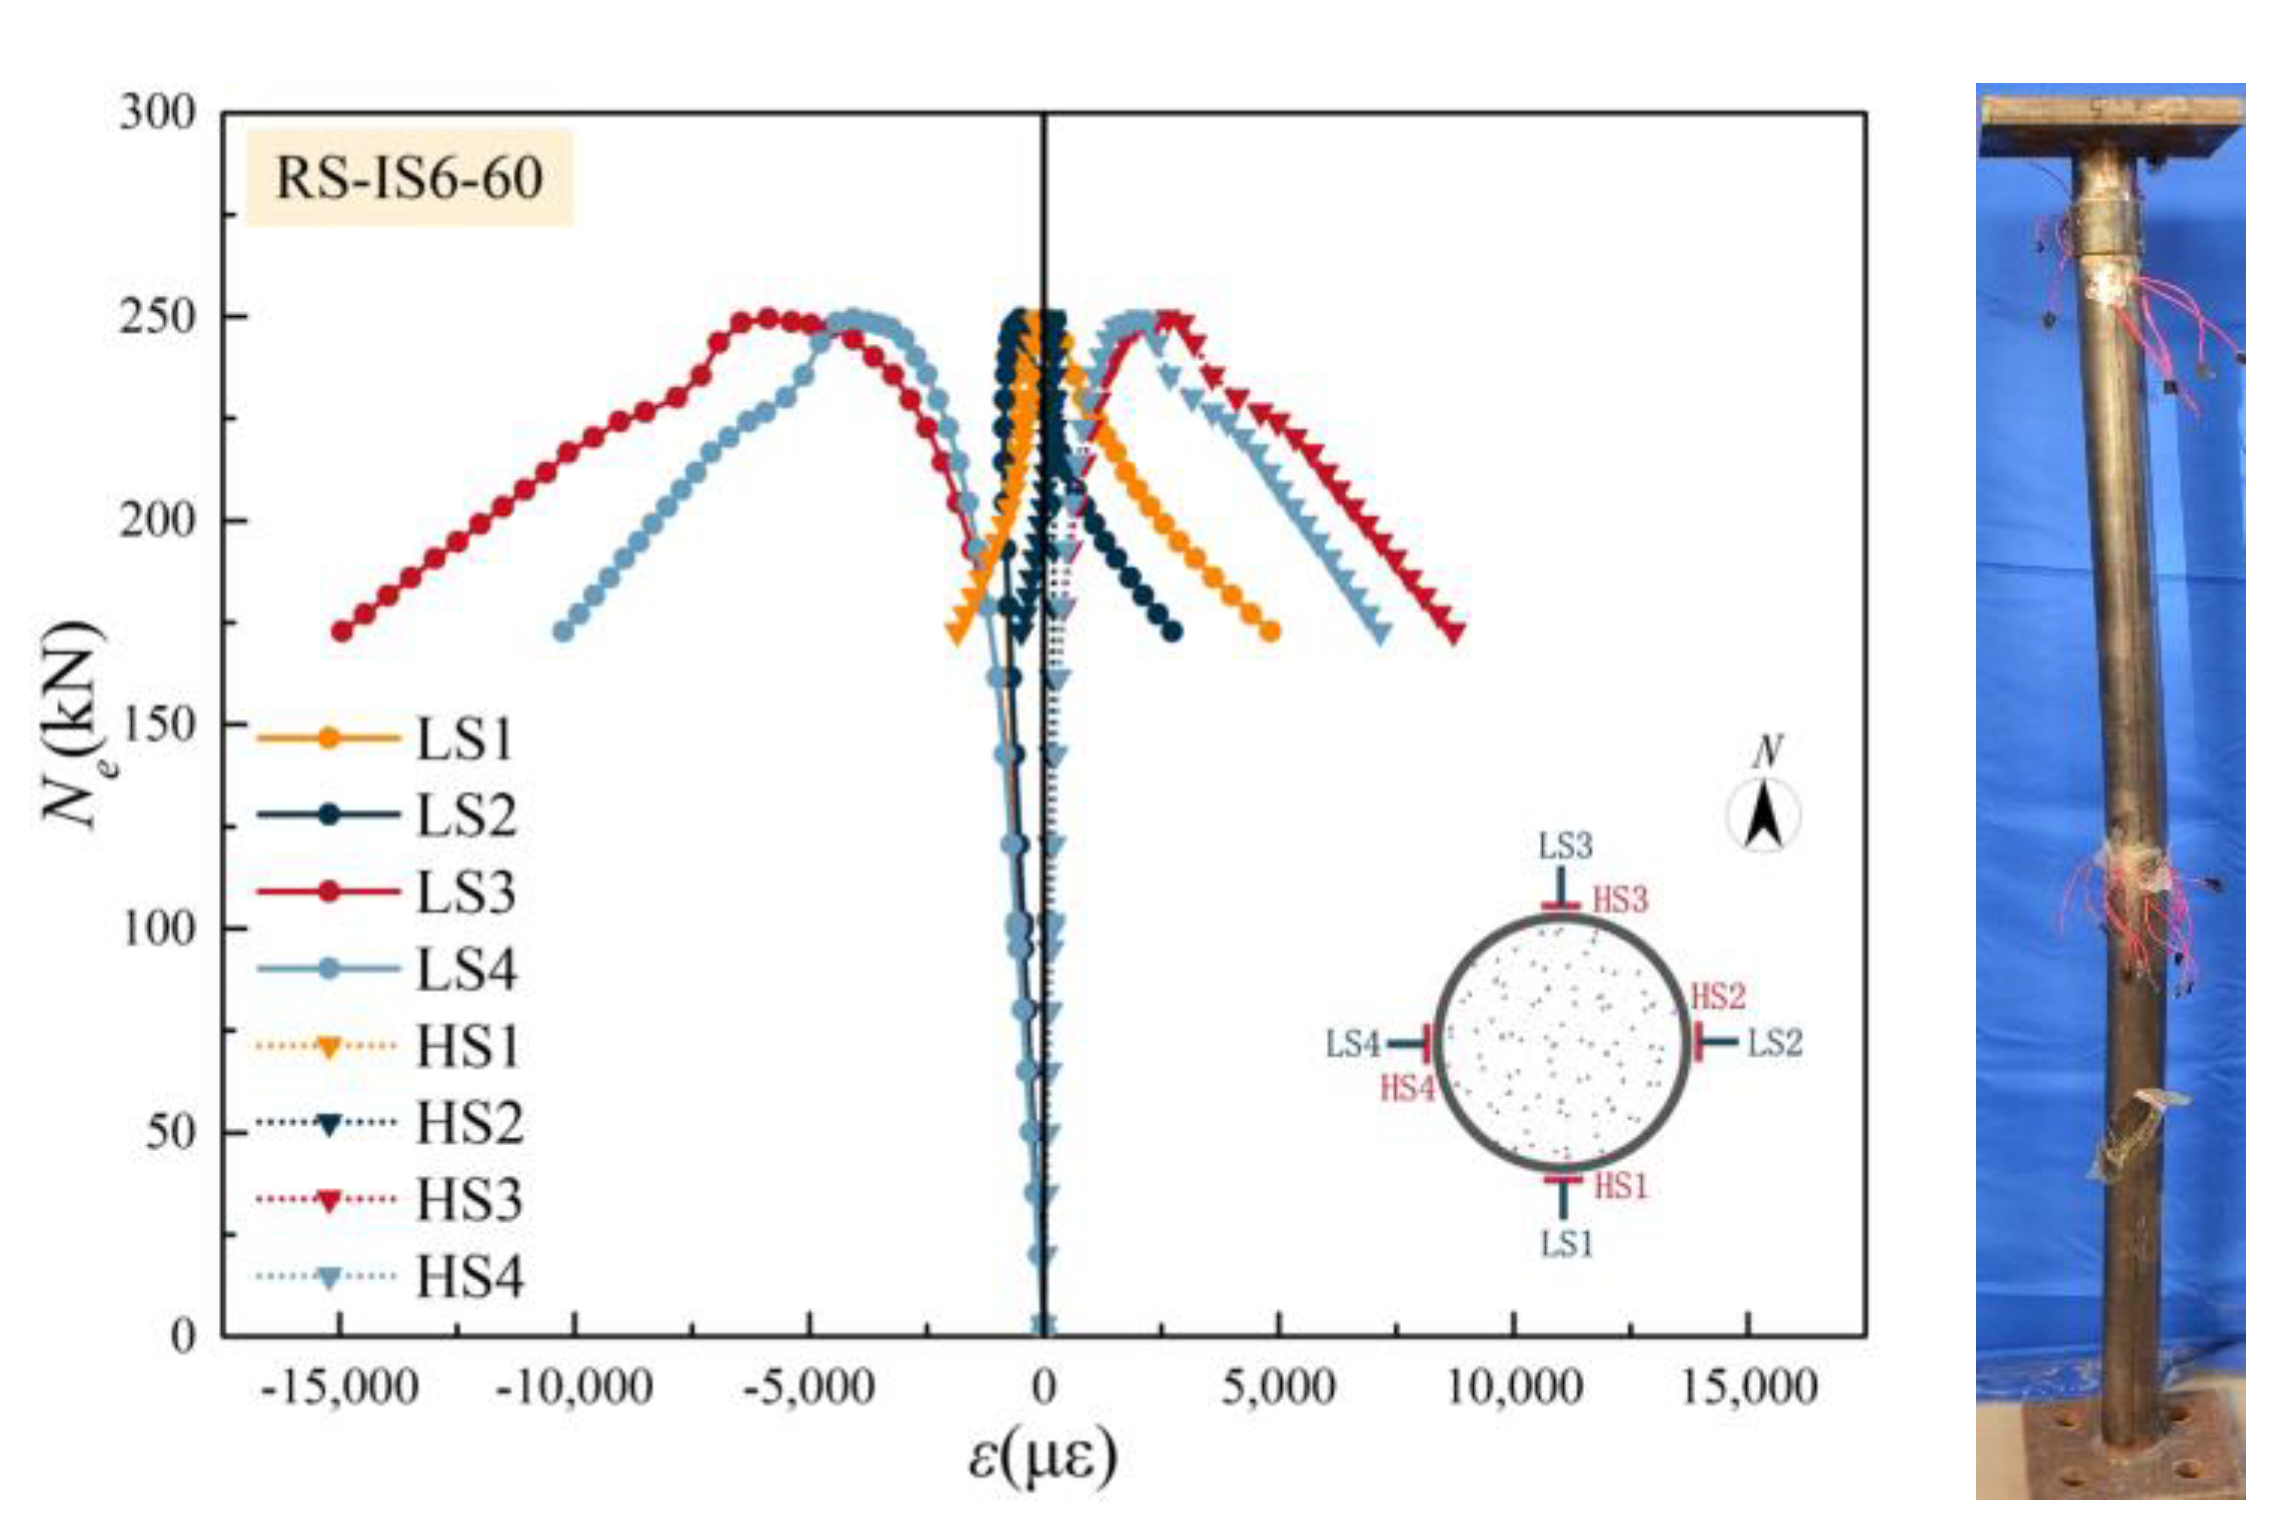
3.4. Stress and Strain Curves
4. Discussion
4.1. Effect of Reinforcement from RPC
4.2. Effect of Confinement Coefficient
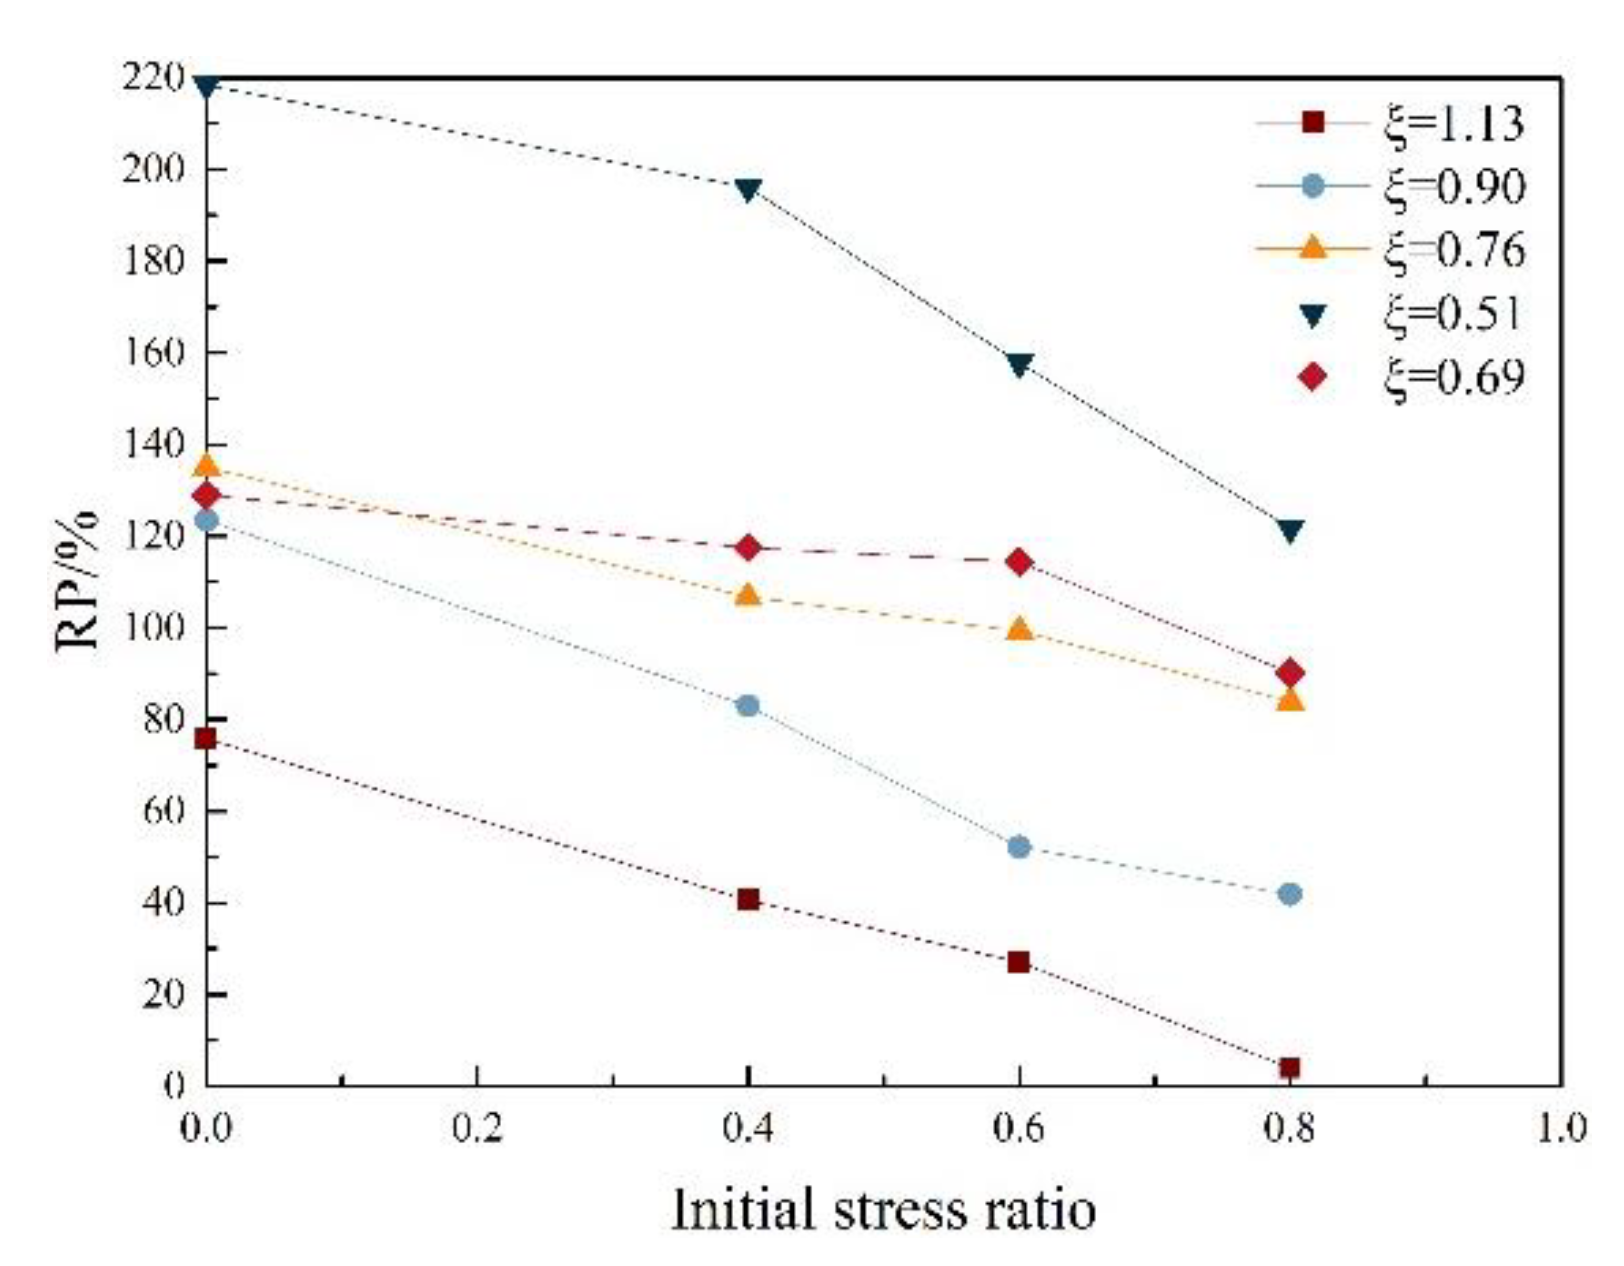
4.3. Effect of Initial Stress
5. Calculation of Reinforced Bearing Capacity
5.1. Detailing Requirements
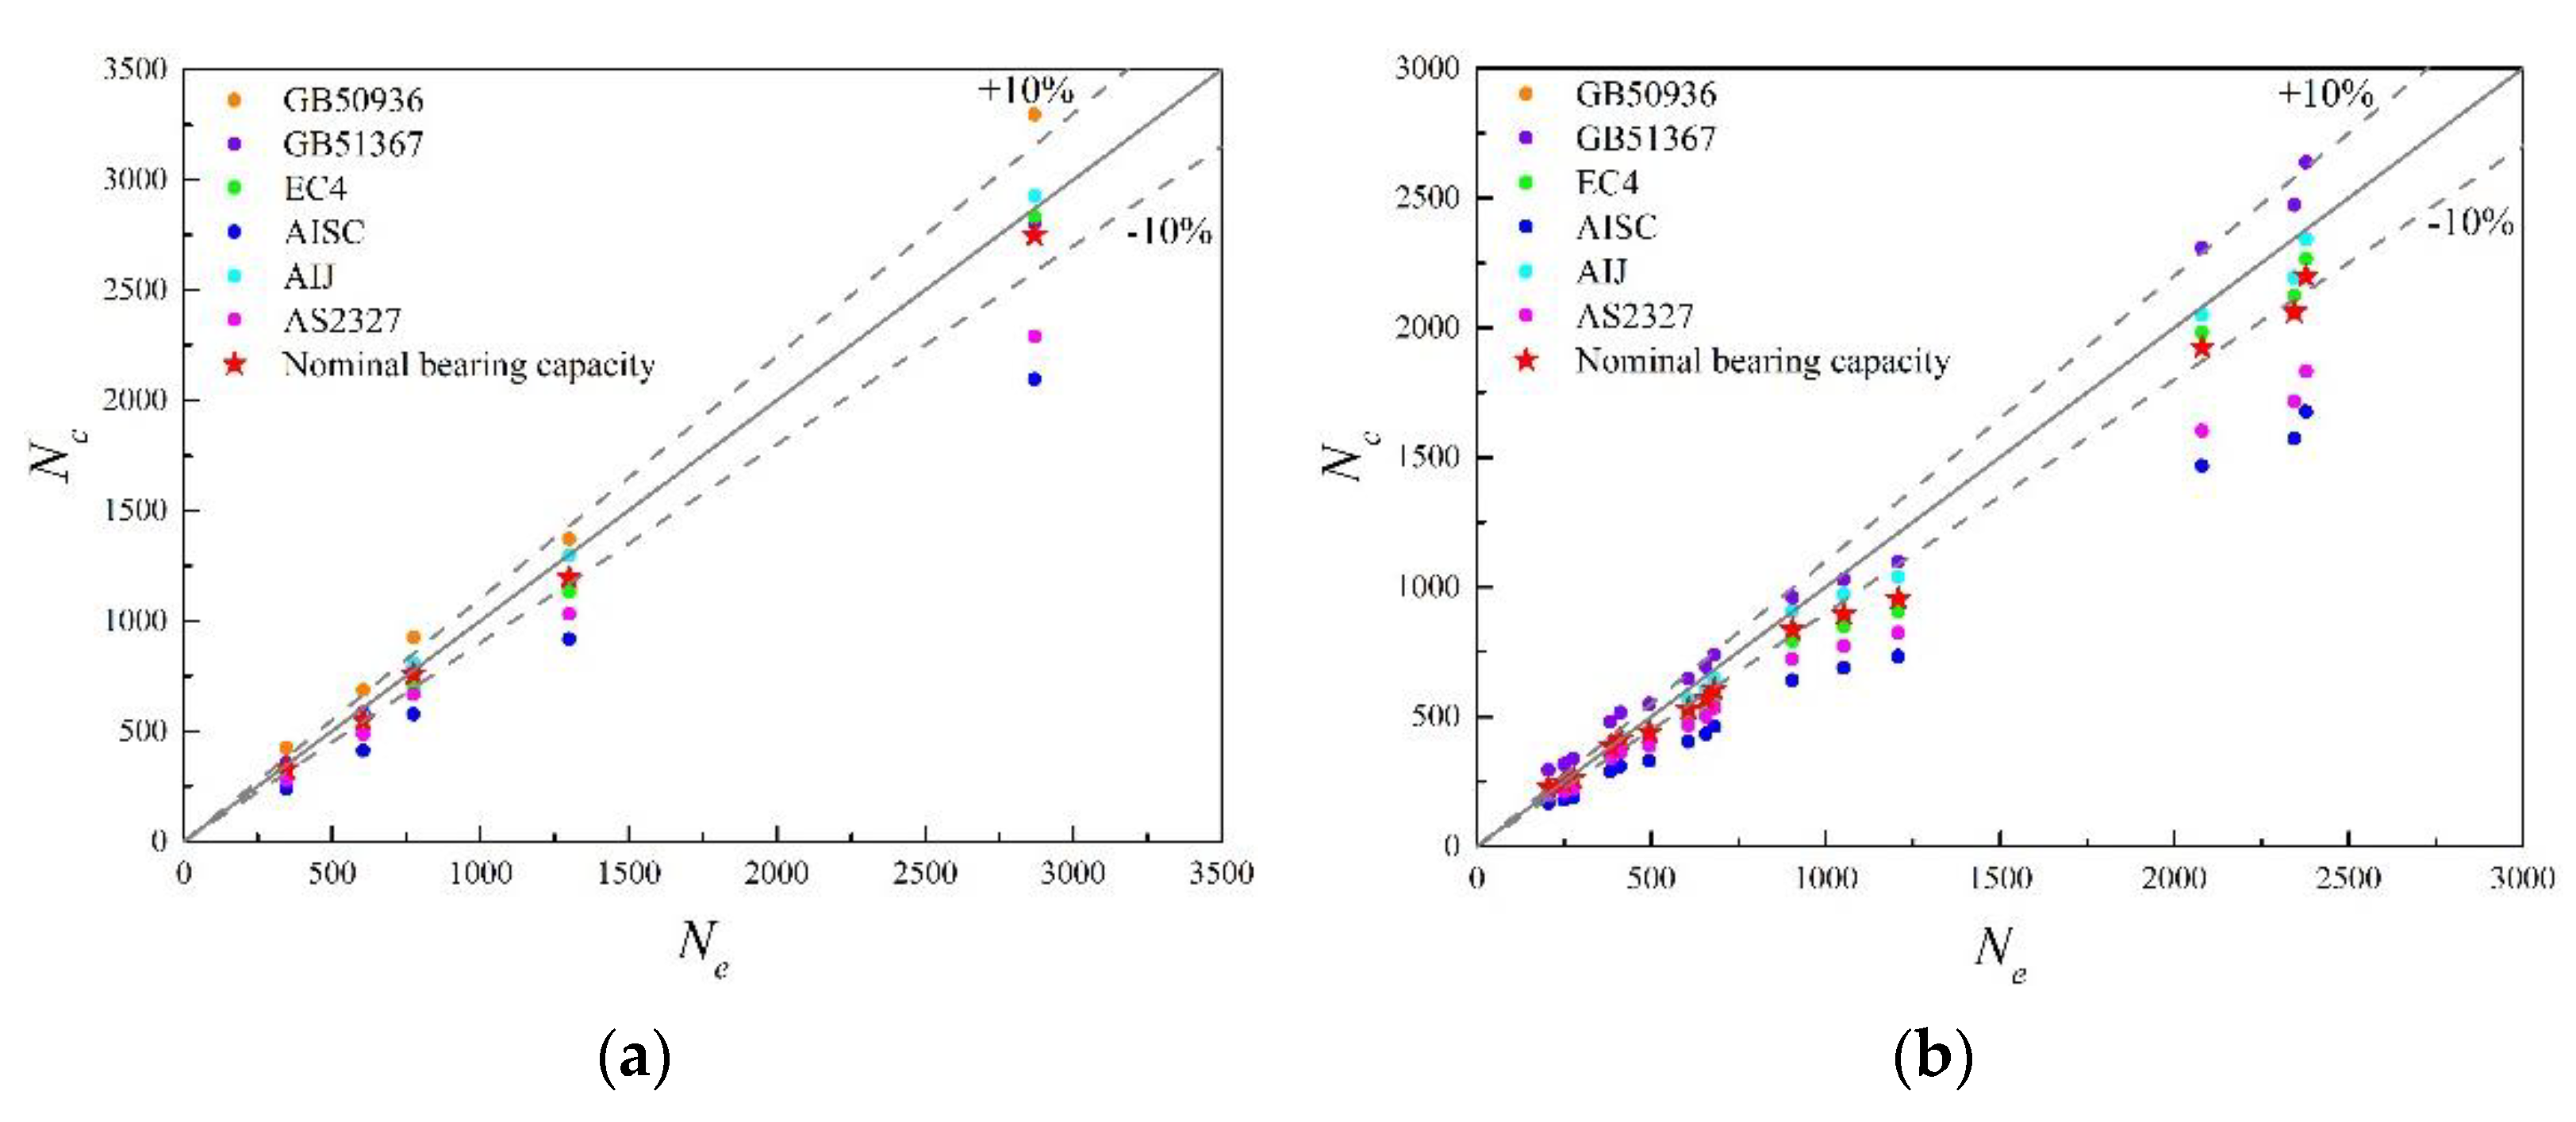
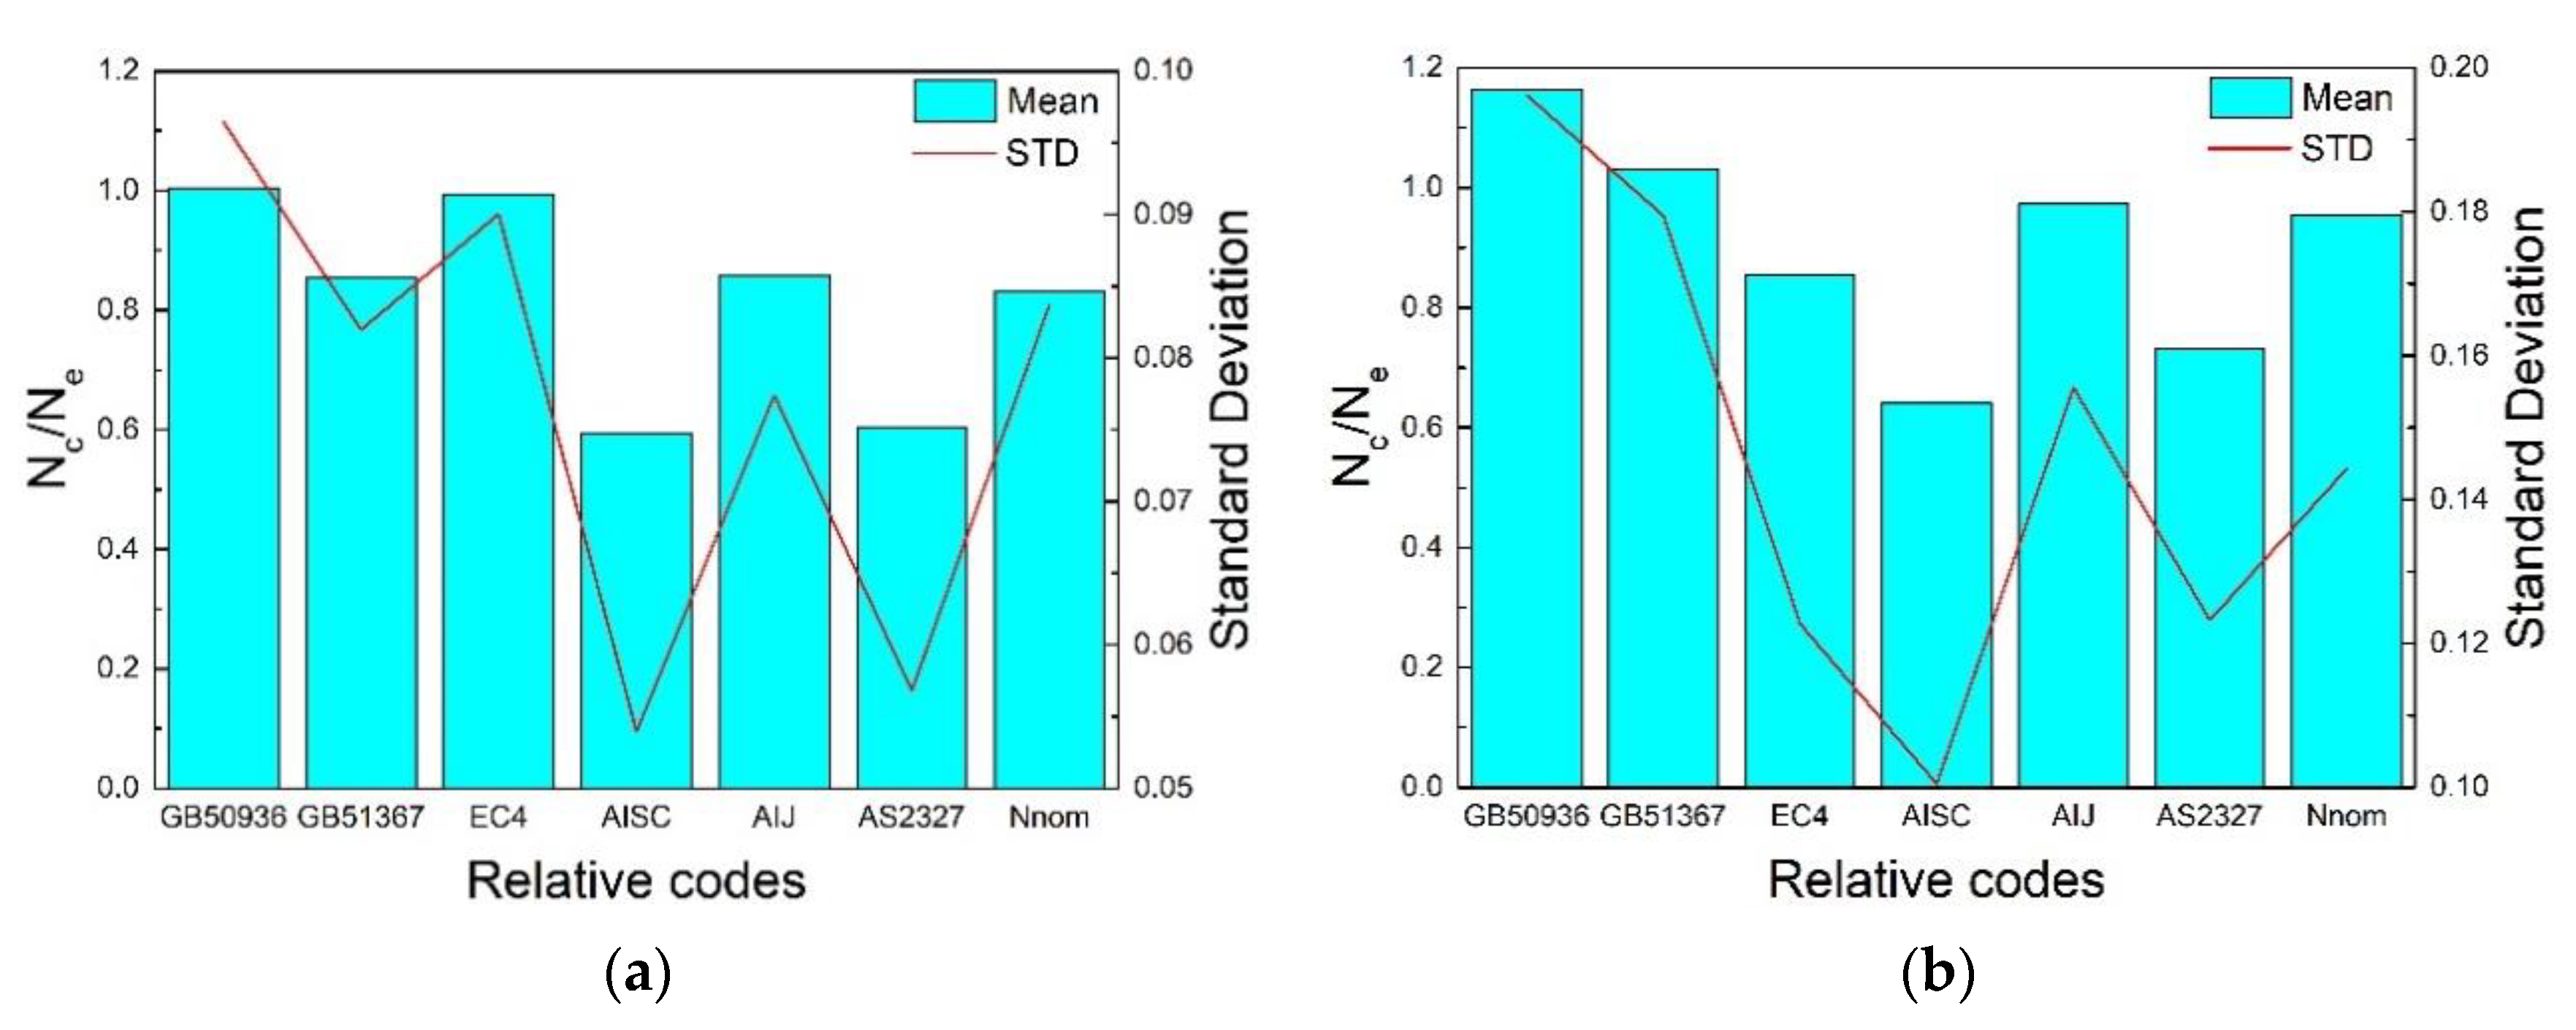
5.2. Calculation Methods
5.3. Data Fitting
6. Conclusions
Author Contributions
Funding
Conflicts of Interest
References
- Dong, S.; Zhao, Y.; Xing, D. Application and development of modern long-span space structures in China. Spat. Struct. 2012, 18, 3–16. (In Chinese) [Google Scholar] [CrossRef]
- Dong, S.; Zhao, Y.; Zhou, D. New Structural Forms and New Technologies in the Development of Steel Space Structures in China. Adv. Struct. Eng. 2000, 3, 49–65. [Google Scholar] [CrossRef]
- Zhang, Y.; Xue, S.; Yang, Q. Long-Span Spatial Structure, 2nd ed.; Mechanical Industry Press: Beijing, China, 2014; Volume 386. (In Chinese) [Google Scholar]
- Ge, L. The Analysis of Collapse of a Welded Hollow Ball Rack Workshop; Taiyuan University of Technology: Taiyuan, China, 2014. (In Chinese) [Google Scholar]
- Tang, D.; Zhang, L.; Wei, X.; Juan, L.U. Grid Structure Appraising and Reinforce Reconstruction by SAP2000 Static Non-Linear Analysis. Constr. Qual. 2013, 31, 25–28. (In Chinese) [Google Scholar]
- Jian, L.; Lei, H.G. Analysis on the Causes of Fatigue Accidents of a Bolt-Ball Structure Plant in Shanxi. Appl. Mech. Mater. 2016, 851, 864–869. [Google Scholar]
- Xing, J.H.; Lu, M.; Li, H.W.; Zhao, Y.M.; Yu, Y. The Seismic Damage Investigation and Phenomenon Analysis of Space Grid Structures in Lushan Ms 7.0 Earthquake. In Advances in Civil and Structural Engineering III; PTS 1-4; Trans Tech Publications Ltd.: Bäch SZ, Switzerland, 2014; Volume 501–504, p. 1535. [Google Scholar]
- Dai, J.; Zhe, Q.; Zhang, C.; Weng, X. Preliminary investigation of seismic damage to two steel space structures during the 2013 Lushan earthquake. Earthq. Eng. Eng. Vib. 2013, 12, 497–500. [Google Scholar] [CrossRef]
- Lei, H. Analysis and Treatment of Steel Structure Accidents; China Building Materials Industry Press: Beijing, China, 2003. (In Chinese) [Google Scholar]
- Wang, J. Collapse of Shenzhen International Exhibition Center. Build. Struct. 1993, 12, 37. (In Chinese) [Google Scholar]
- Li, Z.; Li, L.; Shi, Y.; Huang, X. Failure analysis of light rail station structure at Donghai Road in the “Aug 12th” accident of great fire explosion at Tianjin Port. J. Build. Struct. 2019, 40, 1–7. (In Chinese) [Google Scholar]
- GB 51367-2019; Standard for Design of Strengthening Steel Structure. China Ministry of Construction: Beijing, China, 2019. (In Chinese)
- Han, L.H.; Wei, L.; Reidar, B. Developments and advanced applications of concrete-filled steel tubular (CFST) structures: Members. J. Constr. Steel Res. 2014, 100, 221–228. [Google Scholar] [CrossRef]
- Chen, B.; Li, L.; Luo, X.; Wei, J.; Lai, X.; Liu, J.; Ding, Q.; Li, C. Review on ultra-high strength concrete filled steel tubes. J. Traffic Transp. Eng. 2020, 20, 1–21. (In Chinese) [Google Scholar]
- An, L.; Ekkehard, F. A review and analysis of circular UHPC filled steel tube columns under axial loading. Struct. Eng. Mech. 2017, 62, 417–430. [Google Scholar]
- Pierre, R.; Cheyrezy, M. Composition of reactive powder concretes. Cem. Concr. Res. 1995, 25, 1501–1511. [Google Scholar]
- Wang, Q.; Shi, Q.; Lui, E.M.; Xu, Z. Axial compressive behavior of reactive powder concrete-filled circular steel tube stub columns. J. Constr. Steel Res. 2019, 153, 42–54. [Google Scholar] [CrossRef]
- Rong, Q.; Zeng, Y.; Guo, L.; Hou, X.; Zheng, W. Response of RPC-Filled Circular Steel Tube Columns under Monotonic and Cyclic Axial Loading. Shock. Vib. 2019, 2019, 9141592. [Google Scholar] [CrossRef]
- Lai, Z.; Yao, P.; Huang, W.; Chen, B.; Ying, Z. Reactive powder concrete-filled steel tube (RPCFT) members subjected to axial tension: Experimental study and design. Structures 2020, 28, 933–942. [Google Scholar] [CrossRef]
- Xiong, M.X.; Xiong, D.X.; Liew, J.Y.R. Behaviour of steel tubular members infilled with ultra high strength concrete. J. Constr. Steel Res. 2017, 138, 168–183. [Google Scholar] [CrossRef]
- Yao, L. Researches on Behavior of Eccentrically Loaded Stub Column and Axially Compressed Slender Column with RPC-Filled Circular Steel Tube; Fuzhou University: Fuzhou, China, 2005. (In Chinese) [Google Scholar]
- Ji, W.; Luo, H.; Yang, G. Experimental study on axial compression behavior of reactive powder concrete filled steel tubular long columns. China Railw. Sci. 2014, 35, P28–P33. (In Chinese) [Google Scholar]
- Wei, Z.; Liu, X. Application of ceramic concrete filled steel tube in grid structure. Metall. Constr. Technol. Manag. 1993, 9, 14–18. (In Chinese) [Google Scholar]
- Chen, X.; Liu, X. Experimental study on composite grid of ceramic concrete filled steel tube. J. Harbin Univ. Civ. Eng. Archit. 1995, 28, P154–P159. (In Chinese) [Google Scholar]
- Gao, R.; Zheng Liu, Z.; Wu, M. Static Linear Analysis of Concrete-Filled Steel Tubular Composite Grid Structure. J. Ningxia Inst. Technol. 1996, S1, 197–203. (In Chinese) [Google Scholar]
- Pan, W. Concrete-Filled Steel Tube Reticulated Shell Seismic Analysis. Master’s Thesis, Xi’an University of Architecture and Technology, Xi’an, China, 2008. (In Chinese). [Google Scholar]
- Duan, Y.; Lei, H. Comparison for Solid Concrete-filled Circular Steel Tubes Load-carrying Capacities in Frame Structures Basing on Chinese codes. J. Phys. Conf. Ser. 2021, 2011, 12044. [Google Scholar]
- GB 50936-2014; Technical Code for Concrete Filled Steel Tubular Structures. China Ministry of Construction: Beijing, China, 2014. (In Chinese)
- Luo, H.; Wang, W.; Wang, G.; Pang, B. Study of Circular Reactive Powder Concrete-Filled Steel Tube Stub Columns under Axial Compression. J. Eng. Sci. Technol. Rev. 2018, 11, 144–152. [Google Scholar] [CrossRef]
- Chen, M.; Hou, X. Comparative Study on the Axial Compression and Bearing Capacity of Reactive Powder Concrete-Filled Circular Steel Tube. Adv. Mater. Sci. Eng. 2018, 2018, 1–11. [Google Scholar] [CrossRef] [Green Version]
- Li, B.; Zhang, L.; Gao, C. Steel tube concrete short columns and long column bounds slenderness ratio test. Concrete 2018. (In Chinese) [Google Scholar]
- GB 50017-2017; Standard for Design of Steel Structures. Ministry of Housing and Urban-Rural Development of the People’s Republic of China: Beijing, China, 2017. (In Chinese)
- Wu, P. Study of Mechanical Properties of Steel Tube Filled with Self-Compacting RPC; Beijing Jiaotong University: Beijing, China, 2010. (In Chinese) [Google Scholar]
- GB/T 228.1-2010; Metallic Materials-Tensile Testing—Part 1: Method of test at Room Temperature. China Standard Press: Beijing, China, 2010. (In Chinese)
- GB/T 2975-2018; Steel and Steel Products-Location and Preparation of Samples and Test Pieces for Mechanical Testing. China Standard Press: Beijing, China, 2018. (In Chinese)
- GBT 31387-2015; Reactive Powder Concrete. China Standard Press: Beijing, China, 2015. (In Chinese)
- GB/T 50081-2019; Standard for Test Methods of Concrete Physical and Mechanical Properties. Ministry of Construction: Beijing, China, 2019. (In Chinese)
- EN1994-1-1; Design of Composite Steel and Concrete Structures—Part 1-1: General Rules and Rules for Buildings. CEN: Brussels, Belgium, 2004.
- ANSI/AISC 360-10; Specification for Structural Steel Buildings. AISC: Chicago, IL, USA, 2010.
- Concret-Filled Steel Pipe Structure Design and Construction Guidelines; Japan Architectural Institute: Tokyo, Japan, 1997. (In Japanese)
- AS/NSZ 2327:2017; Composite Structures-Composite Steel-Concrete Construction in Buildings. SAI Global Limited: Sydney, Australia; Wellington, New Zealand, 2017.
- Xu, Z. Experimental Study and Analysis of RPC—Filled Steel Tube under Axial Compression and Push Out Test; Hunan University: Hunan, China, 2016. (In Chinese) [Google Scholar]
- Yang, G. Research on Behavior and Ultimate Bearing Capacity of Reactive Powder Concrete-Filled Steel Tube Columns under Axial Compression; Beijing Jiaotong University: Beijing, China, 2013. (In Chinese) [Google Scholar]
- Feng, J. Study on Mechanical Behavior of Reactive Powder Concrete Filled Steel Tubular Columns; Tsinghua University: Beijing, China, 2008. (In Chinese) [Google Scholar]
- Lin, Z.; Wu, Y.; Shen, Z. Research on behavior of RPC filled circular steel column subjected to axial compression. J. Build. Struct. 2005, 26, 52–57. (In Chinese) [Google Scholar]
- Yang, W. Study on Mechanical Properties and Ultimate Bearing Capacity of Reactive Powder Concrete Filled Steel Tube; Hunan University: Changsha, China, 2003. (In Chinese) [Google Scholar]
- Zhang, J. Experimental Investigation on Behavior of Reactive Powder Concrete Filled Steel Tube Columns; Fuzhou University: Fuzhou, China, 2003. (In Chinese) [Google Scholar]
- Luo, H. Study on Axial Compression Behavior of Reactive Powder Concrete Filled Circular Steel Tube Short Columns; Beijing Jiaotong University: Beijing, China, 2011. (In Chinese) [Google Scholar]
- Yan, Z.G.; Yan, H.; An, M.Z. Axial Compression Experimental Research of RPC Filled Steel Tube Columns. Adv. Mater. Res. 2010, 150, 198–202. [Google Scholar] [CrossRef]
- Zeng, J. Research on Behavior of Eccentrically Loaded Slender Column of Circular Steel Tube. Master’s Thesis, Fuzhou University, Fujian, China, 2005. (In Chinese). [Google Scholar]


| Specimen | (mm) | (MPa) | (MPa) | ||
|---|---|---|---|---|---|
| S-IS0-60 | 60 × 3.5 × 1500 | 17.5 | 403 | - | - |
| RS-IS0-60 | 403 | 100 | 1.13 | ||
| RS-IS4-60 | |||||
| RS-IS6-60 | |||||
| RS-IS8-60 | |||||
| S-IS0-75.5 | 75.5 × 3.75 × 1500 | 13.91 | 387 | - | - |
| RS-IS0-75.5 | 387 | 100 | 0.90 | ||
| RS-IS4-75.5 | |||||
| RS-IS6-75.5 | |||||
| RS-IS8-75.5 | |||||
| S-IS0-88.5 | 88.5 × 4 × 1500 | 11.86 | 368 | - | - |
| RS-IS0-88.5 | 368 | 100 | 0.76 | ||
| RS-IS4-88.5 | |||||
| RS-IS6-88.5 | |||||
| RS-IS8-88.5 | |||||
| S-IS0-114 | 114 × 4 × 1500 | 9.21 | 326 | - | - |
| RS-IS0-114 | 326 | 100 | 0.51 | ||
| RS-IS4-114 | |||||
| RS-IS6-114 | |||||
| RS-IS8-114 | |||||
| S-IS0-159 | 159 × 6 × 1500 | 6.60 | 410 | - | - |
| RS-IS0-159 | 410 | 100 | 0.69 | ||
| RS-IS4-159 | |||||
| RS-IS6-159 | |||||
| RS-IS8-159 |
| Number | Specimen | Yield Strength | Ultimate Strength | Percentage Elongation | Yield Ratio |
|---|---|---|---|---|---|
| 1 | T60 | 403.92 | 545.38 | 22.13 | 0.74 |
| 2 | T75.5 | 387.80 | 518.23 | 22.50 | 0.74 |
| 3 | T88.5 | 368.94 | 509.36 | 21.98 | 0.72 |
| 4 | T114 | 326.46 | 474.40 | 24.92 | 0.70 |
| 5 | T159 | 410.95 | 592.14 | 26.58 | 0.70 |
| (N/mm2) | Axial Compressive Strength (N/mm2) | Tensile Strength (N/mm2) | Young’s Modulus (N/mm2) | ||
|---|---|---|---|---|---|
| 3 d | 7 d | 28 d | |||
| 95.29 | 107.26 | 125.56 | 100.49 | 6.46 | 3.95 × 10⁴ |
| Specimen | Specimen | (%) | |||||||
|---|---|---|---|---|---|---|---|---|---|
| S-IS0-60 | 196.59 | 211 | −6.8 | S-IS0-75.5 | 270.39 | 292 | −7.4 | ||
| RS-IS0-60 | 345.54 | 444 | 28.4 | 75.77 | RS-IS0-75.5 | 604.22 | 735 | 21.7% | 123.46 |
| RS-IS4-60 | 276.31 | 355 | 28.5 | 40.55 | RS-IS4-75.5 | 494.64 | 588 | 18.9% | 82.94 |
| RS-IS6-60 | 249.77 | 333 | 33.2 | 27.05 | RS-IS6-75.5 | 411.36 | 551 | 34.1% | 52.14 |
| RS-IS8-60 | 204.48 | 311 | 51.9 | 4.01 | RS-IS8-75.5 | 383.53 | 515 | 34.2% | 41.84 |
| S-IS0-88.5 | 329.50 | 359 | −8.2 | S-IS0-114 | 408.19 | 426 | −4.2 | ||
| RS-IS0-88.5 | 774.38 | 985 | 27.2% | 135.02 | RS-IS0-114 | 1299.43 | 1445 | 11.2% | 218.34 |
| RS-IS4-88.5 | 680.91 | 788 | 15.7% | 106.65 | RS-IS4-114 | 1208.26 | 1156 | −4.3% | 196.00 |
| RS-IS6-88.5 | 656.67 | 739 | 12.5% | 99.29 | RS-IS6-114 | 1052.02 | 1084 | 3.0% | 157.73 |
| RS-IS8-88.5 | 606.11 | 690 | 13.8% | 83.95 | RS-IS8-114 | 905.02 | 1011 | 11.8% | 121.72 |
| S-IS0-159 | 1093.70 | 1149 | −4.8 | ||||||
| RS-IS0-159 | 2503.70 | 3501 | 39.6% | 128.92 | |||||
| RS-IS4-159 | 2377.63 | 2801 | 17.8% | 117.39 | |||||
| RS-IS6-159 | 2344.13 | 2626 | 12.0% | 114.33 | |||||
| RS-IS8-159 | 2079.69 | 2451 | 17.8% | 90.15 | |||||
| Code | GB 50936 [28] | GB 51367 [12] | EC 4 [38] | AISC [39] | AIJ [40] | AS 2327 [41] |
|---|---|---|---|---|---|---|
| 20.1~50.2 | 20.1~50.2 | 16.9~38.5 | 17.8~51.3 | ≤41.8 | 17.8~73.3 | |
| 23.7~70.0 | 23.7~69.97 | 20~50 | 21~70 | ≤56.4 | 20~100 | |
| 235~460 | 23.7~69.97 | 235~460 | ≤525 | 235.2~352.8 | <690 | |
| ; | ||||||
| 1.4 | 1.4 | 1.5 | 1 | 3/1.5 | 1 | |
| 1.09~1.125 | 1.09~1.125 | 1.15 | 1 | 1.5/1.0 | 1 | |
| 1 | 1 | 0.6 | 0.2 | 0.72 | ||
| 0.5~2.0 | - | - | - | - | - | |
| - | - | 0.2~0.9 | ≥0.01 | - | 0.2~0.9 |
| 83~219 | 1~16 | 244.9~453 | 53.19~154 | 2.65~12 | 0.057~3.133 |
Publisher’s Note: MDPI stays neutral with regard to jurisdictional claims in published maps and institutional affiliations. |
© 2022 by the authors. Licensee MDPI, Basel, Switzerland. This article is an open access article distributed under the terms and conditions of the Creative Commons Attribution (CC BY) license (https://creativecommons.org/licenses/by/4.0/).
Share and Cite
Duan, Y.; Lei, H.; Zhou, Y.; Jin, S. Experimental Study on Bearing Capacity of Compression Members of Space Grid Structures Reinforced by RPC. Appl. Sci. 2022, 12, 7809. https://doi.org/10.3390/app12157809
Duan Y, Lei H, Zhou Y, Jin S. Experimental Study on Bearing Capacity of Compression Members of Space Grid Structures Reinforced by RPC. Applied Sciences. 2022; 12(15):7809. https://doi.org/10.3390/app12157809
Chicago/Turabian StyleDuan, Yutong, Honggang Lei, Yan Zhou, and Shihong Jin. 2022. "Experimental Study on Bearing Capacity of Compression Members of Space Grid Structures Reinforced by RPC" Applied Sciences 12, no. 15: 7809. https://doi.org/10.3390/app12157809
APA StyleDuan, Y., Lei, H., Zhou, Y., & Jin, S. (2022). Experimental Study on Bearing Capacity of Compression Members of Space Grid Structures Reinforced by RPC. Applied Sciences, 12(15), 7809. https://doi.org/10.3390/app12157809