Article

Seismic Assessment and Structural Retrofitting of the Day-Hospital Building “G. Pascale Foundation”

1
Department of Civil Engineering, University of Salerno, 84084 Fisciano, Italy
2
Department of Pharmacy, University of Salerno, 84084 Fisciano, Italy
3
National Cancer Institute “G. Pascale Foundation”, 80131 Naples, Italy
*
Author to whom correspondence should be addressed.
Appl. Sci. 2023, 13(3), 1663; https://doi.org/10.3390/app13031663
Submission received: 11 January 2023 / Revised: 19 January 2023 / Accepted: 23 January 2023 / Published: 28 January 2023
(This article belongs to the Special Issue Seismic Assessment and Retrofit of Steel Structures)

Abstract

:
This work aims to provide an effective structural solution, minimizing the discomfort during the works’ execution, for how to retrofit the Day-Hospital building of the National Cancer Institute “G. Pascale Foundation” in Naples. The structural vulnerability has been preliminarily evaluated for this scope, using linear static and dynamic analyses according to code provisions. The performance index in terms of peak ground acceleration (PGA), both for the life safety (SLV) limit state and the operational (SLO) limit state, has been evaluated. A seismic assessment has been performed by finite element (FE) analyses using the SAP2000 computer program, post-processor VIS15 and plugin SPF. Two main solutions have been proposed to improve the structural performance of the existing building. The first one is based on increasing the thickness of the existing reinforced concrete (RC) cores. The second solution is characterized by strengthening the RC cores using steel plates, steel strips and angles. A comparison of the proposed interventions is provided herein from the technological and financial standpoints.

1. Introduction

Most of the Italian public building heritage was built without seismic assessments in areas affected by a significant seismic hazard. This creates issues today and is particularly important where the building stock is antiquated. Consequently, the seismic assessment of existing buildings represents a topic of paramount importance, especially in the case of strategic structures [1]. In recent years, many research works were aimed at defining the fragility curves of existing school buildings in order to set an order of priority for structural retrofitting [2,3,4,5].
Most of these buildings were built from reinforced concrete (RC) and designed in the 1950–70s without seismic considerations. The most common structural technique adopted for Italian RC buildings is a spatial frame with masonry-infilled walls along the external perimeter. The internal beams usually run in only one direction. Since such constructions were designed following non-seismic provisions, they are often vulnerable to horizontal loading [6]. In the last two decades, specific seismic rules have been introduced for the design of buildings following seismic codes: OPCM 3274 [7], NTC2008 [8] with its application commentary [9], NTC2018 [10] with its application commentary [11] and EN1998-3 [12]. In particular, structures are currently designed to achieve two main goals. The first requires that structures remain in the elastic range under seismic actions, with a return period comparable with the life cycle of the structure. The second is based on the consideration that to resist destructive earthquakes without totally or partially collapsing, structures must possess high deformation resources over their elastic limit [6]. To that end, fundamental principles of capacity design (CD) [13,14,15,16] are applied. In particular, the dissipative parts of a building are designed according to the first principle of CD, i.e., as determined by structural analysis, while the non-dissipative zones are designed according to the second principle of CD, i.e., considering the movements of the dissipative parts in their ultimate conditions. It is clear to see that the previous considerations can easily be applied to the design of new buildings. Conversely, the retrofit of existing structures is more complicated than the design of new buildings. First, it is necessary to define the vulnerability level, to identify the structural criticalities. Subsequently, retrofitting interventions should be selected to mitigate the seismic risk and achieve a good compromise in terms of structural safety, cost and ease of execution.
The logical process can be organized into four steps:
  • Step 1: Collection of historical information and geometrical and structural characterization of the building under investigation.
  • Step 2: Definition of mechanical properties characterizing the existing materials using destructive and non-destructive on-site tests.
  • Step 3: Evaluation of safety level according to different limit states using linear and/or non-linear analyses.
  • Step 4: Definition of the structural interventions needed to produce the most advantageous economic and structural solution.
Particular attention should be focused on public and strategic buildings whose functionality is fundamental in a seismic emergency. After the occurrence of a school collapse in central Italy in 2003, an Ordinance of the Presidency of the Ministers’ Council [7] gave five years maximum to evaluate the seismic vulnerability of the main public buildings (hospitals, schools, bridges, police stations, etc.). However, that timescale was extended several times and the seismic vulnerability of many strategic structures has not yet been evaluated. Among all the strategic buildings, special attention should be paid to hospitals, whose functionality in post-earthquake management is of primary importance. For such buildings, structural retrofitting interventions should be designed to ensure the continuous operation of medical activities.
The present article sets out the results of a vulnerability assessment and offers suggestions for retrofitting interventions of the cancer institute “G. Pascale Foundation” in Naples. Recently, the seismic vulnerability of the whole institute has been investigated by AIRES Engineering, with the supervision of the Department of Architecture and Industrial Design of Vanvitelli University [17]. A previous study highlighted the high seismic vulnerability of the buildings belonging to the institute. In this work, a re-assessment of the seismic vulnerability of the “Day-Hospital Building” is presented, identifying possible structural interventions for its seismic upgrade. The aim when developing these was to identify structural interventions that minimize the disruption of medical activities and ensure their continuity.
Starting from the information collected in [17], vulnerability indices were evaluated using linear dynamic analyses, and structural retrofitting solutions were developed to mitigate the seismic risk with different performance levels. All interventions are aimed at increasing the resistance of the cores’ walls, which constitute the seismic-resistant system of the structure. To identify the best solution among those proposed, a comparative analysis was performed considering the seismic performance levels, the sustainability of the structural interventions, the ease of their implementation and, finally, their cost.

2. Previous Research Activities

Pushover analyses for the main buildings of the institute “G. Pascale Foundation” in Naples have already been performed to accurately evaluate the seismic vulnerability, as presented in [17]. The medical complex is composed of five buildings: the “Scientific Building” (SB), the “Hospitalization Building” (HB), the “Day-Hospital Building” (DB), the “Administrative Building (AB) and the “Nun Building” (NB). (SB was not included in the seismic assessment.) A general plan of the institute is depicted in Figure 1.
The first building to be constructed was the SB building in 1934. In the same period, a portion of the NB building was likely also erected. The HB building consists of several structural units, built between 1960 and 1980. Finally, the AB and DB buildings were developed between 1977 and 1982.
From a structural point of view, the HB and AB buildings are built of reinforced concrete. The NB building is composed of two different units made of masonry and reinforced concrete, while the Day-Hospital Building is characterized by RC cores connected to a steel structure withstanding gravitational loads alone.
The seismic vulnerability has been evaluated [17] by pushover analyses adopting the so-called N2 method implemented by Fajfar [18,19]. Performance indices have been provided in terms of both peak ground acceleration (PGA) and the return period ( T R ). The first was obtained as the ratio between demand and capacity, evaluated using the ADRS (Acceleration Displacement Response Spectra) plan. The second was evaluated as:
I R ( T R ) = ( T R T ref . ) a
where T R is the return period concerning the attainment of a given limit state (capacity of the structure), T ref . is the return period related to the exceedance probability typically considered for the seismic action associated with the limit state, and the exponent a represents a coefficient defined by a statistical analysis of the national hazard curves, which, in this case, can be assumed to equal 0.41, as suggested in [20].
The main results obtained in [17] for the DB building are shown in Table 1. The first column is the building label. The second column reports the considered limit state (LS): operational limit state (SLO), damage limit state (SLD) and life safe limit state (SLV). The third column indicates the governing collapse mechanism, which, for the examined building, is the inter-story drift (D) or the shear failure of the walls (SF_w), depending on the limit state. The fourth and fifth columns show the peak ground acceleration (PGA) and return period ( T R ), respectively. Finally, the sixth and seventh columns indicate the seismic performance indices in terms of PGA and T R , respectively.

3. The Day-Hospital Building

3.1. Structural Description

In this work, the attention is focused on the Day-Hospital Building (DB). Figure 2 shows some photos of the building. The building has a symmetrical plan. The inter-story height is 4.60 m for the first story and 3.60 m for all the others. The building has a seven-story, steel, gravity-load-resisting structure integrated with reinforced concrete cores acting as a seismic-resistant system. The steel part of the building is made of beams (IPE 240 and HEA 260) connected to columns (HEB 260) by beam-to-column joints designed to transmit the shear forces alone. The main structural elements are reported in Figure 3, where the left half of the carpentry plan is shown, and the red lines identify the RC cores. Connections are characterized by welded plates and M16 bolts (Figure 4a).
The building decks are composed of steel trapezoidal sheet running in the transverse direction, with a concrete topping of 50 mm thickness. The thickness of the trapezoidal sheet is 0.80 mm for spans up to 2.40 m and 1.20 mm for larger spans. The building deck is stiffened by a horizontal diaphragm constituting a bracing system made of steel angle sections (L40 × 40 × 4) (Figure 4b). The seismic-resistant part of the structure is composed of nine RC cores (serving as staircases and elevator cases) symmetrically located. On the left side, they are labeled T1 + T2, T3, T4, T6, while on the right side, the labels of the specular cores are the same but with an apostrophe (T1′ + T2′, T3′, T4′, T6′). T5 indicates the central RC core. The thickness of the concrete walls for all cores is 260 mm. In Figure 3, the extreme cores T1 + T2 (T1′ + T2′) have rebars with a diameter of 16 mm in the longitudinal direction, with 25 cm spacing (∅16/25). Meanwhile, the diameter of the other cores’ longitudinal rebars is 14 mm (∅14/25). In the transverse direction, in all the RC cores, the rebars acting as stirrups have a diameter of 8 mm, with 25 cm spacing (∅8/25). The rest of the platforms of the staircases were built as simple RC slabs, while the flat roof is a typical RC slab with lightning hollow blocks. The foundation systems are deep, built on bored piles with a diameter of 0.50 m and variable lengths. The depth of the concrete plinths is 1.20 m. The internal plinths are isolated, while the external plinths are connected by RC beams, supporting the external cladding, which is made of masonry-infilled blocks of 40 cm thickness. The foundation plan is shown in Figure 5.

3.2. Material Properties

Regarding the mechanical characterization of materials, reference is made to the investigation already performed by AIRES Engineering [17]. In particular, we refer to the company’s compressive tests of cylindrical concrete samples, tensile tests of reinforcement steel bars and steel structural members and Vickers hardness tests of steel bolts (More details are given in [17]). Original documents concerning the design, testing of materials during execution and the results of in situ tests (both destructive and non-destructive) have maximized our knowledge (LC3) according to Section C8.5.4 of Circular n.7 of 21/01/2019 [10,11]. This level of knowledge allows the use of a confidence factor FC = 1.00 [11]. Regarding the constructional steel grade, Fe37 was used, which corresponds to S235 nowadays. However, the experimental investigation provided mean values higher than those corresponding to the characteristic value of the Fe37 grade. In particular, the mean value of the yield stress was   f y m = 327.30   MPa , while the mean value of the ultimate stress was f t m = 451.50   MPa . These values were used in structural verification. Concerning the bolts, the experimental tests provided resistance values higher than the nominal ones, which for class 8.8 correspond to yield and ultimate strength values of f y b = 640   MPa and f u b = 800   MPa , respectively. These values were also used in the structural verification. Finally, concerning reinforced concrete cores, the compressive tests of concrete specimens confirmed the declared class, i.e., C20/25 with the characteristic cubic strength ( R c k ) of 25 MPa. Finally, FeB 32k was adopted for the rebars; however, the tensile tests provided an average value of the yield stress of f y m = 434.70   MPa . The mechanical properties of the materials are summarized in Table 2.

4. Structural Modeling

4.1. Definition of Loading Conditions

Load conditions were defined according to the Italian code [6]. Regarding the building decks, structural dead loads ( g 1 k ) were distinguished from non-structural dead loads ( g 2 k ) according to NTC2018 [10]. Table 3 shows the characteristic values of structural and non-structural dead loads for the different stories and stair landings. Moreover, the weight of the staircases was applied along the walls of the RC cores, while the load of the cladding walls was distributed along the external perimeter (Table 4). Finally, the weight of the mechanical systems, at the top of the RC cores, is 5.34 kN and was distributed along their walls.
The weight of the metal members and the reinforced concrete walls are automatically included in the structural model ( g 1 k ). The live loads ( q k ) are dependent on the category of use of the various parts of the structure, and they are defined in Table 5 according to Chapter 3 of NTC2018 [10].
The snow load was evaluated according to the following relationship [10]:
q s = μ i   q s k   C E   C t
where q s k represents the characteristic value of the snow, which, in this case, is 0.66 kN/m2 according to the geographical position of the building. The coefficient μ i   is the shape factor of the covering roof, which here is 0.80. Finally, C E   and C t are, respectively, the exposure and thermal coefficients, both assumed to be 1.00. So, the final value of the snow load was 0.53 kN/m2. The gravitational loads were combined according to the fundamental load combination for the ultimate limit state verification (SLU) and in the characteristic combination to check the serviceability limit state conditions (SLE). The loads were amplified with the partial safety factors and the combination coefficients prescribed in Section 2.5.3 of the current Italian provisions [6]. The seismic action was defined based on the soil characteristics, the exceedance probability depending on the considered limit state ( P V R ), a nominal structural life ( V N ) of 50 years, and a coefficient related to the category of use of the building ( C U ) of 2.00 because of its strategic importance.
Table 6 shows the values of the parameters defining the seismic hazard as a function of the site and the specific limit state, according to NTC2018. T R   is the return period of the seismic event, defined as:
T R = V R ln ( 1 P V R )
where V R is the value of the reference life, defined as:
V R = C U V N
The coefficient a g   is the PGA at the site, F 0   is the amplification factor and, finally, T C * is a reference value to define branches the elastic spectrum. These parameters allowed us to determine the elastic response spectrum for each limit state, as shown in Figure 6. According to Section 7.3.6 of NTC2018, seismic verification was performed in terms of the resistance, for the limit states SLD and SLV, and we calculated the interstorey drift for the operational limit state (SLO). Moreover, the seismic verifications were evaluated according to the specific load combination reported in Section 2.5.3 of the Italian code [10].

4.2. FE Modeling

The numerical model was implemented in SAP2000 [21]. In particular, the steel members were modeled as beam–column elements. The beams have hinged connections at their ends; columns are continuous along their height. The walls, constituting the RC cores, were modeled by four-node shell elements. Moreover, the building decks were considered rigid diaphragms due to the presence of the concrete slab and the horizontal bracing systems. Finally, when considering the foundation properties, constituted by bored piles on a tuff bank, it was possible to assume a fully restrained condition for the building model. Figure 7 shows a view of the FE model. Subsequently, gravitational loads were assigned to the structure. Seismic actions were defined as response spectra along both directions according to the load cases. Then, the seismic combinations were defined according to the following relationship reported in Section 2.5.3 of NTC2018 [10]:
E + G 1 + G 2 + j ψ 2 j · Q kj
where E represents the whole seismic action, including the eccentricity of 0.05 associated with the earthquake, G 1 and G 2 are, respectively, the structural and nonstructural loads, Q kj represents the live actions and, finally, ψ 2 j represents the partial combination coefficients.

4.3. FE Analysis

Linear static and dynamic analyses were performed according to Section C8.5.4.2 of Circular n.7 of 21/01/2019 [11]. The results were compared with those obtained by pushover analyses, as presented in [17]. The main vibration modes of the structure were determined. Subsequently, the structural stresses were obtained by combining the effects of the different eigenmodes. To this end, either the SRSS (square root of sum of squares) [22] or CQC (complete quadratic combination) [23] can be used. The CQC was adopted.
The total number of mode shapes considered was 12, corresponding to effective modal masses of 98.023% and 95.754% along the x and y directions, respectively. Table 7 shows the dynamic characteristics of the structure. For each mode shape, the effective modal masses in both directions are reported. Furthermore, the first three mode shapes are shown in Figure 8.

5. Structural Vulnerability

In the present section, the results of the structural verification are reported for the steel structures and RC walls. In the case of only gravitational loads, the values of the internal actions and deformations were evaluated by linear static analysis. Conversely, linear dynamic analyses were performed to evaluate the internal actions under seismic actions both for life safety (SLV) and operational (SLO) limit states. Moreover, for steel members, both an evaluation of internal actions and structural verification were carried out by SAP2000. Conversely, for RC cores, the internal actions were evaluated by SAP2000, while structural verification was carried out by the post-processor VIS15 [24] using the plugin SPF (Seismic Performance Finder).
The structure was revealed to have barely any criticalities under gravitational loads. Regarding the reinforced concrete elements, verification was carried out according to Section 4.1.2.3 of NTC 2018 [10]. The structure does not present any structural criticality under gravitational loads. Regarding the reinforced concrete elements, verification was carried out according to Section 4.1.2.3 of NTC 2018 [10]. Two failure mechanisms were revealed: (1) combined bending and axial force (FF), and (2) shear failure (SF_w). The whole section of the RC cores was verified under combined bending and compression action, while the shear failure was evaluated for each core wall. The numerical results in terms of the demand-to-capacity ratio (D/C) are reported in Table 8. The work rate of the RC cores under combined bending and axial action is shown in Figure 9a.
For the steel elements, structural verification was performed in terms of resistance, stability and deformation. The ultimate resistance of steel members was evaluated according to Section 4.2.4.1 of NTC 2018 [10]. The columns (HEB 260) were verified according to the combined bending–compression action and the buckling resistance under an axial load (N). The beams (IPE 240, HEA 260) were verified against flexural failure (FF) and shear failure (SF) and based on their lateral torsional stability (LT). Moreover, for a simply supported beam, the maximum displacement at the mid-span was computed to check the vertical deflections, according to Section 4.2.4.2.1 of NTC 2018 [10]. The deflection limitation was largely satisfied. Based on ULS, the main numerical results in terms of demand-to-capacity ratio (D/C) are reported in Table 9, while the work rate of steel members is shown in Figure 9b. When reviewing the numerical results, it is possible to conclude that, under gravitational loads alone, there are barely any structural criticalities. Only one column of the central portion of the first story should be strengthened, for which the value of the demand-to-capacity ratio slightly exceeds 1.00 (1.056).
Structural verification under seismic action was performed based on the elastic response spectra reported in Section 4.1. Seismic analyses were carried out by preliminarily identifying ductile and brittle mechanisms. In the case of the ductile mechanisms such as the flexural behavior of the RC cores, the design spectra were obtained by dividing the elastic spectrum by the behavior factor q = 3.00 . Conversely, in the case of brittle mechanisms such as the shear failure of RC cores, the seismic actions were defined by reducing the elastic spectrum by a behavior factor q = 1.50 . Moreover, evaluation of the maximum inter-story drift was carried out using q = 1.00 for the relevant spectrum. Reference is made to Section 7.3 of NTC2018.
For the structural typology under investigation, the failure of steel members can be considered a brittle mechanism. Therefore, for such members, a behavior factor q = 1.50 was used. However, all the safety checks concerning the columns were satisfied, and the demand-to-capacity ratios were less severe than those occurring under the gravitational load combinations. For these reasons, the results are not reported in the manuscript. Figure 10 shows two significant views of the obtained results. In particular, Figure 10a reports the demand-to-capacity ratios of the RC cores under bending and axial actions, while Figure 10b refers to shear actions.
The seismic performance indices ( ζ E ) were defined according to the following relationship:
ζ E = PGA C . LS PGA D . LS
where PGA C . LS is the value of the peak ground acceleration corresponding to the achievement of a specific limit state (capacity), while PGA D . LS is the value of the peak ground acceleration for the specific limit state (demand). Their numerical values are shown in Table 10 for each considered limit state.
For the SLO limit state, the performance indices were evaluated based on the maximum inter-story drift (D). Conversely, in the case of the SLV and SLD limit states, the performance indices were computed for combined bending and compression actions of the RC cores (FF) and the shear failure of each RC wall (SF_w). When reviewing the numerical results, it can be noted that the main failure mechanisms are related to the resistance of the RC cores, in particular, the shear behavior of the concrete walls dominates. When comparing these results with those provided in [17], some differences can be noted. In particular, the numerical values provided in Table 10 are lower than those presented in Table 1. The reasons are mainly related to the different seismic analysis procedures employed to evaluate the structural vulnerability of the building.

6. Retrofitting Interventions

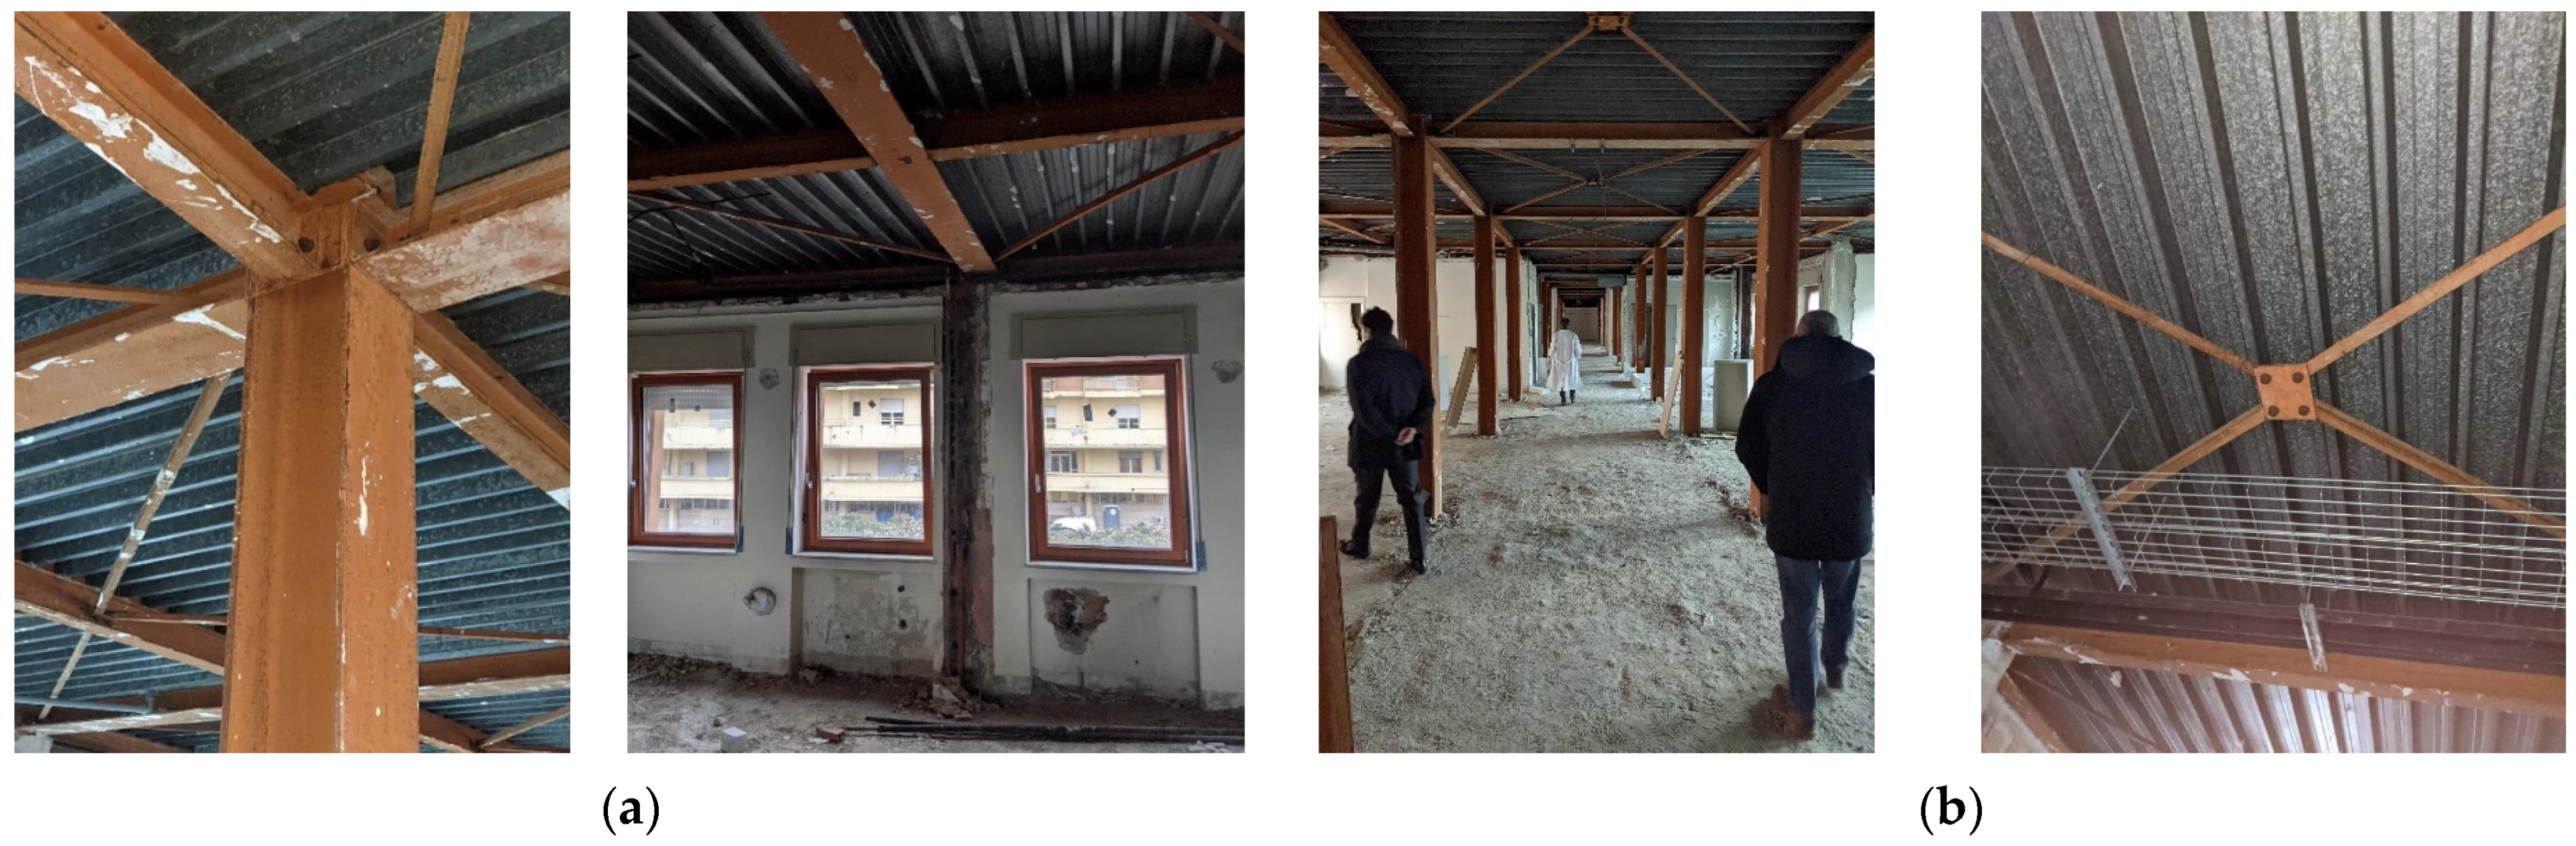
6.1. General Considerations

Seismic analyses showed that the main structural criticalities are related to the concrete cores, which could be subject to structural damage after strong earthquakes. The shear failure of the concrete walls, constituting the RC cores, dominates. Accordingly, structural interventions should be devoted to strengthening the RC cores or reducing the horizontal actions absorbed by the cores through the introduction of bracing elements in the steel frames. However, through numerical analyses, it was possible to conclude that the introduction of bracing elements does not represent a convenient intervention. The reason for this is the very high lateral stiffness of the RC cores. To decrease the seismic actions that the cores have to withstand, it would be necessary to introduce many steel braces characterized by heavy cross-sections. In addition, all the foundations of the original pendular system would need to be retrofitted, corresponding to very invasive interventions. Moreover, the need to work on all the facades would significantly disrupt medical activities. So, structural interventions aimed at reducing the shear actions of the RC cores were neglected for structural, architectural, functional and financial reasons.
Considering that all structural interventions should be designed to ensure the continuous operation of medical activities within the building, the proposed interventions to retrofit the Day-Hospital Building are focused on the strengthening the reinforced concrete cores, which can be carried out in successive steps. The goal can be achieved through two structural interventions: (1) thickening the existing RC walls, and (2) steel jacketing the RC cores. According to Sections 8.4.2 and 8.4.3 of NTC2018 [10], these structural interventions were investigated for two safety levels: ζ E 0.60 and ζ E 1.00 . In the following sections, structural proposals are presented, highlighting construction and cost details.

6.2. Intervention 1 (I1): Increasing the Thickness of the Concrete Walls

The first intervention consists of concrete jacketing the walls of the RC cores, as shown in Figure 11. The external and internal thickness of the RC jacket is 10 cm. The additional longitudinal rebars were identified as suitable to increase the flexural resistance of the RC cores, while the horizontal bars were designed to improve the shear resistance of the RC cores. The diameter used for the vertical and horizontal rebars is 20 mm and the spacing ranges from 10 to 50 cm. It is important to underline that if ζ E 0.60 is accepted, the intervention involves only one side of the existing walls. Conversely, two sides are involved if ζ E 1.00 is desired. Table 11 and Table 12 report the details of the rebars along the two directions for the two levels of seismic upgrading. As an example, label ∅20/15 indicates the diameter (20 mm) and the spacing (15 cm).
The post-intervention flexural and shear resistance computed for the reinforced elements was reduced by the 10% according to Section C8.7.4.2.1 of Circular n.7 of 21 January 2019 [11].
The vulnerability analysis was performed according to the assumptions presented in Section C8.7.4.2.1. In particular, the following design hypotheses were considered: (1) full bond between the new and existing concrete walls; (2) the permanent loads act only on the existing portions; and (3) the mechanical properties of the reinforced concrete are extended to the new RC walls.
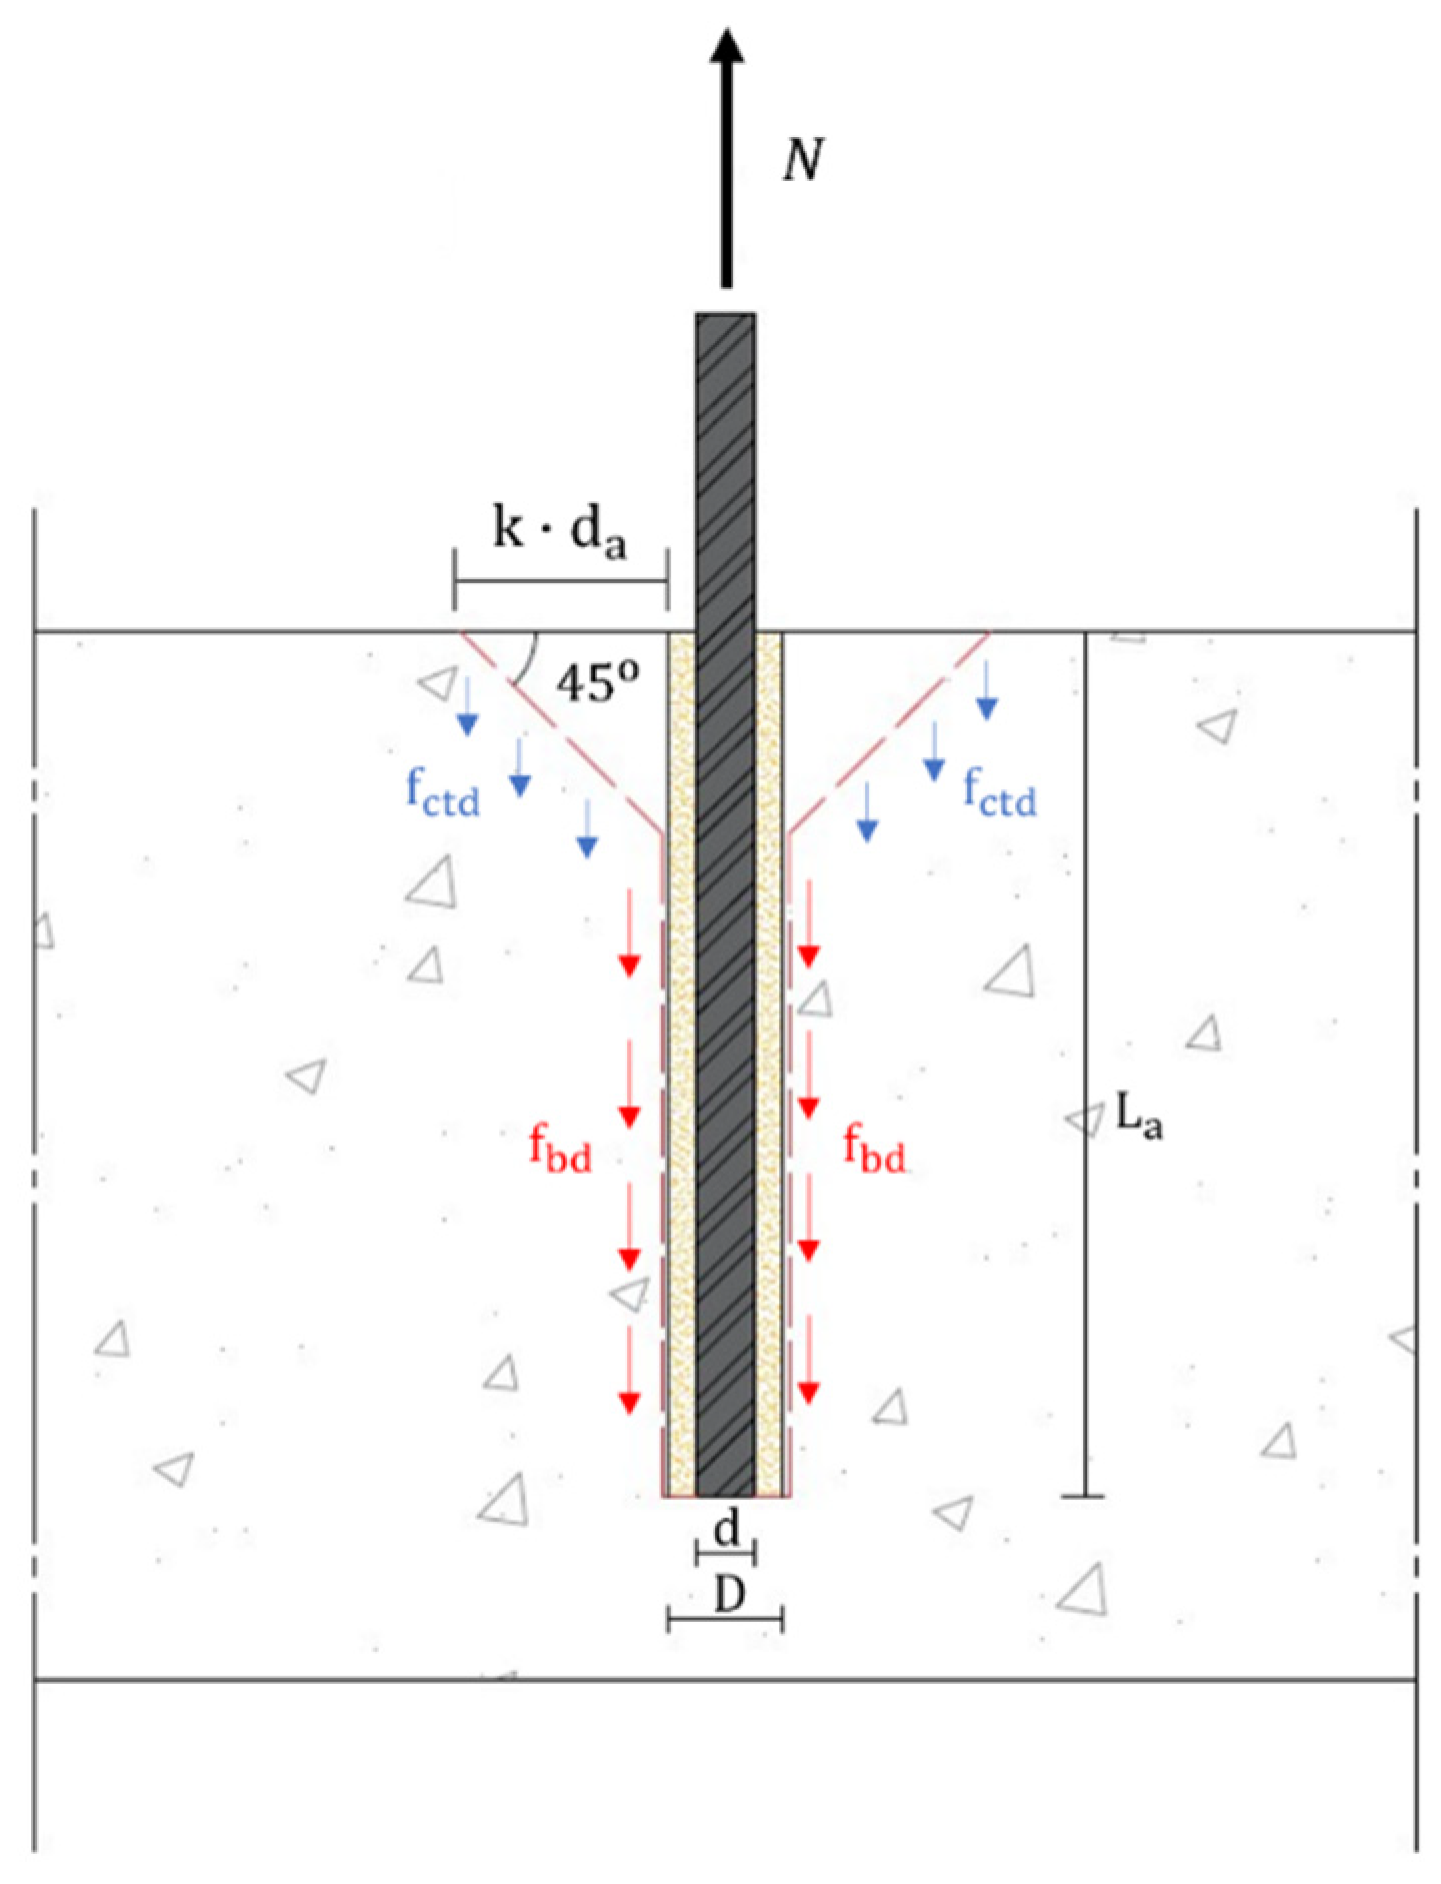
Regarding the connection between the new RC walls and the existing foundations, an epoxy resin was adopted as an anchor between the steel bars and the concrete with a design bond resistance ( f bd . anc ) of 7.95 MPa. The anchor length of the steel bars was evaluated according to the following collapse mechanisms [25]: (1) yielding of the steel bar ( N 1 ); (2) radial collapse of the resin ( N 2 ); and (3) pull-out mechanism of the steel bar ( N 3 ). According to Figure 12, the following results:
N 1 = π d 2 4 f yd                                                                                         N 2 = f bd . anc π dL a N 3 = π D ( L a kd a ) f bd + 4.44 f ctd kd a ( kd a + D )
where f yd   is the yield stress of the rebar; d is the diameter of the rebar; f bd is the design bond resistance between the epoxy resin and existing concrete, which is 2.33 MPa; f ctd is the design tension resistance of the existing concrete of 1.03 MPa; D is the total diameter, which includes the steel bar and the epoxy resin; d a is the maximum diameter of the concrete aggregates; and L a is the anchor length of the steel bar. Finally, k is an experimental coefficient ranging from 1.00 to 3.00 [25]. The value of k is assumed to be 1.00 to err on the safe side. Regarding the vulnerability analyses, the numerical results for the seismic performance indices are reported in Section 7. They were obtained for two safety levels and based on the life safety limit state (SLV).

6.3. Intervention 2 (I2): Steel Jacketing

The second intervention consists of adding steel jacketing in the form of steel plates and/or steel strips to the walls of the RC cores. This retrofitting technique is commonly used for the strengthening of RC columns and walls. In the technical literature, there are works in support of this retrofitting strategy [22,23,24,25,26,27,28,29]. It is interesting that previous studies demonstrated the beneficial effects in terms of resistance and ductility compared to other structural solutions and highlighted that the reinforcement by steel plates produces self-centering shear walls. Another important benefit is the improvement of the load-bearing resistance due to confinement effects, as described in [30]. The advantages of this solution can be summarized as follows:
  • Increased shear resistance.
  • Increased deformation capacity.
  • Increased vertical load-bearing capacity (confinement effect).
However, this retrofitting technique is usually employed to strengthen columns and walls; to the best of the authors’ knowledge, no specific studies concerning the strengthening of RC cores are available. In particular, some technical problems arise when the interaction with the structural elements constituting the stairs is considered in the case of cores used for staircases.
In this case, the structural solution was designed for two different safety levels: ζ E 0.60 and ζ E 1.00 . In the first case, the intervention was characterized by the application of steel angles to the corners and battens, while a combined solution using continuous steel plates and steel strips was adopted in the second case. The minimum thickness of the steel elements was determined according to the following relationship:
V j = 0.5 2 t w s b   f yk 0.9 dcot ϑ
This formula was reported in Section C8.7.4.2.2 of Circular n.7 of 21 January 2019 [11] and it allowed us to determine the additional shear resistance of the steel plates. ϑ represents the angle of the shear crack in the concrete wall (45°); d is the effective depth of the single concrete wall; b / s is the width-to-spacing ratio of the horizontal strips (1.00 in the case of continuous steel plates); f yk is the yield stress of the steel grade (S275); and t w is the thickness of the steel elements. The required value for the additional resistance due to the steel jacketing was obtained as V j = Δ V Ed , with Δ V Ed being the difference between the shear action in the seismic condition ( V Ed ) and the shear resistance of the original concrete wall ( V Rd . w ). Consequently, Equation (4) can be rearranged as:
t w = 1.11 s b Δ V Ed f yk d
In the case of continuous steel plates, the minimum thickness t w is 10 mm, while the thickness of the horizontal strips ranges from 5 to 20 mm with 0.10 b / s 0.16 . The spacing and the diameter of the threaded bars connecting the plate elements to the RC walls were determined to account for the buckling resistance under pure shear action. This buckling resistance was preliminarily evaluated by a FEM model of a square plate simply supported at the four corners and subjected to pure shear membrane forces. The minimum value of the spacing was 250 mm, while 8.8 class threaded bars (M16 or M24, as needed) were adopted for the steel connectors. 
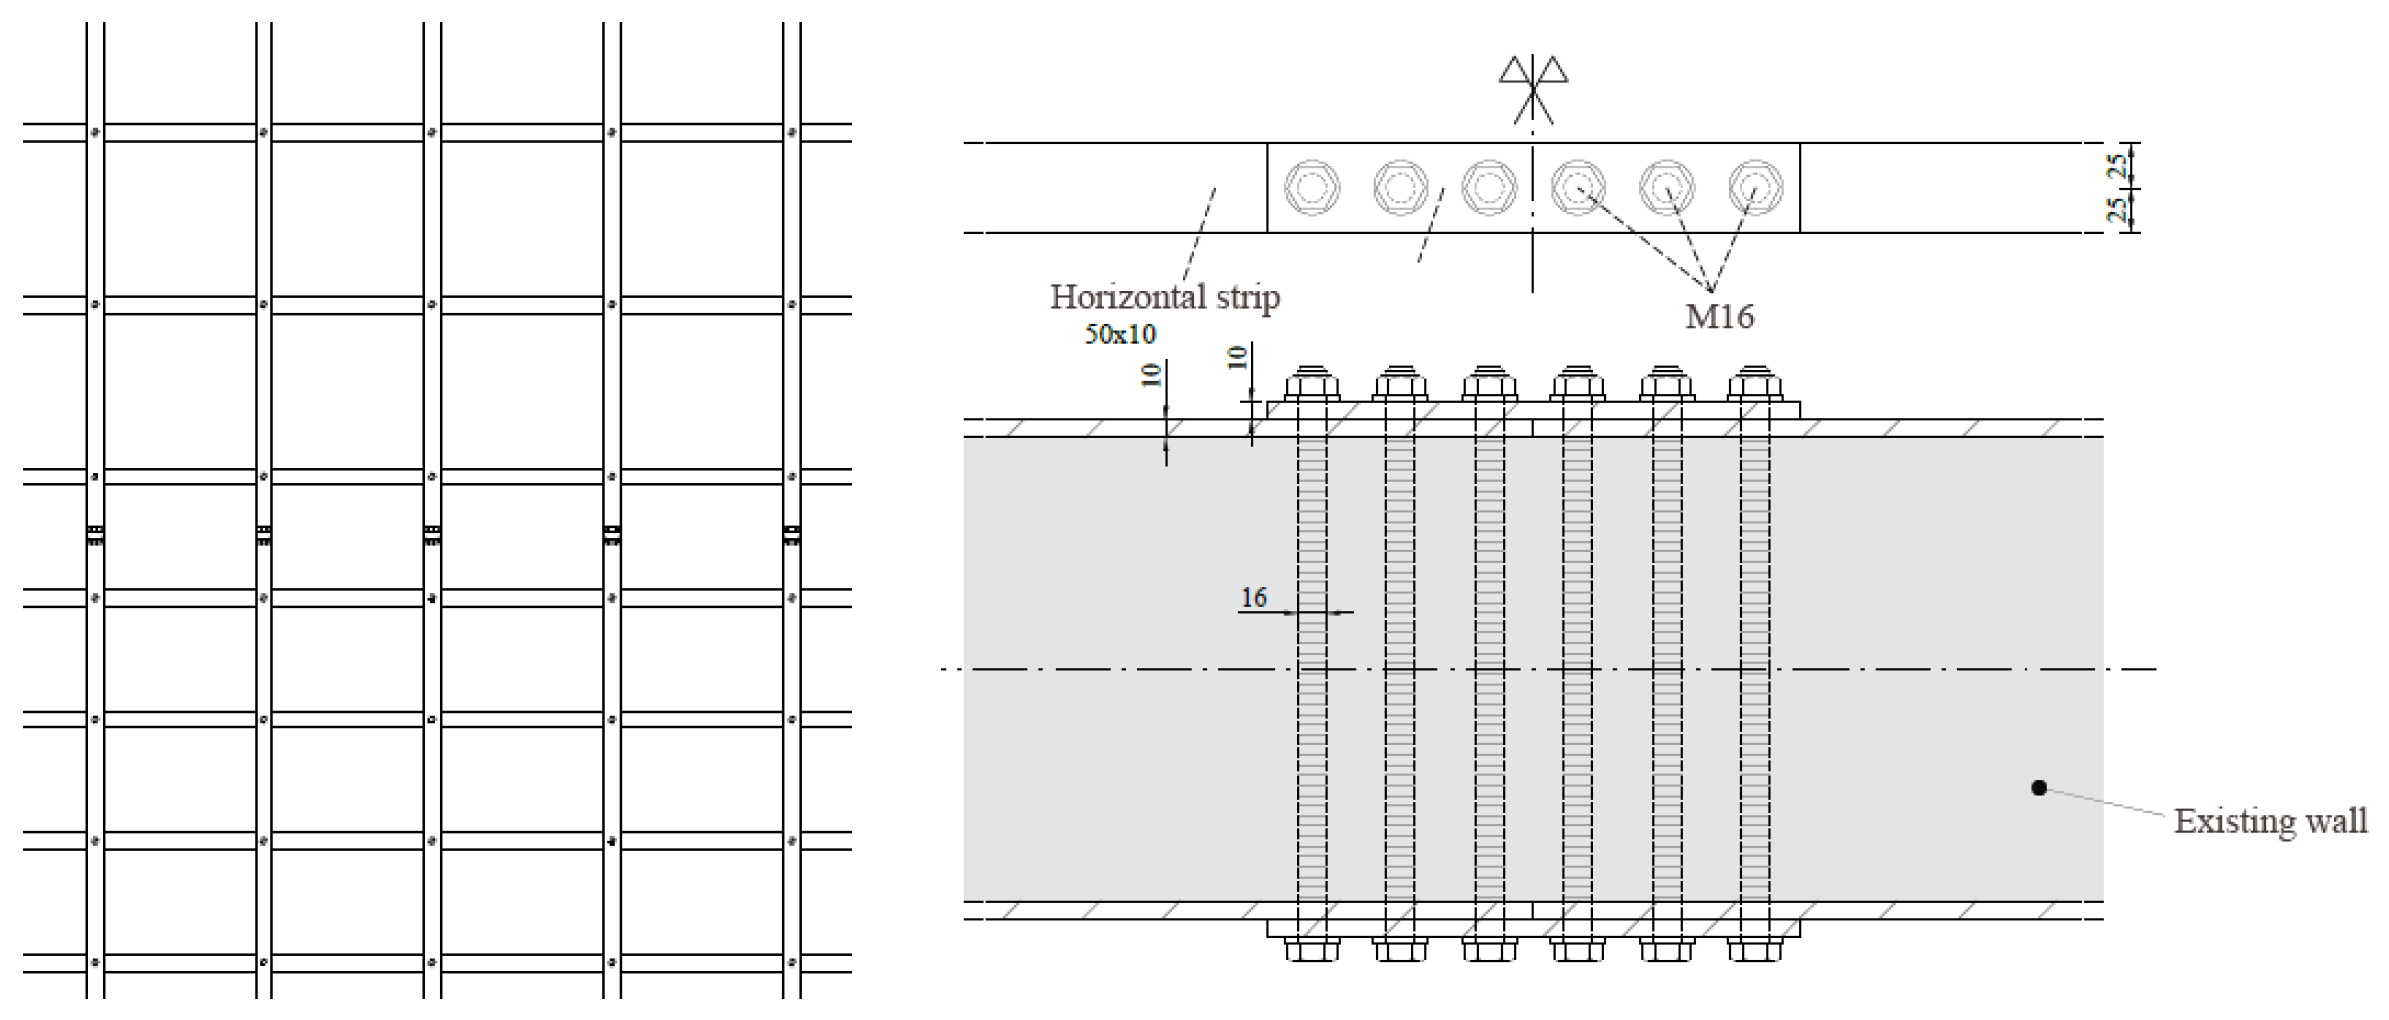
Figure 13 shows the construction detail for the application of the continuous steel plate to the concrete wall. For single RC cores and for each story level, Table 13 reports information on the adopted steel plates and the horizontal strips in the case of total retrofitting ( ζ E 1.00 ). Conversely, if a partial retrofitting is accepted ( ζ E 0.60 ), for the cases reported in Figure 14, information on the structural detail is given in Table 14. Vertical steel angles 260 × 260 × 10 created by welding are located at the corners, while the vertical strips overlap the horizontal battens, connected by means of threaded bars, as shown in Figure 15.
The increase in the concrete compression resistance due to the confinement effect was evaluated according to the following relationship [11,30]:
f cc = f c [ 1 + 3.7 ( 0.5 α n α s ρ s f y f c ) 0.86 ]
where f c is the cylindrical resistance of the concrete material, ρ s is the volumetric ratio of transverse reinforcement, f y is the yield stress of the steel confining material and α n and α s are coefficients accounting for the efficiency of the confinement [30]. In this case, the numerical results for seismic performance indices are summarized in Section 7 for the life safety limit state. To transmit the shear seismic actions to the foundation, particular attention was focused on the connection of the new structural elements to the existing foundation. The anchor bolts, constituted by threaded bars, are subject to combined tension and shear. Their number was determined, for each RC core, according to Section 4.2.8.1.1 of NTC2018 [10]. In particular, the spacing between the anchor bolts is 140 mm, while the distance from the edge of the foundation plate is 50 mm. The anchor lengths were obtained as already described in Section 6.3 for structural intervention 1. The thickness of the base plates is 10 mm, with stiffening ribs with a depth of 120 mm. The main properties of the anchor bolts are reported in Table 15, while the constructional detail of the base connection to the existing foundation is shown in Figure 16.
Finally, the base sections of each RC core were verified to combined biaxial bending moments and compression by means of the software PresFle+ [31], which allowed us to consider different materials. The yield stress of the existing rebars was 434.70 MPa, as reported in Section 3.2, while an equivalent resistance was considered for the anchor bolts to account for the contemporary action of the shear force. This was determined using the following equation:
f ub ( eq ) = 1.01 f ub [ 1 Δ V Ed n b F v . Rd ]
where f ub is the ultimate resistance of the single bolt (in this case, it is 800 MPa); n b is the number of the anchor bolts for each RC core; F v . Rd represents the shear resistance of the single anchor bolt, as reported in Section 4.2.8.1 of NTC2018; and Δ V Ed is the additional shear resistance required for the core.

7. Comparison of Retrofitting Interventions

In this section, a comparison of the retrofitting interventions is provided in terms of structural performance and financial and environmental costs. The four interventions are labeled as follows: “I1-1” and “I1-2” in the case of increasing the thickness of concrete walls for ζ E 0.60 and ζ E 1.00 , respectively; “I2-1” and “I2-2” in the case of steel jacketing the RC cores for ζ E 0.60 and ζ E 1.00 , respectively. From the structural point of view, the performance indices obtained by the different interventions are summarized in Table 16. According to the dominating failure modes identified by the vulnerability assessment presented in Section 6, attention was focused on the shear failure of the concrete walls (SF_w) and the flexural failure of the whole RC cores (FF). For each intervention, the performance index is provided as the minimum value between the FF criterion and SF_w failure mode. It is evident that in all the interventions, except the last one, the dominant collapse mechanism is always related to the shear failure of the cores’ concrete walls.
The cost estimations were based on the price list of the Campania region. The costs for the structural design and finishes are not included. Table 17 reports a summary of the costs for each retrofitting intervention. The costs for intervention 2 ( ζ E 1.00 ) are higher than those for intervention 1 ( ζ E 0.60 ). The cost of intervention I2-1 is approximately 14% higher than that of I1-1, while the cost of intervention I2-2 is about 18% higher than that of I1-2.
Regarding the environmental impact of these structural interventions, an assessment was carried out in terms of CO 2 emissions. According to the life cycle impact assessment (LCA) [32], only the production stage (named “cradle to gate”) were considered. Three sources of CO 2 emissions were considered: raw material supply (A1), transport (A2) and manufacturing (A3). For the production stage, the global warming potential parameter (GWP) was derived from environmental product declarations (EPDs). This parameter expresses the amount of CO 2 emitted per ton of material. The values of the GWP parameter considered in this work are reported in Table 18. The manufacturers that provided the EPDs are indicated in [33,34,35,36]. The total values of CO 2 emissions for each intervention are reported in Table 18. It is interesting to observe that the interventions based on the use of steel plates (I2-1, I2-2) provide a reduction in the CO 2 emissions of about 70% more compared to the interventions using reinforced concrete (I1-1, I1-2). Figure 17 shows a summary of the results for our comparison of the proposed retrofitting interventions in terms of structural performance, financial costs and environmental impact. When comparing the interventions I1-1 and I2-1, no significant differences are expected for CO 2 emissions, whose values are very high, especially in the case of intervention I1-1. Meanwhile, in the case of safety level ζ E 1.00 , intervention I1-2 is economically more advantageous than intervention I2-2, but it is less environmentally sound.

8. Conclusions

This work was aimed at studying the seismic vulnerability and identifying the possible retrofitting interventions for the Day-Hospital Building of the cancer institute “G. Pascale Foundation” in Naples, which is one of the most important hospitals in South Italy. After a brief architectural and structural description, the vulnerability of the Day-Hospital Building was evaluated for different gravitational and seismic load combinations using static and dynamic linear analyses, respectively.
As for most existing buildings, the verification of different gravitational load combinations did not exhibit high criticality. Conversely, the seismic analyses showed important structural criticalities. In particular, the concrete walls constituting the RC cores are subject to a shear failure mechanism with a seismic performance index of only about 10%, thus highlighting high vulnerability and an unacceptable seismic risk given the strategic function of the building in an emergency. Therefore, the analyses confirmed the criticalities already pointed out in [17] and the need to identify effective intervention strategies for the building’s retrofitting. It is worth mentioning that the main structural criticalities are related to the shear failure of the RC walls, with a vulnerability index of 9%. This value is about 60% lower than that calculated in [17].
This confirms that, in this specific case, as a result of neglecting the plasticization capacity of RC walls, the linear dynamic analysis produces more severe findings than the non-linear static analysis.
Then, our attention was focused on the design of structural interventions to retrofit the whole building. In this case, the construction of new RC walls or steel bracing systems was neglected for two main reasons: (1) improvement of the stiffness would increase the seismic actions, and (2) these structural interventions would disrupt medical activities and affect their continuity.
Instead, we suggest structural solutions to strengthen the reinforced concrete walls of the RC cores. Two types of intervention are proposed: (1) increasing the thickness of the cores’ walls, and (2) strengthening the RC cores with steel jacketing. Such interventions have been selected as the most promising in view of the need to ensure the continuity of the medical activities during the retrofitting. Each solution has been developed according two different safety levels, corresponding to a performance index ζ E greater than or equal to 0.60 or 1.00. The structural performance and the construction details have been described for each retrofitting intervention. Subsequently, the financial costs and the environmental impact have been evaluated and a final comparison has been provided between the different solutions. Cost estimation has been performed only for the structural interventions, neglecting the costs related to the structural design and the finishes. The environmental impact has been evaluated in terms of CO2 emissions according to only the production stage, i.e., “cradle to gate”. When comparing the structural solutions, it is evident that intervention 2 (I2-1) is more convenient than intervention 1 (I1-1) for a performance index ζ E 0.60 , i.e., intervention 2 (I2-1) has a smaller environmental impact value with the same structural performance and there is little difference in terms of financial costs. Meanwhile, in the case where ζ E 1.00 , corresponding to complete seismic upgrading, the choice is more complex because the financial costs of intervention 2 (I2-2) are greater than those of intervention 1 (I1-2) by about 18%, while the environmental costs are significantly greater in the case of intervention 1 (I1-2). The final choice, therefore, should mainly be governed by the possibility of minimizing the disruption to medical activities during the retrofitting interventions and by the time required to complete the work. From these perspectives, it seems that the use of steel is most convenient because of the well-known advantages concerning manufacturing, assembling and construction.
In future developments, in order to optimize the structural interventions described, a nonlinear dynamic analysis could be performed considering the geometrical and mechanical non-linearities. In this way, new, innovative structural solutions could be provided by introducing dissipative element systems to the first story.

Author Contributions

Conceptualization, V.P.; methodology, V.P. and R.M., software, A.P., V.P. and E.N.; validation, A.P., V.P., R.M. and E.N.; formal analysis, A.P.; investigation, A.P.; writing—original draft, A.P.; writing—review and editing, V.P. and E.N.; supervision, R.M, E.N. and C.F.; project administration, V.P.; funding acquisition, V.P. All authors have read and agreed to the published version of the manuscript.

Funding

This research was funded by “Istituto Nazionale Tumori—Fondazione Pascale”, grant number 43/2022.

Institutional Review Board Statement

Not applicable.

Informed Consent Statement

Not applicable.

Conflicts of Interest

The authors state that there are no conflict of interest.

References

  1. Saitta, P.; Clemente, P.; Buffarini, G.; Bongiovanni, G. Vulnerability Analysis and Seismic Retrofit of a Strategic Building. J. Perform. Constr. Fac. 2017, 31, 1–14. [Google Scholar] [CrossRef]
  2. Gentile, R.; Galasso, C.; Idris, Y.; Rusydy, I.; Meilianda, E. From rapid visual survey to multi-hazard risk prioritisation and numerical fragility of school buildings. Nat. Hazards Earth Syst. Sci. 2019, 19, 1365–1386. [Google Scholar] [CrossRef] [Green Version]
  3. Carofilis, W.; Perrone, D.; O’Reilly, G.J.; Monteiro, R.; Filiatrault, A. Seismic retrofit of existing school buildings in italy: Performance evaluation and loss estimation. Eng. Struct. 2020, 225, 111243. [Google Scholar] [CrossRef]
  4. Ruggieri, S.; Porco, F.; Uva, G.; Vamvatsikos, D. Two frugal options to assess class fragility and seismic safety for low-rise reinforced concrete school buildings in southern italy. Bull. Earth. Eng. 2021, 19, 1415–1439. [Google Scholar] [CrossRef]
  5. Giordano, N.; De Luca, F.; Sextos, A. Analytical fragility curves for masonry school building portfolios in Nepal. Bull. Earth. Eng. 2021, 19, 1121–1150. [Google Scholar] [CrossRef]
  6. Montuori, R.; Nastri, E.; Piluso, V. Problems of modeling for the analysis of the seismic vulnerability of existing buildings. Ing. Sismica 2019, 36, 53–85. [Google Scholar]
  7. Ordinance of Prime Minister n.3274: First Elements about General Criteria for the Seismic Classification of the National Territory and Technical Codes for Building in Seismic Area. 8 May 2003. Available online: http://zonesismiche.mi.ingv.it/documenti/gazzetta.pdf (accessed on 10 January 2023).
  8. DM 14.01.2008: New Technical Code for Constructions, Ministry of Infrastructures and Transports, 26 February 2008. Available online: https://www.gazzettaufficiale.it/eli/gu/2009/02/26/47/so/27/sg/pdf (accessed on 10 January 2023).
  9. Circular n.617 of 02.02.2009: Instruction for Application of Updating of Technical Codes for Constructions. 26 February 2009. Available online: https://www.gazzettaufficiale.it/eli/id/2009/02/26/09A01318/sg (accessed on 10 January 2023).
  10. DM 17.01.2018: New Technical Code for Constructions, Ministry of Infrastructures and Transports, 20 February 2018. Available online: https://www.gazzettaufficiale.it/eli/gu/2018/02/20/42/so/8/sg/pdf (accessed on 10 January 2023).
  11. Circular n.7 of 21.01.2019: Instruction for Application of Updating of Technical Codes for Constructions. 21 January 2019. Available online: https://sttan.it/norme/NTC2018/NTC2018_Circ_21_01_2019_n7-CS_LL_PP.pdf (accessed on 10 January 2023).
  12. Comité Européen de Normalisation. Design of Structures for Earthquake Resistance—Part 3: Assessment and Retrofitting of Buildings; EN 1998-3 Eurocode 8; European Committee for Standardization: Brussell, Belgium, 2005. [Google Scholar]
  13. Fardis, M.N. Capacity design: Early history. Earthq. Eng. Struct. Dynam. 2018, 47, 2887–2896. [Google Scholar] [CrossRef]
  14. Piluso, V.; Castaldo, P.; Nastri, E.; Pisapia, A. Stochastic approach for theory of plastic mechanism control. AIMETA 2017, 3, 2408–2420. [Google Scholar]
  15. Piluso, V.; Castaldo, P.; Nastri, E.; Pisapia, A. Stochastic theory of plastic mechanism control: Parametric analysis. AIMETA 2017, 3, 2421–2428. [Google Scholar]
  16. Piluso, V.; Pisapia, A.; Castaldo, P.; Nastri, E. Probabilistic Theory of Plastic Mechanism Control for Steel Moment Resisting Frames. Struct. Saf. 2019, 76, 95–107. [Google Scholar] [CrossRef]
  17. Zizi, M.; Bencivenga, P.; Di Lauro, G.; Laezza, G.; Crisci, P.; Frattolillo, C.; De Matteis, G. Seismic Vulnerability Assessment of Existing Italian Hospitals: The Case Study of the National Cancer Institute “G. Pascale Foundation” of Naples. Open Civ. Eng. J. 2021, 15, 182–202. [Google Scholar] [CrossRef]
  18. Fajfar, P.; Gaspersic, P. The N2 method for the seismic damage analysis of rc buildings. Earthq. Eng. Struct. Dynam. 1996, 25, 31–46. [Google Scholar] [CrossRef]
  19. Fajfar, P. Capacity spectrum method based on inelastic demand spectra. Earthq. Eng. Struct. Dynam. 1999, 28, 979–993. [Google Scholar] [CrossRef]
  20. Deliberation of the Regional Council of Lazio n. 766 of 01.08.2003. Seismic new classification of the territory of Lazio Region according to OPCM n.3274, 01 August 2003 First dispositions. Available online: http://85.43.47.149/sped/normativa/Attivit%C3%A0Sismica/DGRL_766_03.pdf (accessed on 10 January 2023).
  21. SAP2000 V.23, Structural and Earthquake Engineering Software. Computer & Structures, Inc. Available online: https://www.csiamerica.com/products/sap2000 (accessed on 10 January 2023).
  22. Goodman, L.E.; Rosenblueth, E.; Newmark, N.M. A seismic Design of Elastic Structures Founded on Firm Ground. Proceeding Am. Soc. Civ. Eng. 1953, 79, 1–27. [Google Scholar]
  23. Wilson, E.L.; Der Kiureghian, A.; Bayo, E.P. A Replacement for the SRSS Method in Seismic Analysis. Earthq. Eng. Struct. Dynam. 1981, 9, 187–194. [Google Scholar] [CrossRef]
  24. VIS 15, Reinforced Concrete Design for SAP2000, ETABS, and CSIBRIDGE, CSI Italia Srl. Available online: https://www.csi-italia.eu/news/4306/ (accessed on 10 January 2023).
  25. Arduini, M.; Nicoletti, A. Ancorante cementizio per tirafondi nel calcestruzzo. Strade ed Autostrade 2015, 5, 1–9. [Google Scholar]
  26. Elnashai, A.S.; Pinho, R. Repair and Retrofitting of rc Walls using Selective Techniques. J. Earth. Eng. 1998, 2, 525–568. [Google Scholar] [CrossRef]
  27. Leonardo Cortes Fuentes, W.; Palermo, D. Modeling of RC Walls Retrofitted with Steel Plates or FRP sheets. J. Strut. Eng. 2012, 138, 602–612. [Google Scholar] [CrossRef]
  28. Feng, N.; Wu, C. Seismic Behavior of Nonductile RC Frame Slotted with Corrugated Steel Plate Shear Walls. Advances in Civil Eng. 2021, 2021, 6653592. [Google Scholar] [CrossRef]
  29. Ozdemir, A.; Kopraman, Y.; Anil, O. Hysteretic behavior of retrofitted RC shear wall with different damage levels by using steel strips. J. Build. Eng. 2021, 44, 103394. [Google Scholar] [CrossRef]
  30. Montuori, R.; Piluso, V. Reinforced concrete columns strengthened with angles and battens subjected to eccentric load. Eng. Struct. 2009, 31, 539–550. [Google Scholar] [CrossRef]
  31. PresFle+, Software di Verifica a presso-Tenso Flessione Deviata, CONCRETE—Structural Engineering Software. 2021. Available online: https://www.concrete.it/prodotti/applicativi/presfle-2/ (accessed on 10 January 2023).
  32. Romano, E.; Cascini, L.; D’Aniello, M.; Portioli, F.; Landolfo, R. A simplified multi-performance approach to life-cycle assessment of steel structures. Struct. 2020, 27, 371–382. [Google Scholar] [CrossRef]
  33. OrganoWood, Environmental Product Declaration of Timber Fromwork, ISO 14025 E EN 15804. Available online: https://organowood.com/ (accessed on 10 January 2023).
  34. Italcement Heidelbergcement Group, Environmental Product Declaration of DURACEM Concrete, ISO 14025 E EN 15804. Available online: https://www.italcementi.it/it/heidelbergcement-group (accessed on 10 January 2023).
  35. Ferreira Valsabbia. Environmental Product Declaration of Steel Deformed Bars for Concrete Reinforcement, ISO 14025 E EN 15804. Available online: https://www.ferriera-valsabbia.com/ (accessed on 10 January 2023).
  36. ArcelorMittal Bauforumstahl e.V., Environmental Product Declaration of Structural Steels: Sections and Plates, ISO 14025 E EN 15804. Available online: https://constructalia.arcelormittal.com/files/EPD_Structural%20Steel%20sections%20and%20plates--983078d108bdfe2230dbcb5133d9017b.pdf (accessed on 10 January 2023).
Figure 1. General plan of the institute “G. Pascale Foundation” (a) with its satellite view (b).
Applsci 13 01663 g001
Figure 2. External photos of the Day-Hospital Building.
Applsci 13 01663 g002
Figure 3. Left half of the carpentry plan of the Day-Hospital Building.
Applsci 13 01663 g003
Figure 4. Construction details: bolted connections between columns and beams (a); horizontal concentrically bracing system (b).
Applsci 13 01663 g004
Figure 5. Foundation plan of the Day-Hospital Building.
Applsci 13 01663 g005
Figure 6. Elastic response spectra.
Applsci 13 01663 g006
Figure 7. View of FE model developed in SAP2000 [21].
Applsci 13 01663 g007
Figure 8. The first three mode shapes of the structure.
Applsci 13 01663 g008aApplsci 13 01663 g008b
Figure 9. Demand-to-capacity ratios for the cores under combined bending and axial force (a). Work rates of the steel members under combined bending and axial force (b).
Applsci 13 01663 g009
Figure 10. Demand-to-capacity ratios of the RC cores: (a) under bending and axial actions, (b) under shear actions.
Applsci 13 01663 g010
Figure 11. Construction details of the reinforced concrete jacketing. (1) Existing RC wall; (2) Rebars of the RC jacketing; (3) New concrete; (4) Detail of connection be-tween the new concrete walls and the existing foundation; (5) Existing foundation.
Applsci 13 01663 g011
Figure 12. Structural scheme for determining the anchor length.
Applsci 13 01663 g012
Figure 13. Structural detail of the continuous steel plate reinforcement.
Applsci 13 01663 g013
Figure 14. Geometry of RC cores.
Applsci 13 01663 g014
Figure 15. Structural detail of the horizontal steel strips applied to the concrete wall.
Applsci 13 01663 g015
Figure 16. Construction detail of the connection to the foundation. (1) Existing RC wall; (2) Steel plates; (3) M16 bolts; (4) Stiffening plate with height of 120 mm; (5) Anchor bolts (M20 or M24); (6) Existing foundation.
Applsci 13 01663 g016
Figure 17. Summary of the comparison of the proposed interventions.
Applsci 13 01663 g017
Table 1. Seismic performance indices for the DB building.
BuildingLSCriterion P G A   [g]TR [Year] I R ( P G A )   [%] I R ( T R )   [%]
DBSLOD0.0935595.2096.40
SLDD0.136115106.60105.50
SLVSF_w0.0442015.2020.50
Table 2. Mechanical properties of the structural elements.
Structural ElementsDeclared Class/GradeExperimental Results
Steel beams (HEA 260-IPE 240)Fe37 f y m = 327.30   MPa ; f t m = 451.50   MPa
Steel columns (HEB 260)Fe37 f y m = 327.30   MPa ; f t m = 451.50   MPa
Steel bolts and nutsClass 8.8 f y b = 640   MPa ; f u b = 800   MPa
Concrete (RC walls)C 20/25 f c k = 20   MPa ;   R c k = 25   MPa
Steel smooth bars (RC walls)FeB 32k f y m = 434.70   MPa
Table 3. Characteristic values of structural and non-structural dead loads.
Story g 1 k [kN/m2] g 2 k   [kN/m2]
Intermediate story1.843.07
Roofing story5.001.56
Stair landing4.251.74
Table 4. Characteristic values of linearly distributed loads.
Structural Element G 1 k [kN/m] G 2 k [kN/m]
Stair elements4.202.91
Infill masonry (with windows)-6.96
Infill masonry (without windows)-9.94
Table 5. Characteristic values of live loads.
Category q k   [kN/m2]
Cat. B2—Offices opened to the public3.00
Cat. B—Staircases4.00
Cat. C2—Waiting rooms4.00
Cat. C3—Entrance halls5.00
Cat. H—Roofing accessible only for maintenance and repair 0.50
Table 6. Main parameters of the seismic hazard based on the limit states.
Limit State P V R   [%] T R [Years] a g   [ g ] F o [ ] T C *   [ s ]
SLO81%600.0652.3300.317
SLD63%1010.0852.3280.328
SLV10%9490.2102.4330.340
SLC5%19500.2602.5310.341
Table 7. Dynamic characteristics of the structure.
Mode T [s] M X [%] M Y [%]
10.7868.600.00
20.490.0069.76
30.360.400.00
40.250.000.02
50.230.010.00
60.1720.980.00
70.160.100.00
80.110.0018.86
90.090.370.00
100.077.460.00
110.060.007.12
120.040.110.00
Table 8. Main numerical results of RC cores under vertical actions.
RC CoreStoryCriterion D / C
T1+T2 (T1′ + T2′)1stFF0.08
4thSF_w0.13
T3 (T3′)1stFF0.08
5th–7thSF_w0.15
T4 (T4′)1stFF0.11
2nd–4thSF_w0.10
T51stFF0.14
4thSF_w0.18
T6 (T6′)1stFF0.09
2ndSF_w0.20
Table 9. Maximum demand-to-capacity ratios for steel members under gravitational loads.
MemberStorySectionCriterionClass Section D / C
Column1stHEB260N11.056
Beams1stHEA260FF30.997
IPE240FF10.463
HEA260SF30.46
IPE240SF10.22
Table 10. Seismic performance indices.
Limit StateCriterionDemandCapacityζE
[%]
T R   [ Y e a r s ] a g   [ g ] T R   [ Y e a r s ] a g [ g ]
SLOD600.0652590.130200
SLDFF1010.0852360.139163
SF_w1010.085190.02226
SLVFF9490.2102000.11856
SF_w9490.210160.0199
Table 11. Steel reinforcing bars for I1 intervention ( ζ E ≥ 1.00).
DirectionStoryRC Cores
T1 + T2 (T′1 + T′2)T5T3 (T′3)T4 (T′4)T6 (T′6)
Longitudinal
direction
1 20 / 15 20 / 15 20 / 20 20 / 20 20 / 20
2 20 / 15 20 / 15 20 / 35 20 / 35 20 / 35
3 20 / 35 20 / 50 20 / 35 20 / 35 20 / 35
4 20 / 50 20 / 50 20 / 35 20 / 35 20 / 35
5 20 / 50 20 / 50 20 / 35 20 / 35 20 / 35
6 20 / 50 20 / 50 20 / 35 20 / 35 20 / 35
7 20 / 50 20 / 50 20 / 35 20 / 35 20 / 35
8 20 / 50 20 / 50
Transverse
direction
1 20 / 10 20 / 10 20 / 15 20 / 20 20 / 20
2 20 / 10 20 / 10 20 / 15 20 / 35 20 / 35
3 20 / 10 20 / 10 20 / 20 20 / 35 20 / 35
4 20 / 10 20 / 15 20 / 30 20 / 35 20 / 35
5 20 / 10 20 / 15 20 / 35 20 / 35 20 / 35
6 20 / 15 20 / 25 20 / 35 20 / 35 20 / 35
7 20 / 25 20 / 40 20 / 35 20 / 35 20 / 35
8 20 / 50 20 / 50
Table 12. Steel reinforcing bars for I1 intervention ( ζ E ≥ 0.60).
DirectionStoryRC Cores
T1 + T2 (T′1 + T′2)T5T3 (T′3)T4 (T′4)T6 (T′6)
Longitudinal
direction
1 20 / 10 20 / 10 20 / 20 20 / 20 20 / 20
2 20 / 10 20 / 10 20 / 35 20 / 35 20 / 35
3 20 / 20 20 / 20 20 / 35 20 / 35 20 / 35
4 20 / 35 20 / 35 20 / 35 20 / 35 20 / 35
5 20 / 35 20 / 35 20 / 35 20 / 35 20 / 35
6 20 / 35 20 / 35 20 / 35 20 / 35 20 / 35
7 20 / 35 20 / 35 20 / 35 20 / 35 20 / 35
8 20 / 35 20 / 35
Transverse
direction
1 20 / 10 20 / 10 20 / 15 20 / 20 20 / 20
2 20 / 10 20 / 10 20 / 15 20 / 35 20 / 35
3 20 / 10 20 / 10 20 / 20 20 / 35 20 / 35
4 20 / 10 20 / 10 20 / 30 20 / 35 20 / 35
5 20 / 10 20 / 10 20 / 35 20 / 35 20 / 35
6 20 / 10 20 / 15 20 / 35 20 / 35 20 / 35
7 20 / 15 20 / 25 20 / 35 20 / 35 20 / 35
8 20 / 25 20 / 25
Table 13. Disposition of steel plates and strips in I2 ( ζ E 1.00 ).
RC CoreStory Continuous   Steel   Plate   ( t w = 10   m m ) Horizontal Steel Strips
( t w = 10   m m ; b = 50   m m )
T1 + T2 (T1′ + T2′)1x-
2x-
3x-
4x-
5x-
6x-
7x-
8-x ( s = 164   mm )
T3 (T3′)1x-
2-x ( s = 225   mm )
3-x ( s = 257   mm )
4-x (s = 300 mm)
5-x ( s = 360   mm )
6-x ( s = 510   mm )
7--
T4 (T4′)1x-
2-x ( s = 600   mm )
3-x ( s = 720   mm )
4-x ( s = 900   mm )
5-x ( s = 1200   mm )
6--
7--
T51x-
2x-
3x-
4x-
5-x ( s = 103   mm )
6-x ( s = 133   mm )
7-x ( s = 200   mm )
8-x ( s = 450   mm )
T6 (T6′)1x-
2-x ( s = 360   mm )
3-x ( s = 450   mm )
4-x ( s = 514   mm )
5-x ( s = 600   mm )
6--
7--
Table 14. Disposition of the horizontal strips in I2 ( ζ E 0.60 ).
RC CoreStory t w [mm] b [mm] s [mm]
Walls
1234567
T1 + T2 (T1′ + T2′)11510201010101065500
21510202010202065400
315152010155-65400
41515205155-60400
51515205155-50400
6101015510--50400
7101015510--40500
8555----40600
T3 (T3′)15105----50500
25105----50600
35105----30600
45105----30600
5-5-----30600
T4 (T4′)15------50400
25------50400
T51101510----50500
2101510----40400
3101510----40400
4101510----40400
55155----40400
65155----50500
7-5-----50500
T6 (T6′)151055---50600
2-5-----40500
3-5-----40800
Table 15. Main properties of anchor bolts.
RC CoreDiameter-ClassLength [mm]Spacing [mm]
T1 (T’1)M24-8.8980140
T3 (T’3)M20-8.8640140
T4 (T’4)M20-8.8640140
T5M24-8.8980140
T6 (T’6)M20-8.8640140
Table 16. Seismic performance indices for each retrofitting intervention.
InterventionLimit StateCriterion T R [ Y e a r s ] a g   [ g ] ζ E [ % ]
I1-1SLVFF20310.263127
SF_w2540.13062
I2-1SLVFF7540.19191
SF_w2310.12661
I1-2SLVFF20120.262125
SF_w9720.211100
I2-2SLVFF17040.250119
SF_w>25000.378180
Table 17. Summary of the financial costs of each intervention.
I1-1I2-1I1-2I2-2
Total retrofitting cost [€]714,840821,3001,362,6601,608,170
Cos t   per   square   meter   [ / m 2 ]43.7850.2983.4598.48
Table 18. Values of GWP parameter for the product stages.
InterventionStructural
Component
GWP
[t CO2/t]
W
[t]
CO2
[t]
Total CO2 [t]
I1-1Timber1.11 [33]39.6443.91562.30
Concrete0.645 [34] 731.81472.02
Steel bars0.527 [35]87.8746.31
I2-1Steel battens and angles1.13 [36]96.91109.51114.04
Anchors bars1.13 [36]4.014.53
I1-2Timber1.11116.2643.911050.30
Concrete0.6451395.07899.82
Steel Bars0.527126.4766.65
I2-2Steel plates1.13249.00281.38285.91
Anchors bars1.134.014.53
Disclaimer/Publisher’s Note: The statements, opinions and data contained in all publications are solely those of the individual author(s) and contributor(s) and not of MDPI and/or the editor(s). MDPI and/or the editor(s) disclaim responsibility for any injury to people or property resulting from any ideas, methods, instructions or products referred to in the content.

