
Quantifying Opinion Strength: A Neutrosophic Inference System for Smart Sentiment Analysis of Social Media Network


Abstract
:1. Introduction
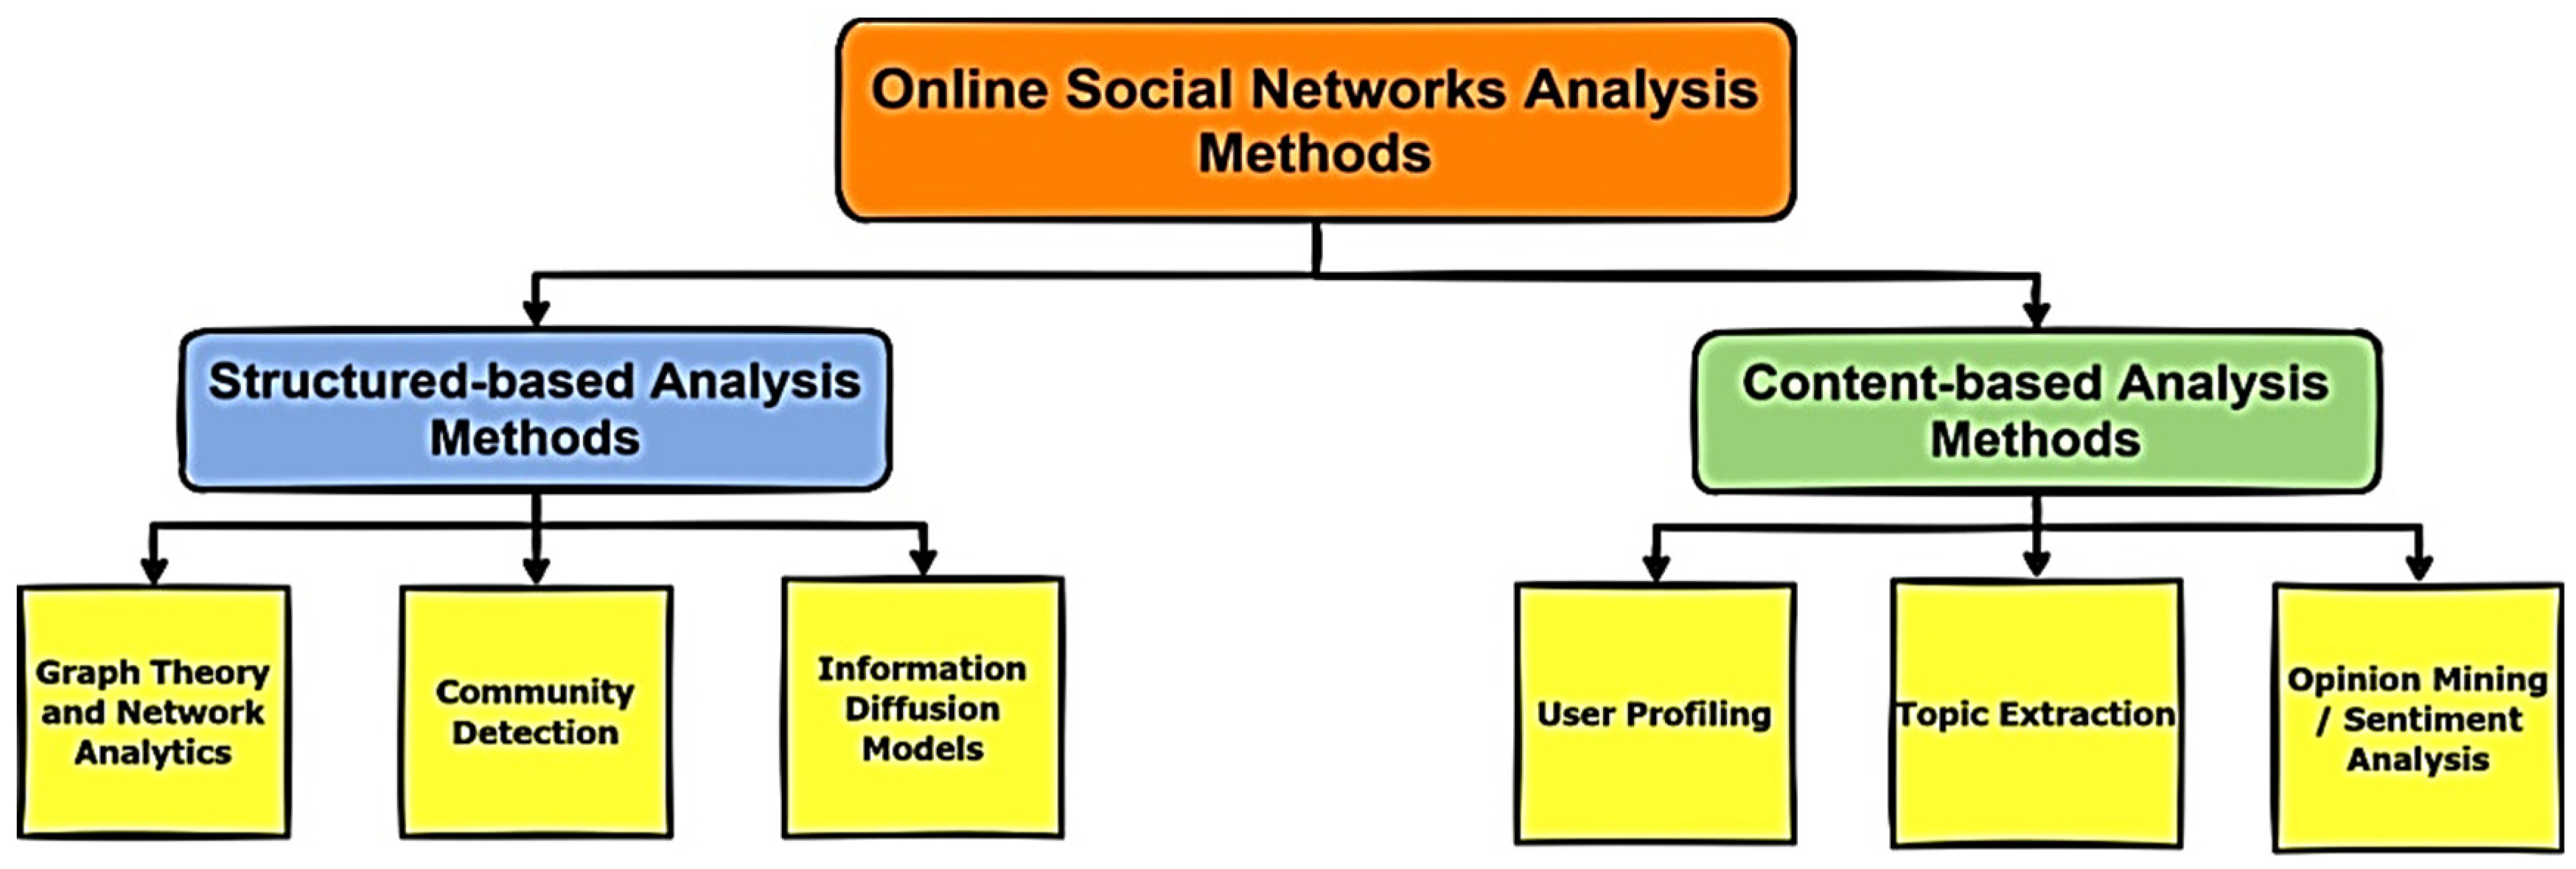
2. Related Work
3. Problem Definition
- -
- The compulsory dependency on low-quality information for the OM process and its reflection on providing invalid results for decision making;
- -
- The scarcity of parallel processing of perspectivism (i.e., users’ credibility) with the main OM process;
- -
- The need for effective ways to determine and numerically represent users’ credibility;
- -
- The inefficient consideration of opinion dynamics in generating a sensitive consensus opinion;
- -
- The continuous need for decreasing ambiguity in opinion texts;
- -
- The absence of a methodical integration between polarity scores and text perspectivism in the process of OM to provide a polarity score that reflects real intentions.
4. Proposed Model
- -
- The proposed model suggests adding a new element (assume: ) to the five elements of opinion, describing the importance of opinion holders and their reactions to their opinions. This element takes into consideration the impact of the opinion holder and his reaction to his opinion on the assigned opinion orientation. Importance weighting should be applied to opinion holders so that they are provided weights based on their authority over the audience. As such, perspectivism can be practically represented in the main OM process;
- -
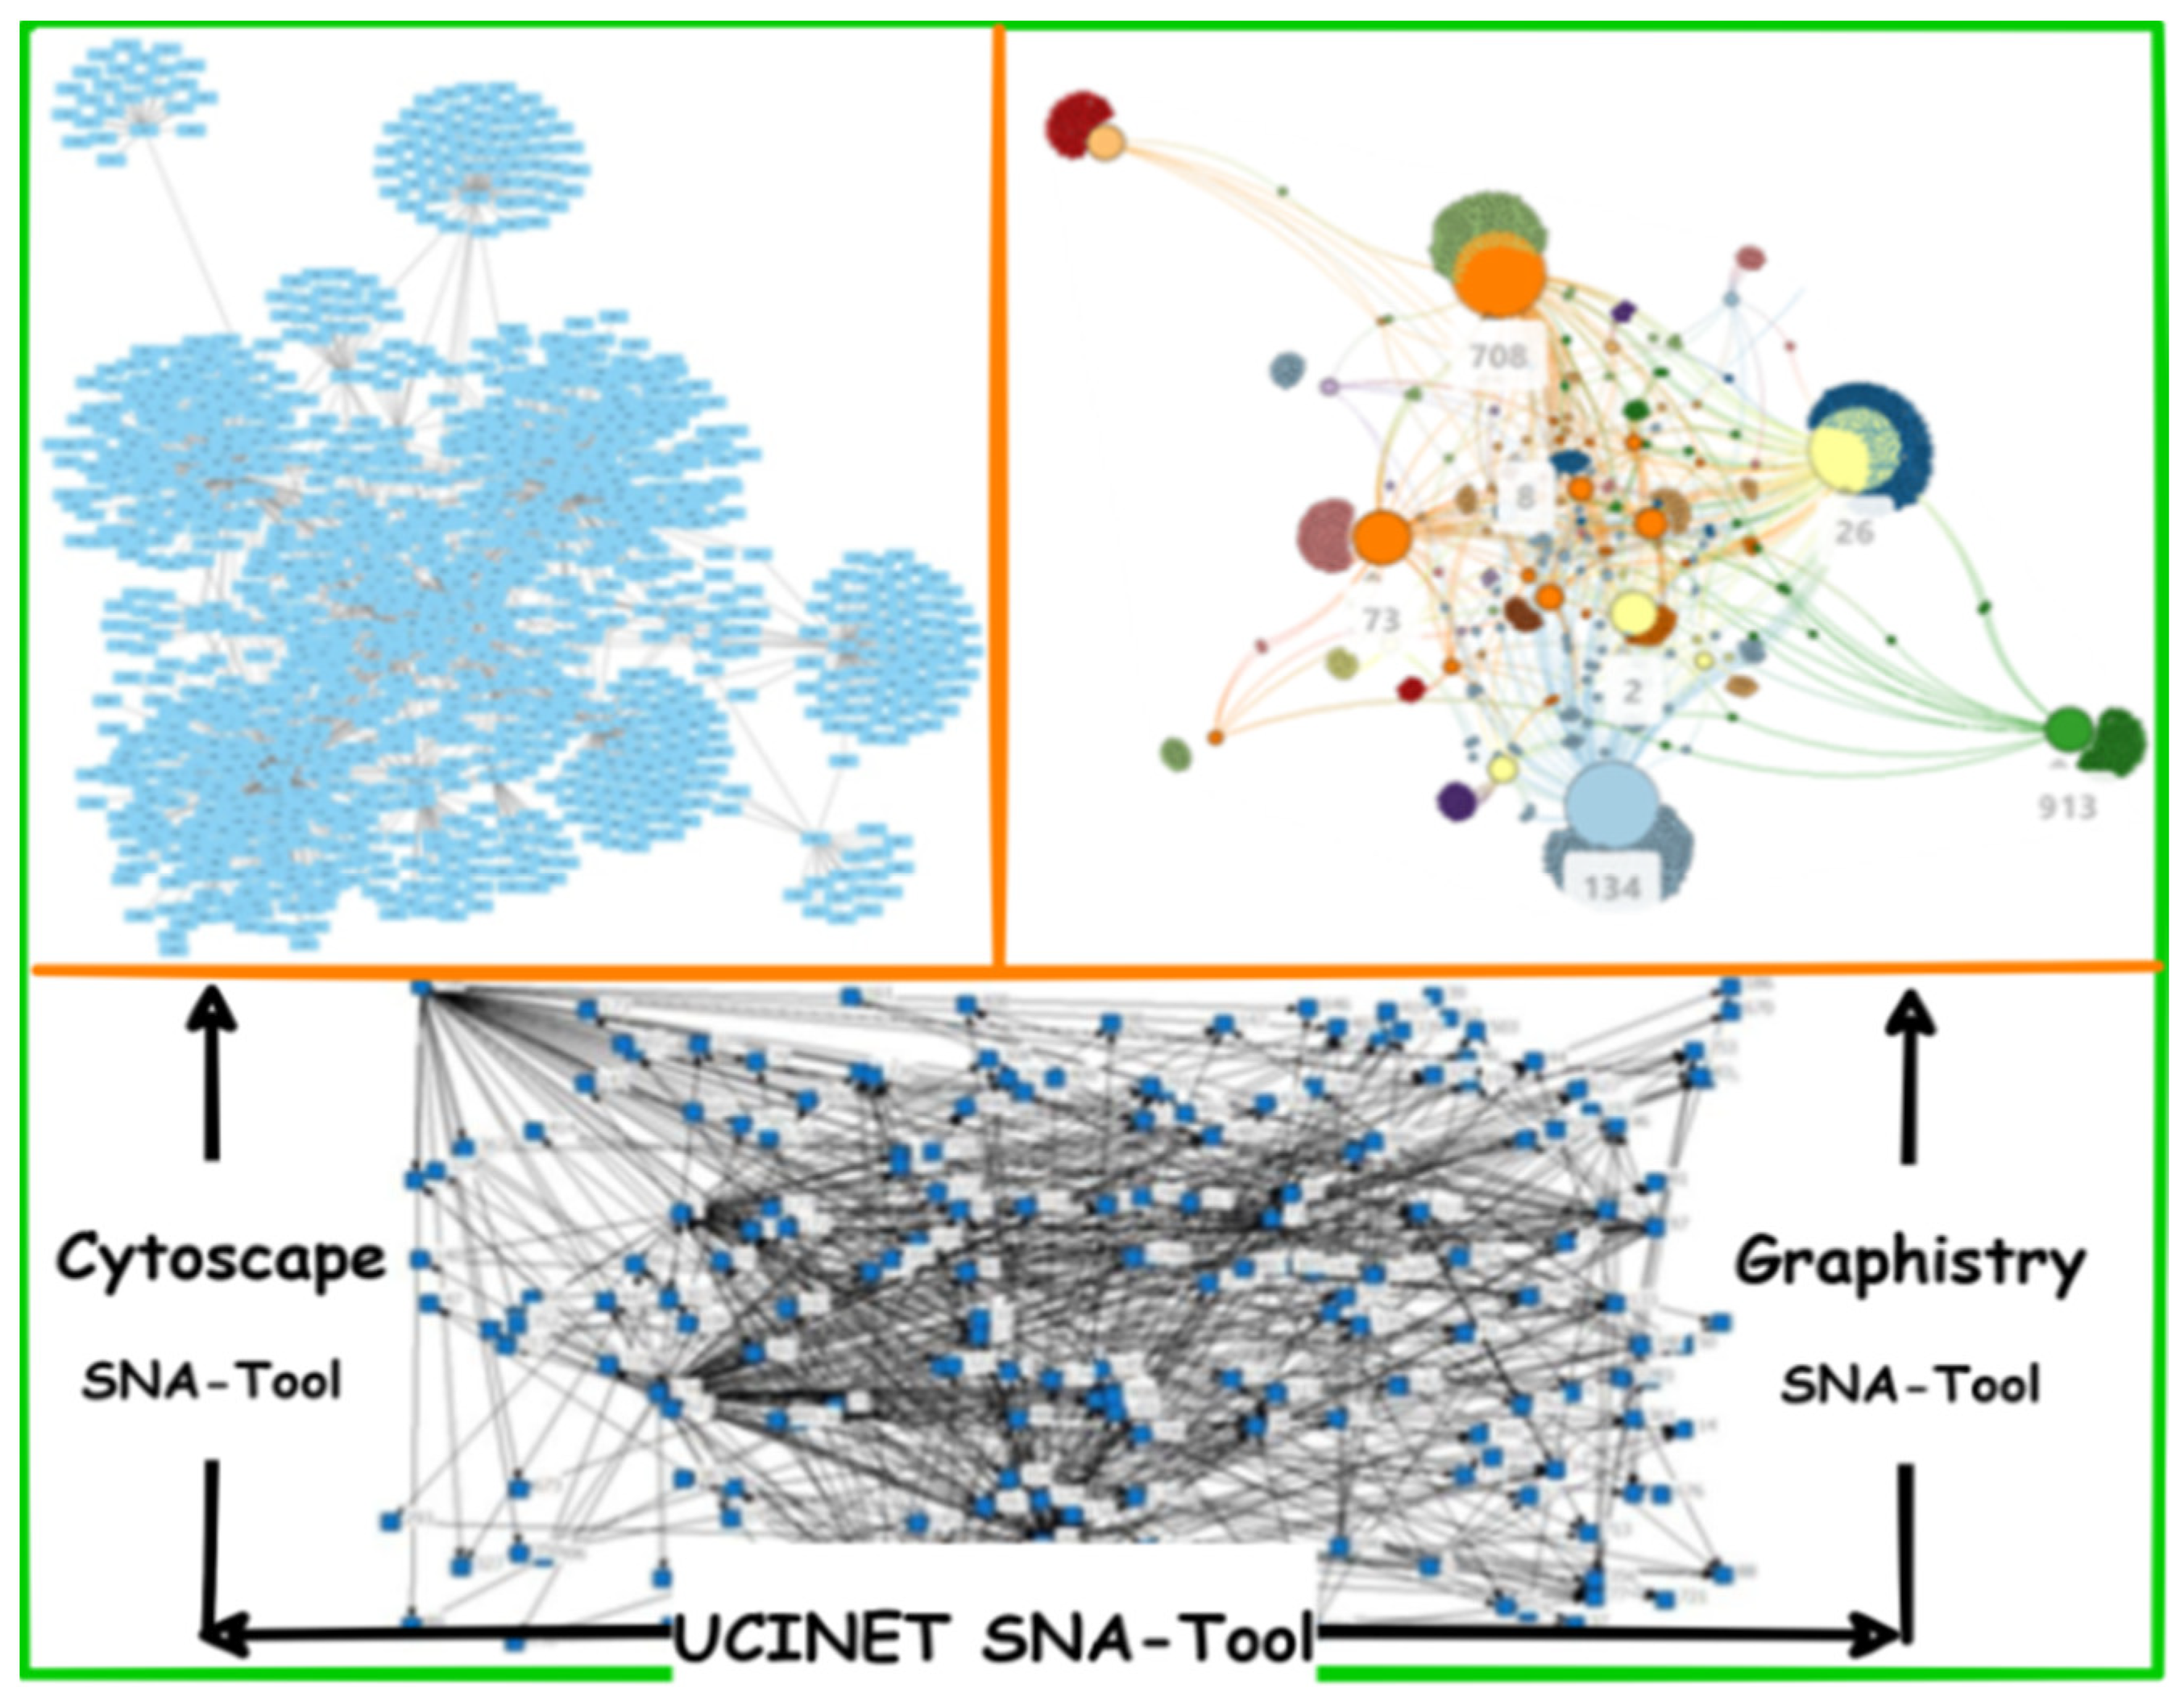
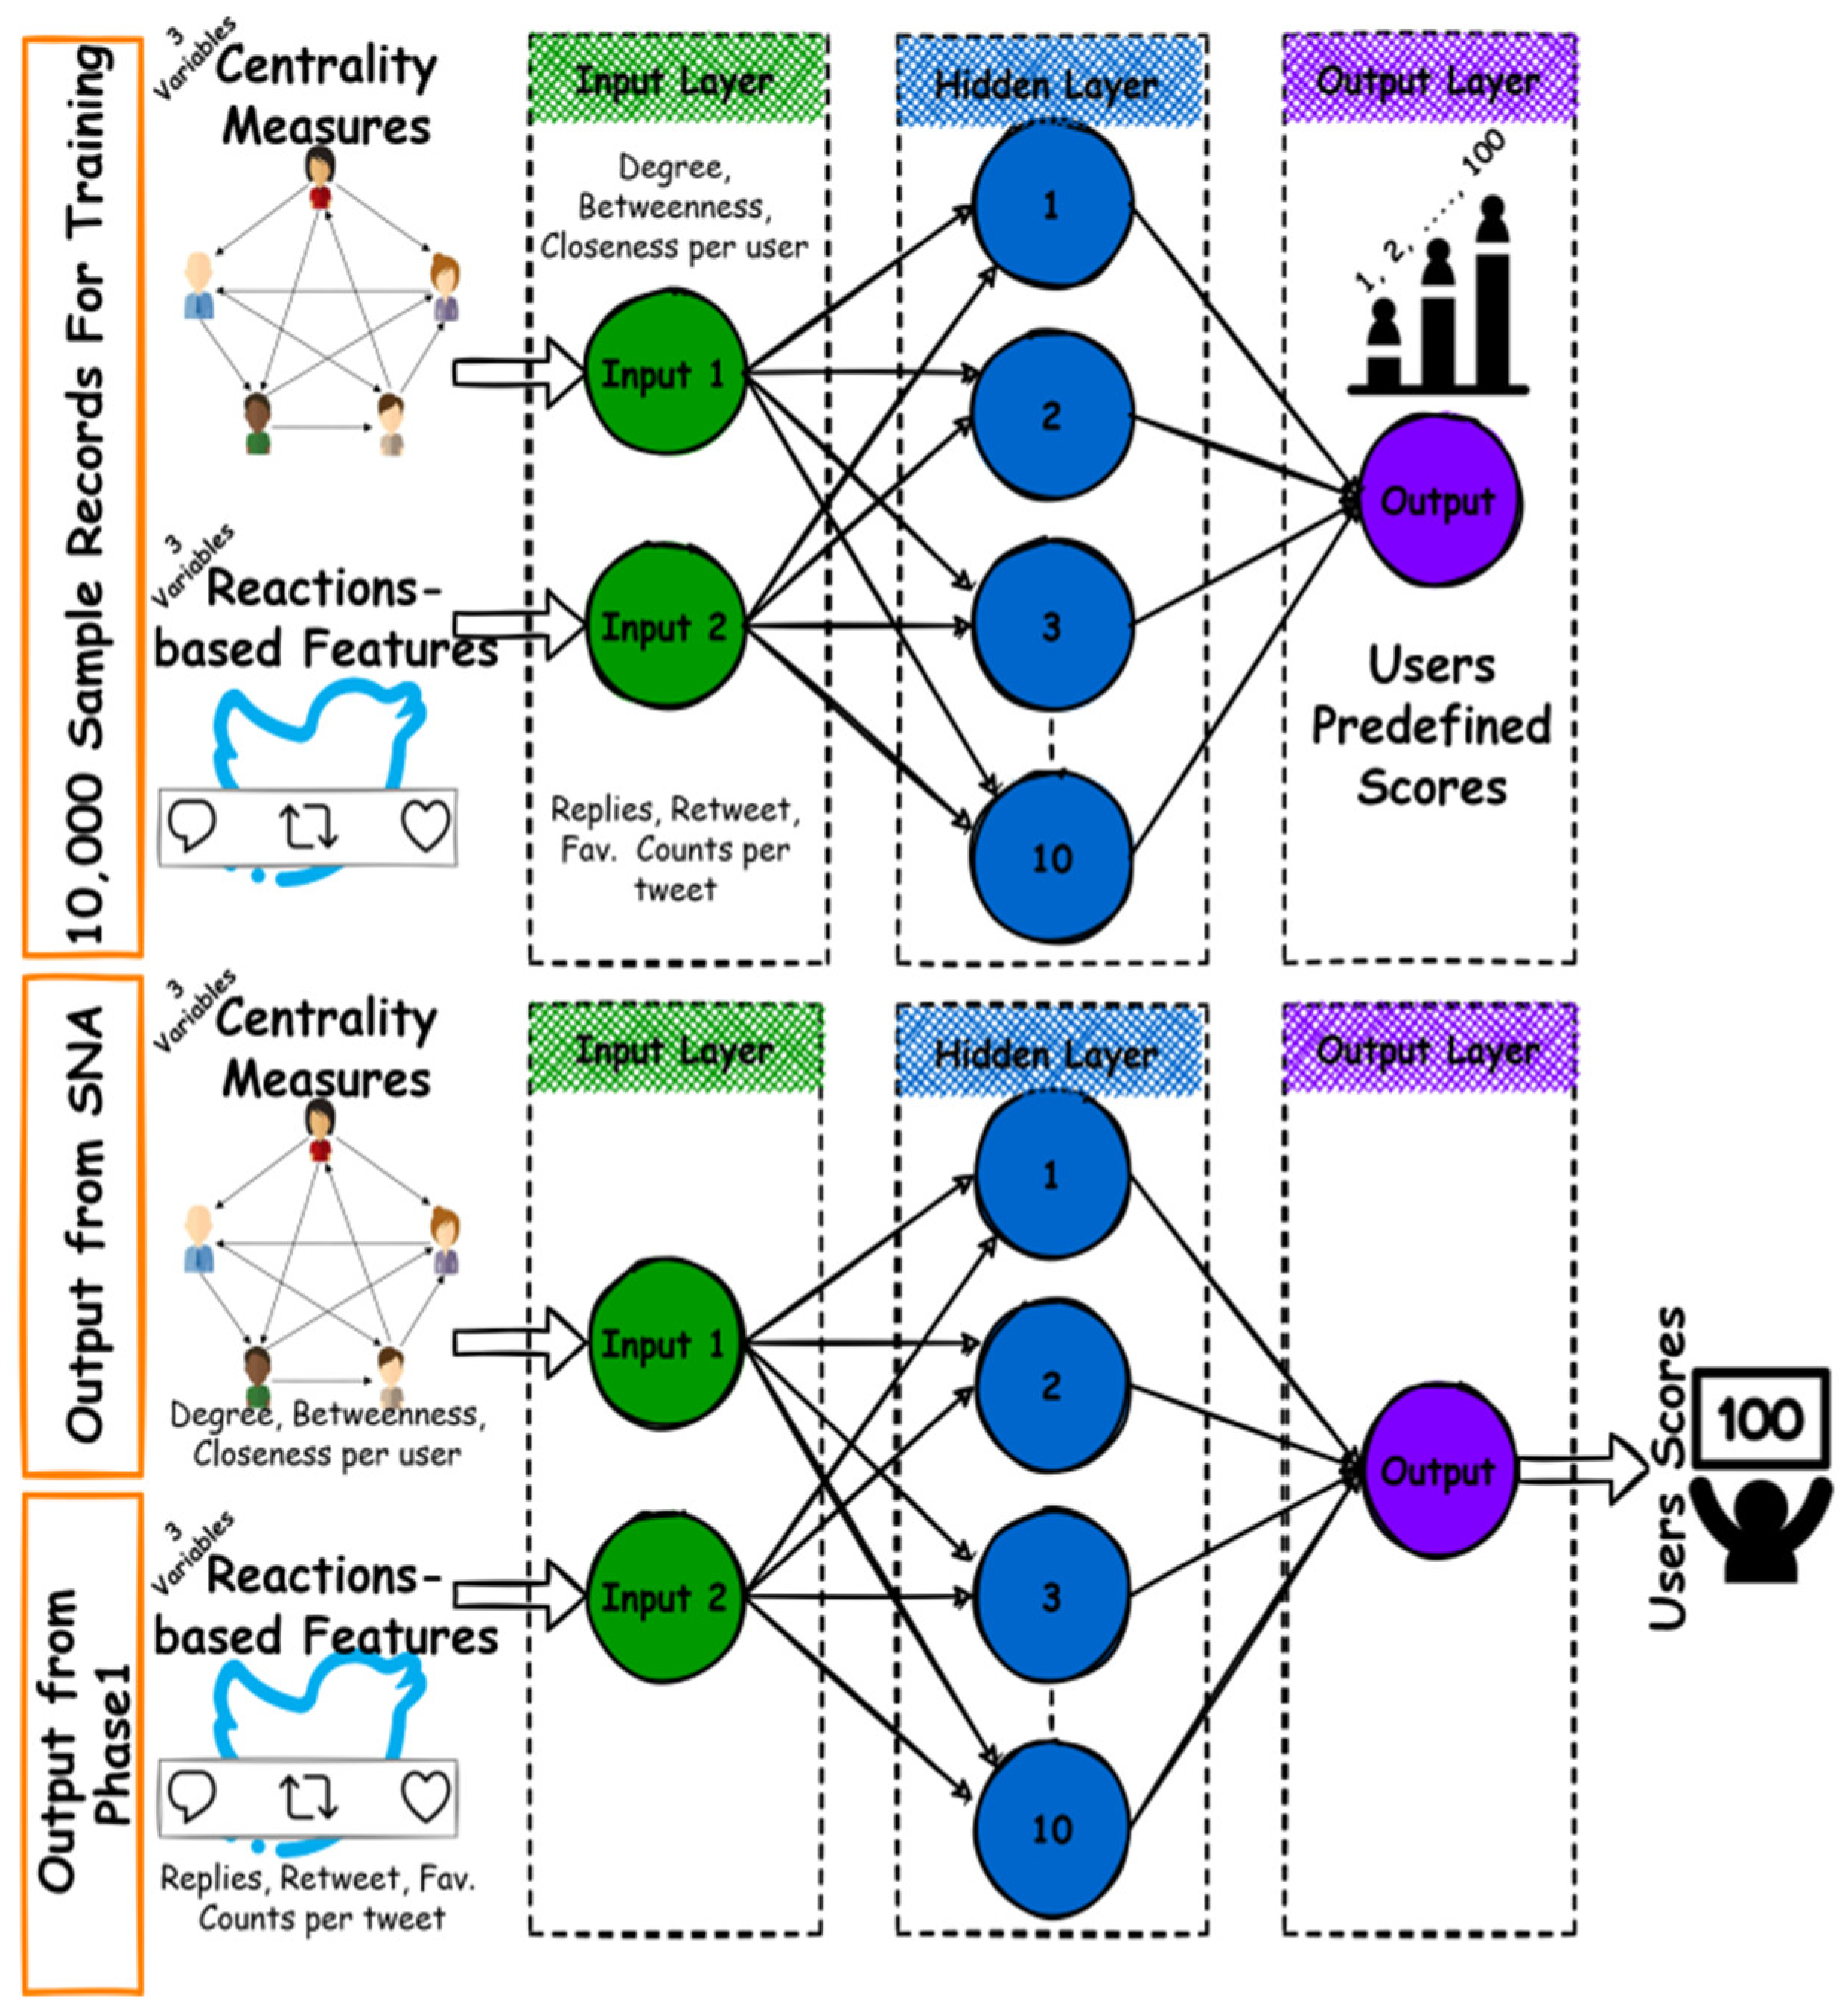
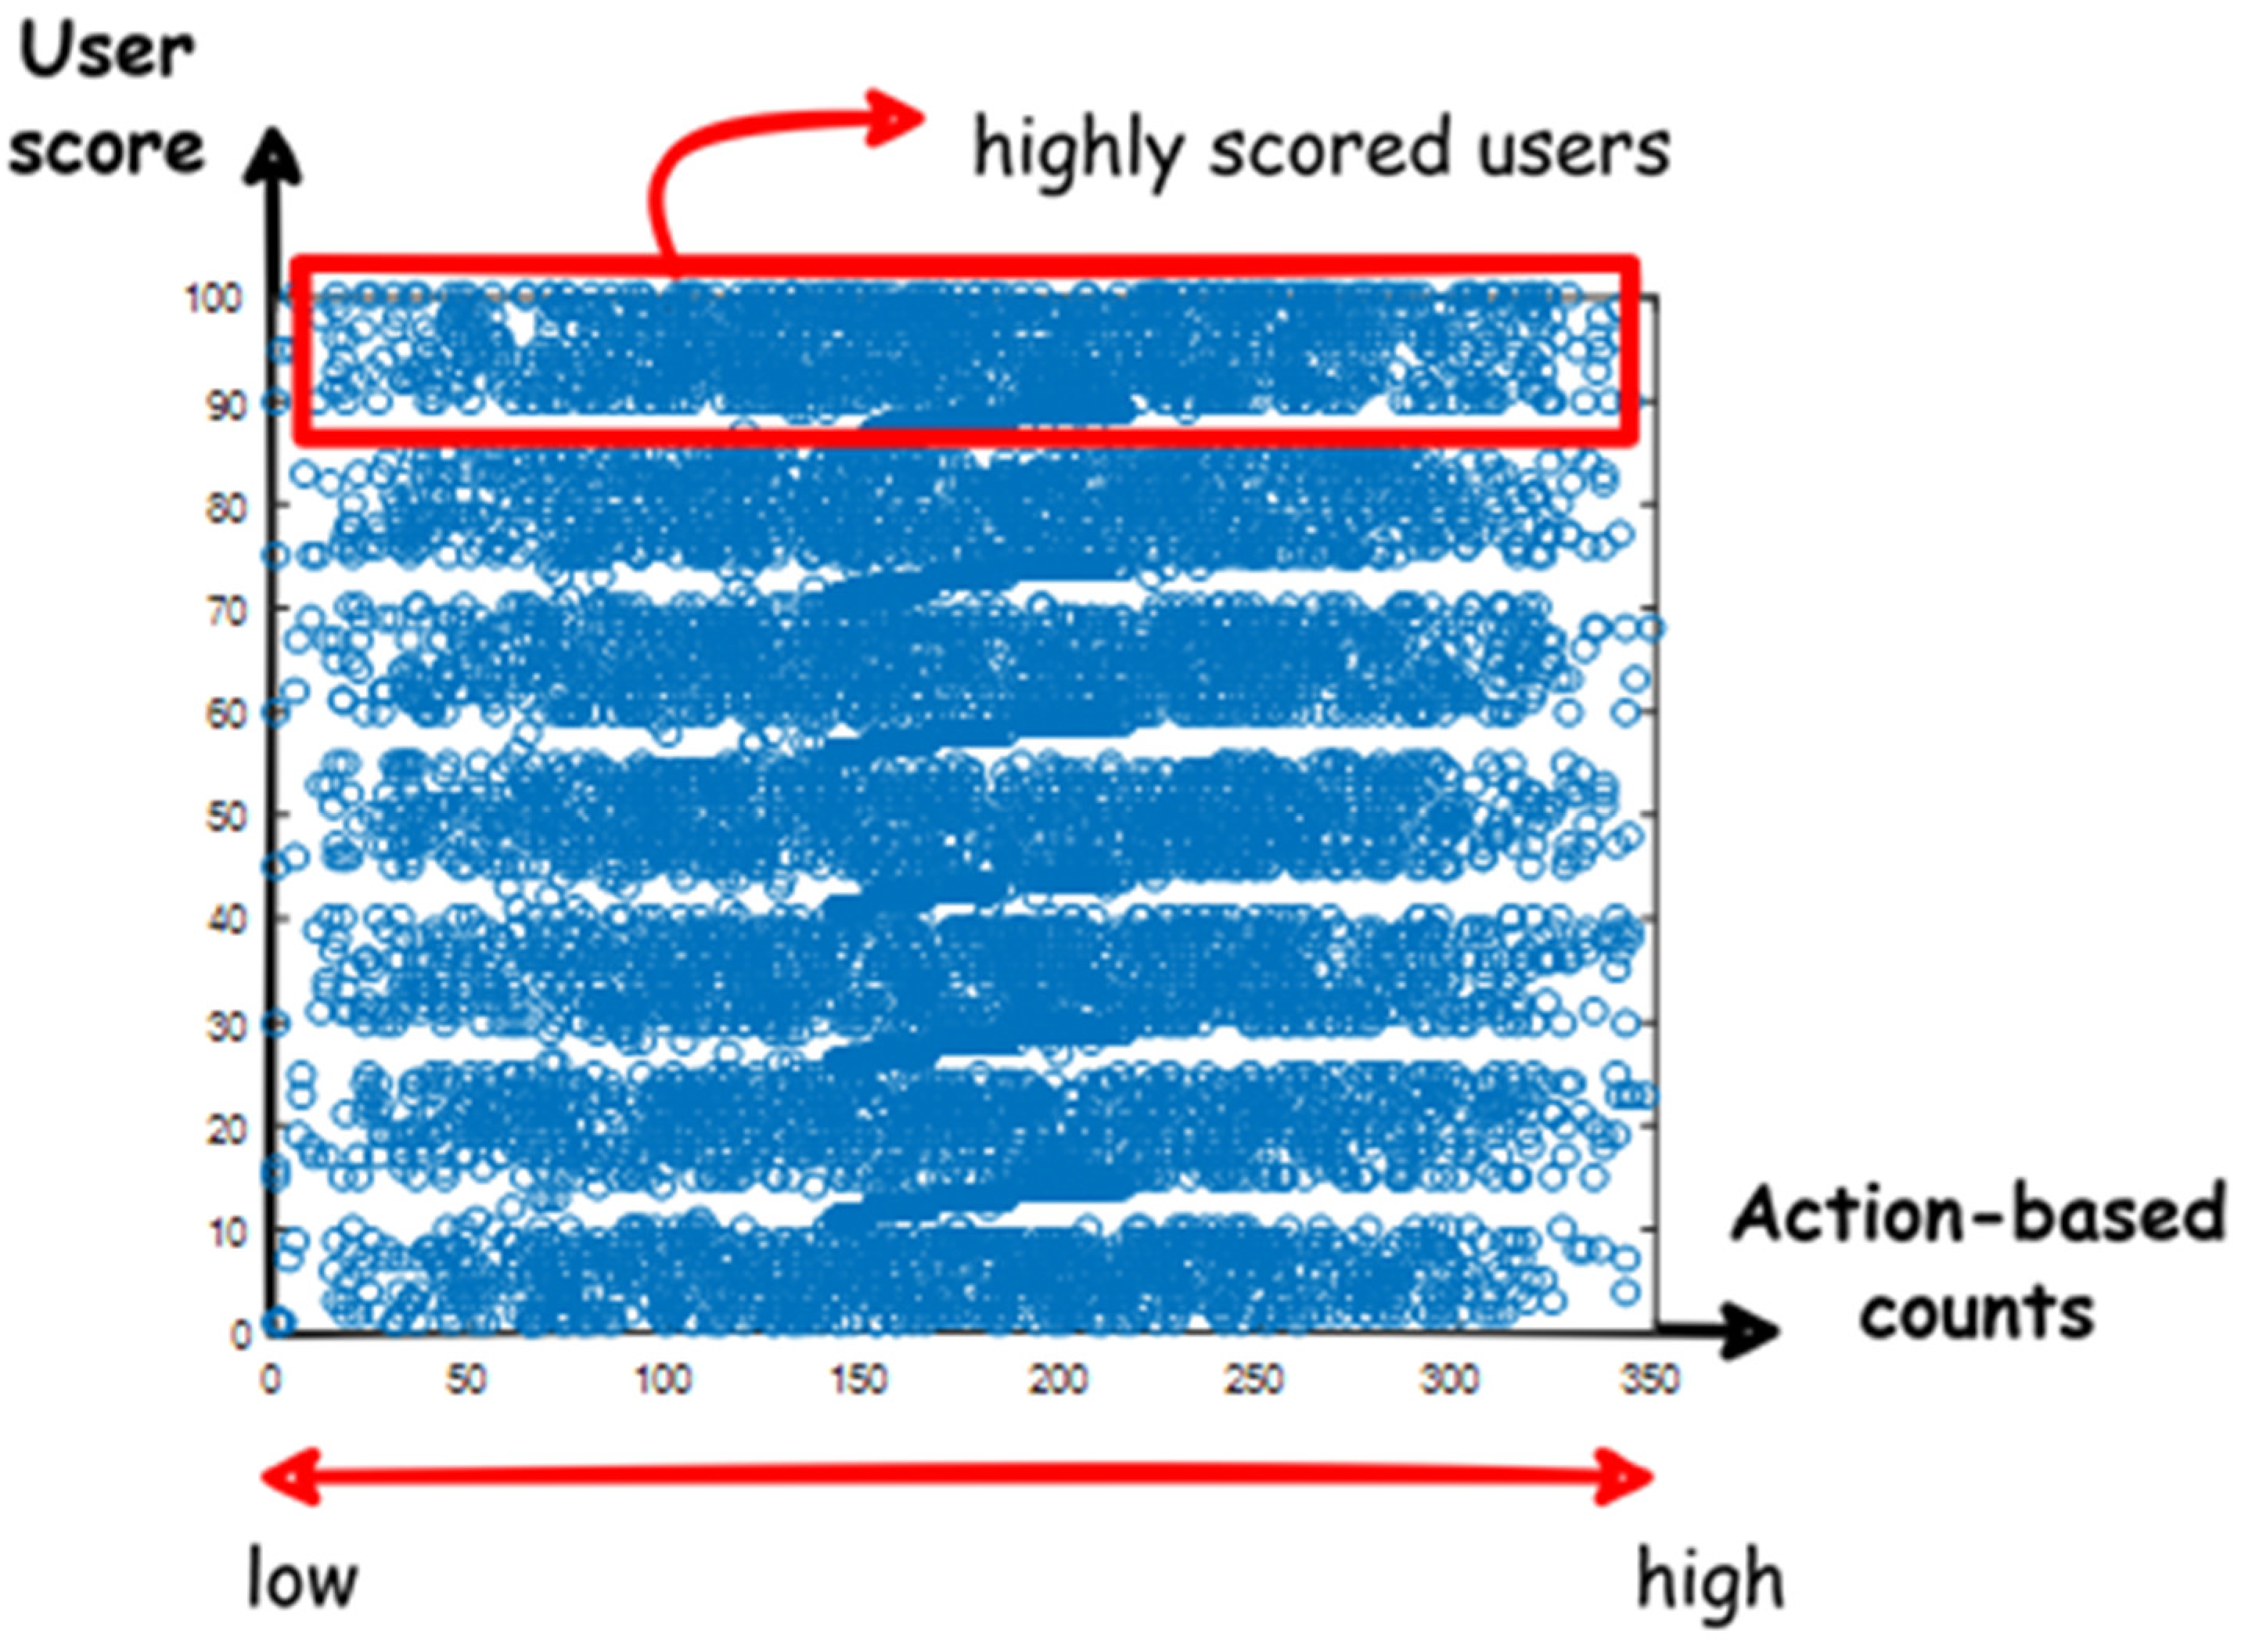
- The users’ weighting method is proposed in this model, which depends on applying SNA and ANN. A comparative analysis of three famous SNA tools must be conducted to adopt the most applicable one. ANN is applied to rank users based on their centrality measure produced by the SNA tool as well as the reaction-based features of users’ texts (i.e., likes, shares, etc.). Weights are provided based on users’ ranks; the top-ranked is the most weighted and vice versa. ANN was chosen for being efficient in dealing with the complicated behavior of humans that could not be mathematically represented;
- -
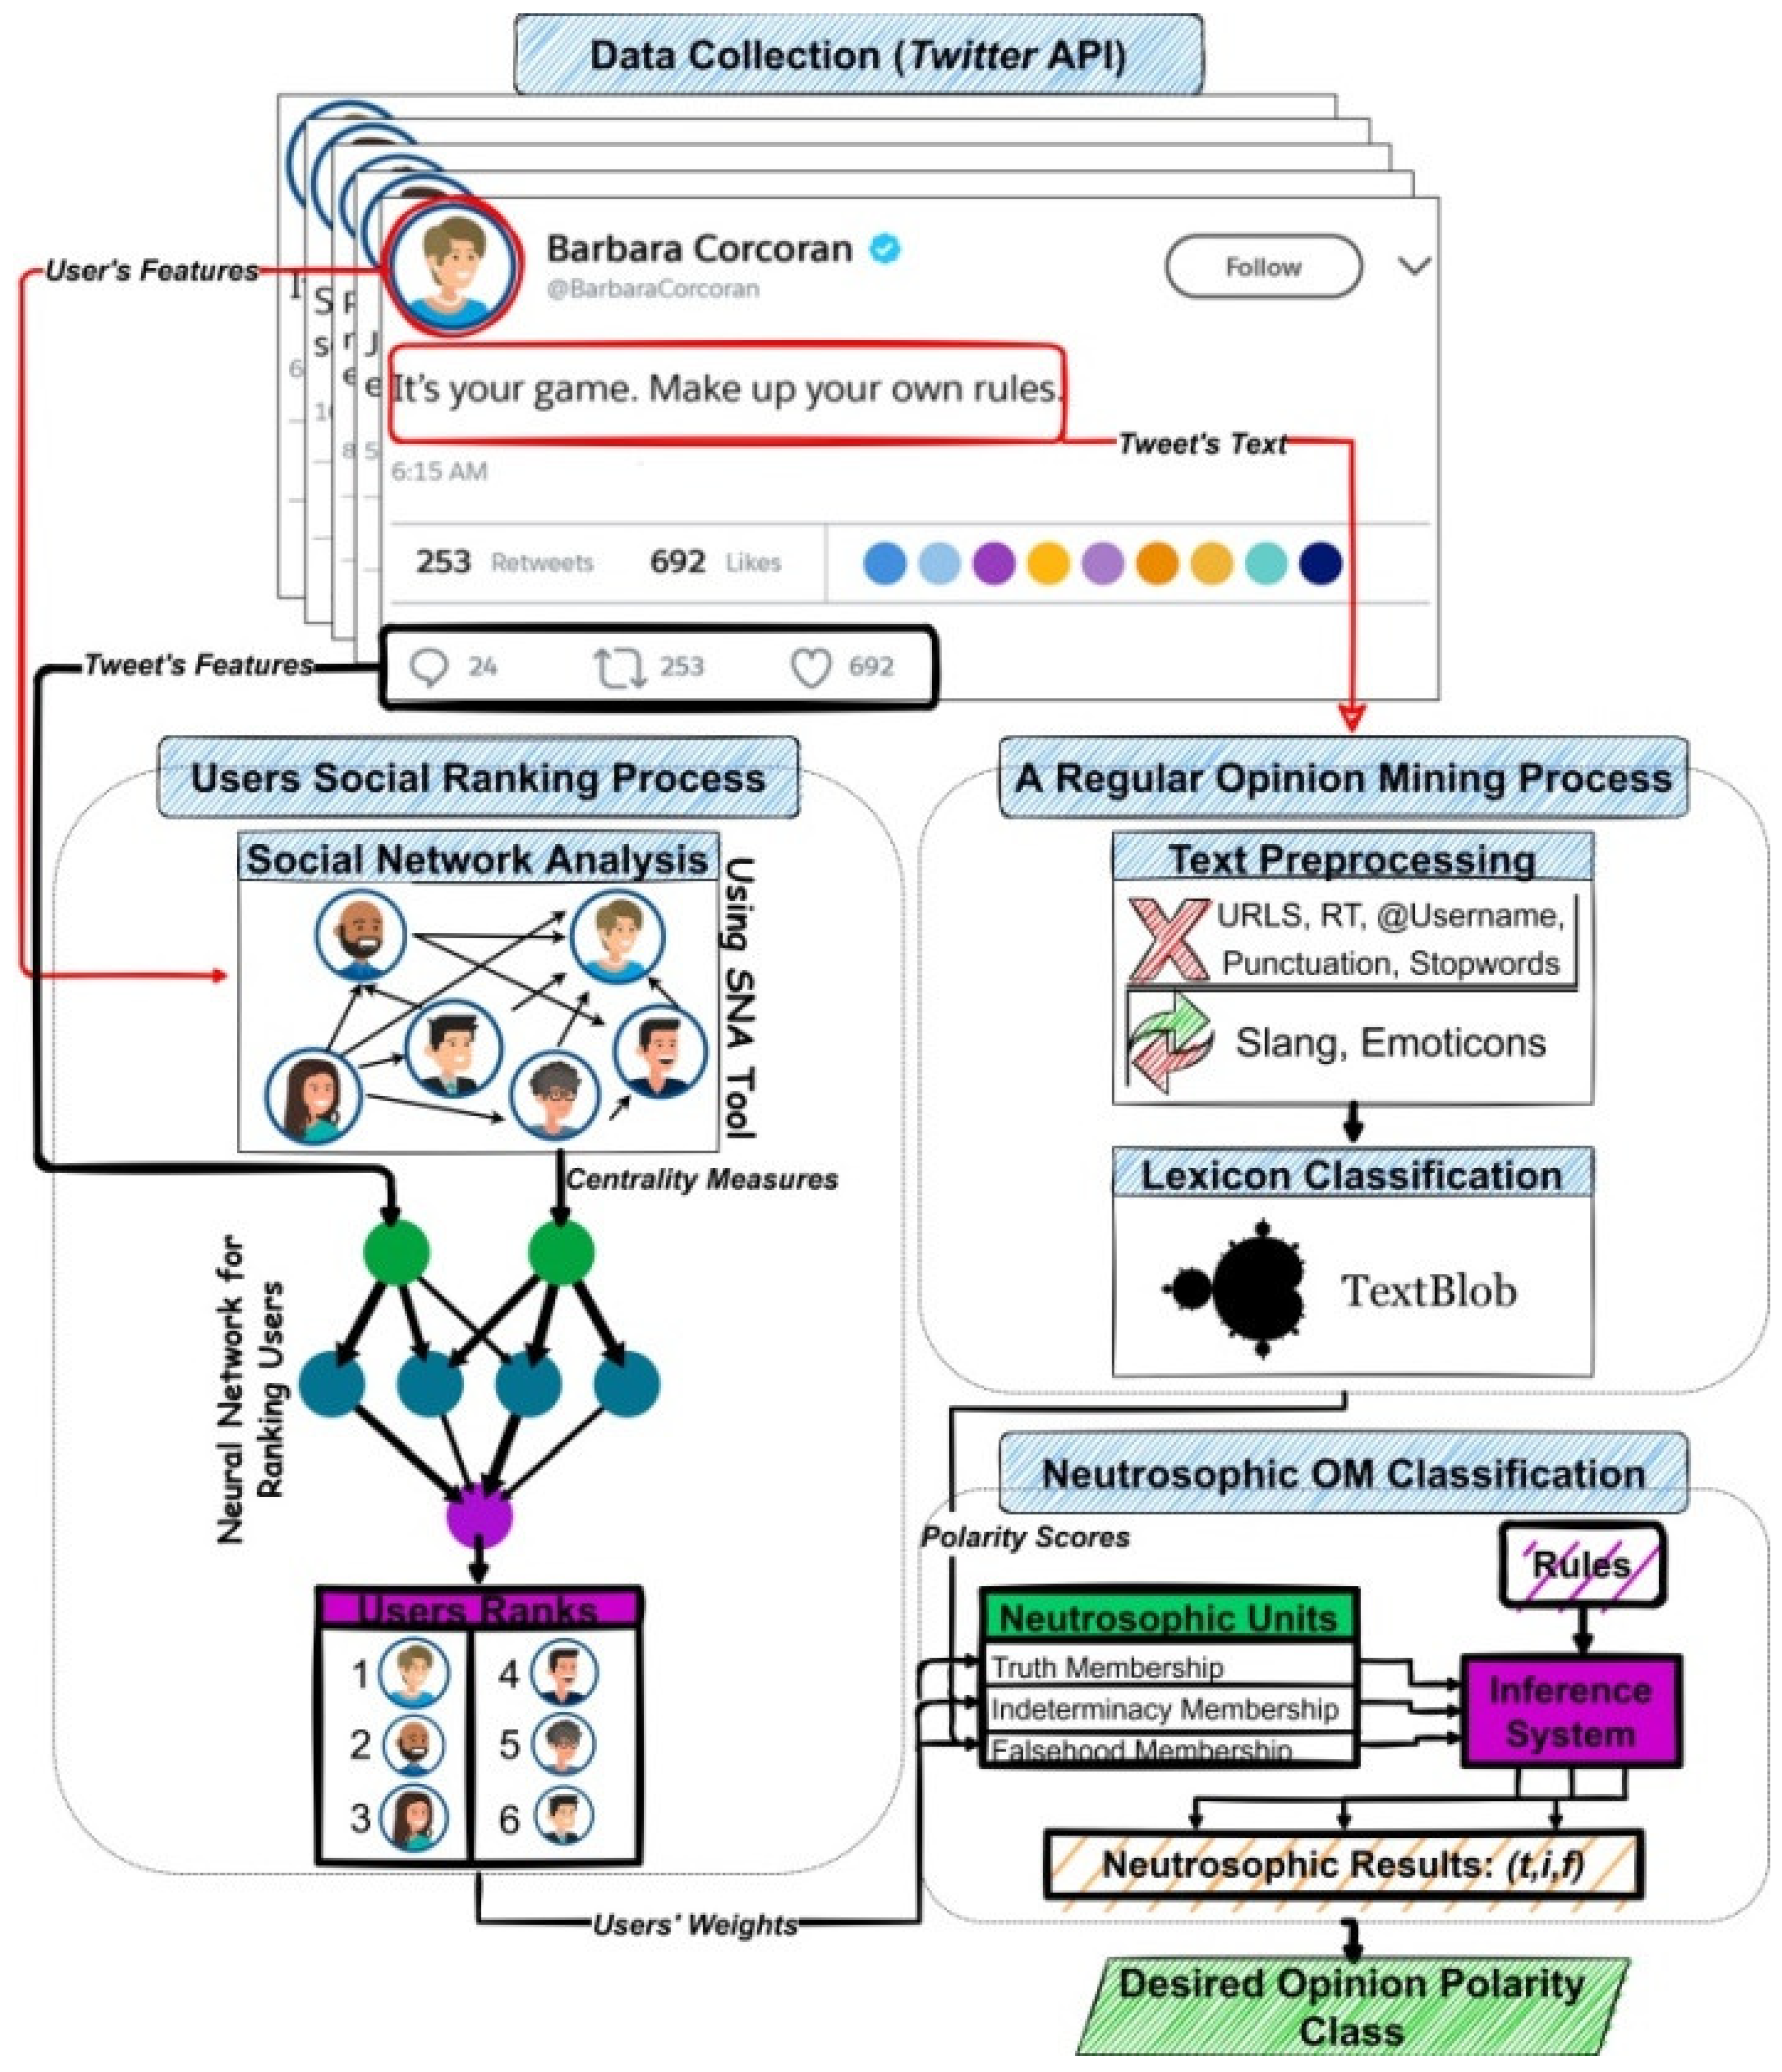
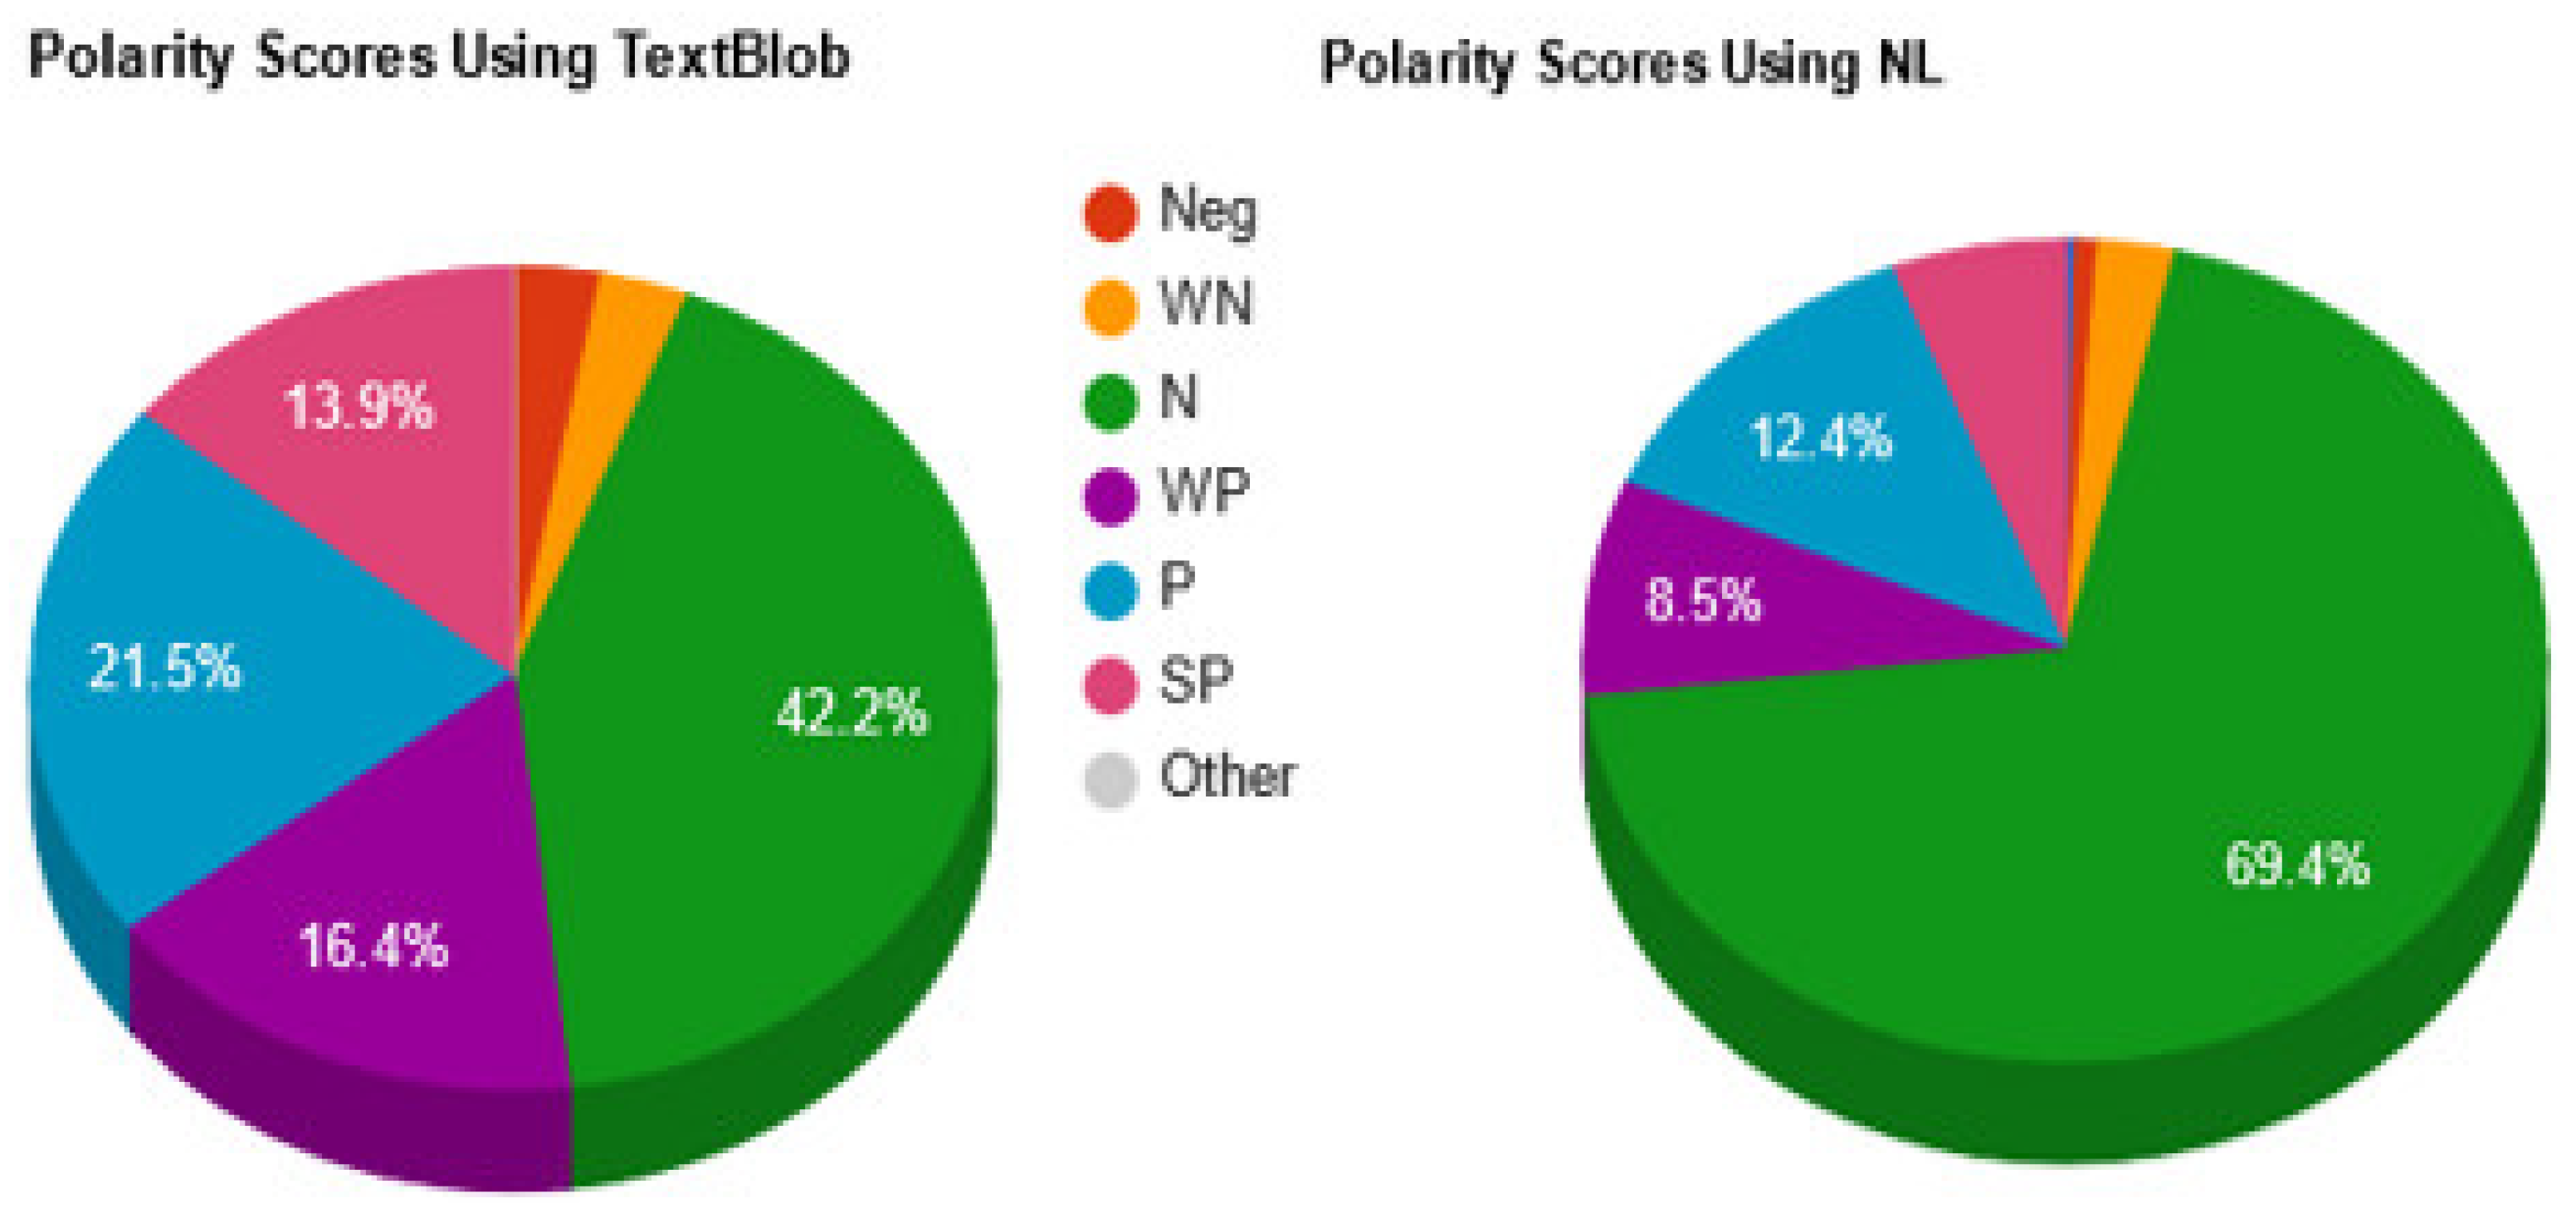
- The innovative adoption of NL is to integrate the new elements with the other traditional elements of opinion. Moreover, NL adoption hybrids the process of OM, providing more accurate polarity scores through performing the OM combining lexicon with machine learning (ML) (i.e., TextBlob and NL). Finally, NL was proven to effectively deal with uncertainty especially opinion ambiguity and dynamicity. Figure 2 presents the proposed model and its components. The phases of the proposed model are described as follows:
4.1. Data Collection Phase
- -
- Opinion text in the English language, per user;
- -
- , the opinion entity is the World Football Cup 2018 and all its possible aspects (e.g., video assistant referee (VAR));
- -
- indicates username of the opinion holder;
- -
- opinions that were collected during the period from 14 June 2018 till 15 July 2018, and;
- -
- The contribution support data that include: follower/following list of and the likes, retweets, and replies counts for their collected opinion tweet.
4.2. Users Weighting Process
- (1)
- Social Network Analysis (SNA)
- (2)
- Artificial Neural Network Ranking Process
- -
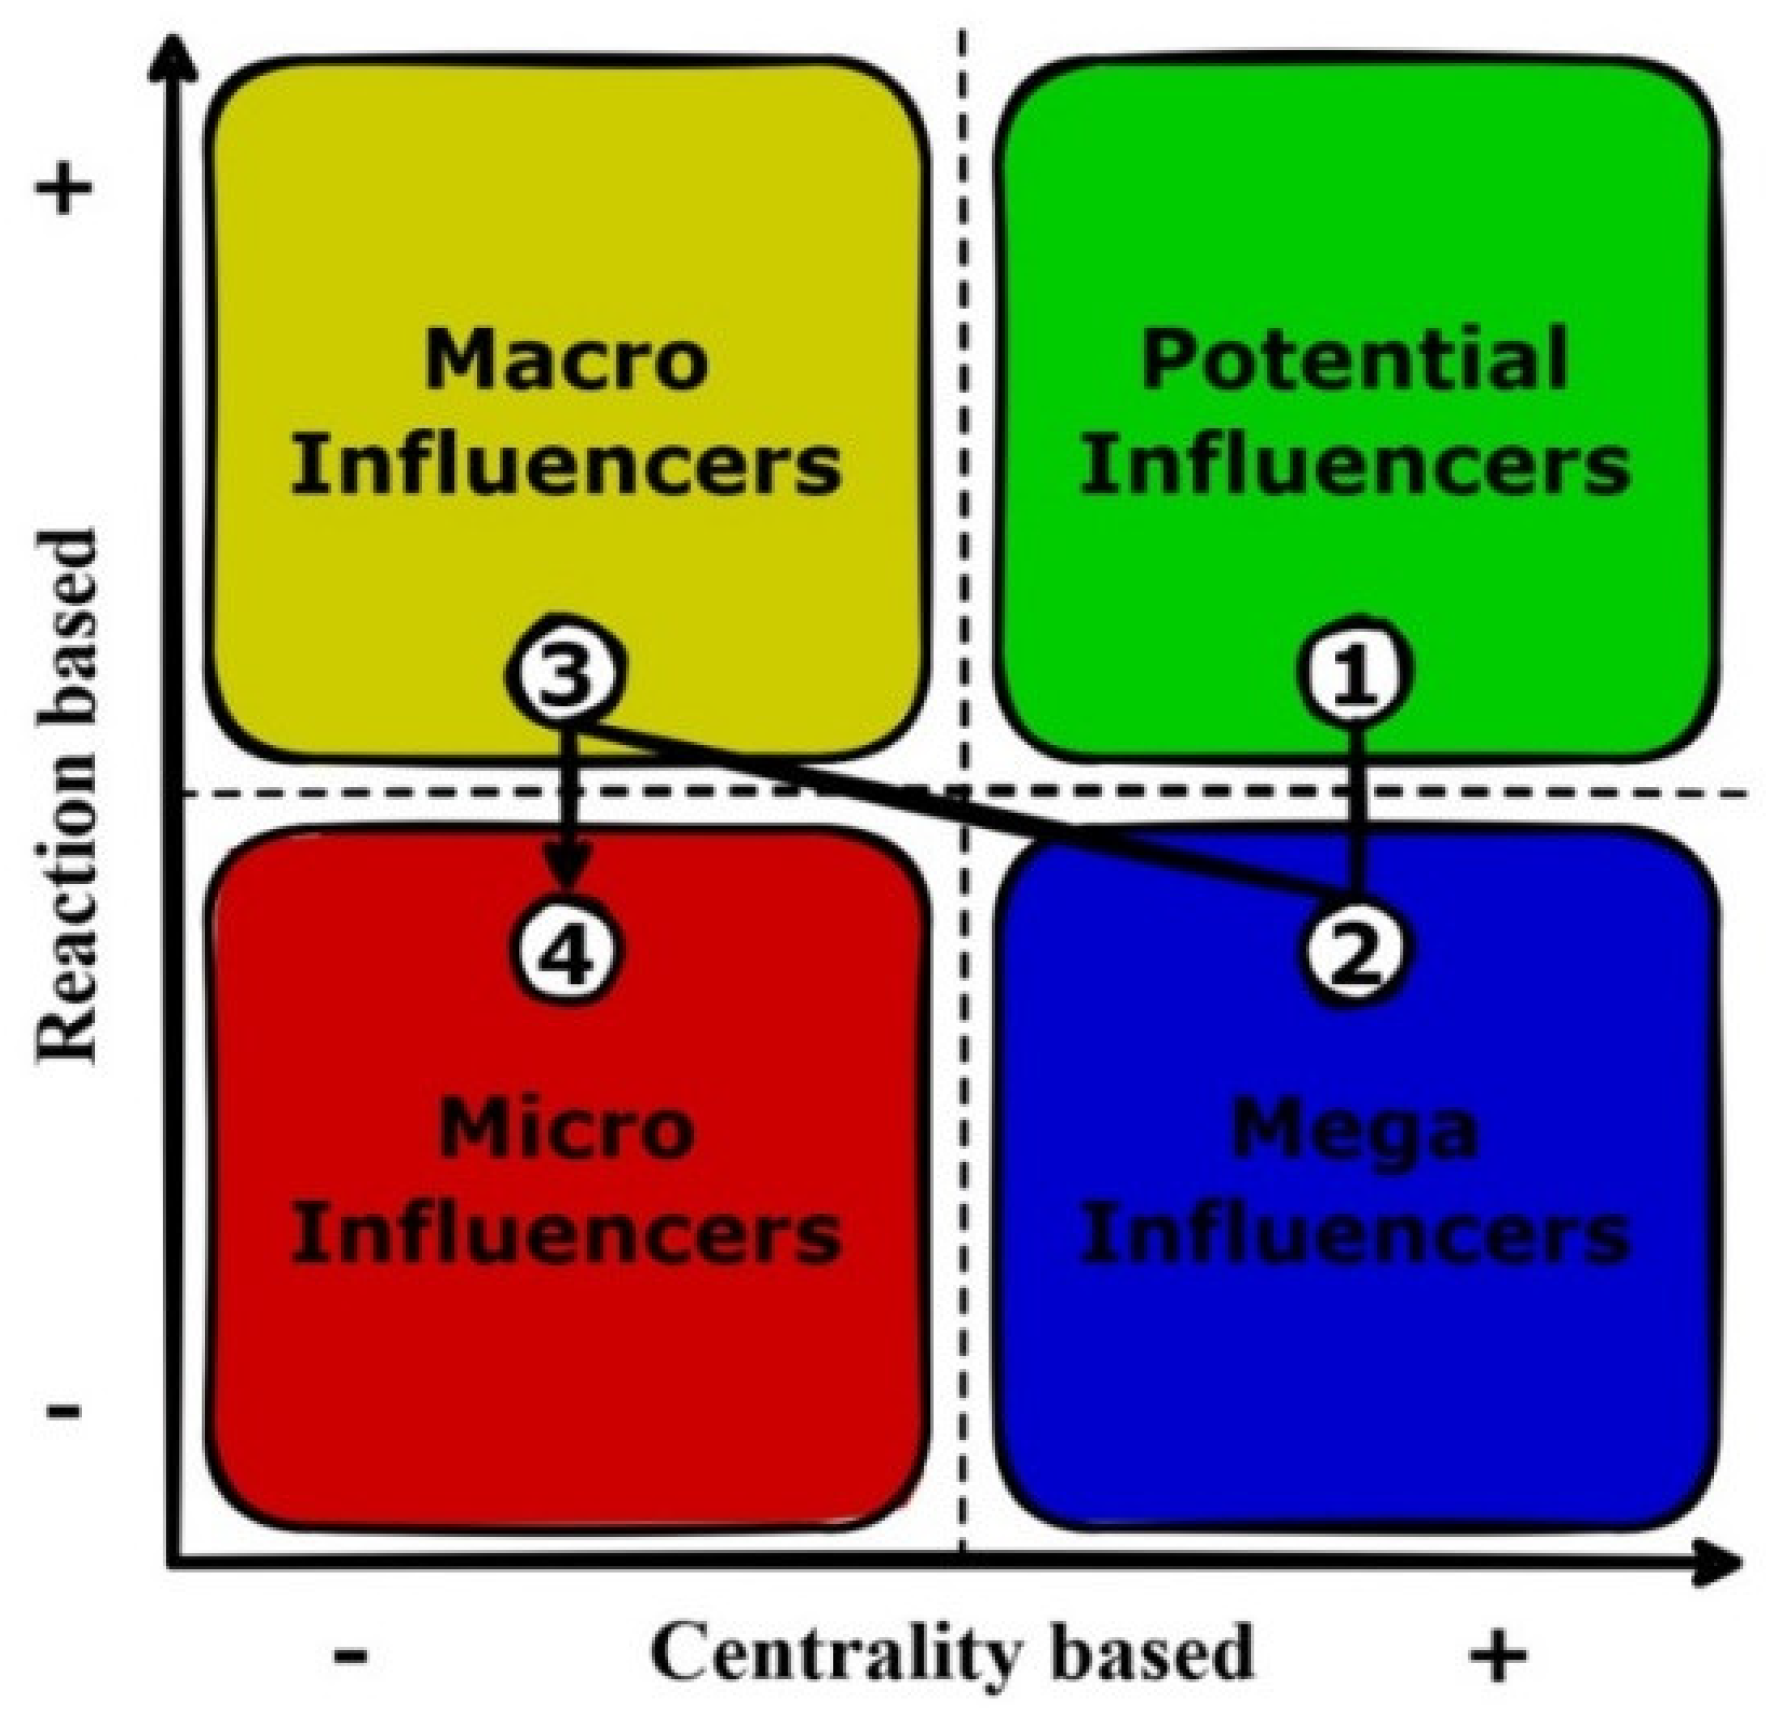
- Micro influencers: This category is of a low influence level that may include: personal users, secondary actors, retweeters, or silent followers. These users exhibit poor behavior in their social networks. Neither active nor sparing, they use their account when they like to and for their purposes (i.e., entertainment, news, and learning). Thus, Micro influencers can possess low reactions to their writings and low centrality measures as shown in Figure 7;
- -
- Macro influencers: Their influence level lies between low and moderate influence. It includes actors with important content, builders, or even trolls. They work on building and growing their relationships and increasing their social network engagement through creating interesting content or even inflammatory conversation. Thus, they can possess high reactions to their writings as shown in Figure 7. They can become mega influencers with time based on their ability to gain audience trust;
- -
- Mega Influencers: This category’s influence level can lie between moderate and high influence levels. It may include business users, brokers, and newscasters. They are followed by a large sector for being the source of information. Thus, they possess high centrality measures as shown in Figure 7. They record an active presence on social media, providing service, marketing, advertising, etc.;
- -
- A-list influencers or potential influencers: They own the highest influence level. They are extremely popular and have between thousands and millions of followers. They include: celebrities, the most recognizable people on earth that tend to act, sing, play football, etc.; or professionals who have grown a strong brand for themselves for sharing useful information about topics of professional interest, fostering interaction, and being followed by many. Thus, they possess both high reactions and centrality measures as shown in Figure 7.
4.3. Opinion Mining Process
- -
- The removal of the uniform resource locators (URLs), @username, stop words, etc.;
- -
- The substitution of slang, emoticons, etc. Example of one tweet before preprocessing: RT @FIFAWorldCup: #FRA #FRA #FRA “This is amazing, it’s pinnacle: France are on top of the world!” @FIFIAWorldCupFRA heard from #WorldCu. After preprocessing, this tweet becomes: amazing pinnacle France top world heard. Afterward, polarity classification of the preprocessed tweet is performed using TextBlob. The polarity classification of the above-mentioned example is sentiment (polarity = 0.55, subjectivity = 0.7).
4.4. Neutrosophic-Based OM Classification
- -
- Opinion dynamicity: Where opinions about the same entity can vary from one person to the other. NL can deal with opinion dynamicity; its properties accept this difference and can handle it to achieve a consensus opinion about the entity [9,21]. To achieve consensus in neutrosophy, opinions with different observations ( polarity scores) should have only one score of triple representation . In this case, we implement a weighted average formula for each component inspired by the work performed in [21] that is defined as:where ,, and are the overall true, indeterminate, and falsity scores of the opinion text , respectively. and represent the polarity scores assigned to the same opinion sentence by the observers of both the highest and the lowest influence level , respectively. For example, is the true component of the opinion sentence assigned by the first highest influence observer.
- -
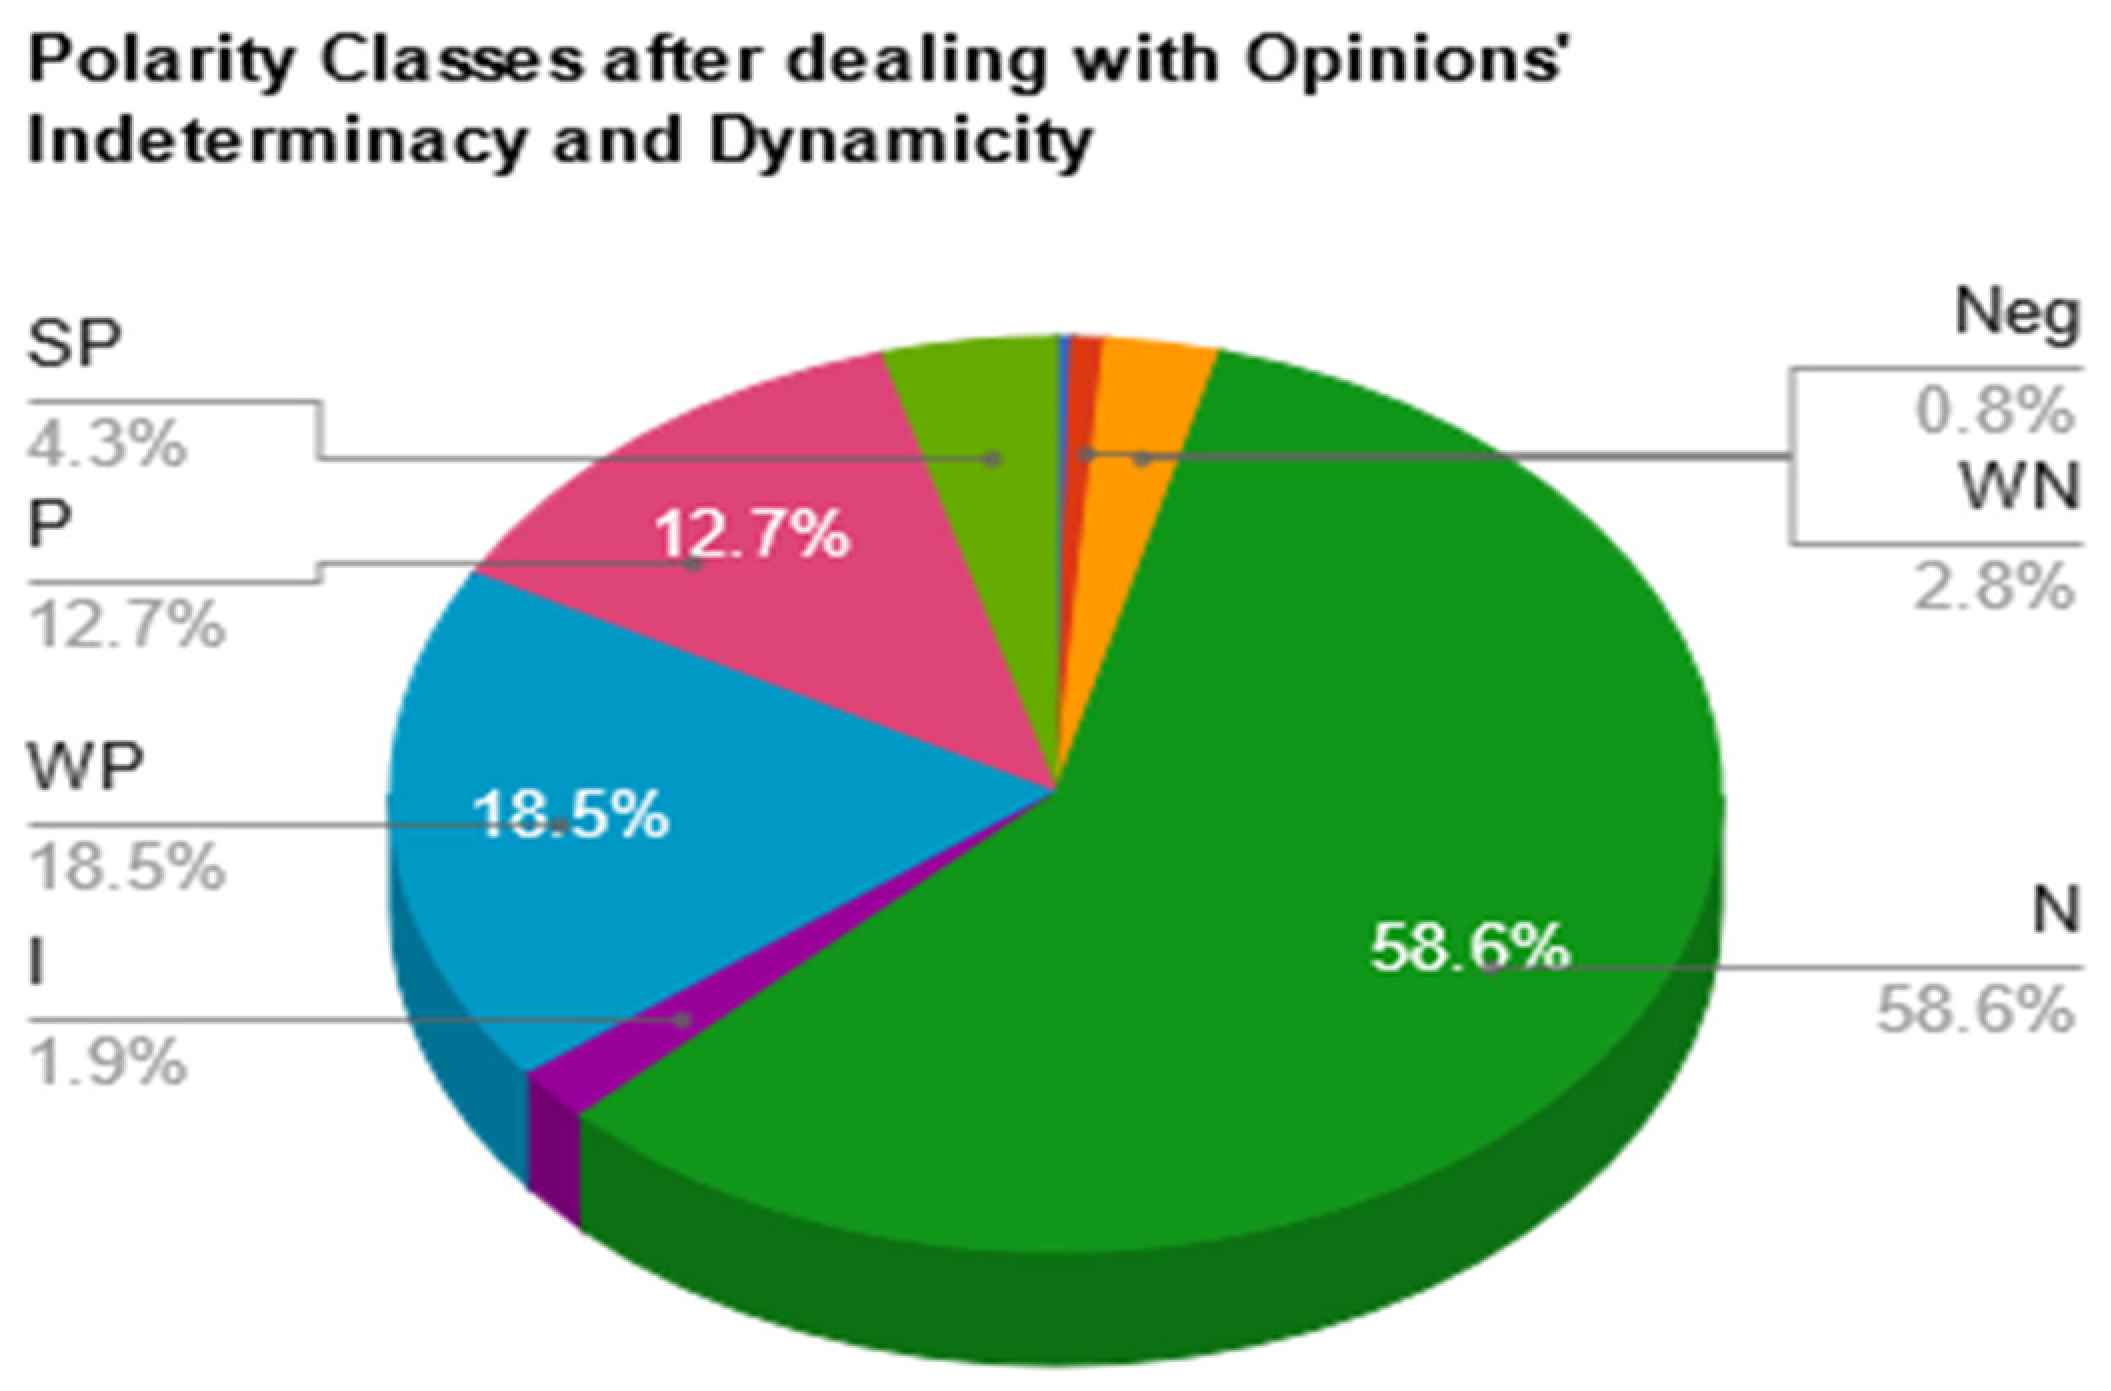
- Opinion indeterminacy: This is when humans cannot be certain. It is the case of neither being true nor false. In the field of OM, this can appear in classifying an opinion as neutral for just being unable to determine its real intended polarity, or for having positive and negative words of zero resultant sum, and thus, considered neutral. This type of polarity classification is not considered until NL appears; where each opinion can have a degree of truth, indeterminacy, or falsity. NL can deal with the failure in determining the polarity of text by considering it of a high indeterminate degree, which is more accurate than considering it neutral or with any other wrong polarity class that badly affects the accuracy of results.
- -
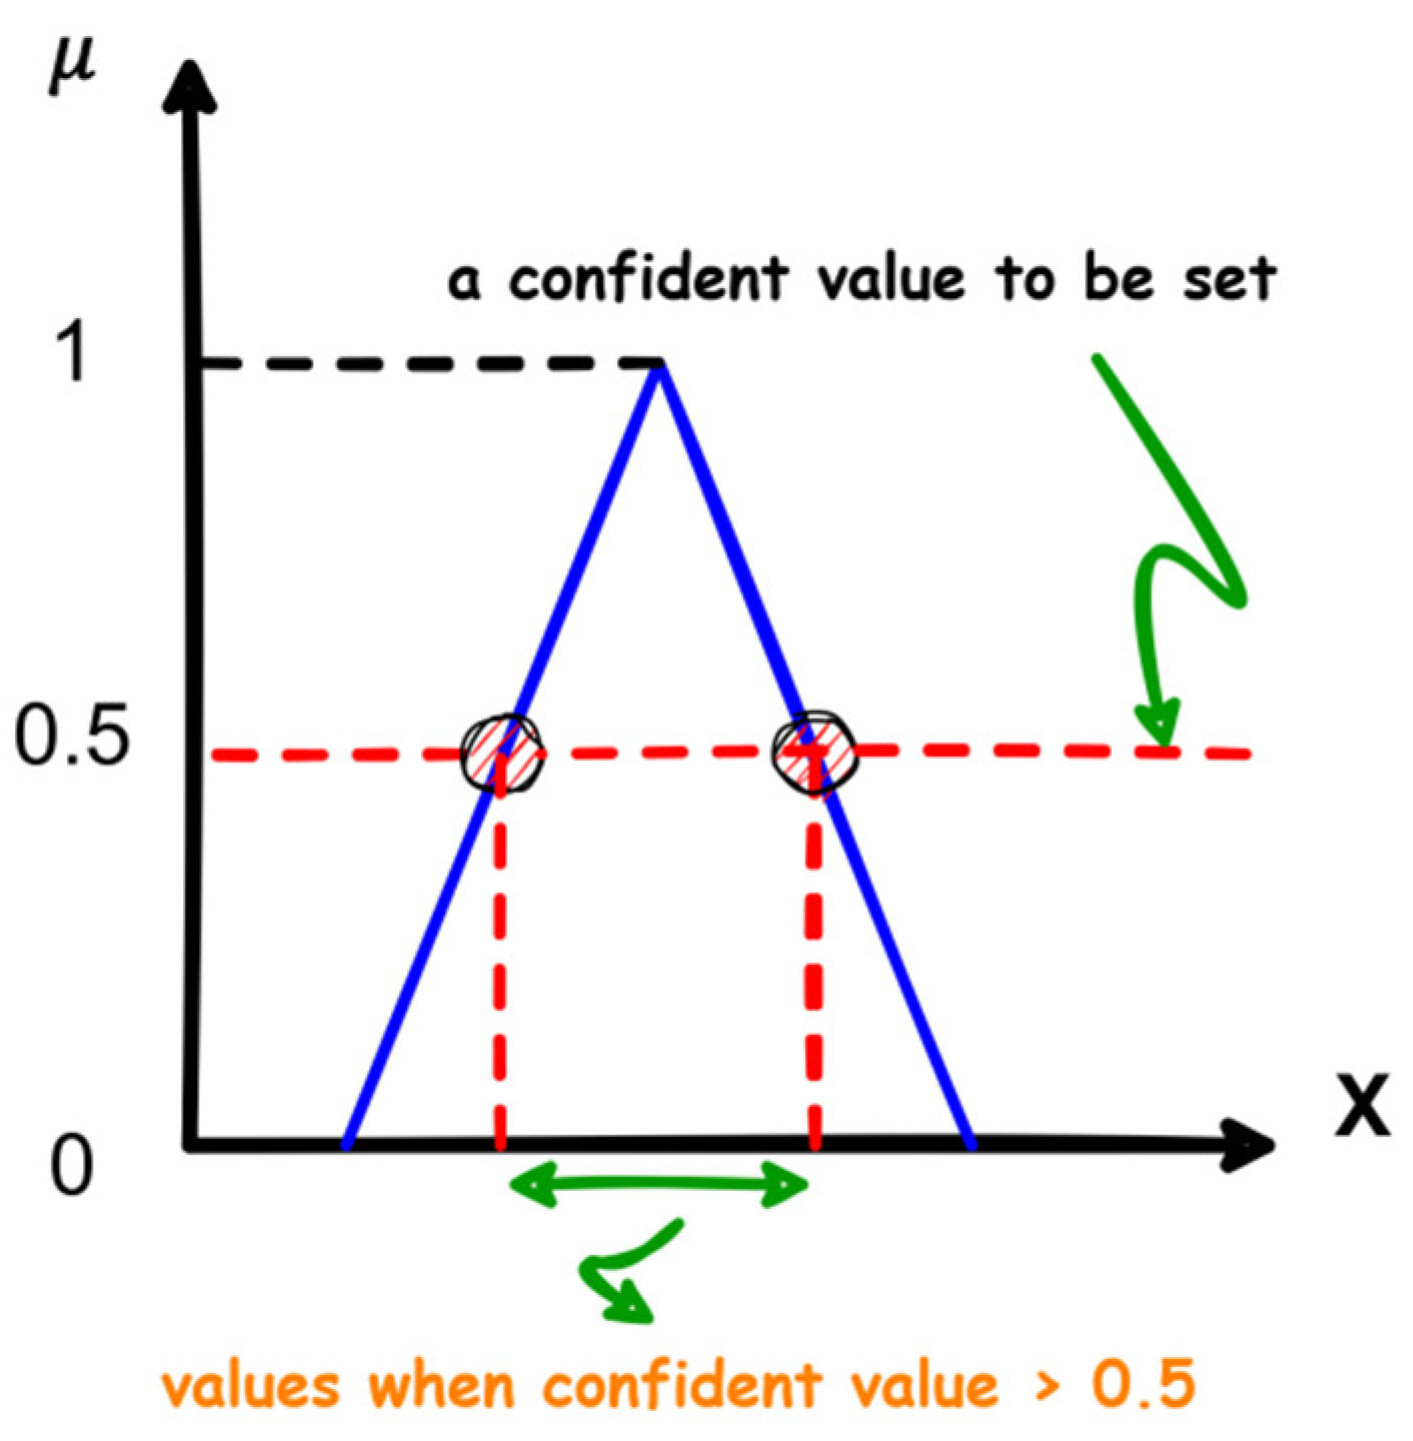
- Classification ambiguity: It is a part of indeterminacy where the classified output lies in the common area between two classes. NL can effectively deal with this case by setting a confident value for the truth component (). Figure 8 shows an example of a graphically represented neutrosophic set and how a confident value can be set on it. Using this value, one can determine the significance of components for a given opinion’s score. If is greater than the confidence value (i.e., 0.5 based on [9]), then the corresponding components can be considered insignificant [9]. All the above-mentioned purposes can be achieved using the following steps:
- (1)
- Neutrosophication
- -
- Input 1: Represents user’s influence (UI), the newly added opinion element. This input ranged from 0 to 1 with three linguistic variables, low, moderate, and high influence (LI, MI, and HI), to build the truth, indeterminate, and falsity membership functions. The membership functions are trapezoidal inspired by [10].
- -
- Input 2: Represents the opinion orientation, the traditional opinion element, namely polarity score . This input’s range is with seven linguistic variables: strong negative (SN), negative (NEG), weak negative (WN), neutral (N), weak positive (WP), positive (P), and strong positive (SP) with three triangular-shaped membership functions, also inspired by [10].
- (2)
- Inference Engine/or Rule Evaluation
- (3)
- Deneutrosophication
4.5. Desired Opinion Polarity Class
5. Experimental Results
6. Conclusions, Limitations, and Future Work
Author Contributions
Funding
Institutional Review Board Statement
Informed Consent Statement
Data Availability Statement
Conflicts of Interest
References
- Klimiuk, K.; Czoska, A.; Biernacka, K.; Balwicki, Ł. Vaccine misinformation on social media–topic based content and sentiment analysis of polish vaccine-deniers’ comments on facebook. Hum. Vaccines Immunother. 2021, 17, 2026–2035. [Google Scholar] [CrossRef] [PubMed]
- Subriadi, A.P.; Baturohmah, H. Social media in marketing of ride-hailing: A systematic literature review. Procedia Comput. Sci. 2022, 197, 102–109. [Google Scholar] [CrossRef]
- Tsapatsoulis, N.; Djouvas, C. Opinion mining from social media short texts: Does collective intelligence beat deep learning? Front. Robot. AI 2019, 5, 138. [Google Scholar] [CrossRef] [PubMed] [Green Version]
- Camacho, D.; Panizo-LLedot, Á.; Bello-Orgaz, G.; Gonzalez-Pardo, A.; Cambria, E. The four dimensions of social network analysis: An overview of research methods, applications, and software tools. Inf. Fusion 2020, 63, 88–120. [Google Scholar] [CrossRef]
- Choudhary, A.; Arora, A. Linguistic feature based learning model for fake news detection and classification. Expert Syst. Appl. 2020, 169, 114171. [Google Scholar] [CrossRef]
- Serrano-Guerrero, J.; Romero, F.P.; Olivas, J.A. Fuzzy logic applied to opinion mining: A review. Knowl. Based Syst. 2021, 222, 107018. [Google Scholar] [CrossRef]
- Oueslati, W.; Arrami, S.; Dhouioui, Z.; Massaabi, M. Opinion leaders’ detection in dynamic social networks. Concurr. Comput. Pract. Exp. 2020, 33, e5692. [Google Scholar] [CrossRef]
- Kandasamya, I.; Vasanthaa, W.; Obbinenib, J.; Smarandache, F. Sentiment analysis of tweets using refined neutrosophic sets. Comput. Ind. 2020, 115, 103180–103190. [Google Scholar] [CrossRef]
- Ansaria, A.; Biswasb, R.; Aggarwal, S. Neutrosophic classifier: An extension of fuzzy classifier. Appl. Soft Comput. 2012, 13, 563–573. [Google Scholar] [CrossRef] [Green Version]
- Madbouly, M.; Darwish, S.; Essameldin, R. A modified fuzzy sentiment analysis approach based on user ranking suitable for online social networks. IET Softw. 2020, 14, 300–307. [Google Scholar] [CrossRef]
- Lanel, G.H.J.; Jayawardena, H.S.S.P. A study on graph theory properties of on-line social networks. Int. J. Sci. Res. Publ. 2020, 10, 267–274. [Google Scholar] [CrossRef]
- Jianqiang, Z.; Xiaolin, G.; Feng, T. A new method of identifying influential users in the micro- blog networks. IEEE Access 2017, 5, 3008–3015. [Google Scholar] [CrossRef]
- Jin, Z.; Zhao, X.; Liu, Y. Heterogeneous graph network embedding for sentiment analysis on social media. Cogn. Comput. 2021, 13, 81–95. [Google Scholar] [CrossRef]
- Chauhan, P.; Sharma, N.; Sikka, G. The emergence of social media data and sentiment analysis in election prediction. J. Ambient Intell. Humaniz. Comput. 2020, 12, 2601–2627. [Google Scholar] [CrossRef]
- Muzaffar, A.; Nafi, M.; Sohail, S. Neutrosophy logic and its classification: An overview. Neutrosophic Sets Syst. 2020, 35, 239–251. [Google Scholar]
- Christianto, V.; Smarandache, F. A review of seven applications of neutrosophic logic: In cultural psychology, economics theorizing, conflict resolution, philosophy of science, etc. Multidiscip. Sci. J. 2019, 2, 128–137. [Google Scholar] [CrossRef] [Green Version]
- Radwan, N.; Senousy, M.B.; Riad, A.E.D.M. Neutrosophic logic approach for evaluating learning management systems. Neutrosophic Sets Syst. 2016, 11, 3–7. [Google Scholar]
- Basha, S.H.; Abdalla, A.S.; Hassanien, A.E. NRCS: Neutrosophic rule-based classification system. In Proceedings of SAI Intelligent Systems Conference, London, UK, 21–22 September 2016; Springer: Berlin/Heidelberg, Germany, 2016; pp. 627–639. [Google Scholar]
- Bhutani, K.; Aggarwal, S. A novel approach for data classification using neutrosophic entropy. Adv. Intell. Syst. Comput. 2018, 732, 305–317. [Google Scholar]
- Smarandache, F.; Teodorescu, M.; Gîfu, D. Neutrosophy, a Sentiment Analysis Model. In Proceedings of the RUMOUR 2017, 3rd Workshop on Social Media and the Web of Linked Data, Toronto, ON, Canada, 22 June 2017; pp. 38–41. [Google Scholar]
- Smarandache, F.; Colhon, M.; Vlăduţescu, Ş.; Negrea, X. Word-level neutrosophic sentiment similarity. Appl. Soft Comput. J. 2019, 80, 167–176. [Google Scholar] [CrossRef]
- Benedetto, F.; Tedeschi, A. Big data sentiment analysis for brand monitoring in social media streams by cloud computing. In Sentiment Analysis and Ontology Engineering Studies in Computational Intelligence; Springer: Berlin/Heidelberg, Germany, 2016; pp. 341–377. [Google Scholar]
- Ficara, A.; Fiumara, G.; De Meo, P.; Liotta, A. Correlation analysis of node and edge centrality measures in artificial complex networks. In Proceedings of the Sixth International Congress on Information and Communication Technology, London, UK, 25–26 February 2021; Springer: Singapore, 2022; pp. 901–908. [Google Scholar]
- Zhuang, Y.-B.; Li, Z.-H.; Zhuang, Y.-J. Identification of influencers in online social networks: Measuring influence considering multidimensional factors exploration. Heliyon 2021, 7, e06472. [Google Scholar] [CrossRef]
- Quan, T.-T.; Mai, D.-T.; Tran, T.-D. CID: Categorical influencer detection on microtext-based social media. Online Inf. Rev. 2020, 44, 1027–1055. [Google Scholar] [CrossRef]
- Litterio, A.M.; Nantes, E.A.; Larrosa, J.M.; Gómez, L.J. Marketing and social networks: A criterion for detecting opinion leaders. Eur. J. Manag. Bus. Econ. 2017, 26, 347–366. [Google Scholar] [CrossRef] [Green Version]
- Ruiz-Gomez, A. Digital fame and fortune in the age of social media: A classification of social media influencers. Adres. ESIC Int. J. Commun. Res. 2019, 19, 8–29. [Google Scholar] [CrossRef] [Green Version]
- Uddin, M.; Imran, M.; Sajjad, H. Understanding types of users on twitter. arXiv 2014, arXiv:1406.1335. [Google Scholar]


| Rules # | Rules |
|---|---|
| 1 | IF UI is ‘LI-t’ and PS is ‘SN-t’, THEN PS is ‘NEG-t’ |
| 2 | IF UI is ‘LI-t’ and PS is ‘SP-t’, THEN PS is ‘P-t’ |
| 3 | IF UI is ‘LI-t’ and PS is ‘NEG’, THEN PS is ‘WN-t’ |
| 4 | IF UI is ‘LI-t’ and PS is ‘P-t’, THEN PS is ‘WP-t’ |
| 5 | IF UI is ‘LI-t’ and PS is ‘WN-t’, THEN PS is ‘N-t’ |
| 6 | IF UI is ‘LI-t’ and PS is ‘WP-t’, THEN PS is ‘N-t’ |
| 7 | IF UI is ‘LI-t’ and PS is ‘N-t’, THEN PS is ‘N-t’ |
| 8 | IF UI is ‘MI-t’ and PS is ‘N-t’, THEN PS is ‘N-t’ |
| 9 | IF UI is ‘HI-t’ and PS is ‘N-t’, THEN PS is ‘N-t’ |
| 10 | IF UI is ‘MI-t’ and PS is ‘SN-t’, THEN PS is ‘SN-t’ |
| 11 | IF UI is ‘MI-t’ and PS is ‘NEG-t’, THEN PS is ‘NEG-t’ |
| 12 | IF UI is ‘MI-t’ and PS is ‘WN-t’, THEN PS is ‘WN-t’ |
| 13 | IF UI is ‘MI-t’ and PS is ‘WP-t’, THEN PS is ‘WP-t’ |
| 14 | IF UI is ‘MI-t’ and PS is ‘P-t’, THEN PS is ‘P-t’ |
| 15 | IF UI is ‘MI-t’ and PS is ‘SP-t’, THEN PS is ‘SP-t’ |
| 16 | IF UI is ‘HI-t’ and PS is ‘SN-t’, THEN PS is ‘SN-t’ |
| 17 | IF UI is ‘HI-t’ and PS is ‘SP-t’, THEN PS is ‘SP-t’ |
| 18 | IF UI is ‘HI-t’ and PS is ‘NEG-t’, THEN PS is ‘SN-t’ |
| 19 | IF UI is ‘HI-t’ and PS is ‘P-t’, THEN PS is ‘SP-t’ |
| 20 | IF UI is ‘HI-t’ and PS is ‘WN-t’, THEN PS is ‘NEG-t’ |
| 21 | IF UI is ‘HI-t’ and PS is ‘WP-t’, THEN PS is ‘P-t’ |
| Score | Polarity |
|---|---|
| Strong Positive | |
| Positive | |
| Weak Positive | |
| /NULL | Neutral/undecided |
| Weak Negative | |
| Negative | |
| Strong Negative |
| Overall Items | Polarity Classes and Distributions | ||||||
|---|---|---|---|---|---|---|---|
| Positive | Neutral | Negative | |||||
| 1080 | 559 (51.76%) | 456 (42.22%) | 65 (6.02%) | ||||
| SP | P | WP | SN | NEG | WN | ||
| 150 | 232 | 177 | 1 | 32 | 32 | ||
| Overall Items | Average Error in Opinion Holders ANN Classification | |||
|---|---|---|---|---|
| Low Influence | Moderate | High Influence | ||
| 1080 | 0.099 | 0.239 | 0.251 | |
| Micro | Macro | Mega | A-Listers | |
| 0.089 | 0.234 | 0.248 | 0.208 | |
| User # | User’s Weight (ANN) | User’s Influence Type | Polarity Score (TextBlob) | Polarity Score (Using Our Proposed NL Model ) |
|---|---|---|---|---|
| 273 | 0.10 | Micro | 0.90 | (0.5, 0, 0) |
| 518 | 0.44 | Macro | 0.90 | (0.91, 0, 0) |
| 570 | 0.68 | Mega | 0.90 | (0.89, 0, 0) |
| with a final polarity score of 0.79 (SP) | ||||
| 147 | 0.20 | Micro | 0.125 | (0, 0, 0) |
| 212 | 0.31 | Macro | 0.125 | (0.16, 0, 0) |
| 123 | 0.68 | Mega | 0.125 | (0.16, 0, 0) |
| 283 | 0.75 | A-Lister | 0.125 | (0.50, 0, 0) |
| with a final polarity score of 0.26 (P) | ||||
| 608 | 0.26 | Micro | 0.80 | (0.5, 0, 0) |
| 473 | 0.44 | Macro | 0.80 | (0.89, 0, 0) |
| 328 | 0.72 | Mega | 0.80 | (0.93, 0.83, 0.84) |
| 285 | 0.92 | A-Lister | 0.80 | (0.93, 0, 0) |
| with a final polarity score of 0.82 | ||||
| User # | Polarity Score (TextBlob) | Users’ Weights (ANN) | Polarity Score (Using Our Proposed NL Model) | |
|---|---|---|---|---|
| 13 | 0.25 | 0.00 | (0.00, 0.07, 0.07) | N or WP |
| 23 | 0.25 | 0.29 | (0.00, 0.06, 0.06) | N or WP |
| 159 | 0.25 | 0.73 | (0.3, 0.84, 0.84) | P or SP |
| 44 | 0.8 | 0.33 | (0.68, 0.84, 0.84) | P or SP |
| 282 | 0.383 | 0.68 | (0.68, 0.85, 0.85) | P or SP |
| 119 | 0.7 | 0.15 | (0.15, 0.31, 0.31) | WP or P |
| 415 | 0.7 | 0.23 | (0.15, 0.29, 0.29) | WP or P |
| 232 | 0.7 | 0.73 | (0.89, 0.75, 0.75) | SP or P |
| 388 | 0.357 | 0.73 | (0.90, 0.30, 0.30) | SP or P |
| The Traditional Opinion Elements | The Proposed Opinion Elements |
|---|---|
| (World Football Cup, Africa, 0.8, User#1, July 19) | (World Football Cup, Africa, 0.5, User#1, Micro, July 19) |
| (World Football Cup, −0.7, User#911, July 18) | (World Football Cup, −0.15, User#911, Micro, July 18) |
| (World Football Cup, goal, 0.6, User#896, July 18) | (World Football Cup, goal, 0.5, User#896, Macro, July 18) |
| (World Football Cup, Croatia, −0.1, User#560, July 18) | (World Football Cup, Croatia, −0.16, User#560, Macro, July 18) |
| (World Football Cup, Messi, −0.4, User#214, July 18) | (World Football Cup, Messi, −0.5, User#214, Mega, July 18) |
| (World Football Cup, User#345, 0.1, July 18) | (World Football Cup, User#345, 0.15, Mega, July 18) |
| (World Football Cup, games, 0.4, User#1047, July 11) | (World Football Cup, games, 0.91, User#1047, A-Lister, July 11) |
| (World Football Cup, South Korea game, −0.1, User#1002, June 18) | (World Football Cup, South Korea game, −0.5, User#1002, A-Lister, Jun 18) |
Publisher’s Note: MDPI stays neutral with regard to jurisdictional claims in published maps and institutional affiliations. |
© 2022 by the authors. Licensee MDPI, Basel, Switzerland. This article is an open access article distributed under the terms and conditions of the Creative Commons Attribution (CC BY) license (https://creativecommons.org/licenses/by/4.0/).
Share and Cite
Essameldin, R.; Ismail, A.A.; Darwish, S.M. Quantifying Opinion Strength: A Neutrosophic Inference System for Smart Sentiment Analysis of Social Media Network. Appl. Sci. 2022, 12, 7697. https://doi.org/10.3390/app12157697
Essameldin R, Ismail AA, Darwish SM. Quantifying Opinion Strength: A Neutrosophic Inference System for Smart Sentiment Analysis of Social Media Network. Applied Sciences. 2022; 12(15):7697. https://doi.org/10.3390/app12157697
Chicago/Turabian StyleEssameldin, Reem, Ahmed A. Ismail, and Saad M. Darwish. 2022. "Quantifying Opinion Strength: A Neutrosophic Inference System for Smart Sentiment Analysis of Social Media Network" Applied Sciences 12, no. 15: 7697. https://doi.org/10.3390/app12157697
APA StyleEssameldin, R., Ismail, A. A., & Darwish, S. M. (2022). Quantifying Opinion Strength: A Neutrosophic Inference System for Smart Sentiment Analysis of Social Media Network. Applied Sciences, 12(15), 7697. https://doi.org/10.3390/app12157697