Article

Growth of Microalgae-Bacteria Flocs for Nutrient Recycling from Digestate and Liquid Slurry and Methane Production by Anaerobic Digestion

1
Laboratory of Reactions and Process Engineering, University of Lorraine, 54000 Nancy, France
2
Laboratory of Microbial Ecology and Technology, National Institute of Applied Sciences and Technology, University of Carthage, Tunis 1080, Tunisia
*
Author to whom correspondence should be addressed.
Appl. Sci. 2022, 12(15), 7634; https://doi.org/10.3390/app12157634
Submission received: 2 May 2022 / Revised: 13 July 2022 / Accepted: 22 July 2022 / Published: 28 July 2022
(This article belongs to the Special Issue Anaerobic Digestion Processes for Wastewater Treatment)

Abstract

:
Biogas production by anaerobic digestion from different wastes represents a growing interest in the panel of renewable energy. Digestate has already been a subject of numerous studies as part of microalgal culturing because it is still rich in nutrients. This study wants to use it as a reference to investigate the possibility to exploit Slurry for the same applications. The first part of this research aims to evaluate microalgae-bacterial flocs growth for nutrient recycling from liquid digestate and slurry, working at three different dilutions (10%, 30%, and 50%) of these two substrates, in order to determine the best value for nutrients and pollutants removal (ammonia and chemical oxygen demand removal rate) and microalgae-bacterial biomass production (autotrophic index). The best dilutions were 30% for digestate and 10% for slurry, allowing the highest ammonia and chemical oxygen demand removal rates. The second part evaluated methane production during anaerobic digestion at different ratios of substrate/inoculum (0.2, 0.5, and 0.8), using microalgae-bacterial flocs as a substrate and digestate or slurry as the inoculum. After 30 days, the anaerobic digestion without flocs showed the best performance compared to digestion with flocs (726.7 mL CH4·g−1 slurry, 245.6 mL CH4·g−1 digestate), whereas, for flocs digestion, the best ratio for both inocula was 0.2 substrate/inoculum with 317.2 mL CH4·g−1 slurry and 165.7 mL CH4·g−1 digestate. All solid masses are expressed in terms of volatile solids (VS).

1. Introduction

Energy transition today requires a real increase in the proportion of renewable energies in the global energy mix in order to use fewer fossil fuels, generate less waste, and respect the environment more, particularly aquatic resources. The production of biogas (a mixture of methane and carbon dioxide) by anaerobic digestion from agricultural, industrial, or municipal wastes represents a growing interest in the panel of renewable energy. Indeed, the direct global consumption of biogas was approximately 35 Mtep in 2018. Currently, more than 60% of the biogas production capacity exists in Europe and North America [1].
Several researchers have been particularly interested in algal biomass as a natural feedstock for biogas production by anaerobic digestion, due to the high efficiency of their photosynthetic mechanism in the fixation of atmospheric CO2 and their high growth rates [2]. The biogas production via anaerobic digestion using microalgae as a substrate started in the 1950s in the USA [3], continued with several works during the first and second oil crises of the 1970s, and is prospering today with the current energy challenges, even if the sustainable production of microalgal biomass on an industrial scale still faces difficulties, mainly because of high operating costs and the need for large quantities of water and nutrients [4,5]. As pointed out in several bibliographic references, it is also recognized that microalgae can play an important role in wastewater and effluent bioremediation to reduce the high amounts of organic matter represented by chemical oxygen demand (COD), ammonia nitrogen (NH4-N), and phosphorus (PO4-P), as well as the environmental impact of various contaminants and micropollutants [6,7]. Indeed, wastewater pollutants will be recycled and used as nutrients for algal growth, which reduces the high costs of algal cultures while capturing atmospheric CO2, depolluting wastewater, and in some cases, allowing compliance with discharge standards [8,9,10]. The algal mass produced can thus be used to produce biogas for electricity production or cogeneration [6,11]. It, therefore, appears interesting to couple microalgae culture for wastewater treatment with anaerobic digestion.
In addition, processes using a consortium of microalgae–bacteria (Ma-B), applied to the treatment of industrial and agricultural wastewater, are currently the subject of particular attention [12]. In these systems, symbiotic connections between photo-autotrophic algae and aerobic heterotrophic bacteria are maintained by a simultaneous exchange of gases (O2 and CO2) and nutrients [13]. Thus, during wastewater treatment, this symbiosis avoids an external supply of O2/CO2 and tends to eliminate nutrients as well as reduce CO2 emissions to the atmosphere [12].
As for the production of biogas (and thus biomethane, CH4) by anaerobic digestion, it is strongly influenced by the choice of the substrate but also the inoculum, such as municipal sludge, sediments, industrial effluents, or agricultural wastes such as animal manure and slurry, which contain various bacterial populations [14]. Various studies have demonstrated the efficiency of CH4 production by digesting microalgae with different substrates. Recently, several algal species such as Chlorella spp. and Chroococcus spp. have been selected for their high methane production capacity, [12].
Agricultural effluents include liquid slurry but also the liquid digestate resulting from an anaerobic digester. Both still contain nutrients (organic matter, N, and P), which are essential for the cultivation of microalgae [15,16,17]. Reference [18] reports, for example, that plant liquid digestate has a high nutrient potential for the growth of various photosynthetic microorganisms such as cyanobacteria (Arthrospira maxima), freshwater microalgae (Tetradesmus obliquus; Botryococcus braunii), and marine diatom (Phaeodactylum tricornutum). The literature most often lists studies on the use of microalgae to clean up liquid effluents, mainly municipal wastewater, or studies to evaluate the potential of cultivating microalgae from agricultural effluents.
The objective of the present research is to evaluate the coupling potential of two processes: (1) The symbiotic culture of Ma-B flocs for the depollution of agricultural effluents, and (2) the use of the harvested biomass as a substrate for anaerobic digestion and evaluation of the consequent biogas production. The chosen effluents are cattle slurry and digestate from an agricultural digester in the Grand-East region of France (Bouzule farm). With our experiments, we first wanted to compare the effect of these two effluents, tested as substrates at different dilutions, on the growth of Ma-B flocs and the simultaneous depollution of these effluents. In the second step, we tested three substrate/inoculum ratios (where substrate = Ma-B flocs) and inoculum = agricultural effluent) to identify which maximizes biogas production yields during a batch anaerobic digestion process.

2. Materials and Methods

2.1. Inoculation and Start-Up of the Ma-B Flocs Culture Reactor in Batch Mode

The culture of microalgae-bacteria flocs (Ma-B flocs) was prepared in a double-jacketed batch reactor with a total volume of 1L, using a pre-culture of Ma-B flocs obtained from the sludge of an urban wastewater treatment plant in Tunisia, city of Kairouan. In the reactor, 350 mL from a pre-culture of Ma-B flocs containing 4.4 ± 0.1 g of total suspended solids (TSS) L−1, 2.7 ± 0.1 g of volatile suspended solids (VSS) L−1, and 3.4 ± 0.1 mg of Chlorophyll (a) g−1 (VSS) (Table 1) were mixed with synthetic municipal wastewater (SMW) (Table 2) to obtain a working volume of 900 mL. This multitrophic culture was homogenized by shaking at 100 rpm with a magnetic bar and exposed under a favorable light/dark cycle of 16 h/8 h [19] using fluorescent lamps with a light power of 1050 lm (18W, Philips, France), without additional external O2. The temperature inside the reactor was maintained at 27 °C, a value in the range of optimal growth temperatures for most microalgae [20]. The residence time was 7 days for all experiments (from day T0 to day T7). The pH value of the wastewater was adjusted between 7.0 and 8.3 using sodium bicarbonate. This pH range is suitable for optimal microalgae development and prevents ammonium from transforming into ammonia. To measure TSS, a 50 mL sample was filtered through a pre-weighed glass fiber filter with a pore size of 0.45 μm. The filter was then dried for 24 h in an oven at 105 °C. To measure VSS, the dried filter was burned at 550 °C for 2 h.
The synthetic wastewater employed in this study was prepared as used by [22] with an initial COD concentration of 600 mg·L−1 and 100 mg NH4-N.L−1, values often found in municipal/domestic wastewater (Table 2).

2.2. Characterization of Liquid Digestate and Slurry

Digestate and bovine slurry were collected at “La Bouzule farm” near Nancy, France. From the initial highly loaded effluents, and in order to avoid strong inhibition effects, diluted effluents were prepared to test the effect of dilution on our experiments. The diluted effluents, called “Liquid Digestate 0 (DL0)” and “Liquid Slurry 0 (SL0)”, were obtained after filtration (coffee filters, ∅ pores ≈ 20 μm) of a mixture of 100 g of digestate or slurry in 1 L of distilled water, in order to eliminate most of the particles in the suspension that could limit/inhibit the biological kinetics of the microorganisms and their growth. The substrates were characterized to determine the concentrations of major nutrients in the form of (i) COD, (ii) total NH4-N, and (iii) P-PO4 using the methods adapted to a spectrophotometer type HACH DR 2400, (Germany). These methods’ principles can be described as follows: (i) COD: The organic material is oxidized by a solution containing a known excess of potassium dichromate and mercury sulfate II (to eliminate interference from chloride ions). The reaction takes place in a strong acid medium (sulfuric acid with the addition of silver sulfate as a catalyst) and at reflux for 2h. The determination is performed with the HACH spectrophotometer at a wavelength of 620 nm. (ii) NH4-N was determined via the Nessler method using the same HACH spectrophotometer. In this method, the Nessler reagent (K2HgI4) reacts with NH4+-N present in the sample to produce dimercuriammonium iodide. The addition of a stabilizing agent makes it possible to avoid the interference caused by the calcium and magnesium ions and that of a dispersing agent to support the formation of the color. The measurement wavelength is 425 nm. (iii) Phosphates (PO43−) were also determined with the HACH spectrophotometer using the Phosver 3 kit from HACH (Loveland, CO, USA) for all samples. The determination of PO43− via this method is based on the formation of phosphomolybdic acid after the addition of ammonium molybdate under acidic conditions, followed by the reduction of this acid by ascorbic acid to molybdenum blue. The absorbance of this compound is then measured at 880 nm.
The pH was measured with a conventional pH meter (METTLER Toledo M300a, Columbus, OH, USA).

2.3. Microalgae Growth and Nutrient Recycling from Liquid Digestate and Liquid Slurry

The first set of experiments was developed in batch mode, without external O2 input, to evaluate the performance of microalgae in removing nutrients from diluted slurry and digestate samples. As previously noted, in order to avoid inhibitions, three dilutions were prepared from the initial effluents DL0 and SL0: 1/10, 1/3, and 1/2 noted as 10%, 30%, and 50%, so COD and NH4-N concentrations were approximately equal to or less than those of municipal wastewater taken as a reference, cf. reference [22]. During this series of experiments, Erlenmeyer flasks of a 200 mL working volume, containing liquid substrate, were inoculated with 10% (v/v) Ma-B flocs as inoculum. Erlenmeyer flasks were incubated at 25 °C, under 16/8 h light/dark cycles, and mixed by an orbital shaker at 250 rpm for 14 days.
All experiments were performed in triplicate. Liquid effluents were analyzed daily for COD and NH4-N concentrations. The growth of microalgae was estimated in terms of chlorophyll(a) concentration expressed in mg Chl (a)·g−1 VSS. Indeed, the amount of Chl (a) is related to the dominance of microalgae presence and allows the calculation of the Autotrophic Index (AI) defined as the ratio of non-photosynthetic organic material amounts to live plant (photosynthetic) material amounts. The AI is generally used to qualify surface waters and effluents where high values indicate large amounts of non-photosynthetic organic material [21]. In our case, the AI is used to describe the trophic state of the microalgae-bacteria community and identify the community abundance: Autotrophic or heterotrophic dominance. To interpret our results, we chose to refer to the decrease in the AI value, indicating the evolution towards an autotrophic dominance. The predominance of autotrophic organisms is given by the lower values of AI.
The total concentration of Chlorophyll(a) was obtained after extraction from a 10 mL sample with 10 mL of the methanol solution (1M) for 24 h in darkness at 4 °C. The suspension was centrifuged at 4000 rpm for 15 min. The absorbance was measured with a spectrophotometer (UV-Vis 2550, Shimadzu, Kyoto, Japan) at 652 nm and 665 nm according to the measurement protocol defined by Porra et al. [23]:
Chlorophyll(a) = 16.29 × A665 − 8.54 × A652.
The autotrophic index (mg VSS·mg−1 Chl (a)) was calculated according to Collins et al. [21] to determine the dominance of microorganisms. Specific growth rates (µ) were also calculated using the following equation:
μ = ln ( X t X 0 ) t t 0
where X0 is the concentration of algal biomass measured as the chlorophyll (a) content (mg Chl (a)·g−1VSS) at the initial time (t0) and Xt is the concentration of algal biomass at a specific time (t). Finally, microscopic observations of the morphology of Ma-B flocs were performed using a LEITZ Dialux 20 microscope (Stuttgart, Germany) connected to a SONY color camera (3CCD), Stuttgart, Germany, and then the images of the Ma-B flocs were analyzed using Visilog 6.3 software (French free software) to identify the microalgal communities present in the samples.

2.4. Digestion of Ma-B Flocs for Biogas Production

2.4.1. Sample Preparation and Working Conditions

For the biomethane production step, anaerobic batch digestion of Ma-B flocs was performed in 1L glass bottles. This step of the experiment was conducted by varying 3 different ratios of volatile solids of the substrate (Ma-B flocs)/volatile solids of inoculum (slurry noted SL or digestate noted DL): 0.2, 0.5, and 0.8. The concentration of substrate (Ma-B flocs) was set at 12.2 ± 0.1 gVS·g−1 with a substrate/inoculum ratio (S/I ratio) of 0.2. Initially, inocula were aseptically introduced into the glass bottle, followed by the addition of Ma-B flocs substrate, and then filled to 800 mL with distilled water. The associated control consisted of inoculum only, without the addition of flocs. The glass bottles, hermetically sealed, were first purged with N2 gas, then incubated at 40 °C, for 30 days, which is the duration generally used to properly explore the potential for anaerobic digestion.

2.4.2. Measurement of Biomethane Production

The measurement of the volume of biogas produced, as well as its composition, was performed every day to monitor the evolution of biogas production. The biogas volume production was measured by the acidic water displacement method (a chloridic acid solution at pH ≈ 4.0 prepared from a 37% concentrated one) in a test tube every 24 h. Indeed, the use of acidic water avoids the loss of CO2 due to its high solubility in water. The composition of the biogas (CH4 and CO2) was analyzed using a Varian 430-GC gas chromatograph, USA. The detector of this chromatography is a thermal conductivity detector (TCD), the column is the capillary column Varian® GC CP-Carboplot 25 m (L) × 0.53 mm (inner diameter) × 25 μm (film thickness), coated with a layer of carbon particles of 0.2–1 μm in size. Samples of 100 μL of biogas gas phase were extracted from the bottles by syringe and injected into the gas chromatograph. The pressure in the injector was 15 psi, the carrier gas was argon (≥99.999% of purity) at a flow rate of 6 mL.min−1, and the temperature of the detector was set at 180 °C. Each analysis lasted 7.50 min, and the temperature increase program was as follows: 60 °C from 0 to 2 min, rise to 110 °C between 2 and 3 min at a rate of 20 °C min−1, then 110 °C from 3 min to 7.5 min. Calibration was carried out beforehand with the following standards: Nitrogen, Oxygen, Methane, Carbon dioxide, and Sulfuric acid. All standards were from MESSER (Bad Soden am Taunus, Germany) and had a purity of 99.999%.
Methane production over the incubation period was measured in terms of cumulative daily production, given by the quotient between the volume of gas produced in milliliters and grams of VS of the fed substrate.

2.5. Statistical Analysis

All tests of COD, NH4-N, TSS, VSS, and Chlorophyll(a) were performed in triplicate since the repeatability analysis is one possible method to assess the accuracy of measurements. Results are presented as replicate means plus standard deviation (mean ± SD).

3. Results and Discussion

3.1. Biomass Production of Ma-B Flocs during Batch Culture

The Ma-B flocs biomass was harvested by gravity settling of the batch culture after 7 days. It represented 4.6 ± 0.2 g of total suspended solids (TSS) L−1, 2.8 ± 0.2 g of volatile suspended solids (VSS) L−1, and 4.5 ± 0.2 mg of Chlorophyll (a) g−1 (VSS) (Table 1). The autotrophic index (AI) decreased by approximately 23.5% from the initial value of 288.8 ± 0.1 to 220.8 ± 0.2 after 7 days. This result confirms the autotrophic prevalence of the microalgae suspension.

3.2. Characteristics of Liquid Digestate and Slurry When Used for Ma-B Flocs Growth

3.2.1. Nutrient and Pollutant Concentrations of Liquid Digestate and Slurry

Prior to the phytoremediation experiments, the liquid digestate (DL) and the liquid slurry (SL) were analyzed for their concentrations of nutrients (NH4-N) and organic compounds (COD) (Table 3). It was observed that the initial solutions DL0 and SL0 were very rich in ammonium, more than the synthetic wastewater used as a control. Thus, we chose to operate at dilutions of these initial solutions in order to allow adequate growth of the microalgae and limit the inhibition phenomena. The total concentrations of NH4-N and COD are presented in Table 3 for the three dilutions (10%, 30%, and 50%). Note that after dilution, the initial characteristics of DL50% are similar in COD and NH4-N to those of the synthetic wastewater. The COD and NH4-N concentrations of the liquid slurry were also the highest without dilution. The same dilutions were prepared and tested.

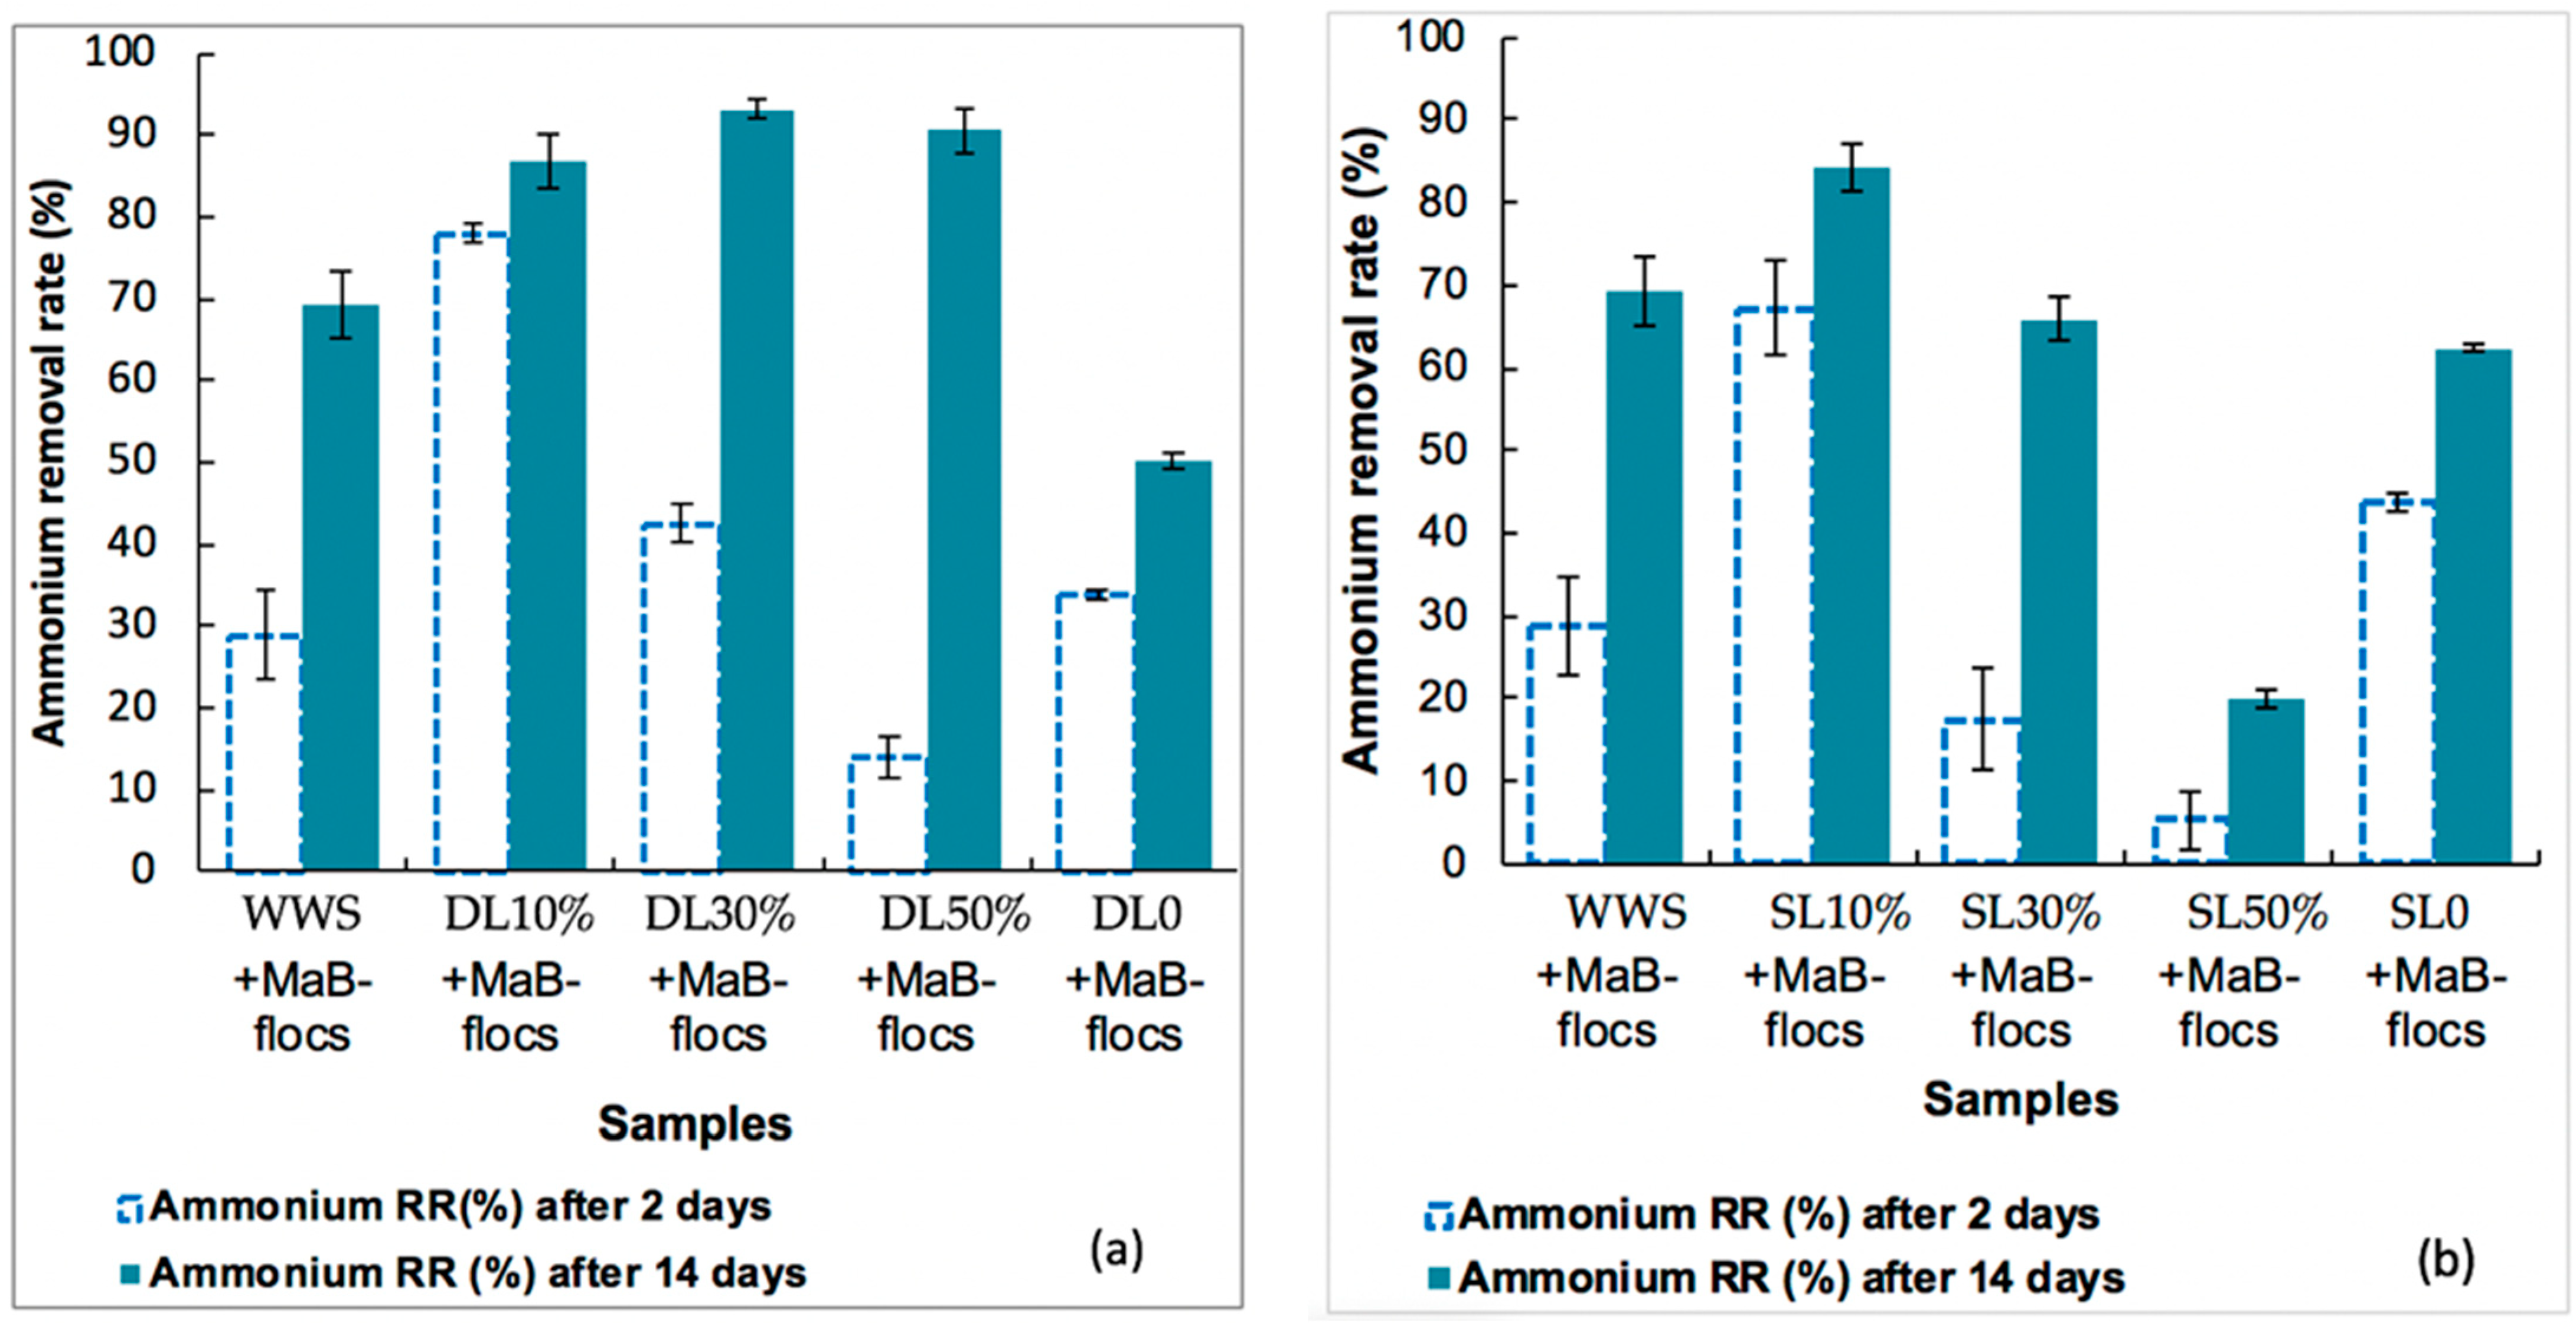
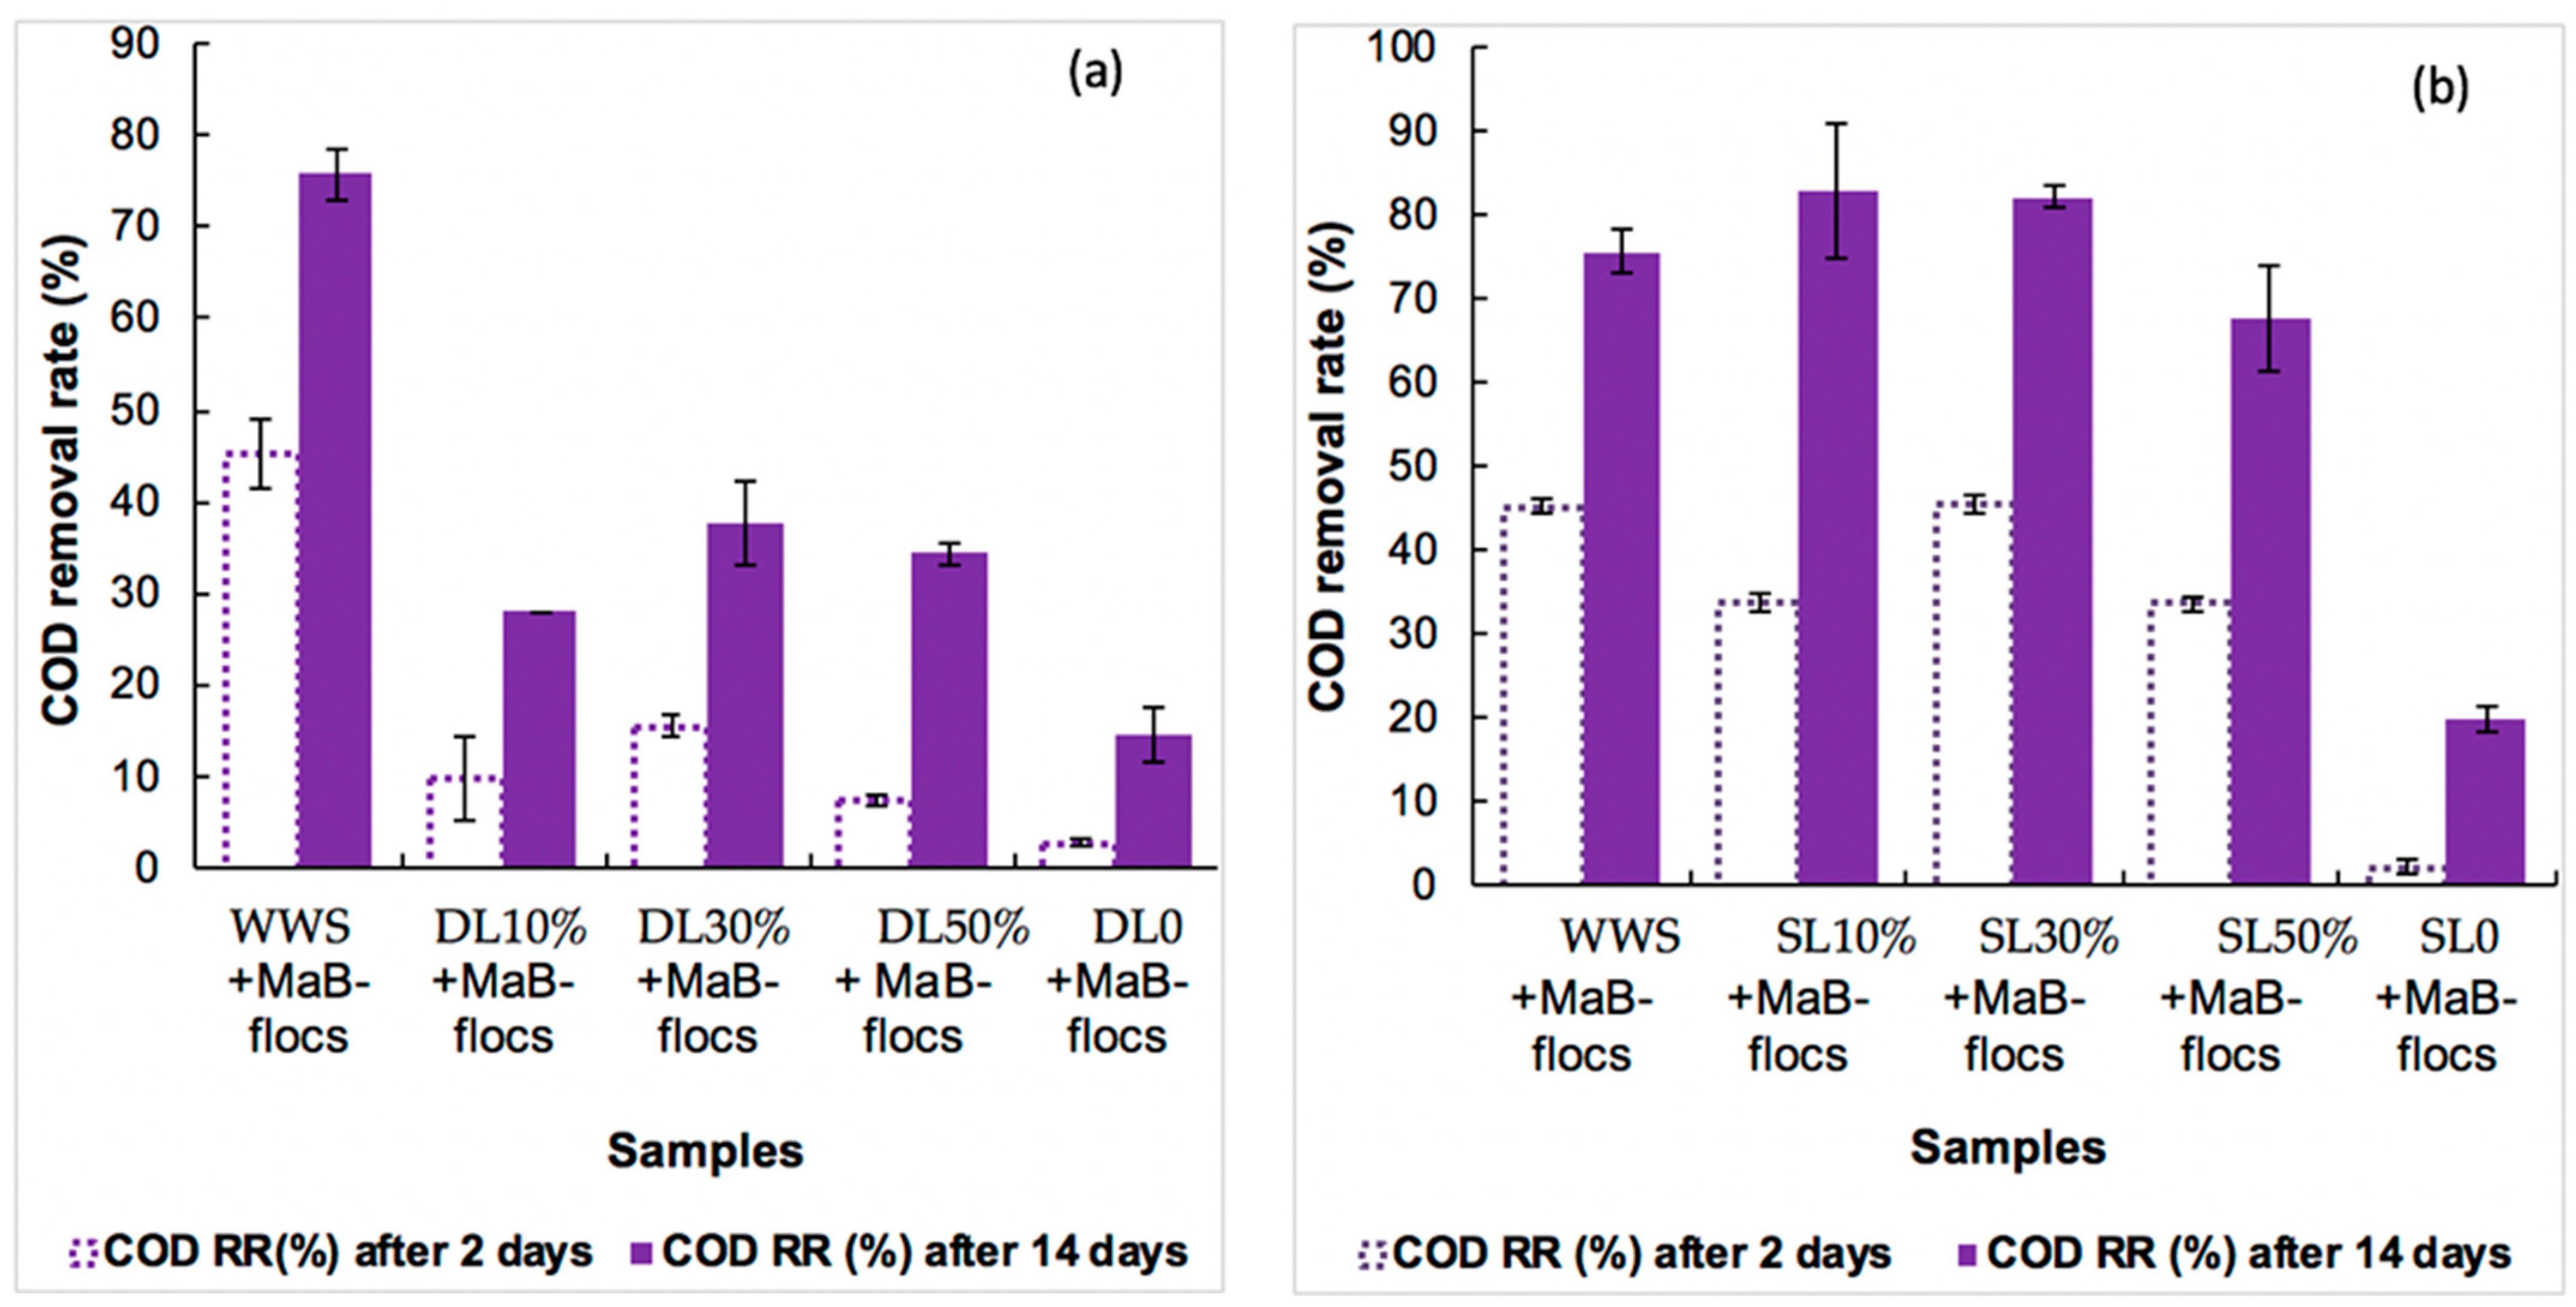
3.2.2. Phytoremediation of Liquid Digestate and Slurry: COD and Ammonium Removal

Ammonium removal occurs through several mechanisms: Nitrification, denitrification through microalgae-bacteria populations, and ammonia volatilization. The pH values affect the ammonium removal process. In our case, the pH was approximately 8 during the 14 days of batch culture, which would have caused the volatilization of some of the ammonia.
The ammonium removal efficiency was evaluated for each substrate between day 2 and day 14, as shown in Figure 1a,b. The ammonium removal efficiencies for the two initial substrates DL0 and SL0 at the end of the culture were approximately 50.2 ± 1.0% and 62.4 ± 0.5%, respectively. These values are low compared to the control with synthetic waste products (approximately 69 ± 3%) and to what can be read in the literature. This would be due to the high initial concentrations of NH4-N varying between 192.6 and 129.1 mg·L−1 for DL0 and SL0, respectively (Table 3), which could induce an inhibitory or even toxic effect on the growth of Ma-B flocs. Indeed, the thresholds of toxicity for NH4-N depend on the microalgae species. According to [24], different microalgal communities adapt to different ammonium concentrations, such as Chlorophyceae (140 mg·L−1), Cyanophyceae (45 mg·L−1), and Diatomophyceae (6 mg·L−1). The toxicity thresholds for these species are 702, 234, and 65 mg·L−1. Further results showed a high capacity of Ma-B flocs to remove ammonium from DL30%, with a removal efficiency of 93 ± 1.1% after 14 days starting from an initial NH4-N concentration of 51.1 mg·L−1 (Figure 1a).
Interestingly, the highest removal rate corresponding to day 14 achieved by DL30% agrees with the work of Prajapati et al. [13], who worked with nitrates as a nitrogen source. Thus, the dilution of liquid digestate to 30% can be recommended as an effective growth medium for algae provided that initial concentrations are equivalent and that no pollutants or micropollutants are toxic to biological growth.
For liquid slurry, the best NH4-N removal rate by Ma-B flocs was 84.0 ± 2.9% for SL10% at the end of the culture (Figure 1b). The results suggest that the removal efficiency increases as the nitrogen concentration decreases in the effluent.
Figure 2 shows that the lowest removal efficiencies were observed on the initial samples of DL0 (14.8 ± 2.9%) and SL0 (20.0 ± 1.3%), which is believed to be due to their high COD content (1184 mg·L−1 and 1337 mg·L−1, respectively (Table 3)) resulting in toxicity to Ma-B flocs. On the other hand, high COD removal efficiencies were observed for SL10% and SL30% diluted slurry cases: Approximately 83.1 ± 6.0% and 82.3 ± 1.0%, respectively, and are higher than the control efficiency with synthetic wastewater (approximately 75.7 ± 2.0%). The highest value for the digestate trials was, at best, approximately 37.7 ± 4.0% for DL30% and is very low compared to the control yield with synthetic wastewater (approximately 75.7 ± 2.0%). For Ma-B flocs, highly diluted liquid slurry appears to represent a suitable growth medium, although COD concentrations are lower than those of the reference synthetic wastewater (SWW). The better results obtained with liquid slurry effluent can be explained as follows: The slurry collected from the farm had a less dense liquid consistency than the digestate. This aspect could affect the removal performance because the nutrients would be easier to assimilate by the Ma-B flocs, and therefore the release of CO2 (by heterotrophic bacteria), which is essential for the growth of microalgae, is increased [25,26]. On the other hand, the less intense brown coloration of the slurry favors better photosynthetic growth of microalgae. In the literature, filtration and/or centrifugation steps, in addition to dilution, are often recommended to reduce the color intensity of this kind of effluent [5,17]. This could be judicious in the case of our digestate.

3.2.3. Ma-B Flocs Growth and Biomass Productivity on Liquid Digestate and Slurry

The culture of Ma-B flocs was tested by monitoring the growth rate measured on day−1 (d−1), as shown in Table 4, for liquid digestate and slurry solutions, considered as growth media. The comparison of Ma-B flocs productivity values, based on the variation of g VSS.L−1, was performed at different dilutions of DL and SL (10%, 30%, and 50%) during 14 days of batch culture. The lowest productivities were observed for the initial liquid digestate and slurry solutions, without dilution, with values of 0.011 ± 0.031 d−1 and 0.017 ± 0.012 d−1, respectively (Table 4). The high ammonium and COD concentrations (Table 3) could be the main cause of the reduced productivity due to a toxicity effect.
According to the data in Table 4, the highest growth rate for liquid digestate effluent corresponds to a 30% dilution and is worth 0.024 ± 0.021 d−1. Indeed, the liquid digestate collected from the anaerobic digestion of agricultural waste would have favored the cultivation of photosynthetic algae (Tetradesmus obliquus) and cyanobacteria (Arthrospira maxima) due to the availability of nitrogen, as cited by [18]. Another study showed that when using liquid digestate diluted to 30%, the biomass concentration of the microalgae Chroococcus sp. Reaches its optimal value with a value of 0.79 ± 0.06 g·L−1 [13]. For the case of experiments with slurry, the biomass productivity reached 0.028 ± 0.022 d−1 for SL10%, which is higher than those fed with DL30% and other dilutions. The two dilutions of SL10% and DL30% are therefore the most interesting.
Microalgae biomass productivity, as indicated by the change in mg Chl (a)·g−1 VSS in the DL30%, SL10%, initial DL0, and SL0 trials and in comparison to synthetic wastewater, is shown in Figure 3a,b.
When algae were grown at 51.1 mg NH4-N·L−1, contained in the DL30% test, the total Chl (a) content increased from 1.4 ± 0.01 mg Chl (a)·g−1 VSS to 2.67 ± 0.01 mg Chl (a)·g−1 VSS (Figure 2) at the end of the culture. The ammonium concentration of 192.6 mg NH4-N.L−1 in DL0 (Table 4) seems to have resulted in a decrease in biomass productivity and a lower Chlorophyll (a) value of 1.87 ± 0.02 mg·g−1 VSS, which is also lower than the control test with synthetic wastewater, due to an inhibition effect. Ref. [27] also reports this inhibitory effect of ammonium concentration in pig manure digest on chlorophyll (a) production by algae. In our results, it is observed that as the total NH4-N concentration decreased (14.4 mg·L−1), the algal biomass reached its growth optimum with 2.98 ± 0.04 mg Chl (a)·g−1 VSS on day 14, in the case of the 10% liquid slurry. Thus, the maximum growth rate (0.028 days−1) and maximum Chl (a) concentration (2.98 mg·g−1 VSS) were observed with highly diluted substrate SL10%.
The trophic status of the microalgal-bacterial community is explained by the autotrophic index (AI). In our batch experiments, the decrease in AI confirms the autotrophic abundance of microalgae in the Ma-B flocs inoculum. The lowest values were obtained after 14 days for the effluents SL0, DL0, DL30%, SL10%, and synthetic wastewater. The AI decreased from 711.8 to 374.2 after 14 days of culture in DL30% and to 532.6 for DL0 (Figure 3). The slurry effluent SL10% had the lowest activity index of 335.3, consistent with strong autotrophic dominance, in comparison to the other effluents. In this case, the slurry medium further promoted algal growth in Ma-B flocs and also increased ammonium and COD removal efficiencies.

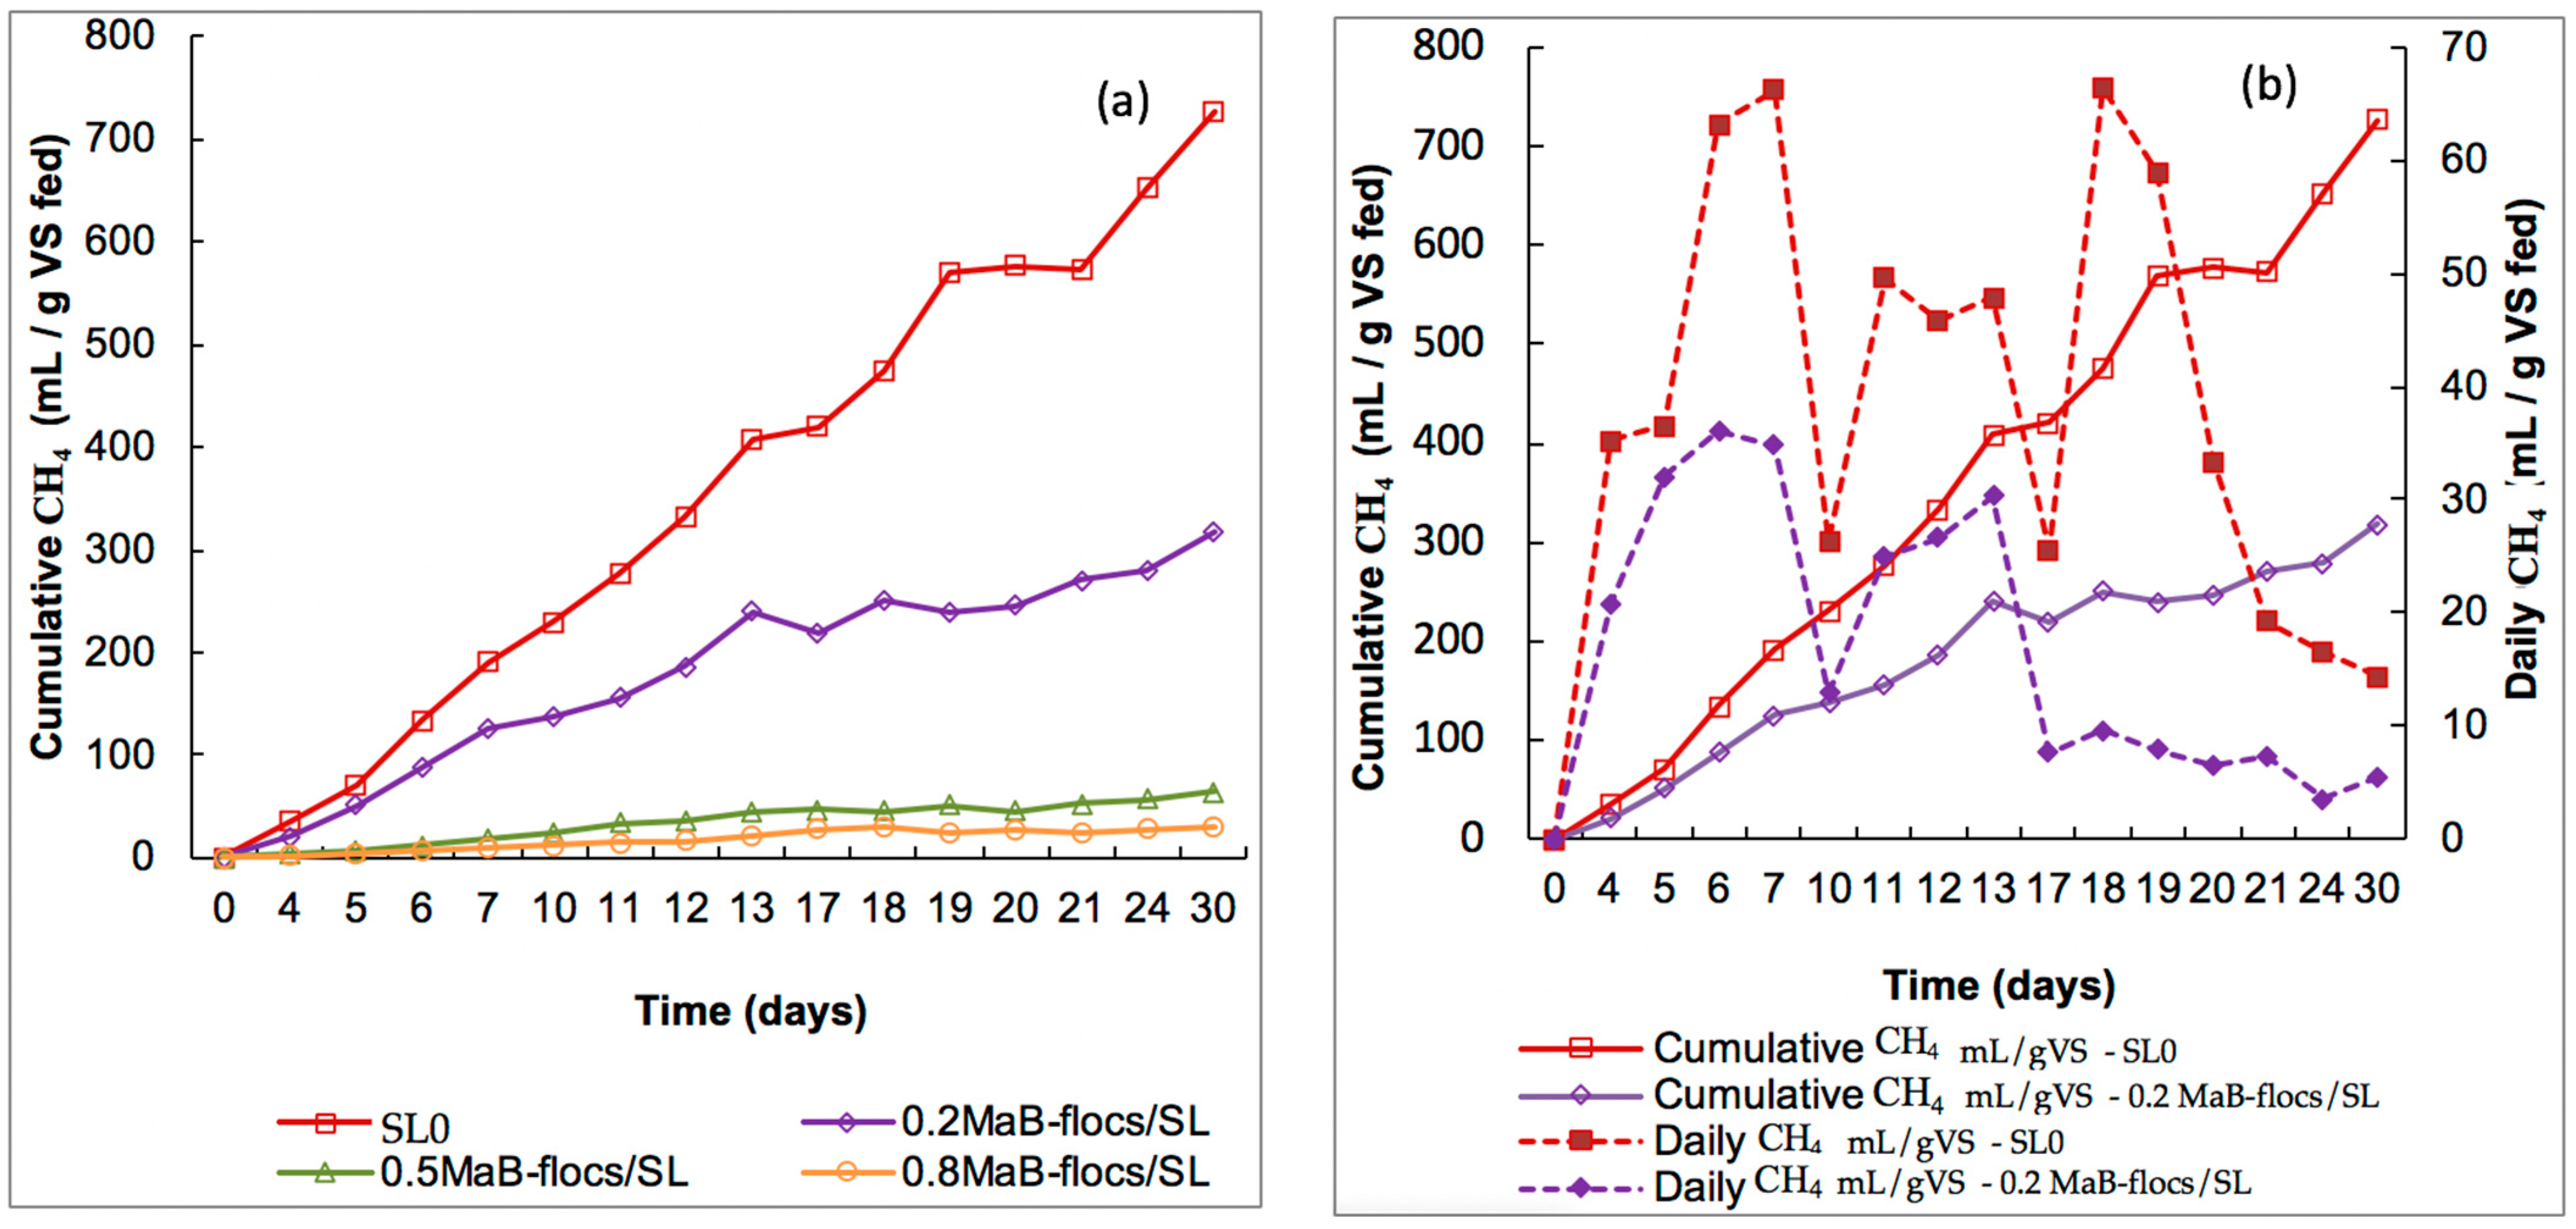
3.3. Production of Biomethane from Microalgae-Bacteria Flocs

Daily and cumulative methane production measurements in batch experiments, presented in Figure 4 and Figure 5, were performed for two inoculums, digestate and slurry, and one substrate, which is Ma-B flocs. The production is noted in terms of mL CH4·g−1VS of the substrate. In addition to a control containing only digestate or slurry, three substrate/inoculum ratios (gVSsubstrate/g VSinoculum) were tested: 0.2, 0.5, and 0.8, where the substrate was Ma-B flocs. Anaerobic digestion was carried out in a mesophilic operation at 38 °C. Cumulative methane production related to these ratios is shown in Figure 4a and Figure 5a below. In all cases, methane production was monitored for 30 days.

Cumulative and Daily Biogas Production for Slurry and Digestate

The cumulative methane yield for the initial biomass (Digestate) reached the highest value of 245.6 mL CH4·g−1 VS substrate after 30 days of operation. However, for mesophilic digestion with Ma-B flocs as the substrate, the CH4 production reached 165.7, 30.9, and 14.3 mL CH4·g−1 VS substrate for the S/I ratio of 0.2, 0.5, and 0.8, respectively, at the end of the batch. According to these data, the highest methane yields were observed at a ratio of 0.2.
Figure 4b shows that daily methane production starts from day 1 and increases to the maximum of 32.2 and 21.9 mL CH4·g−1 VS substrate, respectively, for the digestate control (Dg0) and digestate plus Ma-B flocs digestion at a ratio of 0.2 after only 4 days.
In the case of the slurry control, methane production increased from 35.2 mL CH4·g−1 VS substrate to 726.7 mL CH4·g−1 VS substrate after 30 days, which is significantly higher than the values reported for the digestate control (Figure 4a). With slurry plus Ma-B flocs digestion, the highest cumulative methane yield of 317.2 mL CH4·g−1 VS substrate was reached at a VS substrate (g)/VSinoculum (g) ratio of 0.2. For the 0.5 and 0.8 ratios, due to a higher addition rate of Ma-B flocs to the reaction medium, lower yields of cumulative methane were observed (Figure 4a and Figure 5a). From the daily methane production profiles, various fluctuations were noted in Figure 5b for the slurry inoculum. As assumed by [13], these fluctuations could be related to insufficient contact between the anaerobic microbial flora and the substrate. Methane productivity is also influenced by the characteristics and thickness of the cell wall and the macromolecular distribution of the substrate [6]. Thus, the fine structure, high cytoplasmic content, and low resistance to biological degradation of the microalgae cell wall led to an increase in methane volume by anaerobic digestion [28]. In conclusion, slurry gave excellent results compared to the good values obtained for the digestate. It is difficult to find a satisfactory explanation for the better performance of slurry, especially because the composition of slurry is not very different from that of digestate. As indicated by [29], the only significant difference is in dry matter, with 9% for the cattle slurry versus 4.9% for the digestate. Dry matter is considered an indicator of available nutrients because it includes fiber, protein, ash, water-soluble carbohydrates, and lipids, etc. This means that the slurry would contain more nutrients essential for the growth of Ma-B flocs.

4. Conclusions

For the first part of the study, the best performance for cultivating Ma-B flocs was obtained by digestate diluted to 30%, with 93 ± 1.1% for ammonium removal and 37.7 ± 4.0% for COD removal, and by slurry diluted to 10% with 84 ± 2.9% for ammonium removal and 83.1 ± 6.0% for COD removal. A higher dilution seems to give the most advantageous effect, likely due to greater access of Ma-B flocs to nutrients and light, as mentioned before. Regarding anaerobic digestion, for both slurry and digestate controls, the best results of methane production after 30 days were achieved by slurry with 726.7 mL CH4·g−1 VS substrate compared to 245.6 mL CH4·g−1 VS substrate for the digestate). Digestion with Ma-B flocs at different ratios showed that the best results were with a ratio of 0.2 with 317.2 mL CH4·g−1 VS substrate compared to 165.7 mL CH4·g−1 VS substrate. However, in both cases of slurry or digestate used as the inoculum, methane production did not reach high values after 30 days. The anaerobic digestion of Ma-B flocs is then proven, but further studies should question these results to determine the favorable conditions for better biogas production by Ma-B flocs.

Author Contributions

Conceptualization, O.B. and N.A.; methodology, O.B. and N.A.; validation, N.A., S.P. and H.-Z.L. formal analysis, O.B., N.A., S.P. and H.-Z.L.; investigation, O.B.; resources, O.B. and N.A.; data curation, O.B., N.A., S.P. and H.-Z.L.; writing—original draft preparation, O.B.; writing—review and editing, N.A.; visualization, N.A., S.P. and H.-Z.L.; supervision, N.A., S.P. and H.-Z.L. All authors have read and agreed to the published version of the manuscript.

Funding

This research received no external funding.

Institutional Review Board Statement

Not applicable.

Informed Consent Statement

Not applicable.

Data Availability Statement

Part of the data related to this manuscript can be found via this link: http://docnum.univ-lorraine.fr/public/DDOC_T_2018_0289_BEJI.pdf (accessed on 20 April 2022).

Conflicts of Interest

The authors declare no conflict of interest.

References

  1. OIES (The Oxford Institute for Energy Studies). A Mountain to Climb? Tracking Progress in Scaling Up Renewable Gas Production in Europe. 2019. Available online: //www.oxfordenergy.org/publications/a-mountain-to-climb-tracking-progress-in-scaling-up-renewable-gas-production-in-europe/?v=11aedd0e4327 (accessed on 14 April 2022).
  2. Šoštaric, M.; Golob, J.; Bricelj, M.; Klinar, D.; Pivec, A. Studies on the growth of Chlorella vulgaris in culture media with different carbon sources. Chem. Biochem. Eng. 2009, 23, 471–477. [Google Scholar]
  3. Golueke, C.G.; Oswald, W.J.; Gotass, H.B. Anarobic digestion of algae. Appl. Microbiol. 1957, 5, 47–55. [Google Scholar] [CrossRef]
  4. Herold, C.; Ishika, T.; Nwoba, E.G.; Tait, S.; Ward, A.; Moheimani, N.R. Biomass production of marine microalga Tetraselmis suecica using biogas and wastewater as nutrients. Biomass Bioenergy 2021, 145, 105945. [Google Scholar] [CrossRef]
  5. Zielinski, M.; Debowski, M.; Kazimierowicz, J. Outflow from a Biogas as a medium for Microalgae biomass cultivation—Pilot scale study and technical concept of a large-sclae installation. Energies 2022, 15, 2912. [Google Scholar] [CrossRef]
  6. Wieczorek, N.; Kucuker, M.A.; Kuchta, K. Microalgae-bacteria flocs (MaB-Flocs) as a substrate for fermentative biogas production. Bioresour. Technol. 2015, 194, 130–136. [Google Scholar] [CrossRef]
  7. Shahid, A.; Malik, S.; Zhu, H.; Xu, J.; Nawaz, M.Z.; Nawaz, S.; Alam, M.A.; Mehmood, M.A. Cultivating microalgae in wastewater for biomass production, pollutant removal and atmospheric carbon mitigation: A review. Sci. Total Environ. 2020, 704, 135303. [Google Scholar] [CrossRef]
  8. Debowski, M.; Zielinski, M.; Grala, A.; Dudek, M. Algae biomass as an alternative substrate in biogas production technologies—Review. Renew. Sustain. Energy Rev. 2013, 27, 596–604. [Google Scholar] [CrossRef]
  9. Mahdy, A.; Mendez, L.; Ballesteros, M.; González-Fernández, C. Algaculture integration in conventional wastewater treatment plants: Anaerobic digestion comparison of primary and secondary sludge with microalgae biomass. Bioresour. Technol. 2015, 184, 236–244. [Google Scholar] [CrossRef]
  10. Franchino, M.; Tigini, V.; Varese, G.C.; Sartor, R.M.; Bona, F. Microalgae treatment removes nutrients and reduces ecotoxicity of diluted piggery digestate. Sci. Total Environ. 2016, 569, 40–45. [Google Scholar] [CrossRef]
  11. Van Den Hende, S.; Laurent, C.; Bégué, M. Anaerobic digestion of microalgal bacterial flocs from a raceway pond treating aquaculture wastewater: Need for a biorefinery. Bioresour. Technol. 2015, 196, 184–193. [Google Scholar] [CrossRef]
  12. Hernández, D.; Riaño, B.; Coca, M.; García-González, M.C. Treatment of agro- industrial wastewater using microalgae-bacteria consortium combined with anaerobic digestion of the produced biomass. Bioresour. Technol. 2013, 135, 598–603. [Google Scholar] [CrossRef] [PubMed]
  13. Gutzeit, G.; Lorch, D.; Weber, A.; Engels, M.; Neis, U. Bioflocculent algal-bacterial biomass improves low-cost wastewater treatment. Water Sci. Technol. 2005, 52, 9–18. [Google Scholar] [CrossRef] [PubMed]
  14. Elbeshbishy, E.; Nakhla, G.; Hafez, H. Biochemical methane potential (BMP) of food waste and primary sludge: Influence of inoculum pre-incubation and inoculum source. Bioresour. Technol. 2012, 110, 18–25. [Google Scholar] [CrossRef] [PubMed]
  15. Prajapati, S.K.; Kumar, P.; Malik, A.; Vijay, V.K. Bioconversion of algae to methane and subsequent utilization of digestate for algae cultivation: A closed loop bioenergy generation process. Bioresour. Technol. 2014, 158, 174–180. [Google Scholar] [CrossRef]
  16. Hidaka, T.; Takabe, Y.; Tsumori, J.; Minamiyama, M. Characterization of microalgae cultivated in continuous operation combined with anaerobic co-digestion of sewage sludge and microalgae. Biomass Bioenergy 2017, 99, 139–146. [Google Scholar] [CrossRef]
  17. Huang, L.; Liu, J.; Li, Q.; Wang, C.; Wu, K.; Wang, C.; Zhao, X.; Yin, F.; Liang, C.; Zhang, W. A review of biogas slurry treatment technology based on microalgae cultivation. Environ. Sci. Health 2022, 25, 100315. [Google Scholar] [CrossRef]
  18. Massa, M.; Buono, S.; Langellotti, A.L.; Castaldo, L.; Martello, A.; Paduano, A.; Fogliano, V. Evaluation of anaerobic digestates from different feedstocks as growth media for Tetradesmus obliquus, Botryococcusbraunii, Phaeodactylumtricornutum and Arthrospira maxima. New Biotechnol. 2017, 36, 8–16. [Google Scholar] [CrossRef]
  19. Jia, H.; Yuan, Q. Nitrogen removal in photo sequence batch reactor using algae-bacteria consortium. J. Water Process Eng. 2018, 26, 108–115. [Google Scholar] [CrossRef]
  20. Yadav, G.; Sen, R. Microalgal green refinery concept for biosequestration of carbon-dioxide vis-à-vis wastewater remediation and bioenergy production: Recent technological advances in climate research. J. CO2 Util. 2017, 17, 188–206. [Google Scholar] [CrossRef]
  21. Collins, G.; Weber, C.I. Biological Field and Laboratory Methods for Measuring the Quality of Surface Waters and Effluents; 670/4/73/001; U.S. Environmental Protection Agency: Washington, DC, USA, 1973. [Google Scholar]
  22. Huang, W.; Li, B.; Zhang, C.; Zhang, Z.; Lei, Z.; Lu, B.; Zhou, B. Effect of algae growth on aerobic granulation and nutrient removal from synthetic wastewater by using sequencing batch reactors. Bioresour. Technol. 2015, 179, 187–192. [Google Scholar] [CrossRef] [Green Version]
  23. Porra, R.J.; Thompson, W.A.; Kriedemann, P.E. Determination of accurate extinction coefficients and simultaneous equations for assaying chlorophylls a and b extracted with four different solvents: Verification of the concentration of chlorophyll standards by atomic absorption spectroscopy. Biochim. Biophys. Acta Bioenerg. 1989, 975, 384–394. [Google Scholar] [CrossRef]
  24. Collos, Y.; Harrison, P.J. Acclimation and toxicity of high ammonium concentrations to unicellular algae. Mar. Pollut. Bull. 2014, 80, 8–23. [Google Scholar] [CrossRef] [PubMed]
  25. González-Fernández, C.; Molinuevo-Salces, B.; García-González, M.C. Nitrogen transformations under different conditions in open ponds by means of microalgae-bacteria consortium treating pig slurry. Bioresour. Technol. 2011, 102, 960–966. [Google Scholar] [CrossRef] [PubMed]
  26. Bohutskyi, P.; Liu, K.; Nasr, L.K.; Byers, N.; Rosenberg, J.N.; Oyler, G.A.; Bouwer, E.J. Bioprospecting of microalgae for integrated biomass production and phytoremediation of unsterilized wastewater and anaerobic digestion centrate. Appl. Microbiol. Biotechnol. 2015, 99, 6139–6154. [Google Scholar] [CrossRef] [PubMed]
  27. Ayre, J.M.; Moheimani, N.R.; Borowitzka, M.A. Growth of microalgae on undiluted anaerobic digestate of piggery effluent with high ammonium concentrations. Algal Res. 2017, 24, 218–226. [Google Scholar] [CrossRef] [Green Version]
  28. Tijani, H.; Abdullah, N.; Yuzir, A. Integration of microalgae biomass in biomethanation systems. Renew. Sustain. Energy Rev. 2015, 52, 1610–1622. [Google Scholar] [CrossRef]
  29. Koblenz, B.; Tischer, S.; Rücknagel, J.; Christen, O. Influence of biogas digestate on density, biomass and community composition of earthworms. Ind. Crops Prod. 2015, 66, 206–209. [Google Scholar] [CrossRef]
Figure 1. Ammonium removal rates (mean value ± SD) evaluated after 2 and 14 days of Ma-B flocs culture for each diluted substrate (a) DL: Liquid Digestate; (b) SL: Liquid Slurry. WWS is a synthetic wastewater control.
Applsci 12 07634 g001
Figure 2. COD removal rates (mean value ± SD) evaluated after 2 and 14 days of Ma-B flocs culture for each diluted substrate. (a) DL: Liquid Digestate; (b) SL: Liquid Slurry. WWS is synthetic wastewater control.
Applsci 12 07634 g002
Figure 3. Ma-B flocs biomass productivity evaluated in terms of mg Chl (a)·g−1 VSS (mean value ± SD) and autotrophic indices after 7 and 14 days of batch culture for different substrates: (a) DL, liquid digestate; (b) SL, liquid slurry (with and without dilution) and synthetic wastewater (WWS) a control.
Applsci 12 07634 g003
Figure 4. (a) Cumulative methane production for digestate control (Dg 0) and different ratios of Ma-B flocs /Digestate (Ma-B flocs/Dg). (b) Daily and cumulative methane production for digestate control (Dg0) and ratio 0.2 Ma-B flocs /Digestate.
Applsci 12 07634 g004
Figure 5. (a) Cumulative methane production from slurry as control and different ratios of Ma-B flocs/Slurry (Ma-B flocs/SL). (b) Daily and cumulative methane production for Slurry control and ratio 0.2 Ma-B flocs /Slurry.
Applsci 12 07634 g005
Table 1. Biomass characteristics of Ma-B flocs after batch culture.
Flocs Biomass Ma-B
Characteristics
TSSVSSAI *Chl (a)
Unitg TSS·L−1g VSS·L−1mg VSS·mg−1 Chl (a)mgChl (a)·g−1 VSS
Batch CultureT04.4 ± 0.12.7 ± 0.1288.8 ± 0.13.4 ± 0.1
T74.6 ± 0.22.8 ± 0.2220.8 ± 0.24.5 ± 0.2
* Autotrophic index represents the quotient between the values of VSS and chlorophyll (a) [21].
Table 2. Composition of synthetic wastewater.
Reagents
(Merck-Sigma Aldrich)
Reagent GradeConcentrations
Organic medium (O) (1L)Glucose≥99.5%600 mg COD.L−150% = 298.4 mg·L−1
Acetate≥95.0%50% = 603.3 mg·L−1
Nutrient medium (N) (1L)N-NH4 (NH4Cl)≥99.5%100 mg·L−1
P-PO4 (KH2PO4)≥99.0%10 mg·L−1
Ca2+ (CaCl2·2H2O)≥93.0%10 mg·L−1
Mg2+ (MgSO4·7H2O)≥99.5%5 mg·L−1
Fe2+ (FeSO4·7H2O)≥99.0%5 mg·L−1
Trace elements
(1mL·L−1)
H3 BO3≥99.5%50 mg·L−1
ZnCl2≥98.0%50 mg·L−1
CuCl2≥99.0%30 mg·L−1
MnSO4·H2O≥99.0%50 mg·L−1
(NH4)6Mo7O24·4H2O≥99.0%50 mg·L−1
AlCl3≥99.0%50 mg·L−1
CoCl2-6H2O≥98.0%50 mg·L−1
NiCl2≥98.0%50 mg·L−1
Table 3. Initial characteristics of liquid digestate and slurry after different dilutions.
ParameterLiquid Digestate (DL)Liquid Slurry (SL)Synthetic Wastewater
DL010%
DL10%
30%
DL30%
50%
DL50%
SL010%
SL10%
30%
SL30%
50%
SL50%
CODs
(mg·L−1)
1184137383.655013371955621034601
Total NH4-N (mg·L−1)192.619.551.186.2129.114.43758.486.7
pH7.48.37
Table 4. Specific growth rate (d−1, mean value ± SD) of batch culture for Ma-B flocs using liquid digestate and slurry (with and without dilution) as culture medium compared to synthetic wastewater.
MediaMa-B Flocs Growth Rate (d−1)
(Mean Value ± SD)
Synthetic Wastewater0.032 ± 0.021
Liquid DigestateDL00.011 ± 0.031
DL10%0.015 ± 0.042
DL30%0.024 ± 0.021
DL50%0.018 ± 0.014
Liquid SlurrySL00.017 ± 0.012
SL10%0.028 ± 0.022
SL30%0.021 ± 0.031
SL50%0.018 ± 0.043
Publisher’s Note: MDPI stays neutral with regard to jurisdictional claims in published maps and institutional affiliations.

