
A Deep Learning Method for Early Detection of Diabetic Foot Using Decision Fusion and Thermal Images

 , , , ,
  , , , ,
  and
and 
Abstract
:1. Introduction
- Proposing a framework for the early detection of diabetic foot based on thermal images;
- Proposing a new decision rule for diabetic foot classification based on thermal images;
- Investigating the best fusion model for a high-accuracy DFU classification system based on pre-trained CNN models.
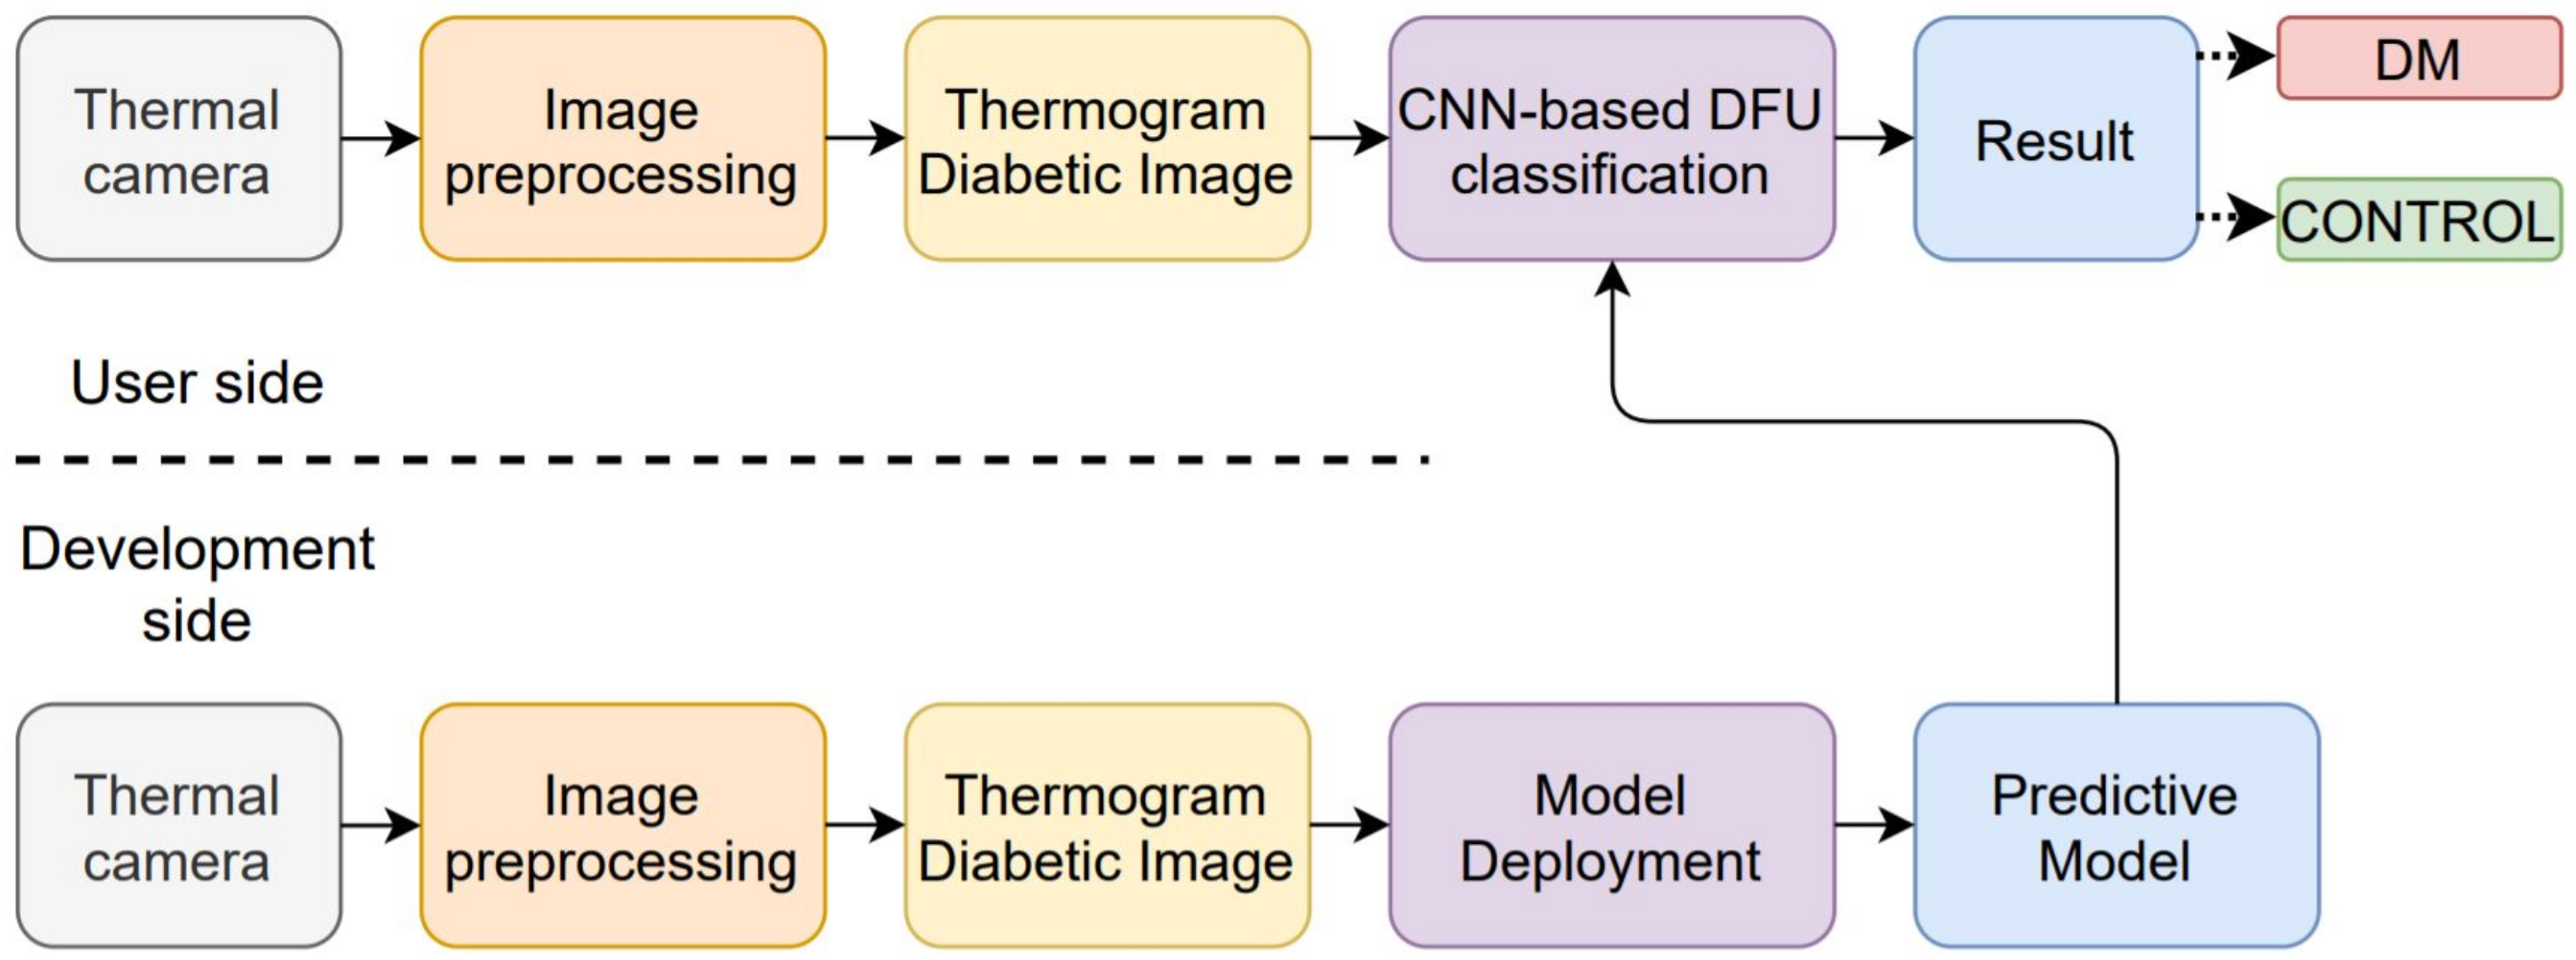
2. Computer-Assisted System for Thermal-Based Diabetic Foot Classification
3. Literature Review
3.1. Convolutional Neural Network Models
3.1.1. ResNet
3.1.2. DenseNet
3.1.3. XceptionNet
3.1.4. MobileNetV2
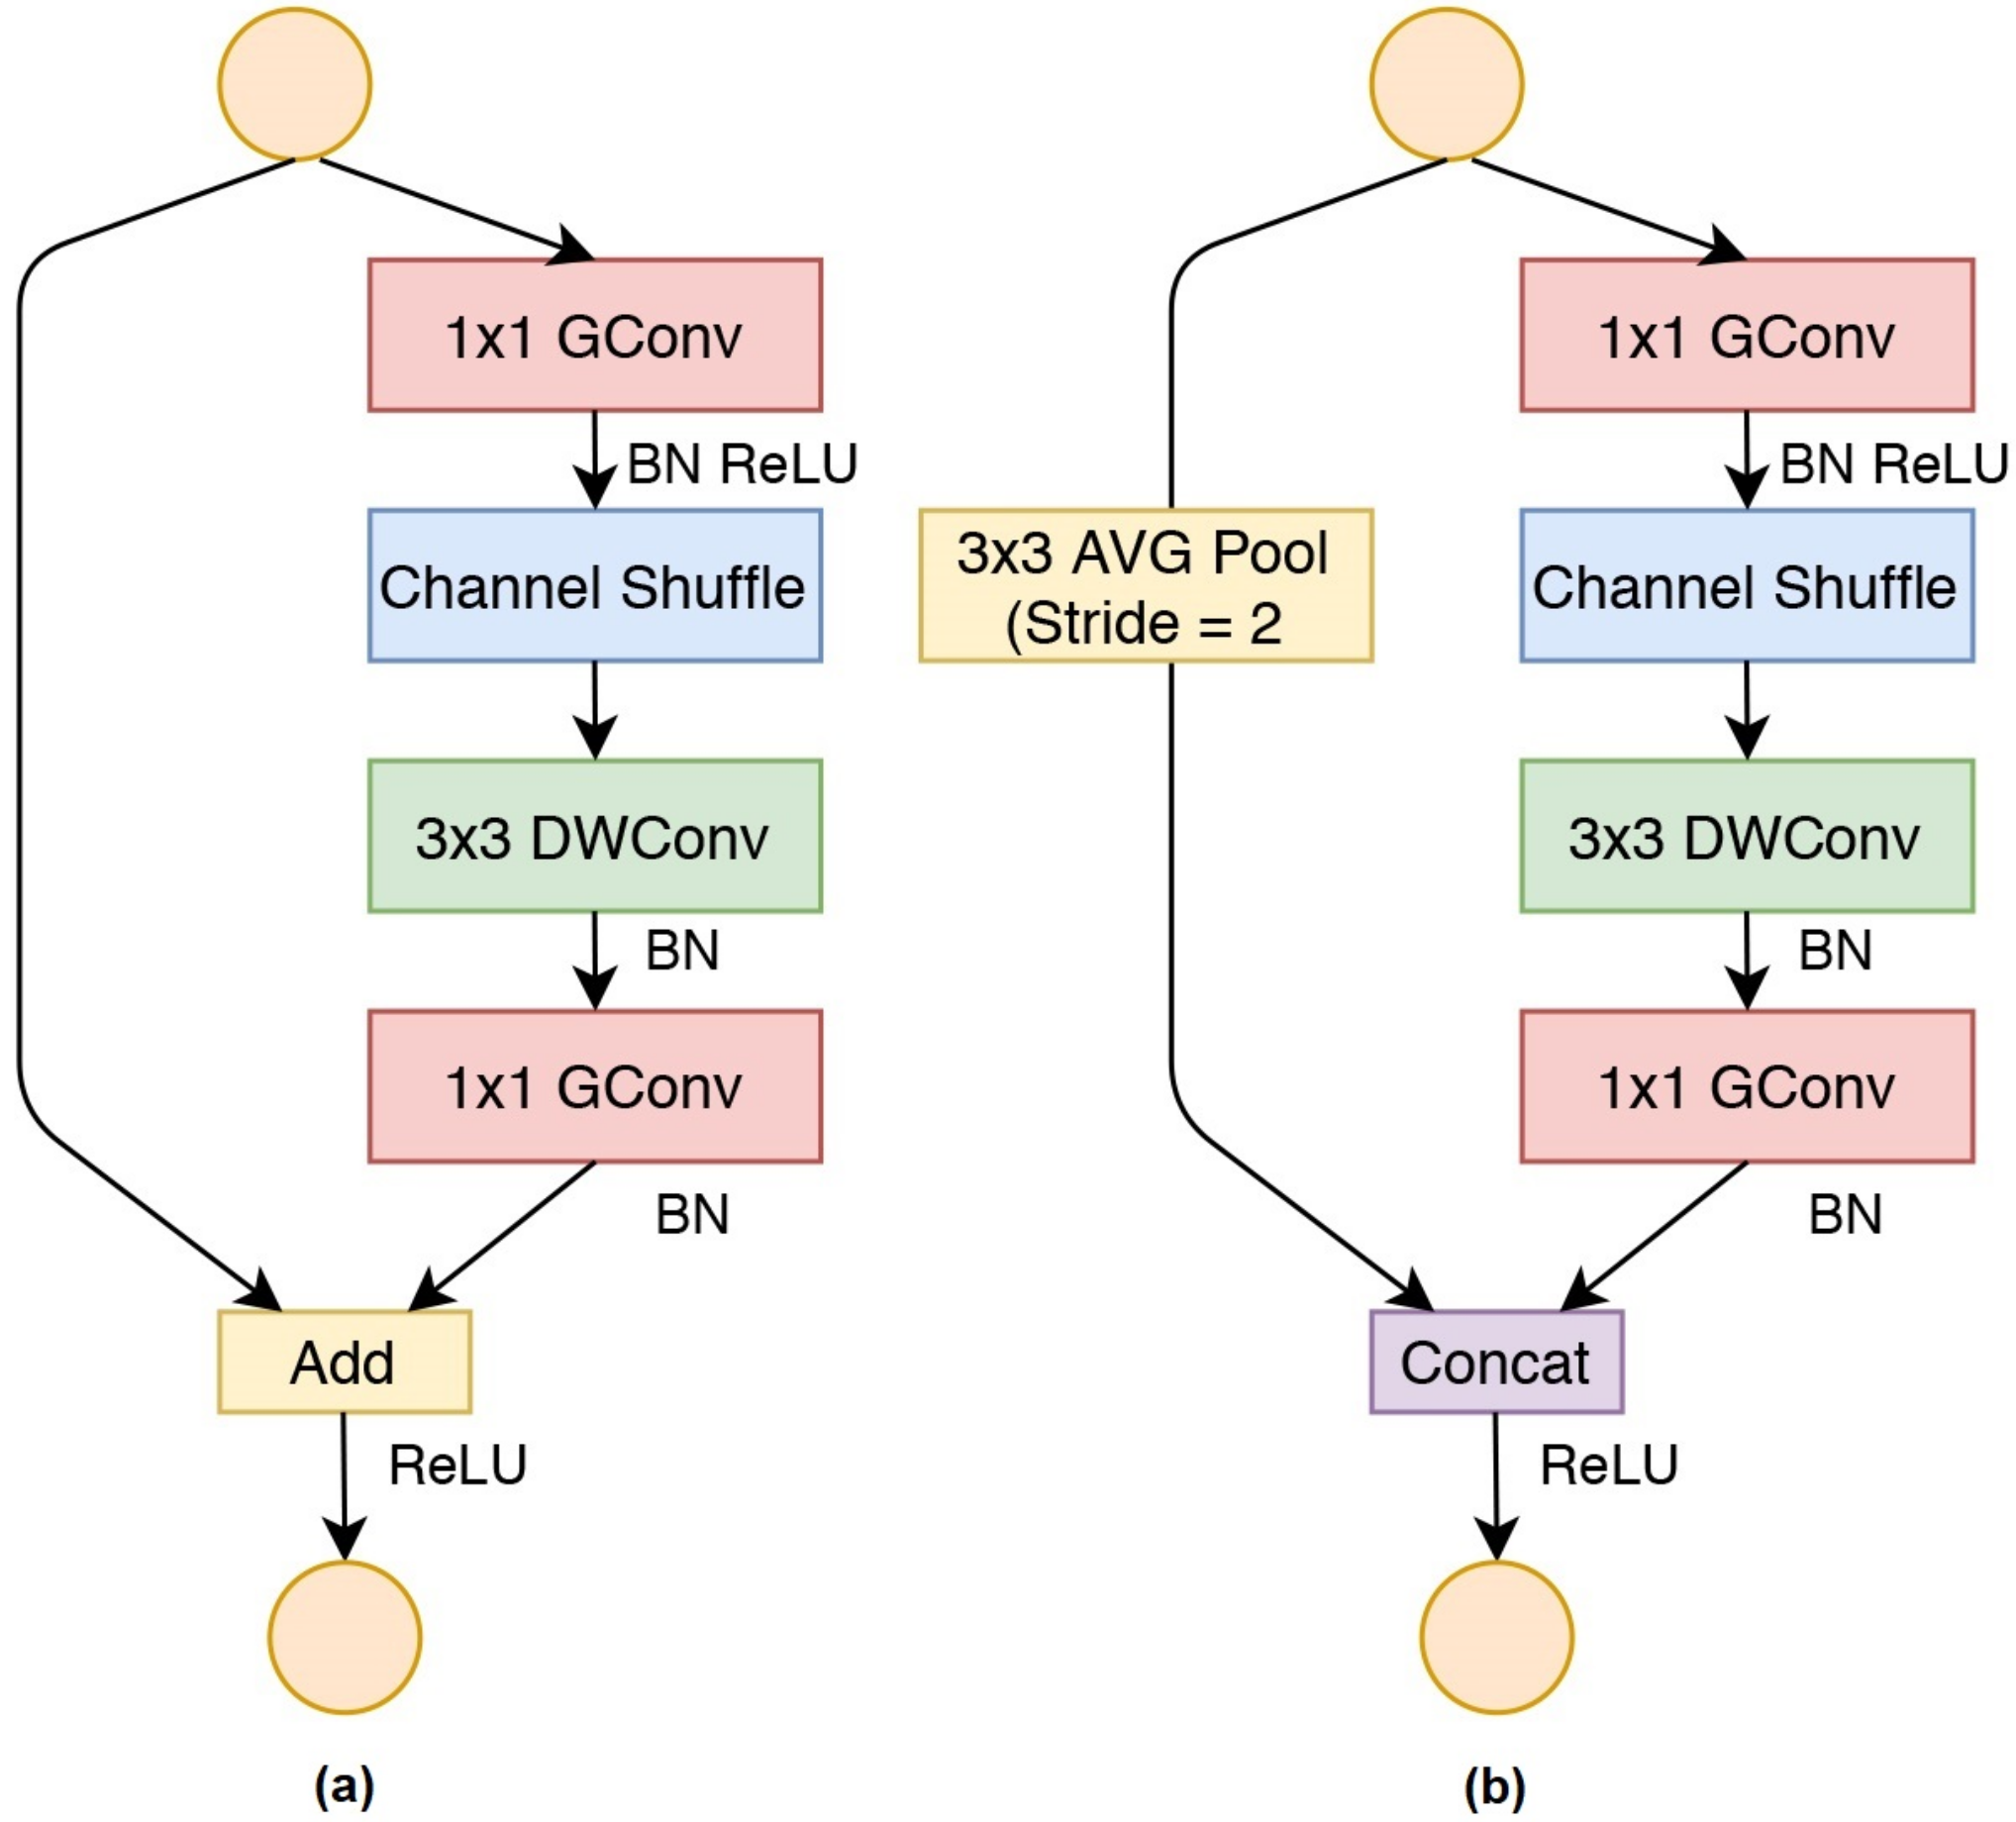
3.1.5. ShuffleNet
3.1.6. EfficientNet
3.2. Decision Fusion
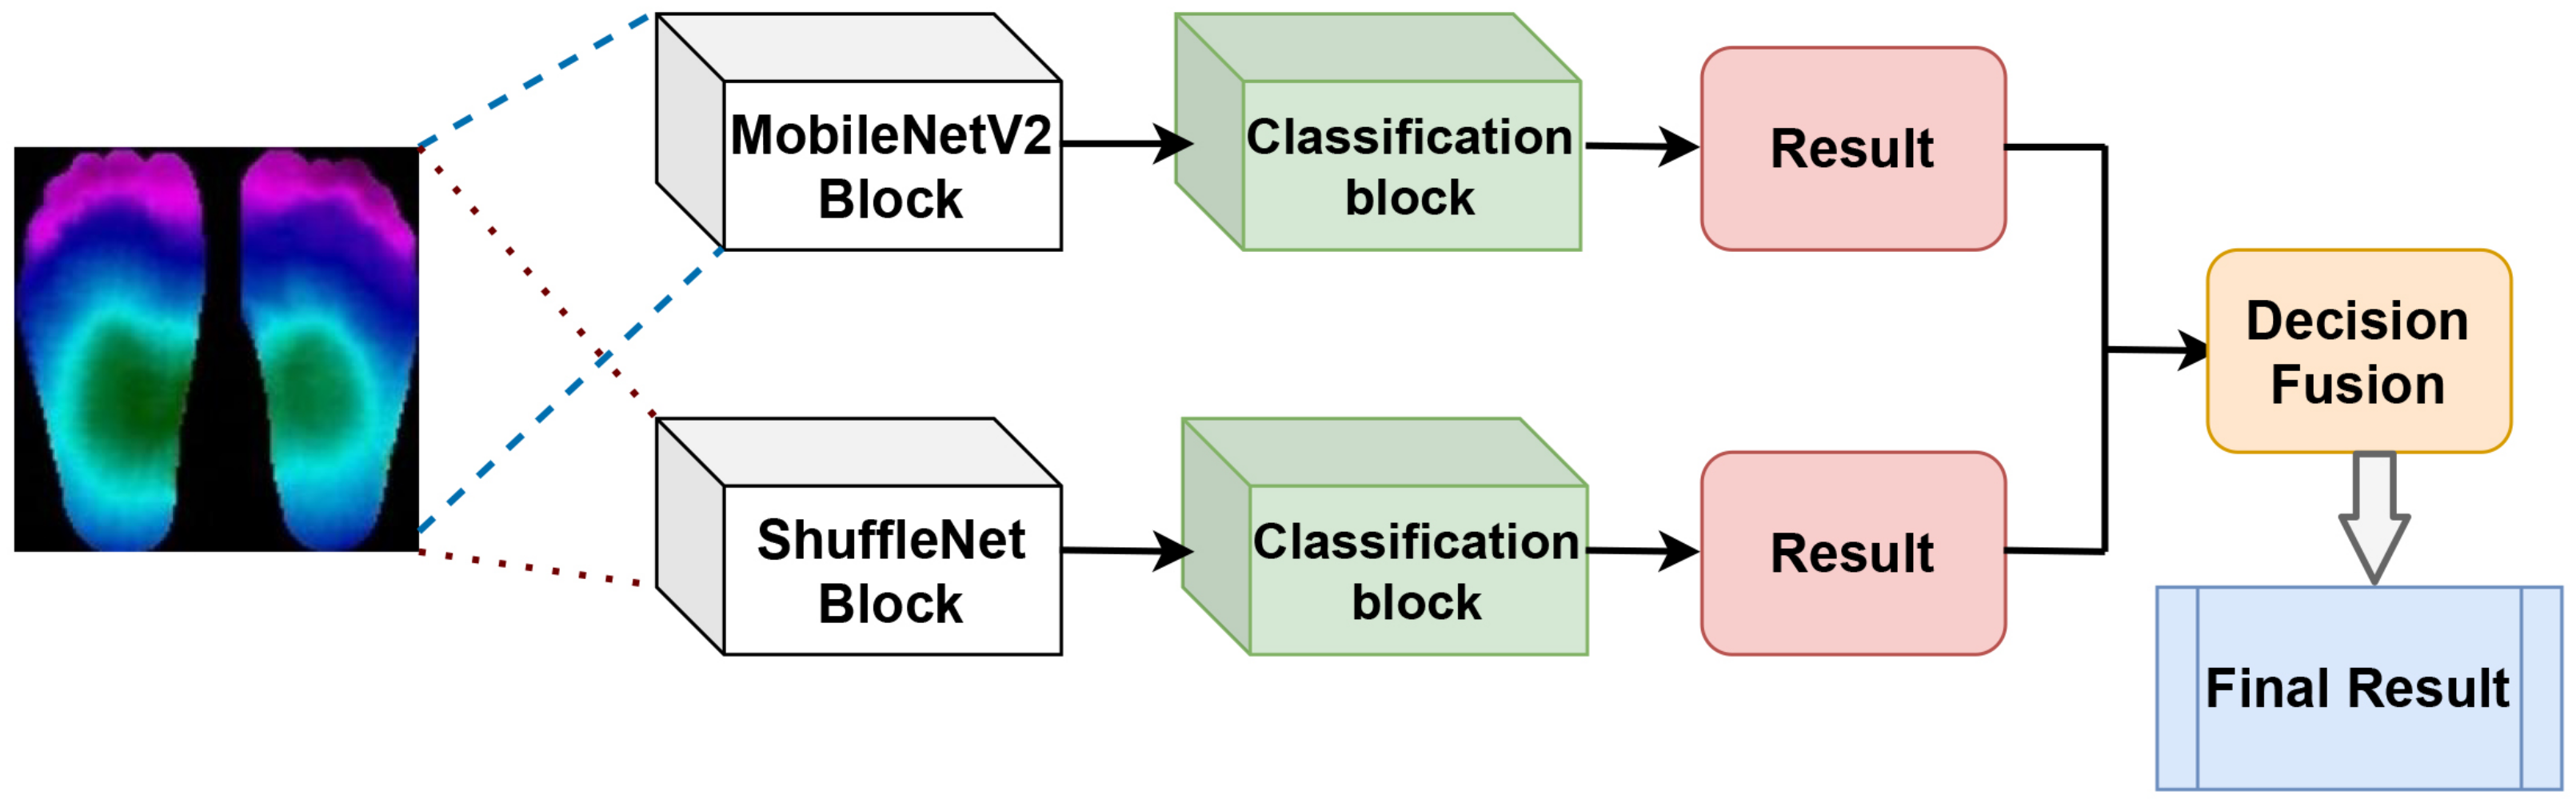
4. The Proposed Framework
4.1. Transfer Learning
4.2. Decision Rule
| Algorithm 1: Decision Fusion Schema |
 |
5. Simulation Result and Discussion
5.1. Simulation Setup
5.1.1. Dataset
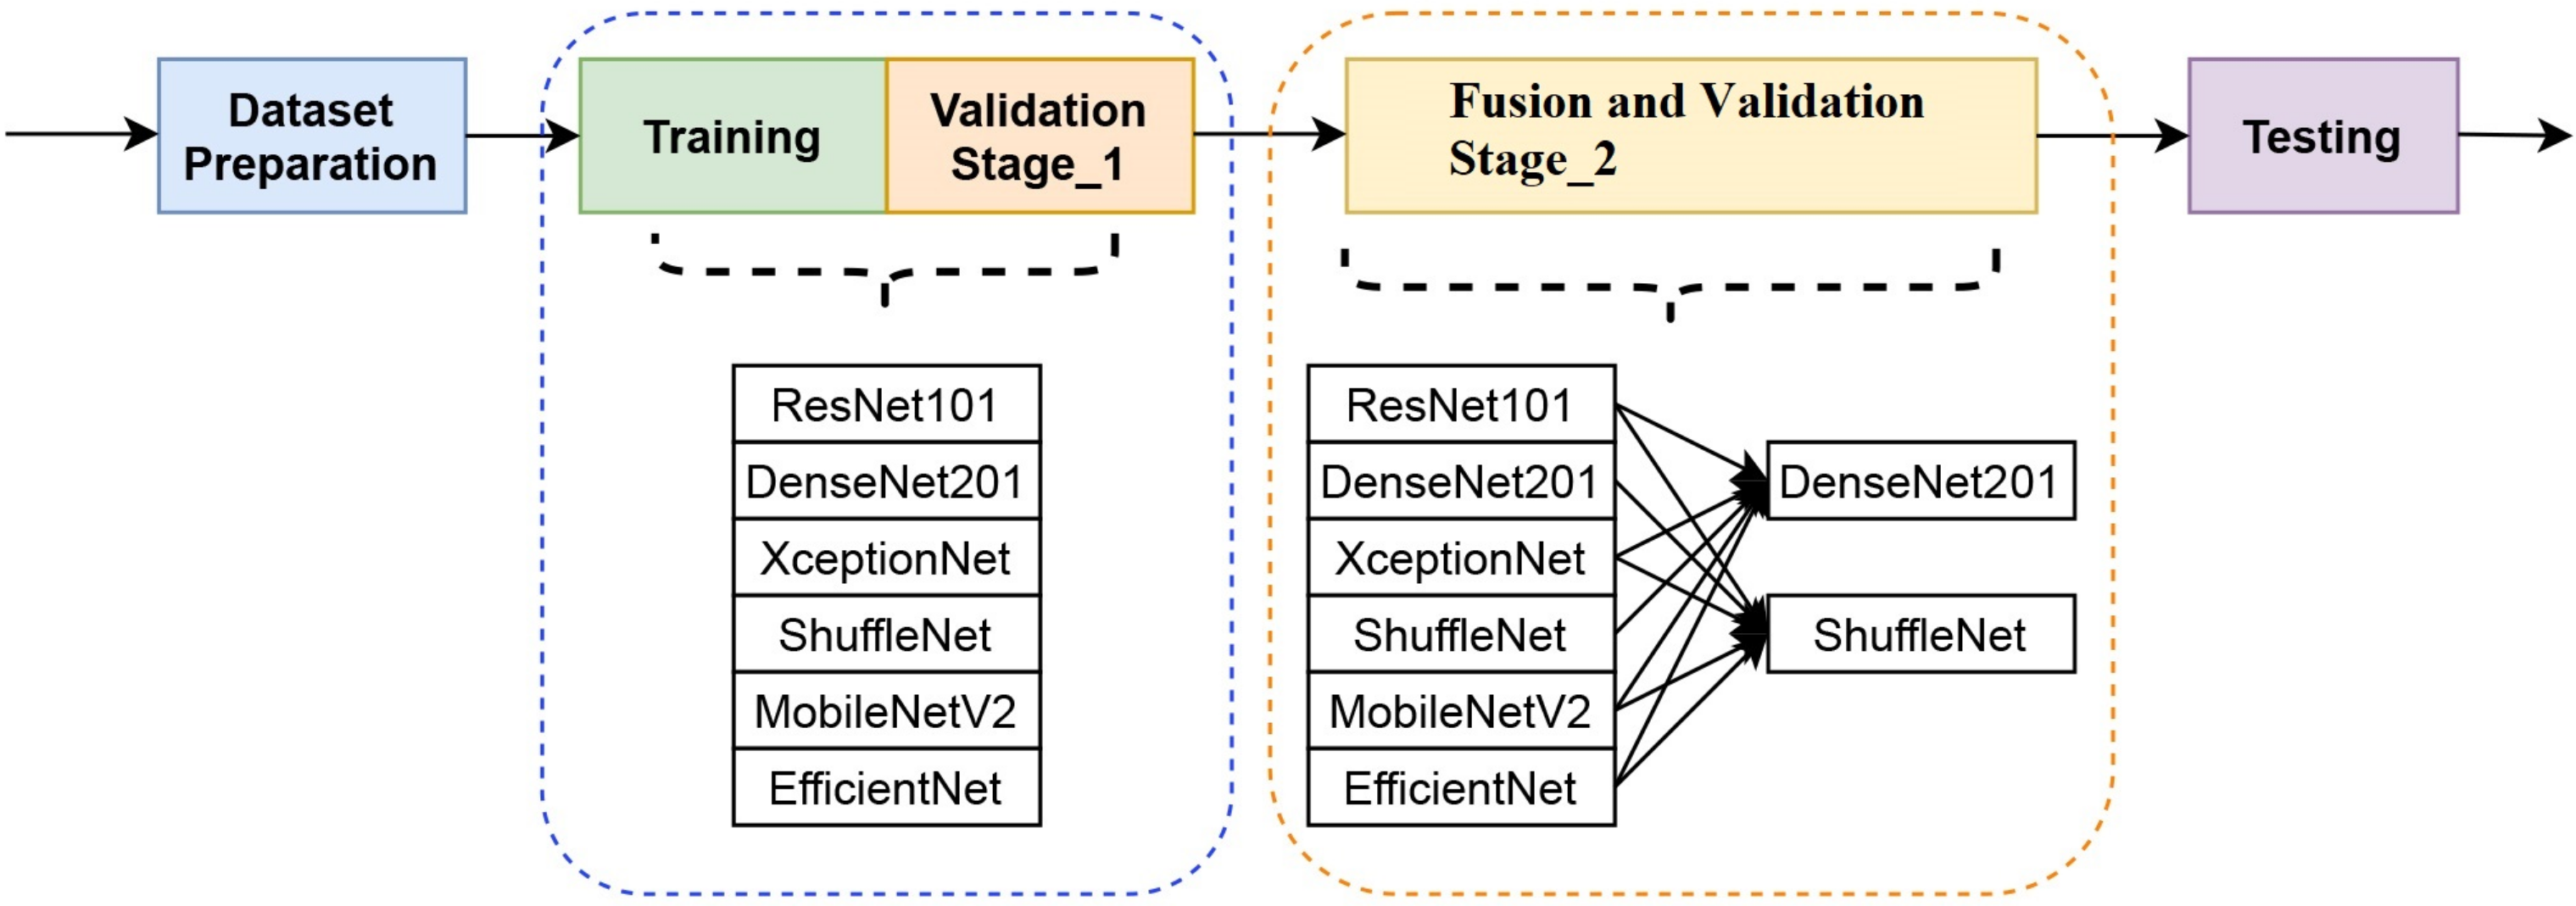
5.1.2. Training and Validation Stage One
5.1.3. Fusion and Validation Stage Two
5.1.4. Testing and Evaluation
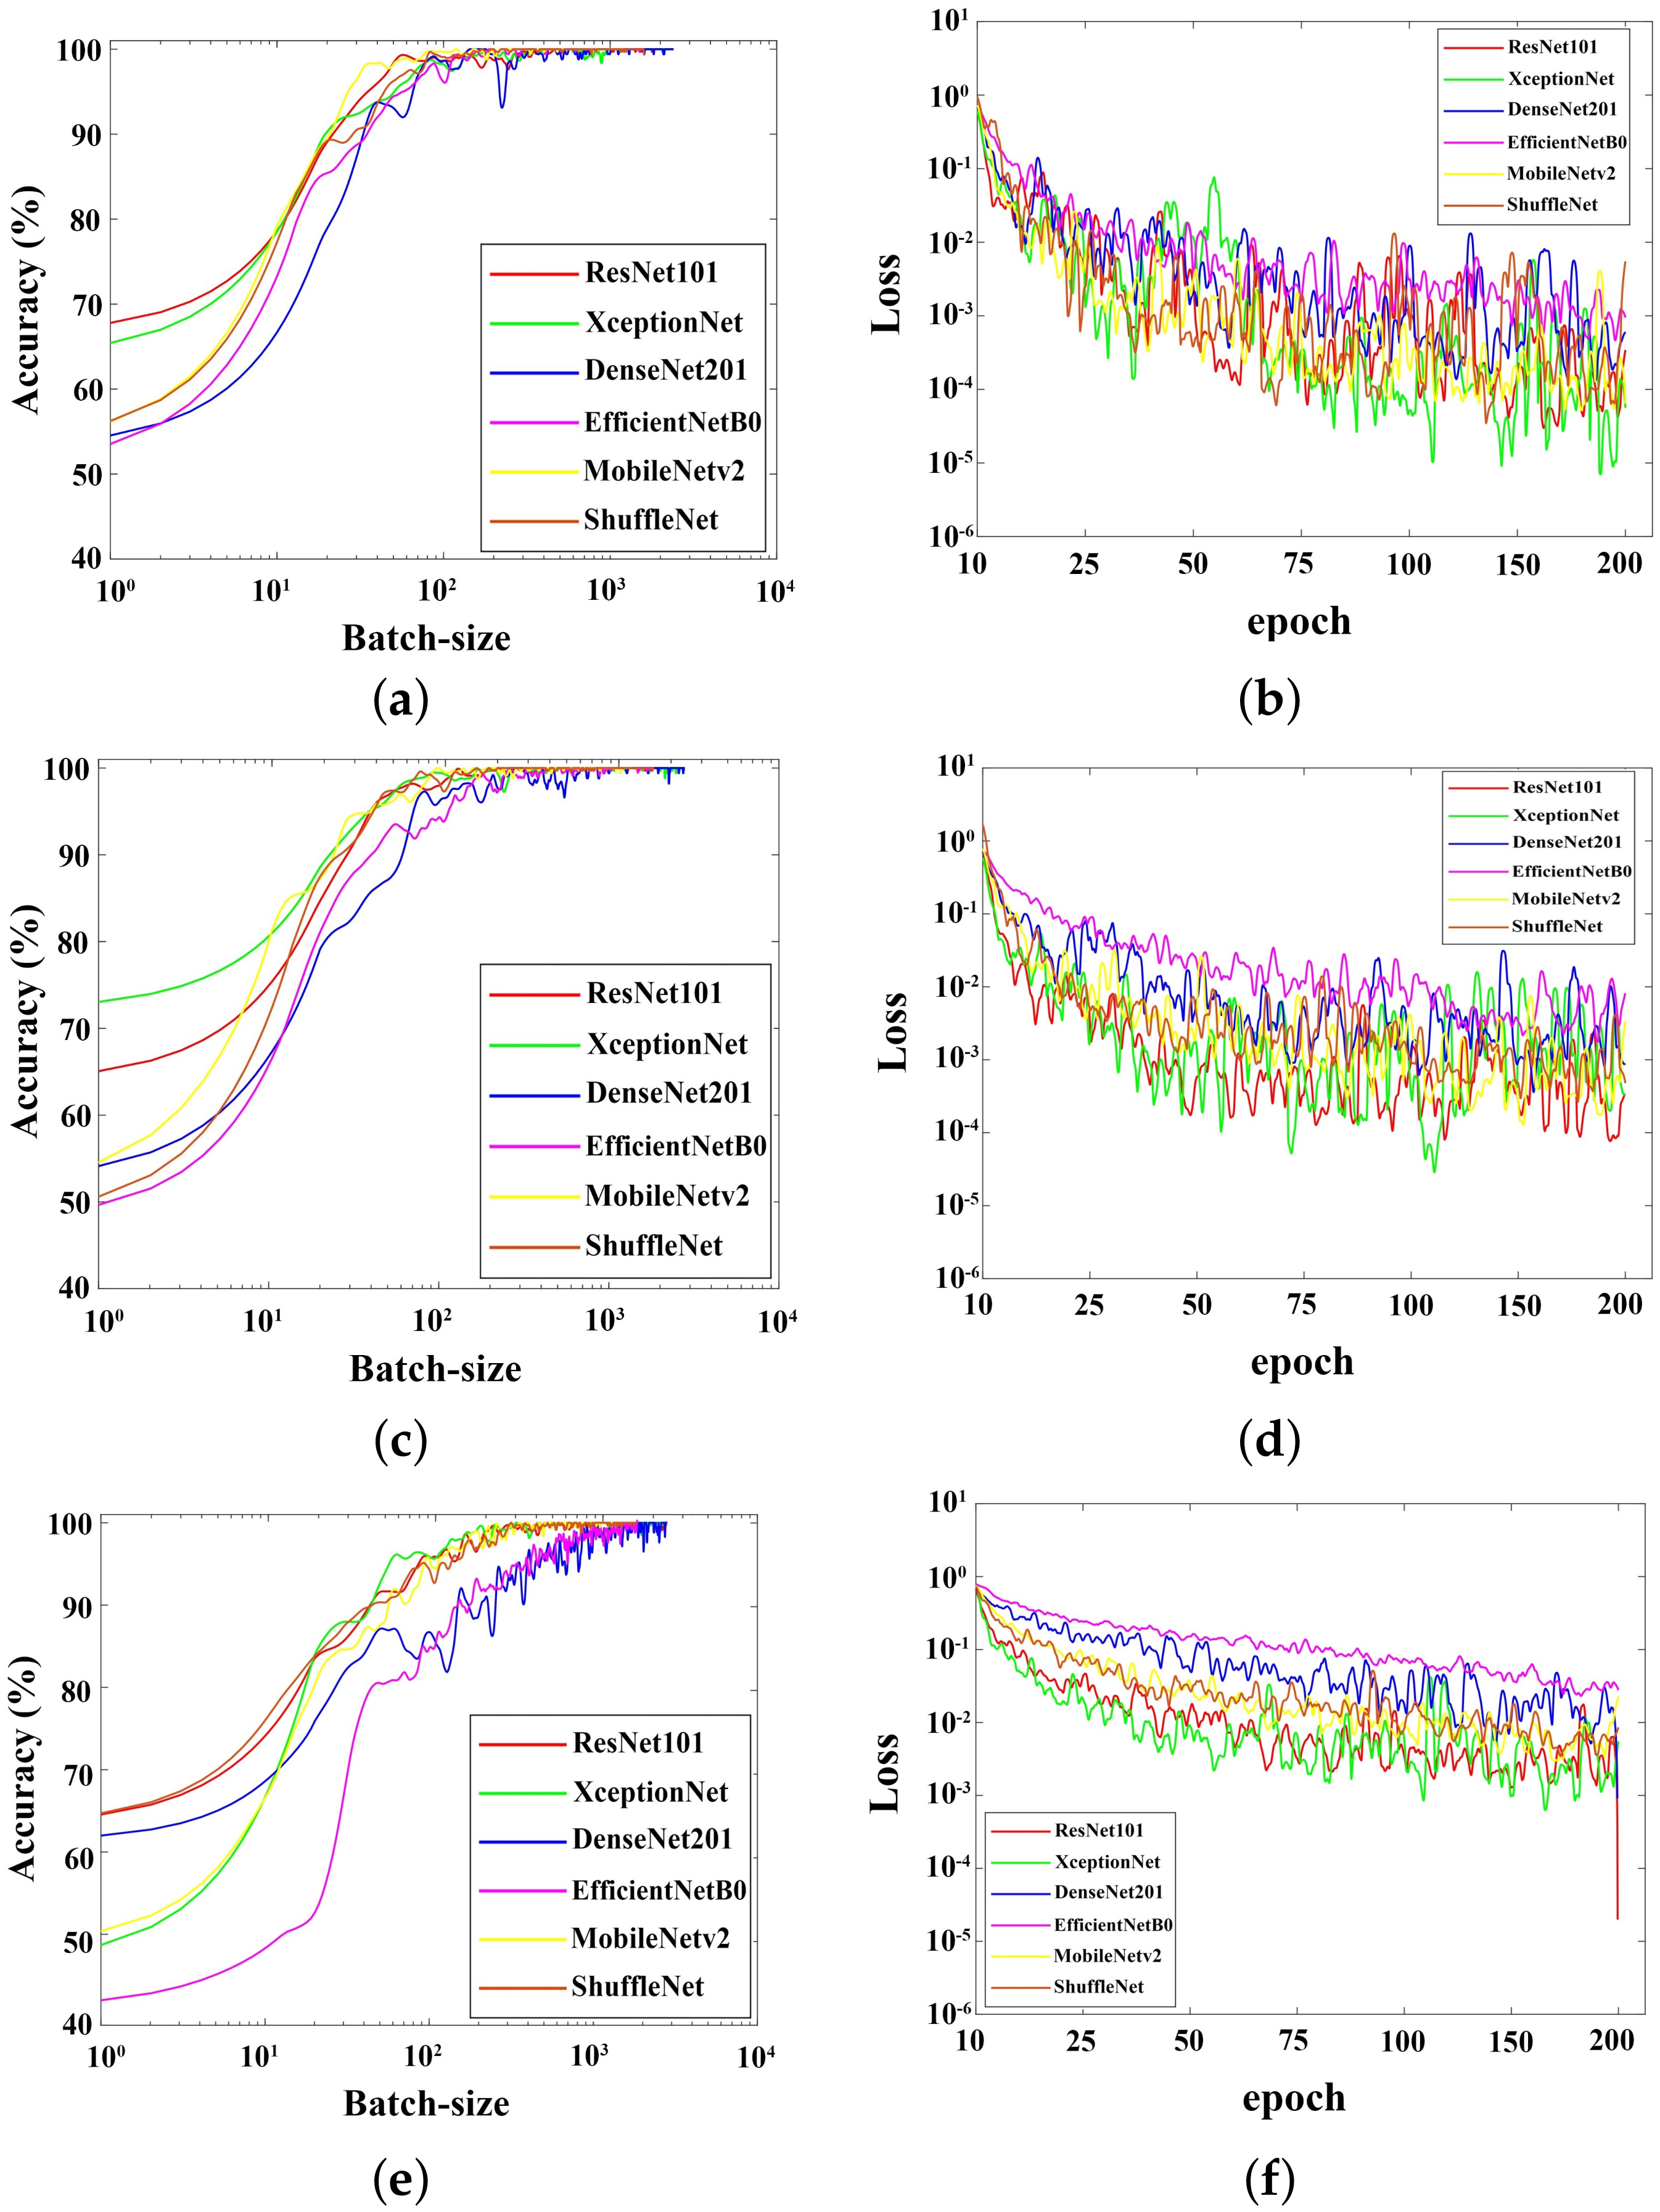
5.2. Training Results
5.3. Single Classification Results
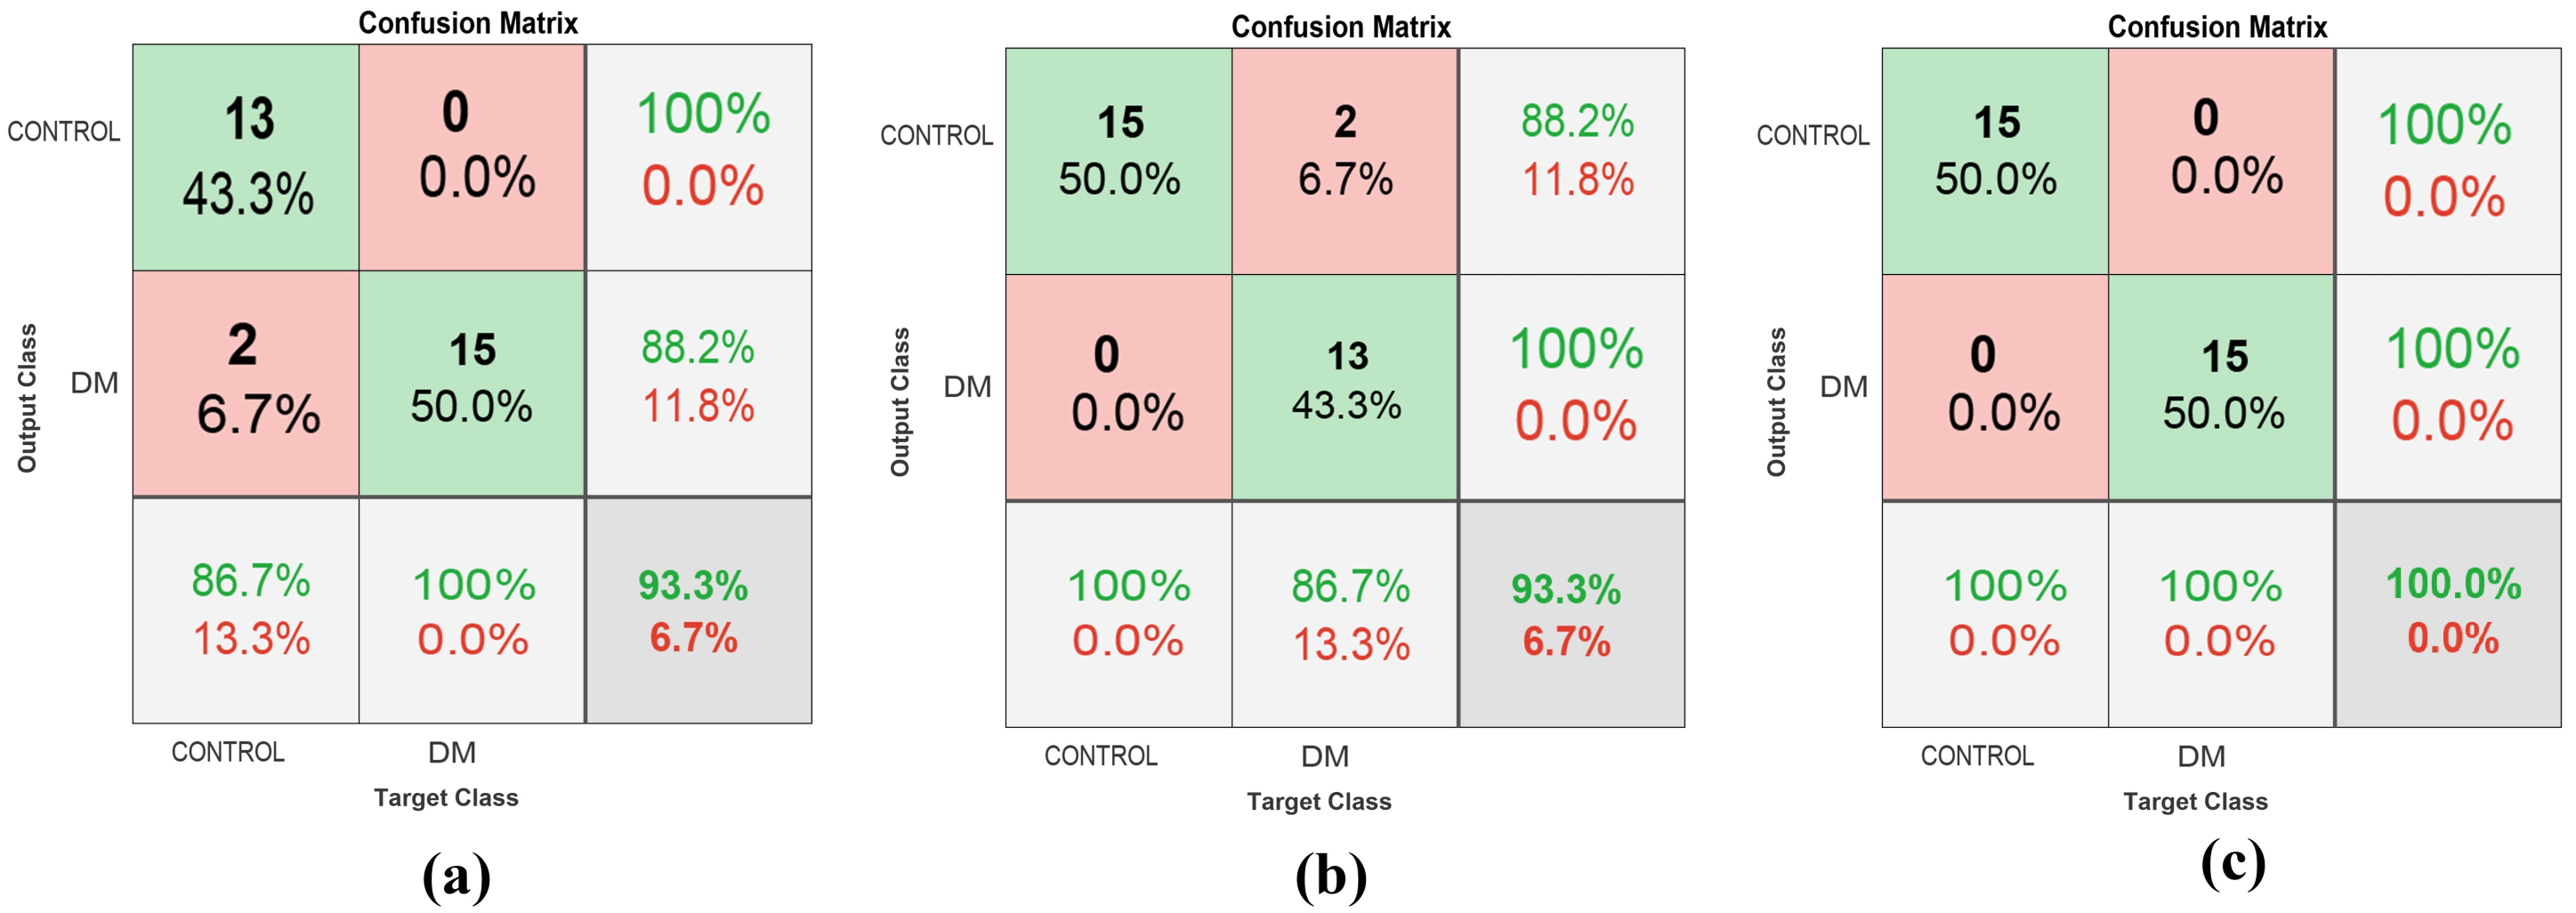
5.4. Decision Fusion Results
5.5. The Comparison of Several Methods’ Performances
5.6. Discussion
6. Conclusions
Author Contributions
Funding
Institutional Review Board Statement
Informed Consent Statement
Data Availability Statement
Conflicts of Interest
References
- American Diabetes Association. Diagnosis and classification of diabetes mellitus. Diabetes Care 2009, 32, S62–S67. [Google Scholar] [CrossRef] [PubMed] [Green Version]
- Saminathan, J.; Sasikala, M.; Narayanamurthy, V.; Rajesh, K.; Arvind, R. Computer aided detection of diabetic foot ulcer using asymmetry analysis of texture and temperature features. Infrared Phys. Technol. 2020, 105, 103219. [Google Scholar] [CrossRef]
- Usharani, R.; Shanthini, A. Neuropathic complications: Type II diabetes mellitus and other risky parameters using machine learning algorithms. J. Ambient. Intell. Humaniz. Comput. 2021, 12, 1–23. [Google Scholar] [CrossRef]
- Ming, A.; Walter, I.; Alhajjar, A.; Leuckert, M.; Mertens, P.R. Study protocol for a randomized controlled trial to test for preventive effects of diabetic foot ulceration by telemedicine that includes sensor-equipped insoles combined with photo documentation. Trials 2019, 20, 1–12. [Google Scholar] [CrossRef] [PubMed] [Green Version]
- Wijesinghe, I.; Gamage, C.; Perera, I.; Chitraranjan, C. A smart telemedicine system with deep learning to manage diabetic retinopathy and foot ulcers. In Proceedings of the 2019 Moratuwa Engineering Research Conference (MERCon), Moratuwa, Sri Lanka, 3–5 July 2019; pp. 686–691. [Google Scholar]
- Tattersall, G.J. Infrared thermography: A non-invasive window into thermal physiology. Comp. Biochem. Physiol. Part A Mol. Integr. Physiol. 2016, 202, 78–98. [Google Scholar] [CrossRef]
- Cruz-Vega, I.; Hernandez-Contreras, D.; Peregrina-Barreto, H.; Rangel-Magdaleno, J.d.J.; Ramirez-Cortes, J.M. Deep Learning Classification for Diabetic Foot Thermograms. Sensors 2020, 20, 1762. [Google Scholar] [CrossRef] [Green Version]
- Goyal, M.; Reeves, N.D.; Davison, A.K.; Rajbhandari, S.; Spragg, J.; Yap, M.H. Dfunet: Convolutional neural networks for diabetic foot ulcer classification. IEEE Trans. Emerg. Top. Comput. Intell. 2018, 4, 728–739. [Google Scholar] [CrossRef] [Green Version]
- Vardasca, R.; Magalhaes, C.; Seixas, A.; Carvalho, R.; Mendes, J. Diabetic foot monitoring using dynamic thermography and AI classifiers. In Proceedings of the 3rd Quantitative InfraRed Thermography Asia Conference (QIRT Asia 2019), Tokyo, Japan, 1–5 July 2019; pp. 1–5. [Google Scholar]
- Alzubaidi, L.; Fadhel, M.A.; Oleiwi, S.R.; Al-Shamma, O.; Zhang, J. DFU_QUTNet: Diabetic foot ulcer classification using novel deep convolutional neural network. Multimed. Tools Appl. 2020, 79, 15655–15677. [Google Scholar] [CrossRef]
- Gamage, C.; Wijesinghe, I.; Perera, I. Automatic Scoring of Diabetic Foot Ulcers through Deep CNN Based Feature Extraction with Low Rank Matrix Factorization. In Proceedings of the 2019 IEEE 19th International Conference on Bioinformatics and Bioengineering (BIBE), Athens, Greece, 28–30 October 2019; pp. 352–356. [Google Scholar]
- Rania, N.; Douzi, H.; Yves, L.; Sylvie, T. Semantic Segmentation of Diabetic Foot Ulcer Images: Dealing with Small Dataset in DL Approaches. In Proceedings of the International Conference on Image and Signal Processing, Marrakesh, Morocco, 4–6 June 2020; Springer Nature Switzerland AG: Berlin/Heidelberg, Germany, 2020; pp. 162–169. [Google Scholar]
- Goyal, M.; Yap, M.H.; Reeves, N.D.; Rajbhandari, S.; Spragg, J. Fully convolutional networks for diabetic foot ulcer segmentation. In Proceedings of the 2017 IEEE international conference on systems, man, and cybernetics (SMC), Banff, AB, Canada, 5–8 October 2017; pp. 618–623.
- Khandakar, A.; Chowdhury, M.E.; Reaz, M.B.I.; Ali, S.H.M.; Hasan, M.A.; Kiranyaz, S.; Rahman, T.; Alfkey, R.; Bakar, A.A.A.; Malik, R.A. A machine learning model for early detection of diabetic foot using thermogram images. Comput. Biol. Med. 2021, 137, 104838. [Google Scholar] [CrossRef]
- Mangai, U.G.; Samanta, S.; Das, S.; Chowdhury, P.R. A survey of decision fusion and feature fusion strategies for pattern classification. IETE Tech. Rev. 2010, 27, 293–307. [Google Scholar] [CrossRef]
- Faust, O.; Acharya, U.R.; Ng, E.; Hong, T.J.; Yu, W. Application of infrared thermography in computer aided diagnosis. Infrared Phys. Technol. 2014, 66, 160–175. [Google Scholar] [CrossRef] [PubMed]
- Suissa, S.; Ernst, P. Optical illusions from visual data analysis: Example of the New Zealand asthma mortality epidemic. J. Clin. Epidemiol. 1997, 50, 1079–1088. [Google Scholar] [CrossRef]
- Adam, M.; Ng, E.Y.; Tan, J.H.; Heng, M.L.; Tong, J.W.; Acharya, U.R. Computer aided diagnosis of diabetic foot using infrared thermography: A review. Comput. Biol. Med. 2017, 91, 326–336. [Google Scholar] [CrossRef]
- Roslidar, R.; Rahman, A.; Muharar, R.; Syahputra, M.R.; Arnia, F.; Syukri, M.; Pradhan, B.; Munadi, K. A review on recent progress in thermal imaging and deep learning approaches for breast cancer detection. IEEE Access 2020, 8, 116176–116194. [Google Scholar] [CrossRef]
- Roslidar, R.; Syaryadhi, M.; Saddami, K.; Pradhan, B.; Arnia, F.; Syukri, M.; Munadi, K. BreaCNet: A high-accuracy breast thermogram classifier based on mobile convolutional neural network. Math. Biosci. Eng. 2022, 19, 1304–1331. [Google Scholar] [CrossRef]
- Hernandez-Contreras, D.A.; Peregrina-Barreto, H.; de Jesus Rangel-Magdaleno, J.; Renero-Carrillo, F.J. Plantar thermogram database for the study of diabetic foot complications. IEEE Access 2019, 7, 161296–161307. [Google Scholar] [CrossRef]
- He, K.; Zhang, X.; Ren, S.; Sun, J. Deep residual learning for image recognition. In Proceedings of the IEEE Conference on Computer Vision and Pattern Recognition, Las Vegas, NV, USA, 27–30 June 2016; pp. 770–778. [Google Scholar]
- Huang, G.; Liu, Z.; Van Der Maaten, L.; Weinberger, K.Q. Densely connected convolutional networks. In Proceedings of the IEEE Conference on Computer Vision and Pattern Recognition, Honolulu, HI, USA, 21–26 July 2017; pp. 4700–4708. [Google Scholar]
- Chollet, F. Xception: Deep learning with depthwise separable convolutions. In Proceedings of the IEEE Conference on Computer Vision and Pattern Recognition, Honolulu, HI, USA, 21–26 July 2017; pp. 1251–1258. [Google Scholar]
- Szegedy, C.; Liu, W.; Jia, Y.; Sermanet, P.; Reed, S.; Anguelov, D.; Erhan, D.; Vanhoucke, V.; Rabinovich, A. Going deeper with convolutions. In Proceedings of the IEEE Conference on Computer Vision and Pattern Recognition, Boston, MA, USA, 7–12 June 2015; pp. 1–9. [Google Scholar]
- Sandler, M.; Howard, A.; Zhu, M.; Zhmoginov, A.; Chen, L.C. Mobilenetv2: Inverted residuals and linear bottlenecks. In Proceedings of the IEEE Conference on Computer Vision and Pattern Recognition, Salt Lake City, UT, USA, 18–22 June 2018; pp. 4510–4520. [Google Scholar]
- Zhang, X.; Zhou, X.; Lin, M.; Sun, J. Shufflenet: An extremely efficient convolutional neural network for mobile devices. In Proceedings of the IEEE Conference on Computer Vision and Pattern Recognition, Salt Lake City, UT, USA, 18–22 June 2018; pp. 6848–6856. [Google Scholar]
- Krizhevsky, A.; Sutskever, I.; Hinton, G.E. Imagenet classification with deep convolutional neural networks. In Proceedings of the Advances in Neural Information Processing Systems, Lake Tahoe, NV, USA, 3–6 December 2012; pp. 1097–1105. [Google Scholar]
- Ioannou, Y.; Robertson, D.; Cipolla, R.; Criminisi, A. Deep roots: Improving cnn efficiency with hierarchical filter groups. In Proceedings of the IEEE Conference on Computer Vision and Pattern Recognition, Honolulu, HI, USA, 21–26 July 2017; pp. 1231–1240. [Google Scholar]
- Xie, S.; Girshick, R.; Dollár, P.; Tu, Z.; He, K. Aggregated residual transformations for deep neural networks. In Proceedings of the IEEE Conference on Computer Vision and Pattern Recognition, Honolulu, HI, USA, 21–26 July 2017; pp. 1492–1500. [Google Scholar]
- Howard, A.G.; Zhu, M.; Chen, B.; Kalenichenko, D.; Wang, W.; Weyand, T.; Andreetto, M.; Adam, H. Mobilenets: Efficient convolutional neural networks for mobile vision applications. arXiv 2017, arXiv:1704.04861. [Google Scholar]
- Tan, M.; Le, Q. Efficientnet: Rethinking model scaling for convolutional neural networks. In Proceedings of the International Conference on Machine Learning, Baltimore, MD, USA, 17–23 July 2019; pp. 6105–6114. [Google Scholar]
- Roggen, D.; Tröster, G.; Bulling, A. Signal processing technologies for activity-aware smart textiles. In Multidisciplinary Know-How for Smart-Textiles Developers; Elsevier: Amsterdam, The Netherlands, 2013; pp. 329–365. [Google Scholar]
- Oszust, M. Decision fusion for image quality assessment using an optimization approach. IEEE Signal Process. Lett. 2015, 23, 65–69. [Google Scholar] [CrossRef]
- Zhang, C.; Sargent, I.; Pan, X.; Gardiner, A.; Hare, J.; Atkinson, P.M. VPRS-based regional decision fusion of CNN and MRF classifications for very fine resolution remotely sensed images. IEEE Trans. Geosci. Remote Sens. 2018, 56, 4507–4521. [Google Scholar] [CrossRef] [Green Version]
- Kuppusamy, K.; Eswaran, C. Convolutional and Deep Neural Networks based techniques for extracting the age-relevant features of the speaker. J. Ambient. Intell. Humaniz. Comput. 2021, 12, 1–13. [Google Scholar] [CrossRef]
- James, A.P.; Dasarathy, B.V. Medical image fusion: A survey of the state of the art. Inf. Fusion 2014, 19, 4–19. [Google Scholar] [CrossRef] [Green Version]
- Abdi, G.; Samadzadegan, F.; Reinartz, P. Deep learning decision fusion for the classification of urban remote sensing data. J. Appl. Remote Sens. 2018, 12, 016038. [Google Scholar] [CrossRef]
- Lai, Z.; Deng, H. Medical image classification based on deep features extracted by deep model and statistic feature fusion with multilayer perceptron. Comput. Intell. Neurosci. 2018, 2018, 2061516. [Google Scholar] [CrossRef] [PubMed] [Green Version]
- Rwigema, J.; Mfitumukiza, J.; Tae-Yong, K. A hybrid approach of neural networks for age and gender classification through decision fusion. Biomed. Signal Process. Control. 2021, 66, 102459. [Google Scholar] [CrossRef]
- Zhou, T.; Ruan, S.; Canu, S. A review: Deep learning for medical image segmentation using multi-modality fusion. Array 2019, 3, 100004. [Google Scholar] [CrossRef]
- Roslidar, R.; Saddami, K.; Arnia, F.; Syukri, M.; Munadi, K. A study of fine-tuning CNN models based on thermal imaging for breast cancer classification. In Proceedings of the 2019 IEEE International Conference on Cybernetics and Computational Intelligence (CyberneticsCom), Banda Aceh, Indonesia, 22–24 August 2019; pp. 77–81. [Google Scholar]
- Janssens, O.; Van de Walle, R.; Loccufier, M.; Van Hoecke, S. Deep learning for infrared thermal image based machine health monitoring. IEEE/ASME Trans. Mechatron. 2017, 23, 151–159. [Google Scholar] [CrossRef] [Green Version]
- Rizka, R.; Saddami, K.; Roslidar, R.; Munadi, K.; Fitri, A. On Reducing the ShuffleNet Block for Mobile-based Breast Cancer Detection Using Thermogram: Performance Evaluation. Appl. Comput. Intell. Soft Comput. 2021. under review. [Google Scholar]
- van Netten, J.J.; van Baal, J.G.; Liu, C.; van Der Heijden, F.; Bus, S.A. Infrared thermal imaging for automated detection of diabetic foot complications. J. Diabetes Sci. Technol. 2013, 7, 1122–1129. [Google Scholar] [CrossRef] [Green Version]
- Pereira, S.; Pinto, A.; Alves, V.; Silva, C.A. Brain tumor segmentation using convolutional neural networks in MRI images. IEEE Trans. Med. Imaging 2016, 35, 1240–1251. [Google Scholar] [CrossRef]
- Dai, Y.; Gao, Y.; Liu, F. TransMed: Transformers Advance Multi-Modal Medical Image Classification. Diagnostics 2021, 11, 1384. [Google Scholar] [CrossRef]
- Khan, S.; Islam, N.; Jan, Z.; Din, I.U.; Rodrigues, J.J.C. A novel deep learning based framework for the detection and classification of breast cancer using transfer learning. Pattern Recognit. Lett. 2019, 125, 1–6. [Google Scholar] [CrossRef]
- Fan, R.E.; Chen, P.H.; Lin, C.J. Working set selection using second order information for training support vector machines. J. Mach. Learn. Res. 2005, 6, 1889–1918. [Google Scholar]
- Balestriero, R.; Bottou, L.; LeCun, Y. The effects of regularization and data augmentation are class dependent. arXiv 2022, arXiv:2204.03632. [Google Scholar]


| Class | Number of Images | Number of Images |
|---|---|---|
| Before Augmentation | After Augmentation | |
| CONTROL | 142 | 1200 |
| DM | 45 | 1200 |
| Total | 187 | 2400 |
| Deep Learning Based | |||||||
|---|---|---|---|---|---|---|---|
| Fusion Methods | LearningParameters | Accuracy | Sensitivityor Recall | Specificity | Precision | F-Measure | ModelSize |
| ResNet + DenseNet | 60.64 M | 1.000 | 1.000 | 1.000 | 1.000 | 1.000 | 217.3 MB |
| Xception + DenseNet | 38.94 M | 0.967 | 0.934 | 1.000 | 1.000 | 0.967 | 140.4 MB |
| EfficientNet + DenseNet | 22.11 M | 1.000 | 1.000 | 1.000 | 1.000 | 1.000 | 80.8 MB |
| ShuffleNet + DenseNet | 18.94 M | 1.000 | 1.000 | 1.000 | 1.000 | 1.000 | 69.52 MB |
| MobileNetv2 + DenseNet | 20.31 M | 1.000 | 1.000 | 1.000 | 1.000 | 1.000 | 74.45 MB |
| ResNet + ShuffleNet | 43.41 M | 1.000 | 1.000 | 1.000 | 1.000 | 1.000 | 154.22 MB |
| DenseNet + ShuffleNet | 18.94 M | 1.000 | 1.000 | 1.000 | 1.000 | 1.000 | 69.52 MB |
| Xception + ShuffleNet | 21.71 M | 1.000 | 1.000 | 1.000 | 1.000 | 1.000 | 77.32 MB |
| EfficientNet + ShuffleNet | 4.88 M | 1.000 | 1.000 | 1.000 | 1.000 | 1.000 | 17.72 MB |
| MobileNetv2 + ShuffleNet | 3.08 M | 1.000 | 1.000 | 1.000 | 1.000 | 1.000 | 11.37 MB |
| Deep Learning Based | |||||
|---|---|---|---|---|---|
| Methods | Accuracy | Recall | Precision | F-Measure | Learning Parameters |
| The proposed model | 1.000 | 1.000 | 1.000 | 1.000 | 3.08 M |
| ESNet | 1.000 | 1.000 | 1.000 | 1.000 | 4.88 M |
| Cruz-Vega [7] | 0.820 | 0.550 | 1.000 | 0.860 | 0.12 M |
| Khan [48] | 0.770 | 0.920 | 0.790 | 0.850 | 4.90 M |
| Resnet101 | 0.90 | 0.934 | 0.875 | 0.904 | 44.6 M |
| MS+MP | 0.770 | 0.920 | 0.790 | 0.850 | 3.08 M |
| Khandakar [14] | 0.9581 | 0.9581 | 0.9584 | 0.9582 | 2.30 M |
| Conventional Machine Learning Based | |||||
| LBP+SVM | 0.880 | 0.917 | 0.917 | 0.917 | - |
| LBP+NB | 0.710 | 0.890 | 0.670 | 0.760 | - |
| LBP+RF | 0.880 | 0.917 | 0.917 | 0.917 | - |
| AdaBoost + Random Forest [14] | 0.9671 | 0.9795 | 0.9755 | 0.9775 | - |
Publisher’s Note: MDPI stays neutral with regard to jurisdictional claims in published maps and institutional affiliations. |
© 2022 by the authors. Licensee MDPI, Basel, Switzerland. This article is an open access article distributed under the terms and conditions of the Creative Commons Attribution (CC BY) license (https://creativecommons.org/licenses/by/4.0/).
Share and Cite
Munadi, K.; Saddami, K.; Oktiana, M.; Roslidar, R.; Muchtar, K.; Melinda, M.; Muharar, R.; Syukri, M.; Abidin, T.F.; Arnia, F. A Deep Learning Method for Early Detection of Diabetic Foot Using Decision Fusion and Thermal Images. Appl. Sci. 2022, 12, 7524. https://doi.org/10.3390/app12157524
Munadi K, Saddami K, Oktiana M, Roslidar R, Muchtar K, Melinda M, Muharar R, Syukri M, Abidin TF, Arnia F. A Deep Learning Method for Early Detection of Diabetic Foot Using Decision Fusion and Thermal Images. Applied Sciences. 2022; 12(15):7524. https://doi.org/10.3390/app12157524
Chicago/Turabian StyleMunadi, Khairul, Khairun Saddami, Maulisa Oktiana, Roslidar Roslidar, Kahlil Muchtar, Melinda Melinda, Rusdha Muharar, Maimun Syukri, Taufik Fuadi Abidin, and Fitri Arnia. 2022. "A Deep Learning Method for Early Detection of Diabetic Foot Using Decision Fusion and Thermal Images" Applied Sciences 12, no. 15: 7524. https://doi.org/10.3390/app12157524
APA StyleMunadi, K., Saddami, K., Oktiana, M., Roslidar, R., Muchtar, K., Melinda, M., Muharar, R., Syukri, M., Abidin, T. F., & Arnia, F. (2022). A Deep Learning Method for Early Detection of Diabetic Foot Using Decision Fusion and Thermal Images. Applied Sciences, 12(15), 7524. https://doi.org/10.3390/app12157524