
Study on the Method of Household Waste Collection: Case Study

 ,
, 
 ,
, 
Abstract
:
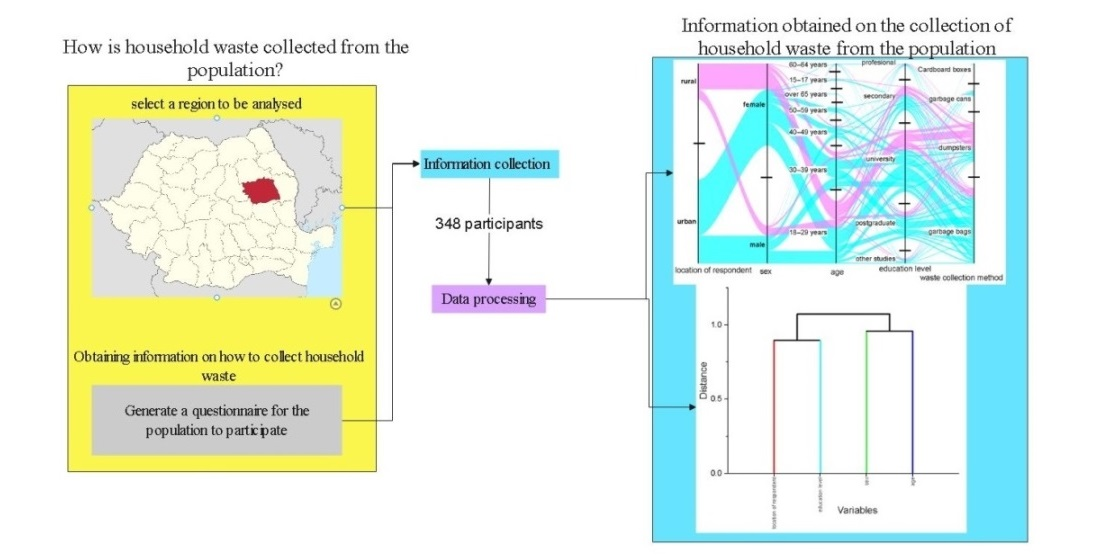
1. Introduction
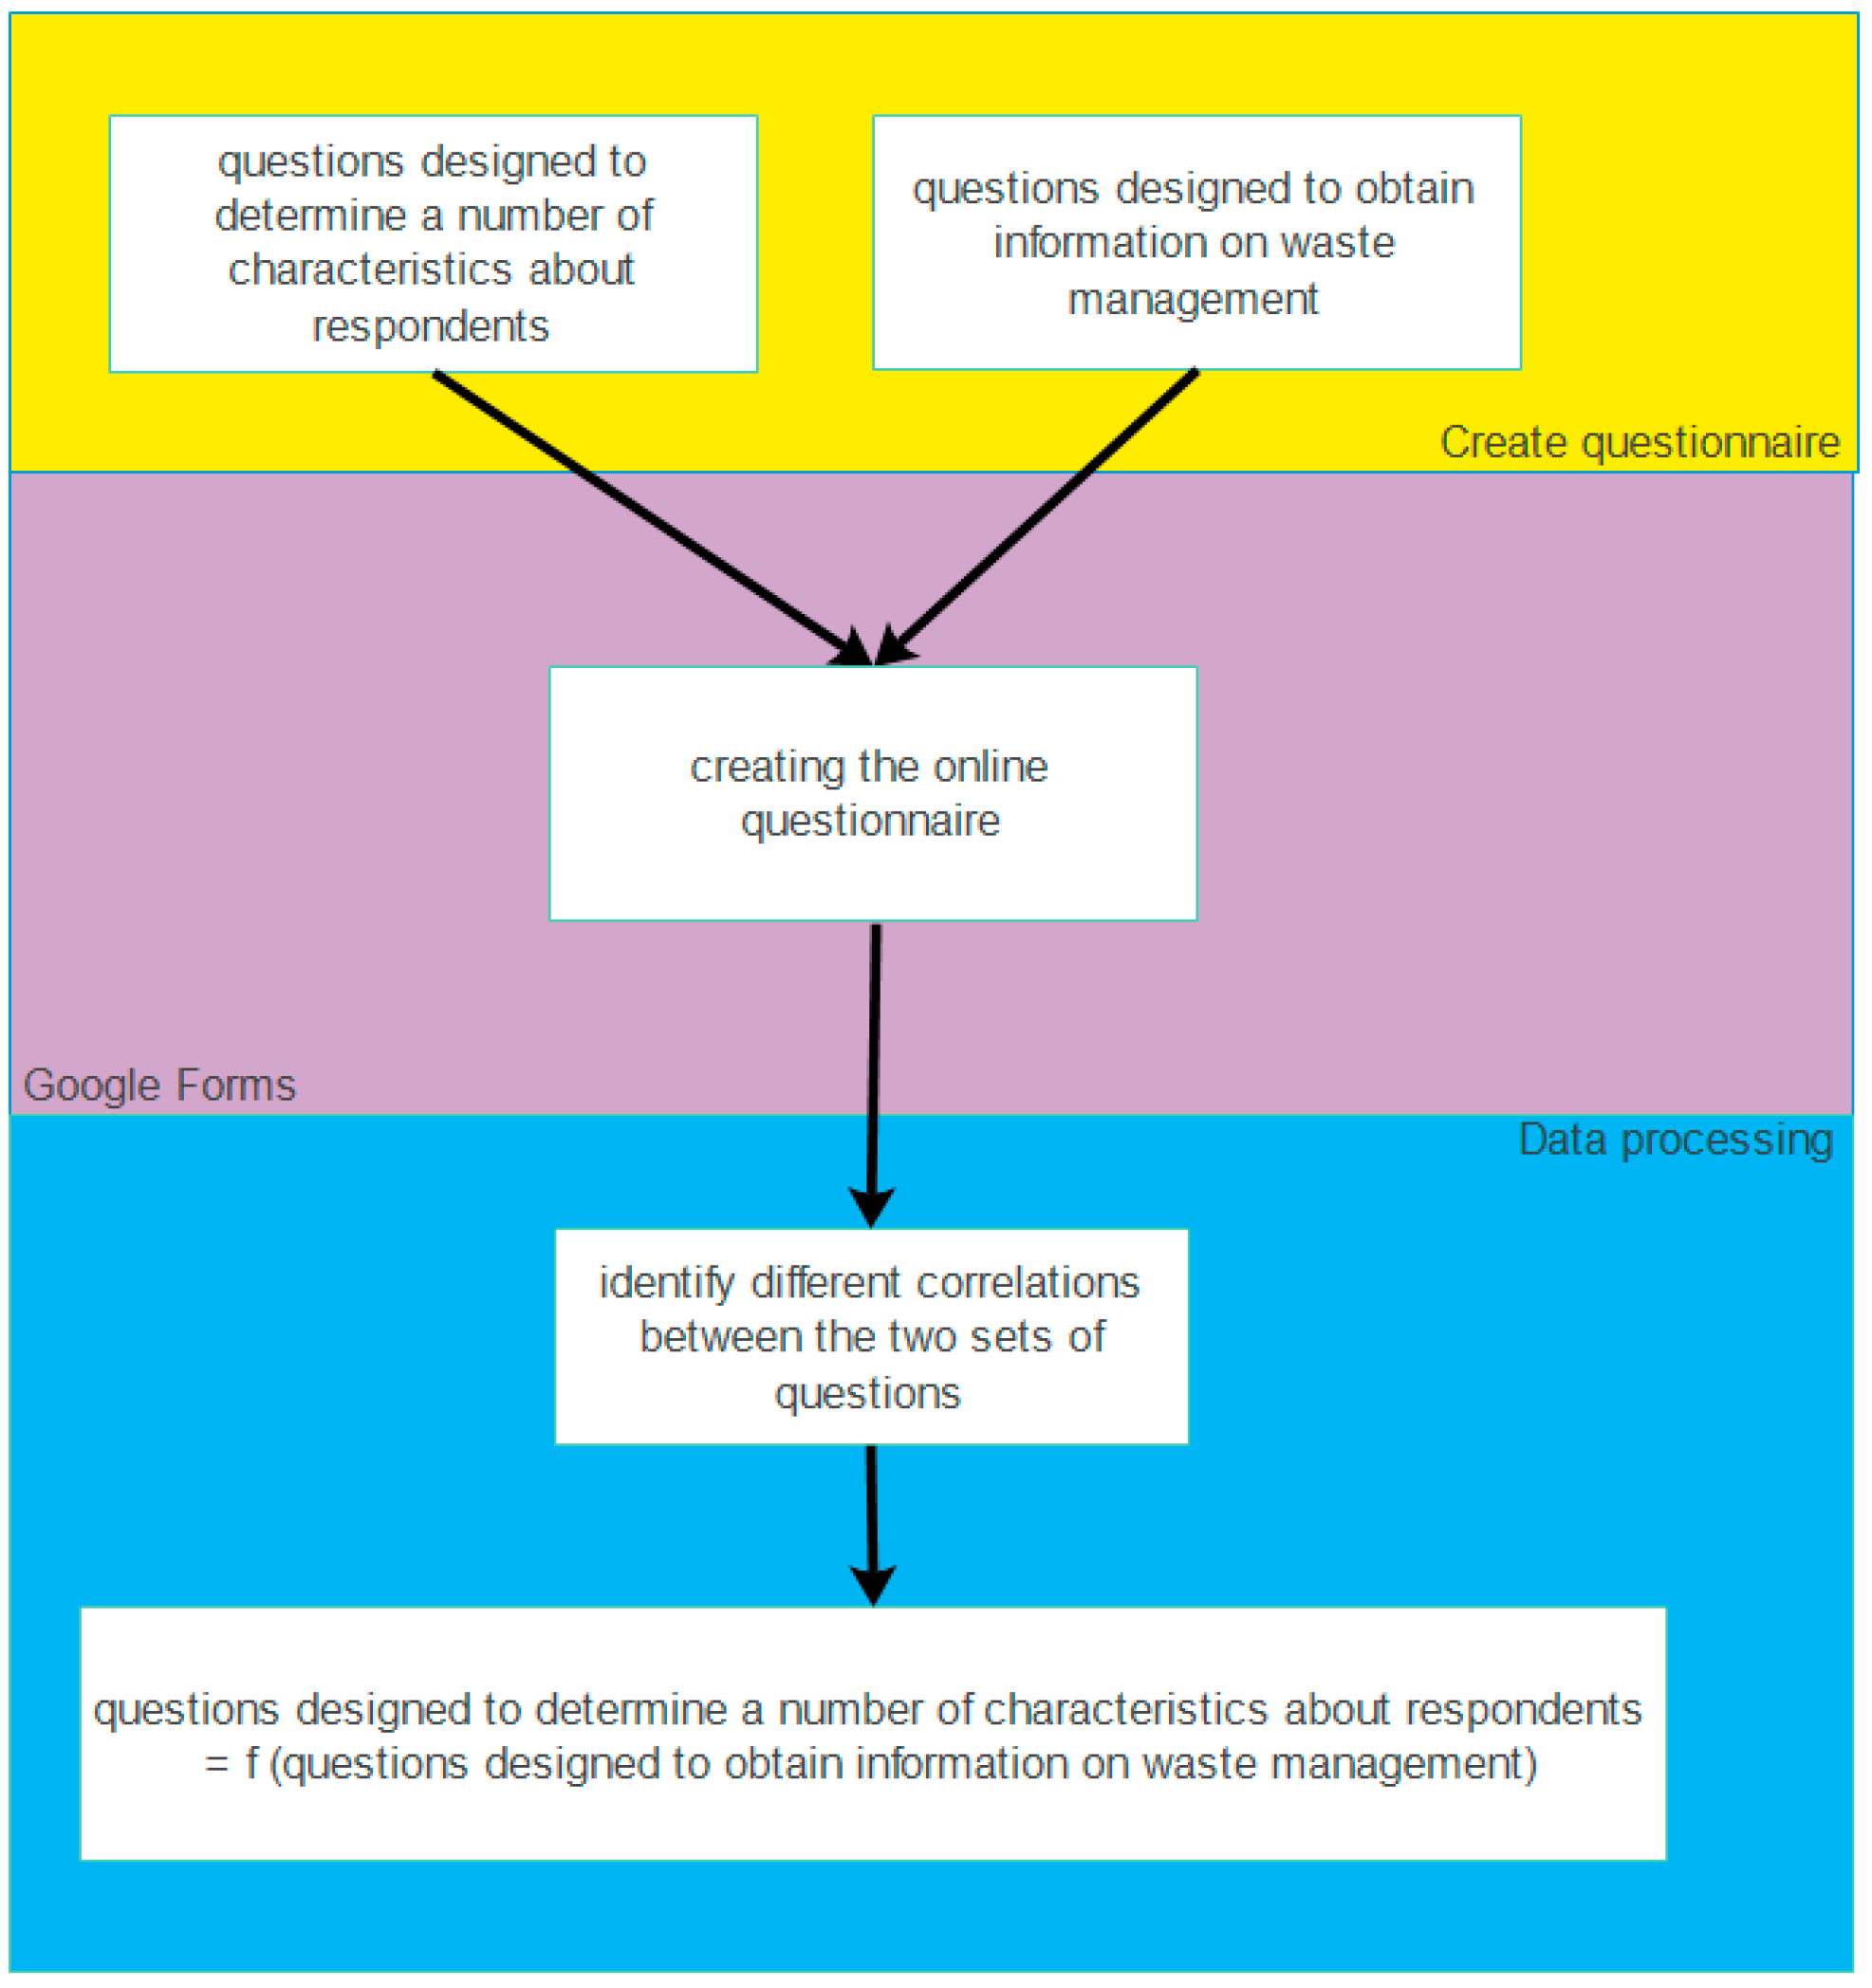
2. Research Methodology
- -
- Respondents’ reference: urban area and rural area
- -
- Gender: male and female
- -
- Age: 15–17 years; 18–29 years; 30–39 years; 40–49 years; 50–59 years; 60–64 years; over 65 years
- -
- Level of studies: secondary; university; postgraduate; other studies; professional
3. Results
- (a)
- 70% of those who participated in the survey were from urban areas, with the rest from rural areas;
- (b)
- The number of female respondents who completed the questionnaire was determined to be 128 greater than the number of male respondents who did so;
- (c)
- The following results were reached after evaluating the age distribution of respondents who completed the questionnaire:
- -
- The age group 18–29 years had the most respondents (182), with 57.7% from urban areas and 42.3% from rural areas;
- -
- People aged 30 to 39 were the second largest category, in terms of the number of respondents, with 104, more precisely 84 from urban areas, and 20 from rural areas;
- -
- The age groups with the lowest values corresponded to intervals of more than 65 years. Six respondents were found between the ages of 15 and 17, 36 respondents were found between the ages of 40 and 49, 14 respondents were found between the ages of 50 and 59, and for the age range of 60–64 years, just one responder was found.
- (d)
- An examination of the responses was also carried out, taking into consideration educational level of respondents. The following findings resulted from the investigation:
- -
- There were 178 respondents with higher education, with 122 from the urban areas and 56 from the rural areas;
- -
- There were 77 respondents with postgraduate degrees, 63 of them living in urban areas and 14 in rural areas;
- -
- Those with a high school diploma had a score of 71, with 62% coming from urban areas and 38% living in rural areas;
- -
- Other types of education applied to the remaining 3.73% of those who took part in the study (primary, secondary, vocational, or other).
- (e)
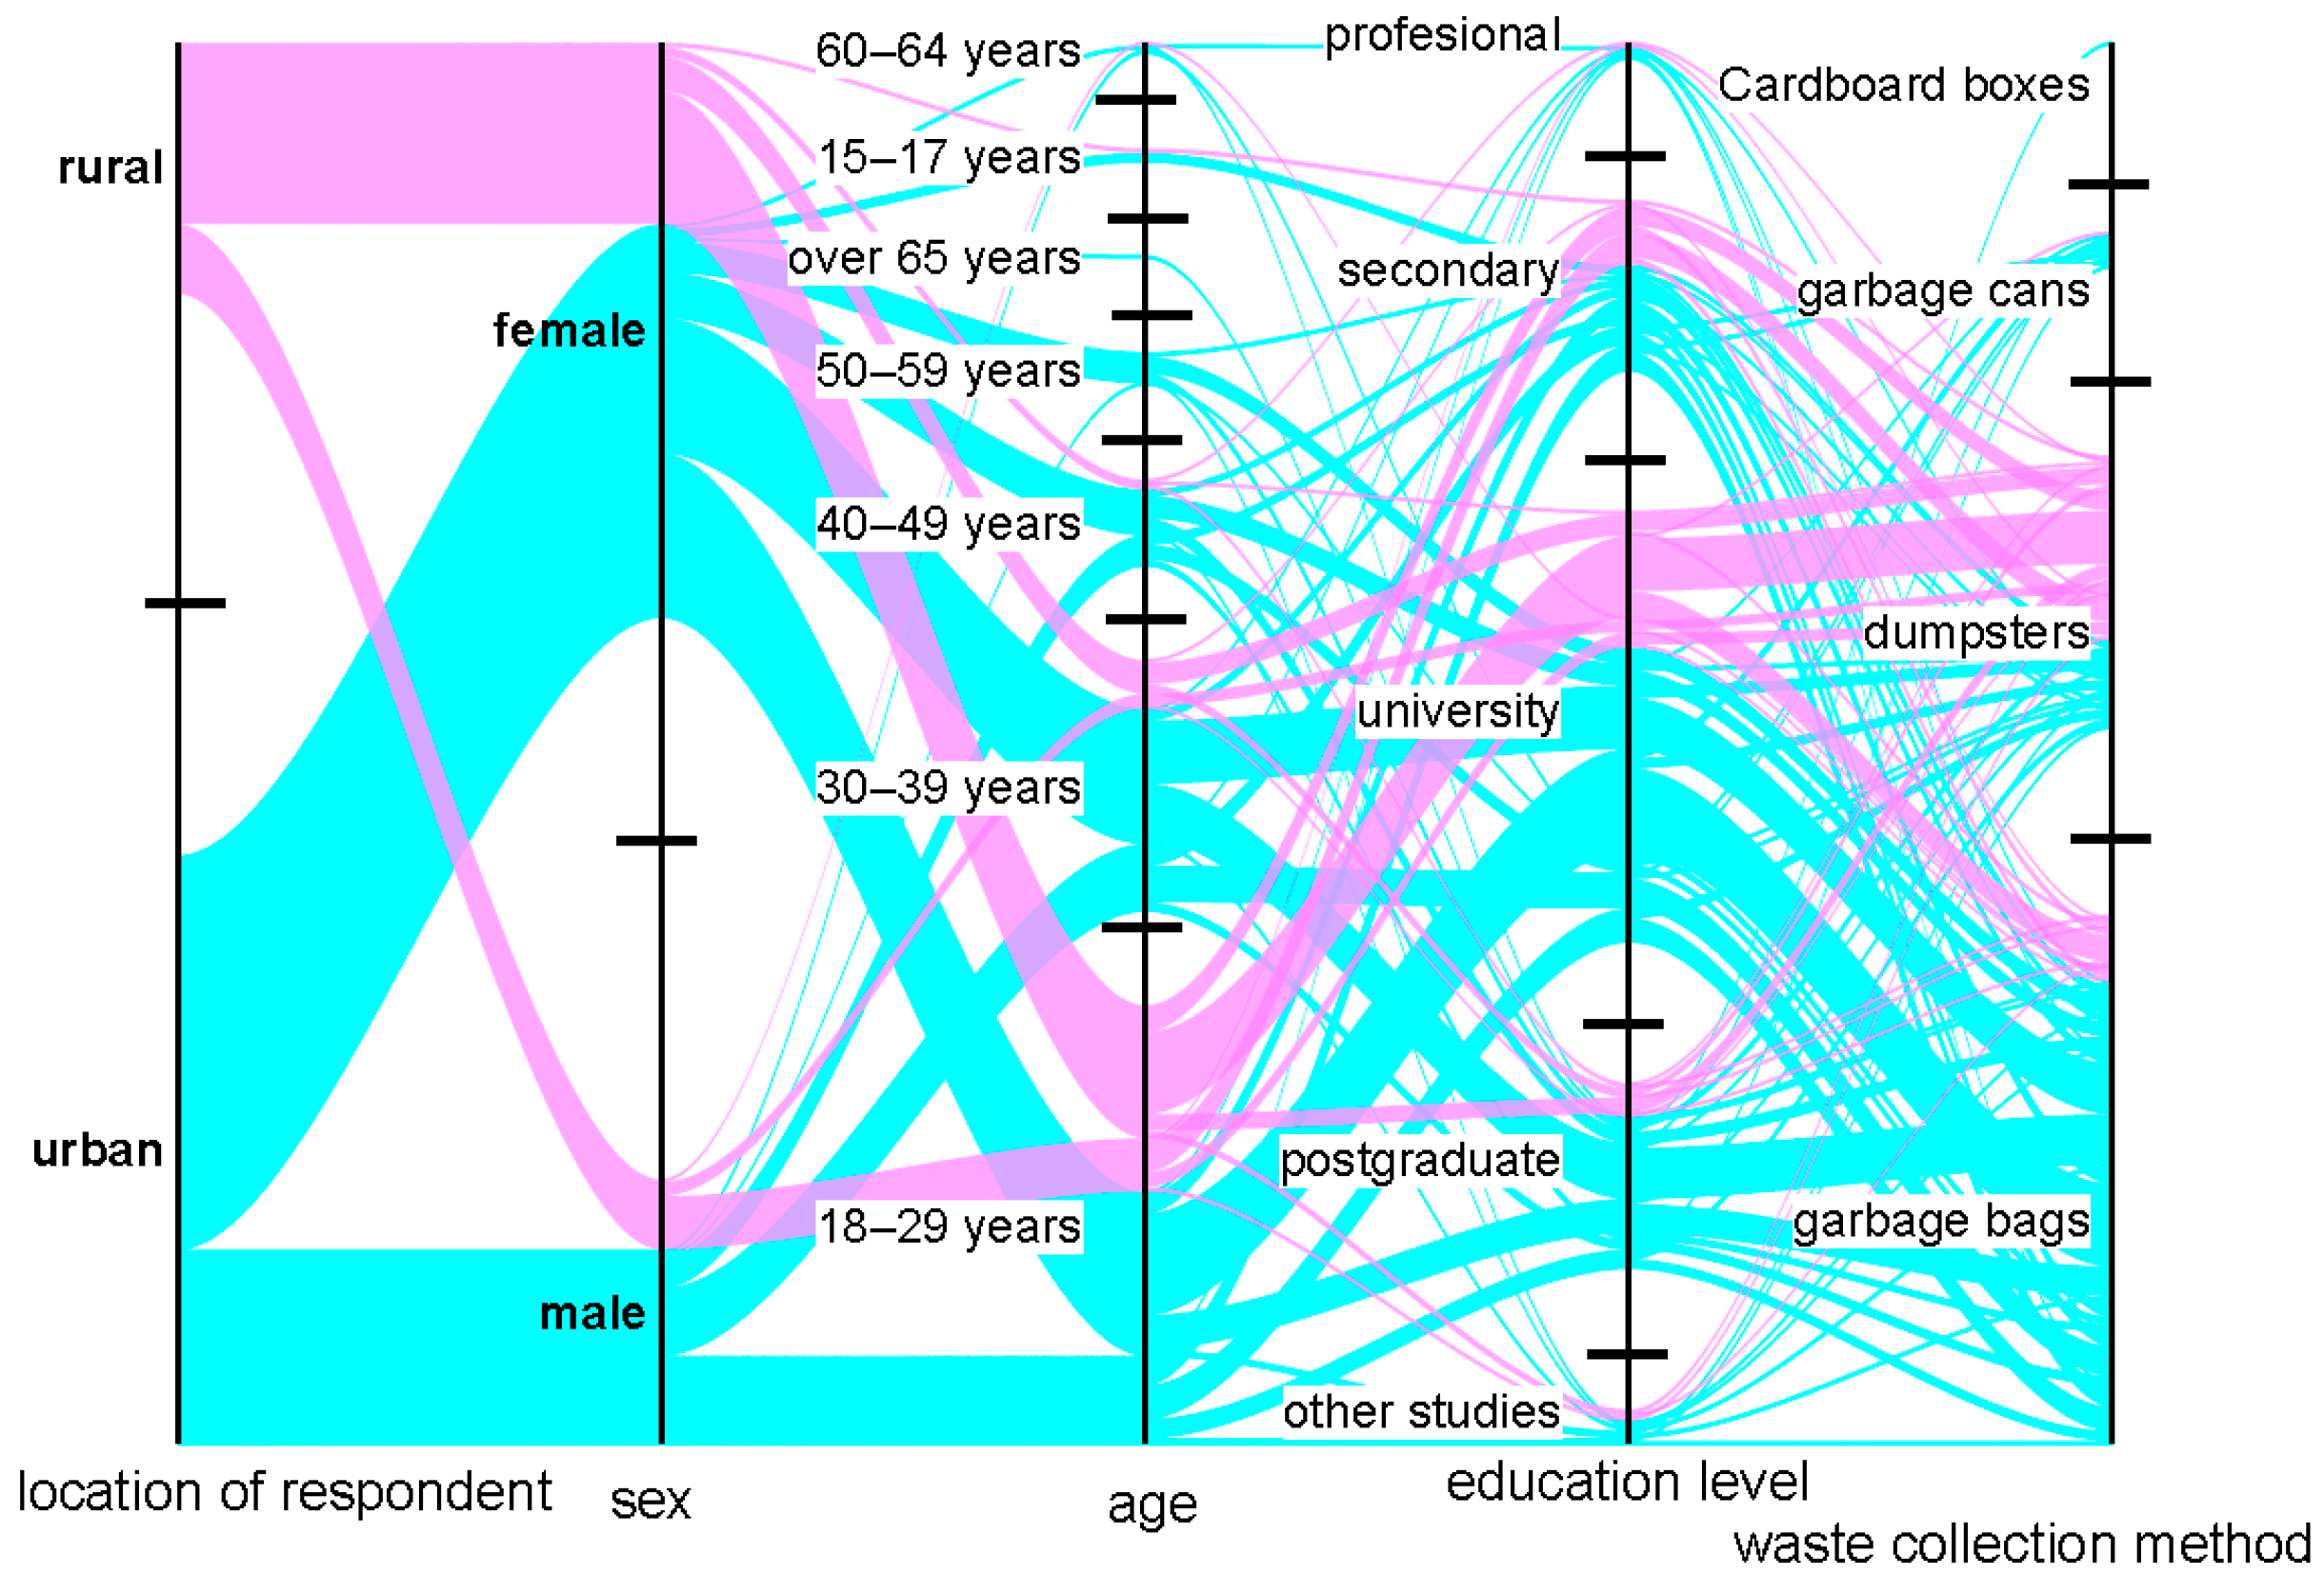
- Several correlations between the characteristics of the studied group of respondents and the method of primary collection of household waste could be identified in a general analysis of the graphical representation in Figure 2. After the analysis, it was determined that:
- -
- Many urban women between the ages of 18 and 29 and between 30 and 39 who have finished their university and postgraduate degrees collect household waste in household bags;
- -
- Most urban men between the ages of 18 and 29 and between 30 and 39, with a high school or university degree, collect home waste in garbage bags;
- -
- The majority of women in rural areas, between the ages of 18 and 29, with college degrees, collect household waste in landfills;
- -
- In rural areas, most men between the ages of 18 and 29 with a high school education are responsible for collecting household waste in the trash.
- -
- The highest share of used bags for segregation (79.01%) was in the urban area which underlined the importance of larger settlements in the efficiency of waste management;
- -
- The significant influence on garbage collection method was age, which was confirmed by the highest share of 74.29% of respondents being aged 40–49 aged collecting in garbage bags;
- -
- Men from the city and rural areas with higher education in the 18–29 age group have a significant impact on waste collection in Bacau County.
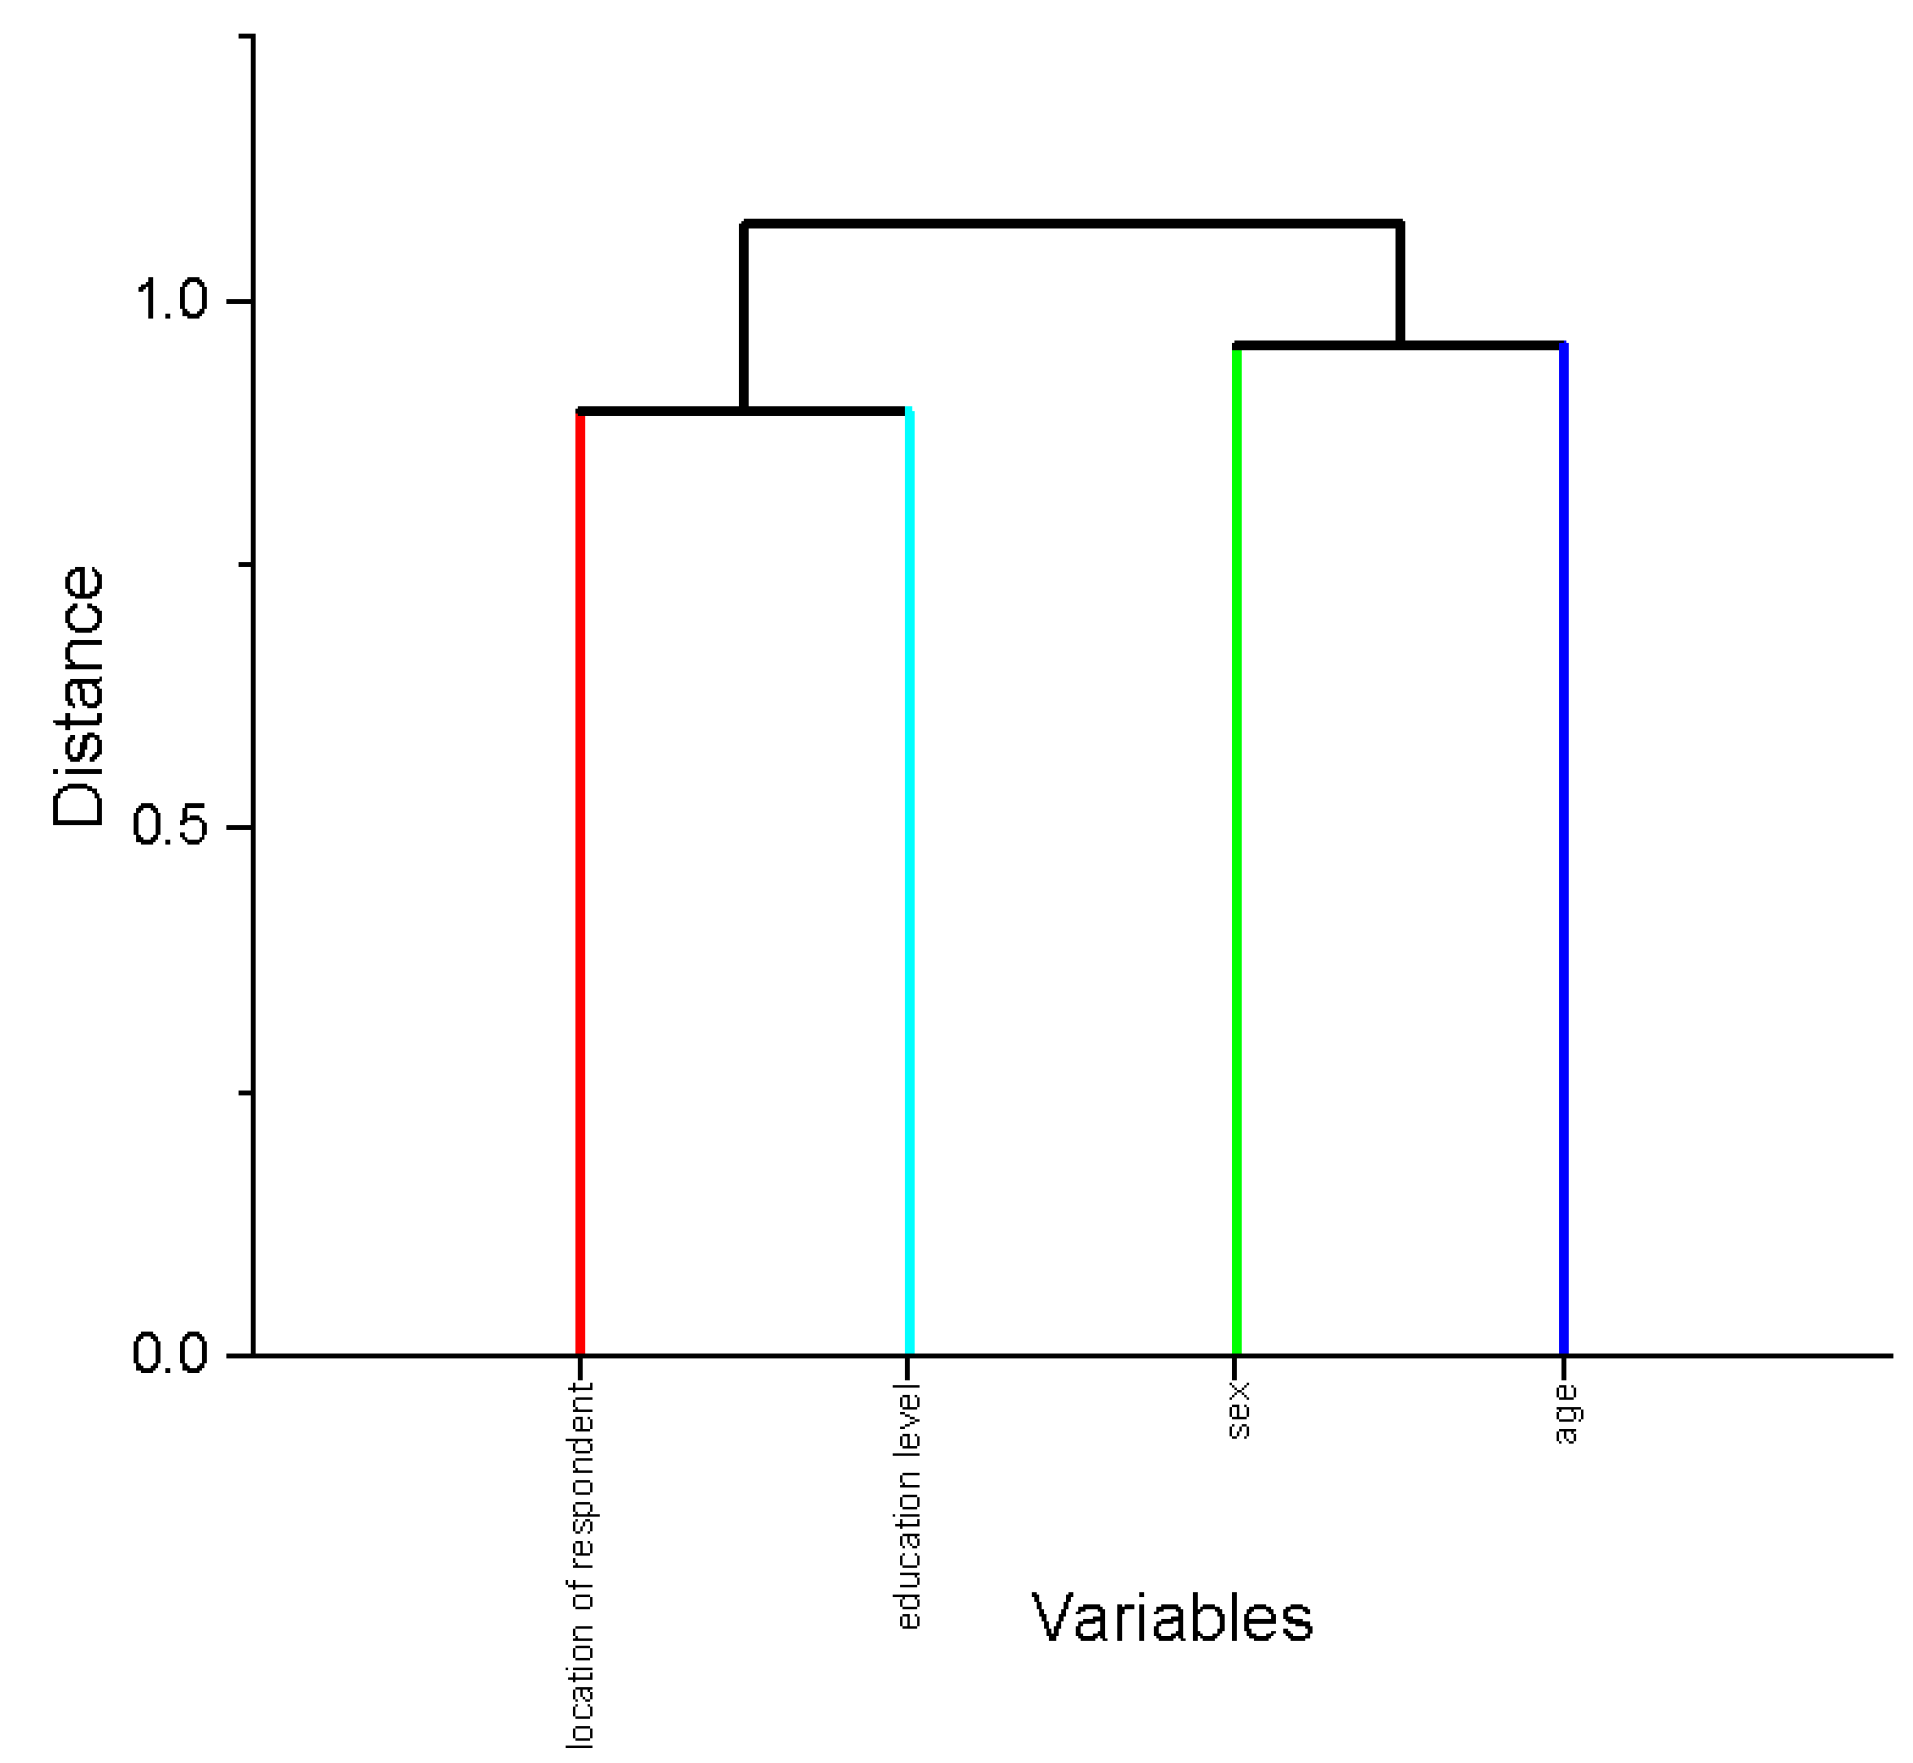
- -
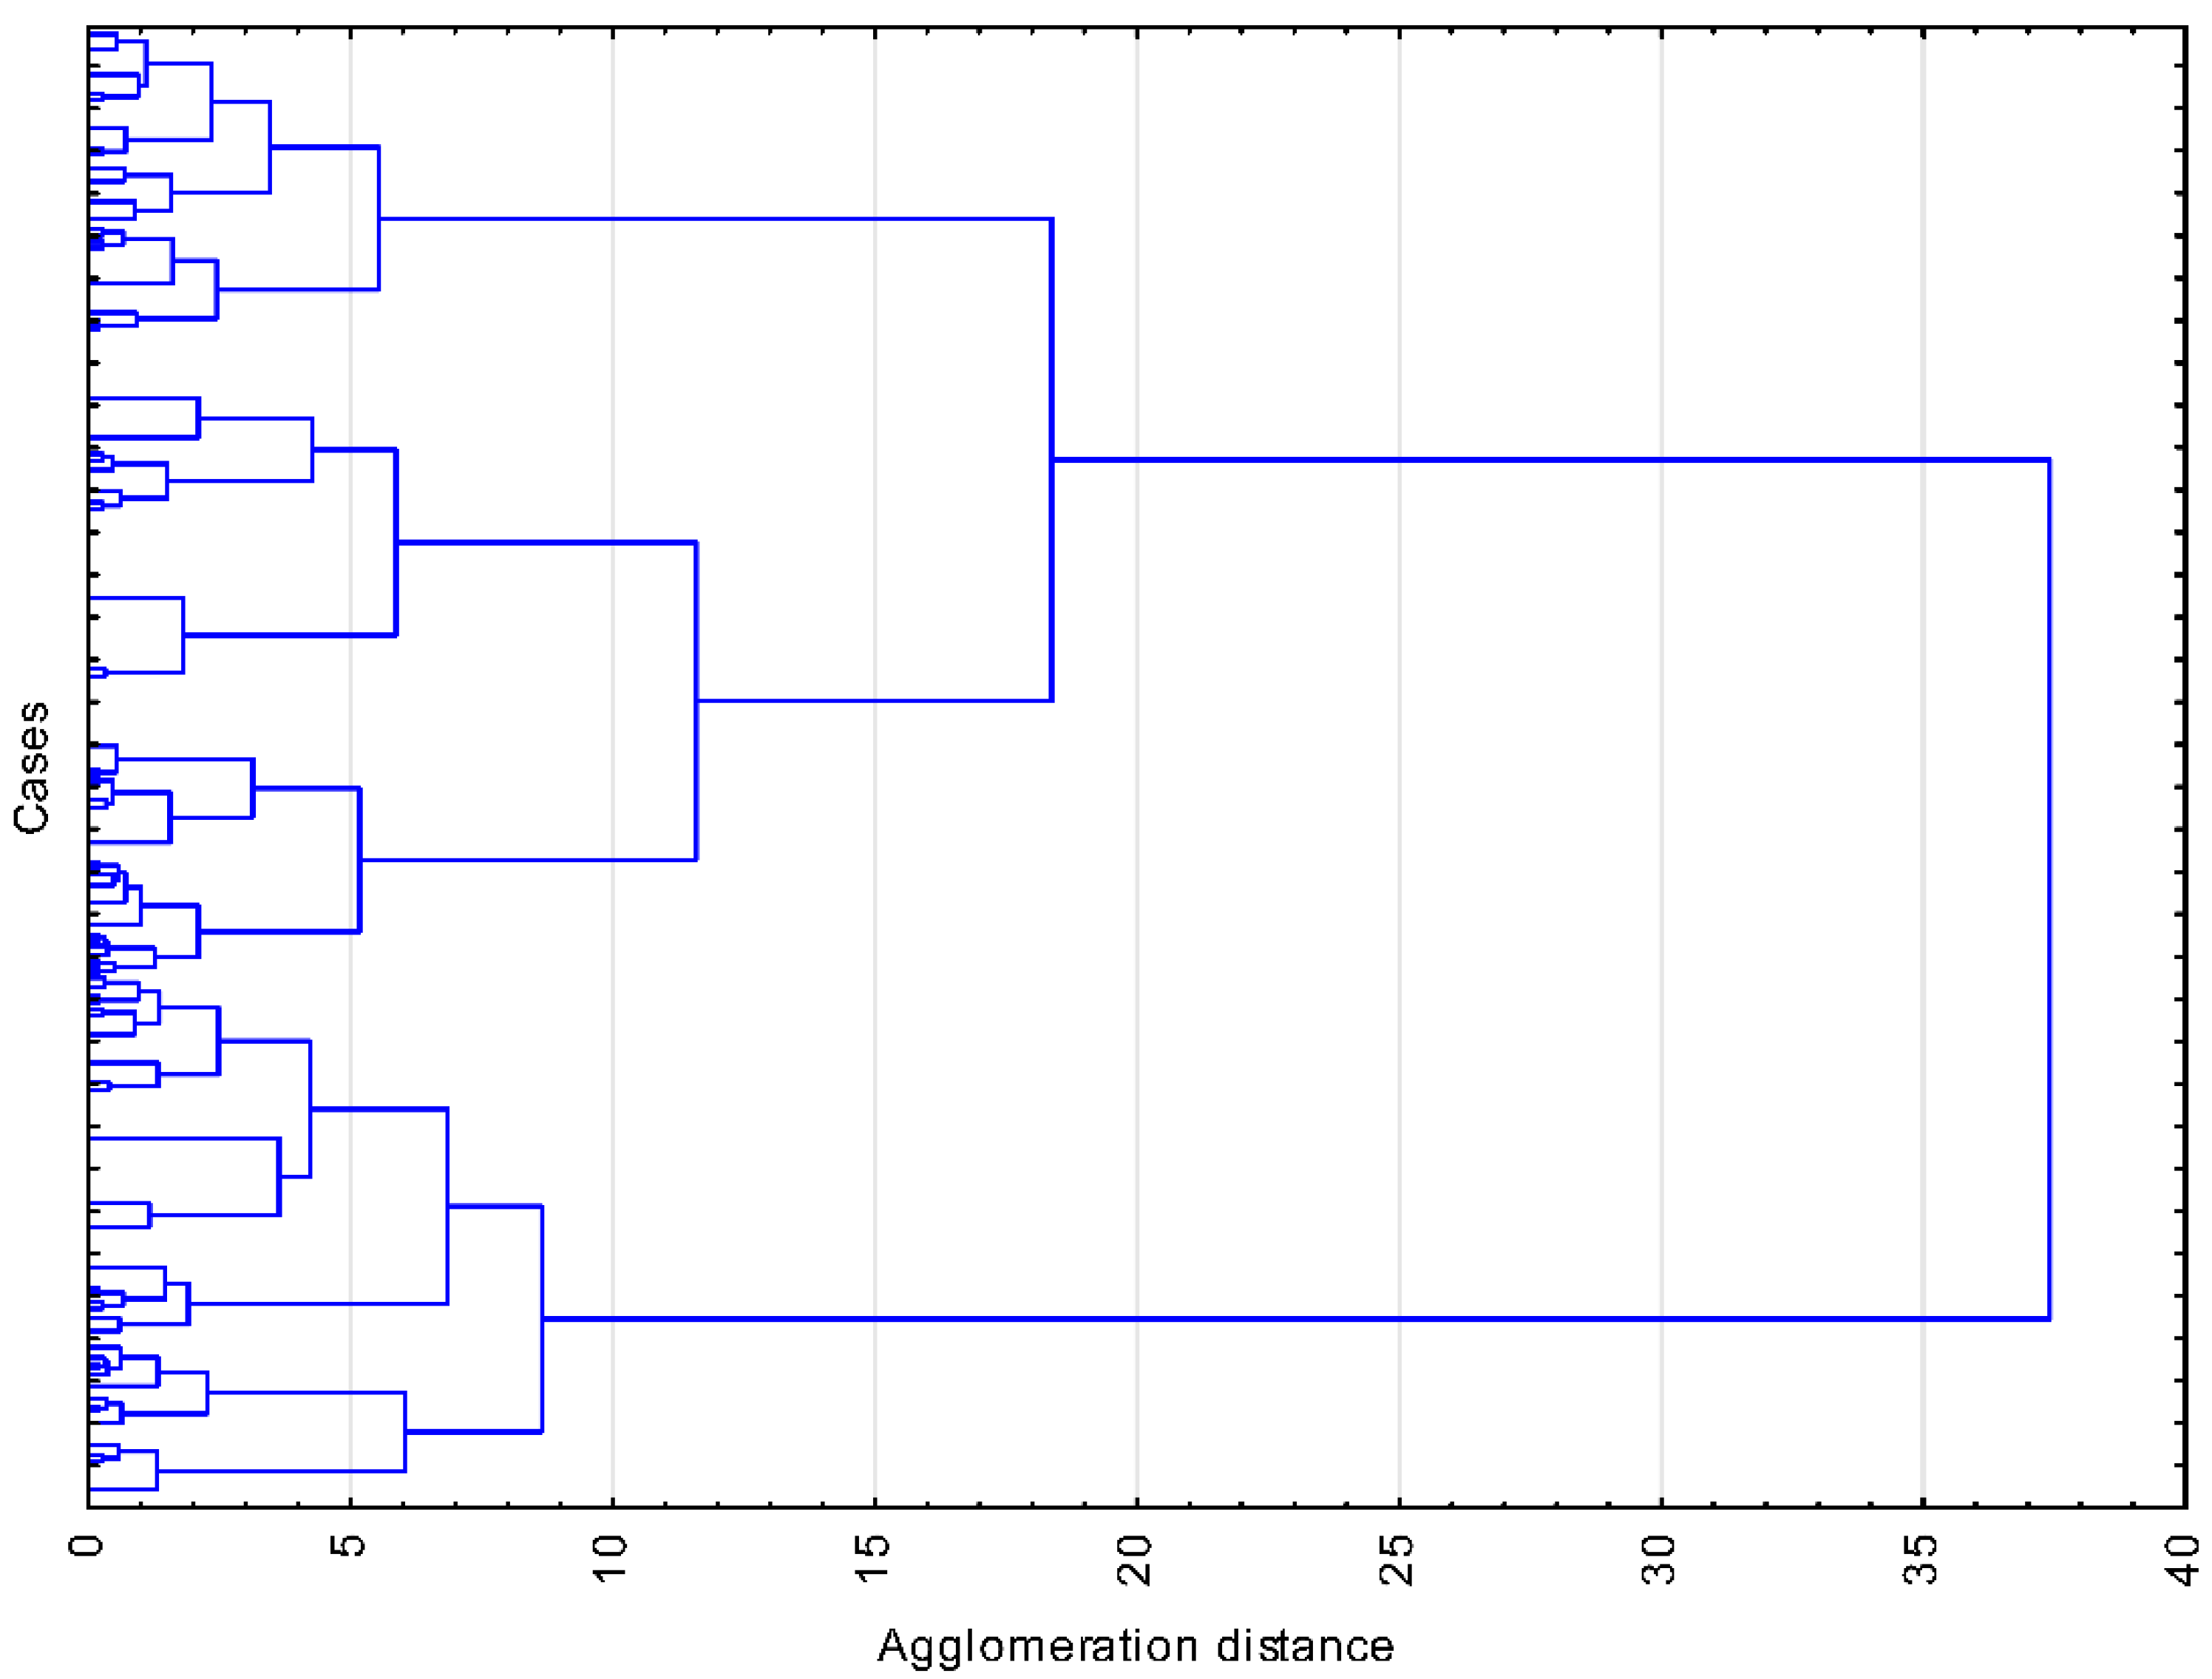
- two clusters were identified, the first at a distance of 0.89, consisting of the level of education and location of the respondents, and the second cluster at a distance of 0.95, consisting of the respondent gender and age;
- -
- the third cluster, which was secondary, connected the other two main clusters, the distance was 1.07;
- -
- the last factor, with a distance of 1.08, was the location of the respondent.
4. Conclusions
- ○
- The share of respondents corresponding to the urban area was 70.1%, and the respondents from the rural area accounted for 29.9%;
- ○
- Regardless of the reference area of the respondents, the number of female respondents who participated in the study was 36.8% higher than the number of male respondents;
- ○
- The best efficiency of waste management was felt in the urban area which was confirmed by the highest share of used bags for segregation (79.01%).
- ○
- Taking into account the level of education of the respondents, 178 respondents had higher education, 77 respondents had postgraduate studies, and 71 respondents only had high school studies;
- ○
- In terms of age, in this online survey, it was found that the largest share was held by respondents aged between 18 and 29, namely 182 respondents, followed by respondents aged between 30 and 39 years, numbering 104 respondents;
- ○
- As a method of collection of household waste, it was found that the collection of waste in garbage bags accounted for 62.9%, followed by collection in dumpsters at 32.4%, and collection into garbage cans at 4.3%;
- ○
- Statistical analysis was done to find the relationships between the study’s input and output parameters. For this reason, a cluster statistical analysis was used. Following these analyses, a series of correlations were identified.
- ○
- The identification of the method of primary collection of waste generated by the population aimed to achieve an overview of the understanding of the concept of collection by the population;
- ○
- Waste management was significant for young women who come from a city with higher education;
- ○
- In conclusion from the questionnaire, it can be said that the level of education and gender are the main factors that directly influence the collection of municipal waste, followed by the age of the respondent and the place where the respondent lives.
Author Contributions
Funding
Institutional Review Board Statement
Informed Consent Statement
Data Availability Statement
Conflicts of Interest
References
- Abdallah, M.; Adghim, M.; Maraqa, M.; Aldahab, E. Simulation and optimization of dynamic waste collection routes. Waste Manag. Res. 2019, 37, 793–802. [Google Scholar] [CrossRef] [Green Version]
- Agovino, M.; Ferrara, M.; Garofalo, A. Determinants of separate waste collection in Italy: A multidimensional analysis at the provincial level. Environ. Dev. Sustain. 2017, 19, 2297–2316. [Google Scholar] [CrossRef]
- Rodrigues, S.; Martinho, G.; Pires, A. Waste collection systems. Part A: A taxonomy. J. Clean. Prod. 2016, 113, 374–387. [Google Scholar] [CrossRef]
- Ulfik, A.; Nowak, S. Determinants of municipal waste management in the sustainable development of Polish regions. Pol. J. Environ. Stud. 2014, 23, 1039–1044. [Google Scholar]
- Ianos, I.; Zamfir, D.; Stoica, I.; Cercleux, A.-L.; Schvab, A.; Pascariu, G. Solid municipal waste management for the sustainable development of the Bucharest metropolitan area. Environ. Eng. Manag. J. 2012, 11, 359–369. [Google Scholar] [CrossRef]
- Ahmad, M.; Tri, U.; Tri, W.; Novia, R. Empowering the community in the field of waste management for sustainable development. IOP Conf. Ser. Earth Environ. Sci. 2019, 281, 012019. [Google Scholar] [CrossRef]
- Abderrahmane, Y.; Okkacha, Y.; Hassiba, B. Sustainable solid waste management in Mecheria (western Algeria). Energy Procedia 2014, 50, 953–959. [Google Scholar]
- Ahmed, N. Sustainable Community Waste Collection in Karachi, Pakistan. Proc. Inst. Civ. Eng. Eng. Sustain. 2009, 162, 169–176. [Google Scholar] [CrossRef]
- Dugdhe, S.; Shelar, P.; Jire, S.; Apte, A. Efficient waste collection system. In Proceedings of the 2016 International Conference on Internet of Things and Applications (IOTA), Pune, India, 22–24 January 2016; pp. 143–147. [Google Scholar]
- Giel, R.; Plewa, M. The evaluation method of the process of municipal waste collection. In Proceedings of the Carpathian Logistics Congress, Jesenik, Czech Republic, 4–6 November 2015; pp. 281–287. [Google Scholar]
- Jucá, J.F.T.; Barbosa, K.R.M.; Sobral, M.C. Sustainability Indicators for Municipal Solid Waste Management: A Case Study of the Recife Metropolitan Region, Brazil. Waste Manag. Res. 2020, 38, 1450–1454. [Google Scholar] [CrossRef]
- Laurieri, N.; Lucchese, A.; Marino, A.; Digiesi, S. Case study of a door-to-door waste collection system: A study on its sustainability and effectiveness. Sustainability 2020, 12, 5520. [Google Scholar] [CrossRef]
- Mondal, M.M.; Speier, C.J.; Weichgrebe, D. A multi-step approach to sustainable municipal solid waste collection systems in urban areas of newly industrialized Asian countries. Environ. Manag. 2019, 63, 536–553. [Google Scholar] [CrossRef]
- Mosnegutu, E.; Panainte-Lehadus, M.; Nedeff, F.; Tirtoaca, O.; Tomozei, C. Waste management evaluation of in the context of sustainable development. Case study Vasile Alecsandri University from Bacau. Int. J. Conserv. Sci. 2020, 11, 179–188. [Google Scholar]
- Siu, K.W.M.; Xiao, J.X. Design and management of recycling facilities to participate in household and community recycling. Facilities 2016, 34, 350–374. [Google Scholar] [CrossRef]
- Cole, C.; Quddus, M.; Wheatley, A.; Osmani, M.; Kay, K. The impact of local government interventions on household waste collection: A case study approach using time series modeling. Waste Manag. 2014, 34, 266–272. [Google Scholar]
- Dahlen, L.; Vukicevic, S.; Meijer, J.E.; Lagerkvist, A. Comparison of different sorted household waste collection systems in Sweden. Waste Manag. 2007, 27, 1298–1305. [Google Scholar]
- Dahlen, L.; Lagerkvist, A. Evaluation of recycling programs in household waste collection systems. Waste Manag. Res. 2010, 28, 577–586. [Google Scholar] [CrossRef]
- Jouhara, H.; Czajczynska, D.; Ghazal, H.; Krzyiynska, R.; Anguilano, L.; Reynolds, K.J.; Spencer, N. Municipal household waste management systems. Energy 2017, 139, 485–506. [Google Scholar] [CrossRef]
- Kassim, S.M.; Ali, M. Solid Waste Collection by the Private Sector: A Household Perspective - Findings from a Study in Dar es Salaam, Tanzania. Habitat. Int. 2006, 30, 769–780. [Google Scholar]
- Lakhan, C. Assessing the effects of unit-based waste disposal systems on the collection of recyclable household materials in Ontario, Canada. Resour. Conserv. Recy. 2015, 95, 38–45. [Google Scholar]
- Mwanza, B.G.; Mbohwa, C.; Telukdarie, A. The influence of waste collection systems on resource recovery: A Review. Procedia Manufact. 2018, 21, 846–853. [Google Scholar]
- Warunasinghe, W.; Yapa, P.I. A survey on household solid waste management (SWM) with special reference to a suburban area (Kottawa) in Colombo. Procedia Food Sci. 2016, 6, 257–260. [Google Scholar]
- Desa, A.; Kadir, N.B.y.A.; Yusooff, F. Waste education and awareness strategy: Towards solid waste management (SWM) program at UKM. Procedia Soc. Behav. Sci. 2012, 59, 47–50. [Google Scholar] [CrossRef] [Green Version]
- Del Cimmuto, A.; Mannocci, A.; Ribatti, D.; Boccia, A.; La Torre, G. Impact on knowledge and behaviour of the general population of two different methods of solid waste management: An explorative cross-sectional study. Waste Manag. Res. 2014, 32, 556–561. [Google Scholar] [CrossRef]
- Hirsh, J. Environmental sustainability and national personality. J. Environ. Psychol. 2014, 38, 233–240. [Google Scholar]
- Abdelli, I.S.; Abdelmalek, F.; Djelloul, A.; Mesghouni, A.; Addou, A. GIS-based approach to optimized household waste collection in Mostaganem (Western Algeria). Waste Manag. Res. 2016, 34, 417–426. [Google Scholar] [CrossRef]
- Arnfelser, F. Systems and installations for the collection of household waste in Vienna. Waste Manag. Res. 1992, 10, 535–541. [Google Scholar]
- Albine, A.D.; Williams, I.D. Explaining the differences between local authorities in England and Wales in the collection and treatment of household food waste. Waste Manag. 2017, 70, 222–235. [Google Scholar]
- Bertanza, G.; Ziliani, E.; Menoni, L. Indicators of technical-economic performance of municipal solid waste collection strategies. Waste Manag. 2018, 74, 86–97. [Google Scholar] [CrossRef]
- Blazquez, C.; Paredes-Belmar, G. Design of the network of a household waste collection system: A case study of the commune of Renca in Santiago, Chile. Waste Manag. 2020, 116, 179–189. [Google Scholar] [CrossRef]
- Chen, H.B.; Zhou, J.C.; Zhang, H.L.; Yang, Y. Optimizing household waste collection using the Ahp-Mea model: A case study from Kunming, China. Environ. Eng. Manag. J. 2017, 16, 2887–2899. [Google Scholar]
- Gallardo, A.; Bovea, M.D.; Mendoza, F.J.C.; Prades, M. The evolution of sorted waste collection: A case study of Spanish cities. Waste Manag. Res. 2012, 30, 859–863. [Google Scholar] [CrossRef] [Green Version]
- Hage, O.; Soderholm, P. An econometric analysis of regional differences in household waste collection: The case of plastic packaging waste in Sweden. Waste Manag. 2008, 28, 1720–1731. [Google Scholar]
- Koushki, P.A.; Al-Duaij, U.; Al-Ghimlas, W. The cost of collecting and transporting solid household waste in Kuwait. Waste Manag. 2004, 24, 957–964. [Google Scholar] [CrossRef]
- Shabanova, M. Separate waste collection in Russia: The level, factors and potential for citizen engagement. Mir Rossii-Universe Russia 2019, 28, 88–112. [Google Scholar]
- Santos Moraes, L.R. Household solid waste bagging and collection and their health implications for children living in outlying urban settlements in Salvador, Bahia State, Brazil. Cad. Saude Publica 2007, 23, S643–S649. [Google Scholar] [CrossRef] [Green Version]
- Oyekale, A.S. Determinants of households’ involvement in waste separation and collection for recycling in South Africa. Environ. Dev. Sustain. 2018, 20, 2343–2371. [Google Scholar] [CrossRef]
- Phu, S.T.P.; Fujiwara, T.; Minh, G.H.; Van, D.P. Solid waste management practice in a tourist destination - status and challenges: A Case study in Hoi An, Vietnam. Waste Manag. Res. 2019, 37, 1077–1088. [Google Scholar] [CrossRef]
- Miranda, P.A.; Blazquez, C.A.; Vergara, R.; Weitzler, S. A new methodology for designing a waste collection system for island areas. Transport. Res. E-Log. 2015, 77, 227–247. [Google Scholar]
- Mas Pertiwi, I.; Kristinayanti, W.S.; Sudiasa, W.; Andayani, K.W. Bali Badung waste management system, based on community behavior. IOP Conf. Ser. Mater. Sci. Eng. 2019, 690, 012009. [Google Scholar] [CrossRef] [Green Version]
- Escortar, L.M. Study on the collection of household waste in urban communities, Cluj County. In Proceedings of the 6th International Management Conference: Approaches in Organizational Management, Buchares, Romania, 15–16 November 2012; pp. 749–755. [Google Scholar]
- Kadir, A.A.; Sani, M. Study of solid waste composition at Taman Universities, Parit Raja, Batu Pahat. In IOP-Materials Science and Engineering Conference Series, Proceedings of the Soft Soil Engineering International Conference 2015, Langkawi, Malaysia, 27–29 October 2015; IOP: Bristol, UK, 2016; Volume 136. [Google Scholar]
- Vilms, M.; Kalda, O. Introduction of a new system for sorting and collecting waste at a university. In Proceedings of the the 10th International Conference on Environmental Engineering, Vilnius, Lithuania, 27–28 April 2017. [Google Scholar]
- Oliveira, V.; Sousa, V.; Dias-Ferreira, C. Dataset of socio-economic and waste collection indicators for Portugal at municipal level. Data Brief 2019, 22, 658–661. [Google Scholar] [CrossRef]
- Wang, H.; El, J.; Kim, Y.; Kamata, T. Municipal solid waste management in rural areas and small counties: An economic analysis using contingent assessment to estimate willingness to pay for Yunnan, China. Waste Manag. Res. 2014, 32, 695–706. [Google Scholar] [CrossRef]
- Vasloban, E.; Oroian, M.; Rusu, C. The integrated waste management system of Mureș County, Romania. Technol. Chang. Manag. 2009, 2, 159–161. [Google Scholar]
- Soukopova, J.; Kalina, J.; Hrebicek, J. Mathematical and economic model of municipal waste management using Maple. In Proceedings of the 32nd International conference on Mathematical Methods in Economics, Olomouc, Czech Republic, 10–12 September 2014; pp. 938–943. [Google Scholar]
- Reis, M.F.; Conti, M.D.; Correa, R.M. Solid waste management: Challenges and opportunities for the city of Sao Paulo. Risus-J. Innov. Sustain. 2015, 6, 77–96. [Google Scholar]
- Liu, T.; Wu, Y.F.; Tian, X.; Gong, Y. Generation and collection of municipal solid waste in Beijing, China. Resour. Conserv. Recy. 2015, 104, 31–37. [Google Scholar]
- Martinho, G.; Gomes, A.; Santos, P.; Ramos, M.; Cardoso, J.; Silveira, A.; Pires, A. A case study of packaging waste collection systems in Portugal - Part I: Performance and operation analysis. Waste Manag. 2017, 61, 96–107. [Google Scholar] [CrossRef]
- Linderhof, V.; Kooreman, P.; Allers, M.; Wiersma, D. Prices based on weight in household waste collection: The case of Oostzaan. Resour. Energy Econ. 2001, 23, 359–371. [Google Scholar]
- Vulpe, M.; Nedeff, V.; Lehadus, D.; Mosnegutu, E.F.; Cotirlet, P.C.; Barsan, N. The implication of the level of education in the perception of waste problems a case study applied to Romanian citizens. Fresenius Environ. Bull. 2021, 30, 7639–7646. [Google Scholar]
- Vulpe, M.; Valentin, N.; Panainte-Lehadus, M.; Mosnegutu, E.F.; Barsan, N.; Tomozei, C. A study of waste management in different areas of Romania. Fresenius Environ. Bull. 2021, 30, 2686–2691. [Google Scholar]
- Mangenda, H.H.; Nedeff, V.; Kunyima, K.; Barsan, N.; Moșneguțu, E.; Tomozei, C. Municipal waste management in Limete, Mont Amba district of Kinshasa, the Democratic Republic of the Congo. J. Eng. Stud. Res. 2014, 20, 39–45. [Google Scholar]
- Merilainen, J.; Tukiainen, J. Public procurement versus Laissez-Faire: Evidence from Household Waste Collection. Cesifo Econ. Stud. 2019, 65, 446–463. [Google Scholar]
- Przydatek, G. A comparative analysis of municipal waste management systems. Pol. J. Environ. Stud. 2016, 25, 2107–2112. [Google Scholar] [CrossRef]
- Tirtoaca Irimia, O.; Grzegorz, P. Comparative analysis of the efficiency of the waste management system in some counties in Romania and Poland. J. Eng. Stud. Res. 2021, 27, 96–106. [Google Scholar]
- Ce Este un Eșantion Reprezentativ. Available online: https://www.parintiicerschimbare.ro/ce-este-un-esantion-reprezentativ/ (accessed on 5 June 2022).


| Class | Number | Contribution [%] |
|---|---|---|
| Location of respondent (pcs.) | ||
| urban | 244 | 70.11 |
| rural | 104 | 29.89 |
| Sex (person) | ||
| female | 110 | 31.61 |
| male | 238 | 68.39 |
| Age (person) | ||
| 18–29 years | 182 | 52.30 |
| 30–39 years | 104 | 29.89 |
| 40–49 years | 36 | 10.34 |
| 50–59 years | 14 | 4.02 |
| 15–17 years | 6 | 1.72 |
| 60–64 years | 5 | 1.44 |
| above 65 years | 1 | 0.29 |
| Education level (person) | ||
| university | 178 | 51.15 |
| postgraduate | 77 | 22.13 |
| secondary | 71 | 20.40 |
| other studies | 15 | 4.31 |
| professional | 7 | 2.01 |
| Waste collection method (pcs.) | ||
| garbage bags | 219 | 62.93 |
| dumpsters | 113 | 32.47 |
| garbage cans | 16 | 4.31 |
| cardboard boxes | 1 | 0.28 |
| Location of Respondent | Waste Collection Method/Contribution [%] | Total | ||
|---|---|---|---|---|
| Garbage Bags | Dumpsters | Garbage Cans | ||
| Urban | 79.01% | 15.23% | 5.76% | 70.03% |
| Rural | 25.96% | 73.08% | 0.96% | 29.97% |
| Total | 63.11% | 32.56% | 4.32% | 100.00% |
| Age | Waste Collection Method/Contribution [%] | Total | ||
|---|---|---|---|---|
| Garbage Bags | Dumpsters | Garbage Cans | ||
| 18–29 years | 54.40% | 41.21% | 4.40% | 52.45% |
| 30–39 years | 73.08% | 23.08% | 3.85% | 29.97% |
| 40–49 years | 74.29% | 17.14% | 8.57% | 10.09% |
| 50–59 years | 71.43% | 28.57% | 0.00% | 4.03% |
| 15–17 years | 33.33% | 66.67% | 0.00% | 1.73% |
| 60–64 years | 100.00% | 0.00% | 0.00% | 1.44% |
| below 65 years | 100.00% | 0.00% | 0.00% | 0.29% |
| Total | 63.11% | 32.56% | 4.32% | 100.00% |
| Statistic Location of Respondent × Waste Collection Method | |||
|---|---|---|---|
| Statistic | Chi2 | df | p |
| Chi2 Pearson | 111.2061 | df = 2 | p = 0.0000 |
| Chi2 ML | 109.9521 | df = 2 | p = 0.0000 |
| Statistic Age × Waste Collection Method | |||
|---|---|---|---|
| Statistic | Chi2 | df | p |
| Chi2 Pearson | 23.22422 | df = 12 | p = 0.02588 |
| Chi2 NW | 25.98123 | df = 12 | p = 0.01080 |
Publisher’s Note: MDPI stays neutral with regard to jurisdictional claims in published maps and institutional affiliations. |
© 2022 by the authors. Licensee MDPI, Basel, Switzerland. This article is an open access article distributed under the terms and conditions of the Creative Commons Attribution (CC BY) license (https://creativecommons.org/licenses/by/4.0/).
Share and Cite
Panainte-Lehadus, M.; Vulpe, M.; Nedeff, V.; Mosnegutu, E.; Przydatek, G.; Tomozei, C.; Chitimus, D. Study on the Method of Household Waste Collection: Case Study. Appl. Sci. 2022, 12, 7490. https://doi.org/10.3390/app12157490
Panainte-Lehadus M, Vulpe M, Nedeff V, Mosnegutu E, Przydatek G, Tomozei C, Chitimus D. Study on the Method of Household Waste Collection: Case Study. Applied Sciences. 2022; 12(15):7490. https://doi.org/10.3390/app12157490
Chicago/Turabian StylePanainte-Lehadus, Mirela, Mihai Vulpe, Valentin Nedeff, Emilian Mosnegutu, Grzegorz Przydatek, Claudia Tomozei, and Dana Chitimus. 2022. "Study on the Method of Household Waste Collection: Case Study" Applied Sciences 12, no. 15: 7490. https://doi.org/10.3390/app12157490
APA StylePanainte-Lehadus, M., Vulpe, M., Nedeff, V., Mosnegutu, E., Przydatek, G., Tomozei, C., & Chitimus, D. (2022). Study on the Method of Household Waste Collection: Case Study. Applied Sciences, 12(15), 7490. https://doi.org/10.3390/app12157490