
Investigating Attention Mechanism for Page Object Detection in Document Images

 ,
,  ,
,  ,
, 
Abstract
:1. Introduction
2. Related Work
2.1. Page Object Detection
2.1.1. Traditional Approach
2.1.2. Deep Learning Approach
2.2. Attention Mechanism
3. Method
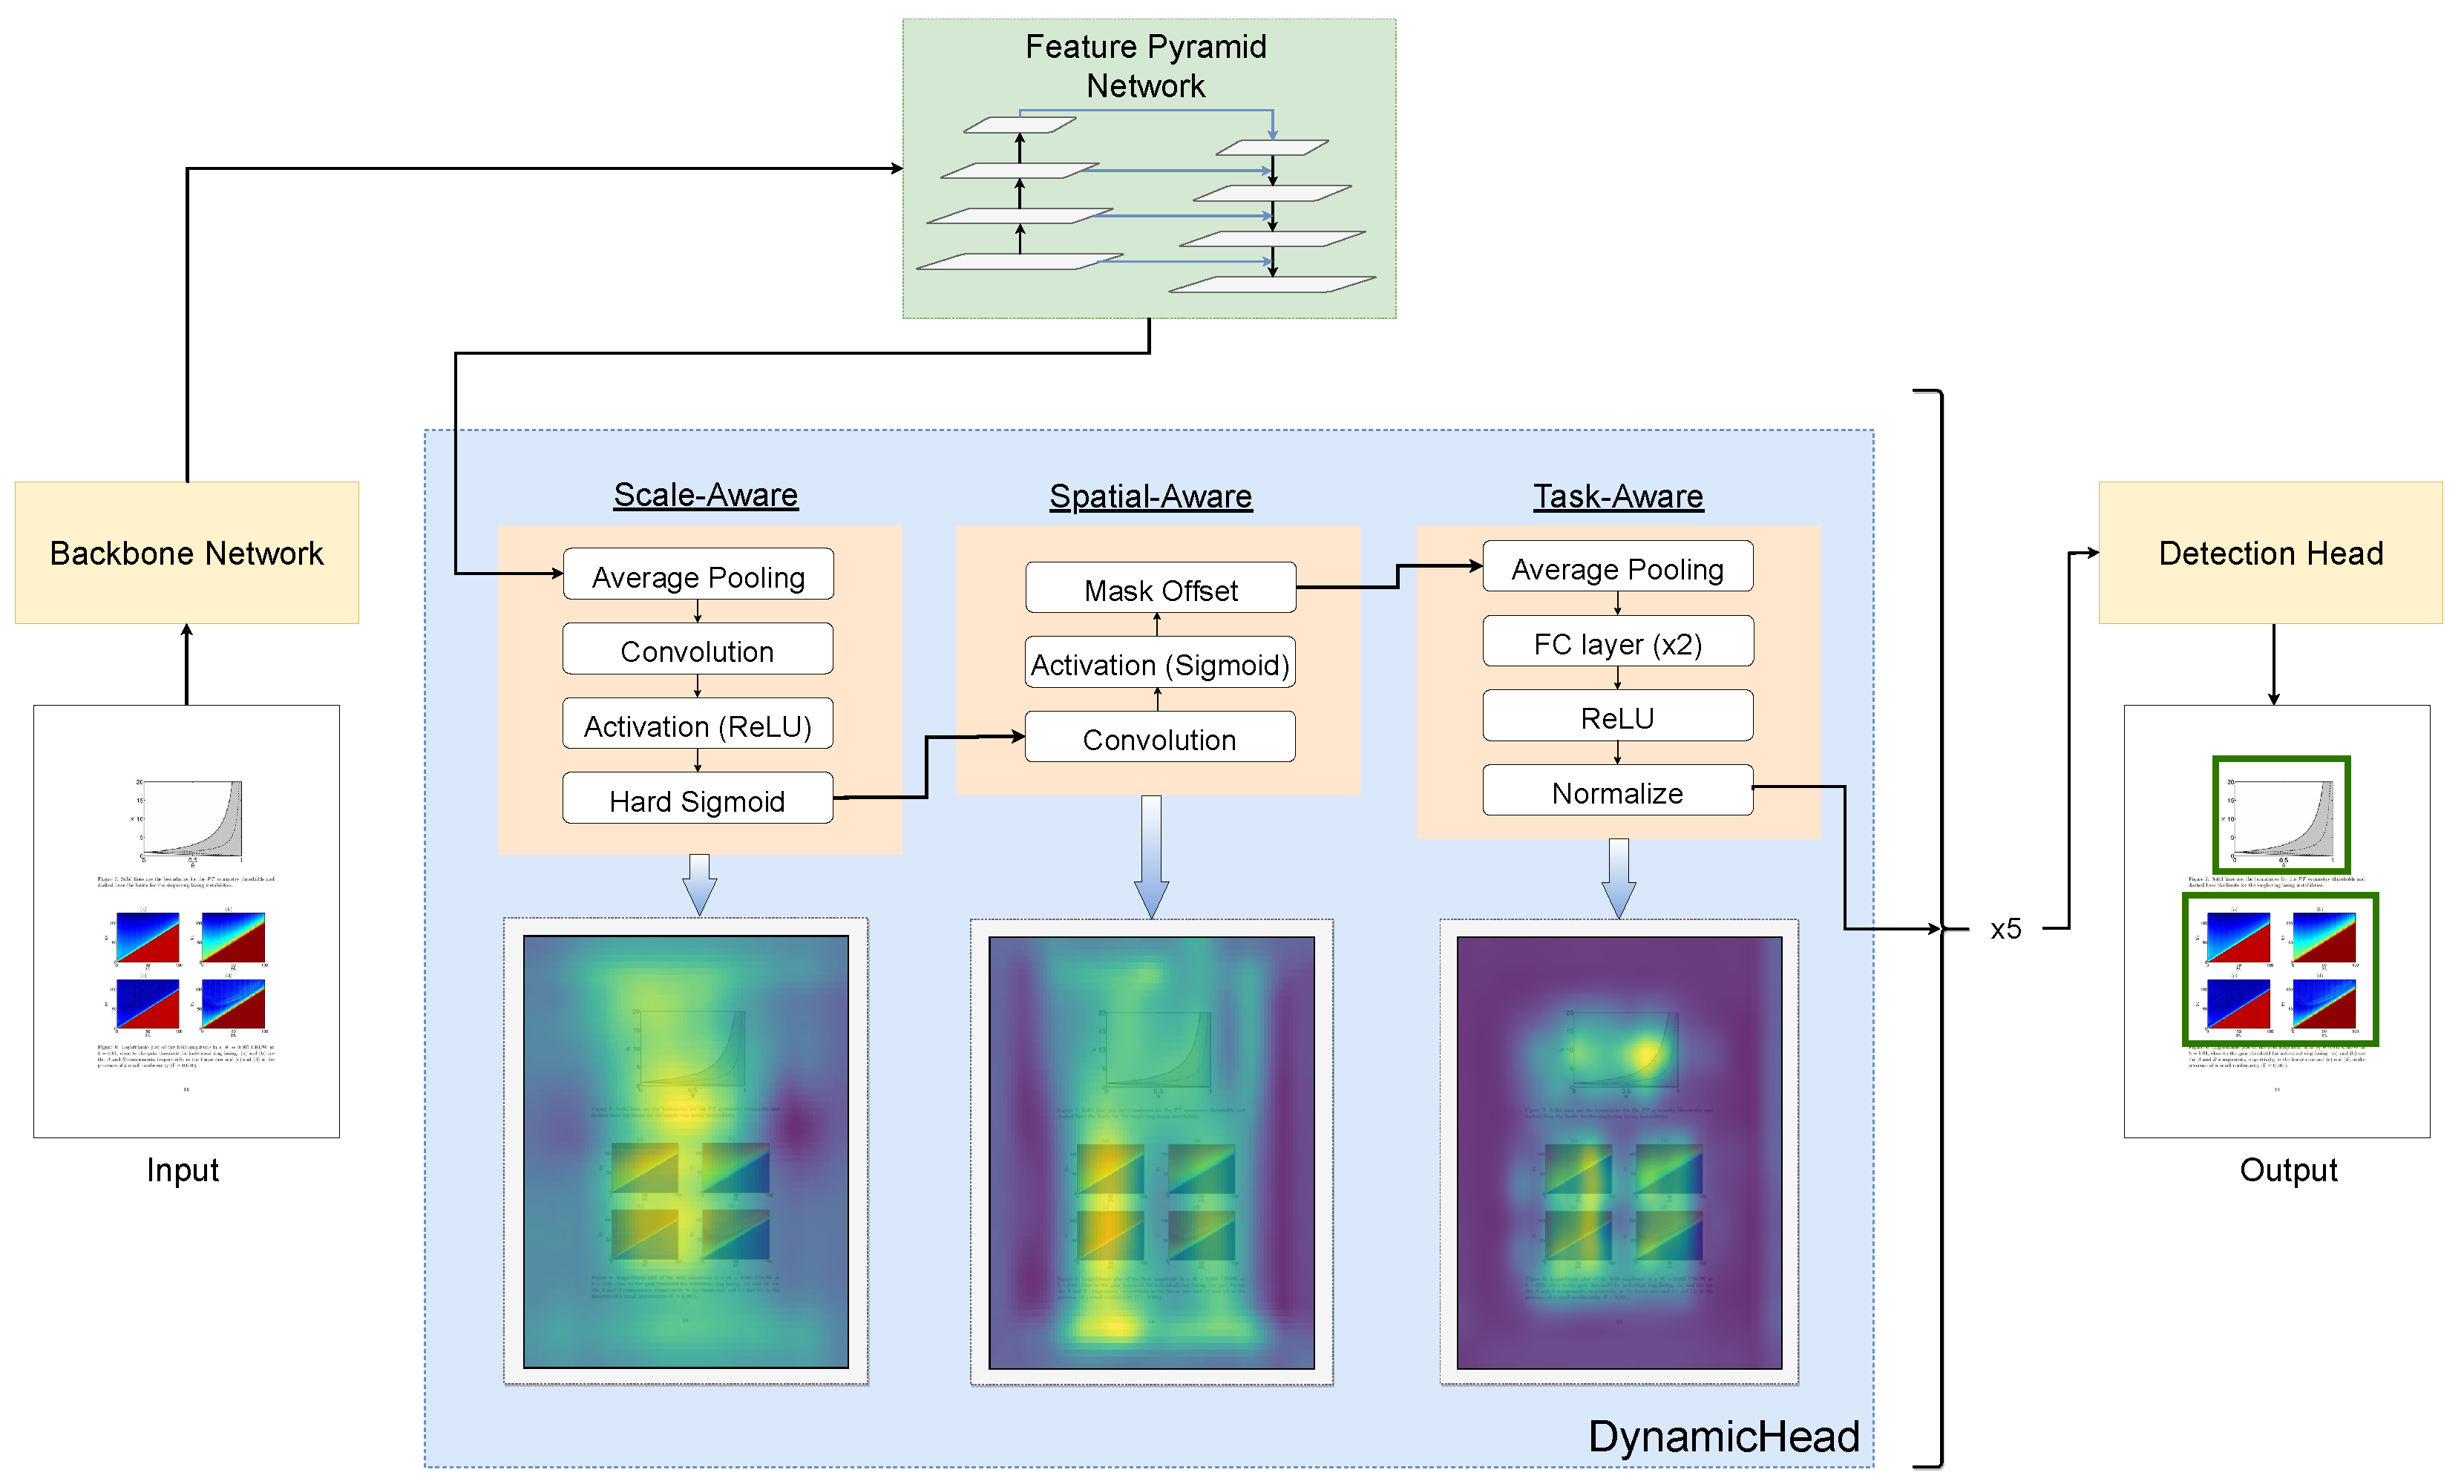
3.1. DynamicHead
3.1.1. Scale-Aware Attention
3.1.2. Spatial-Aware Attention
3.1.3. Task-Aware Attention
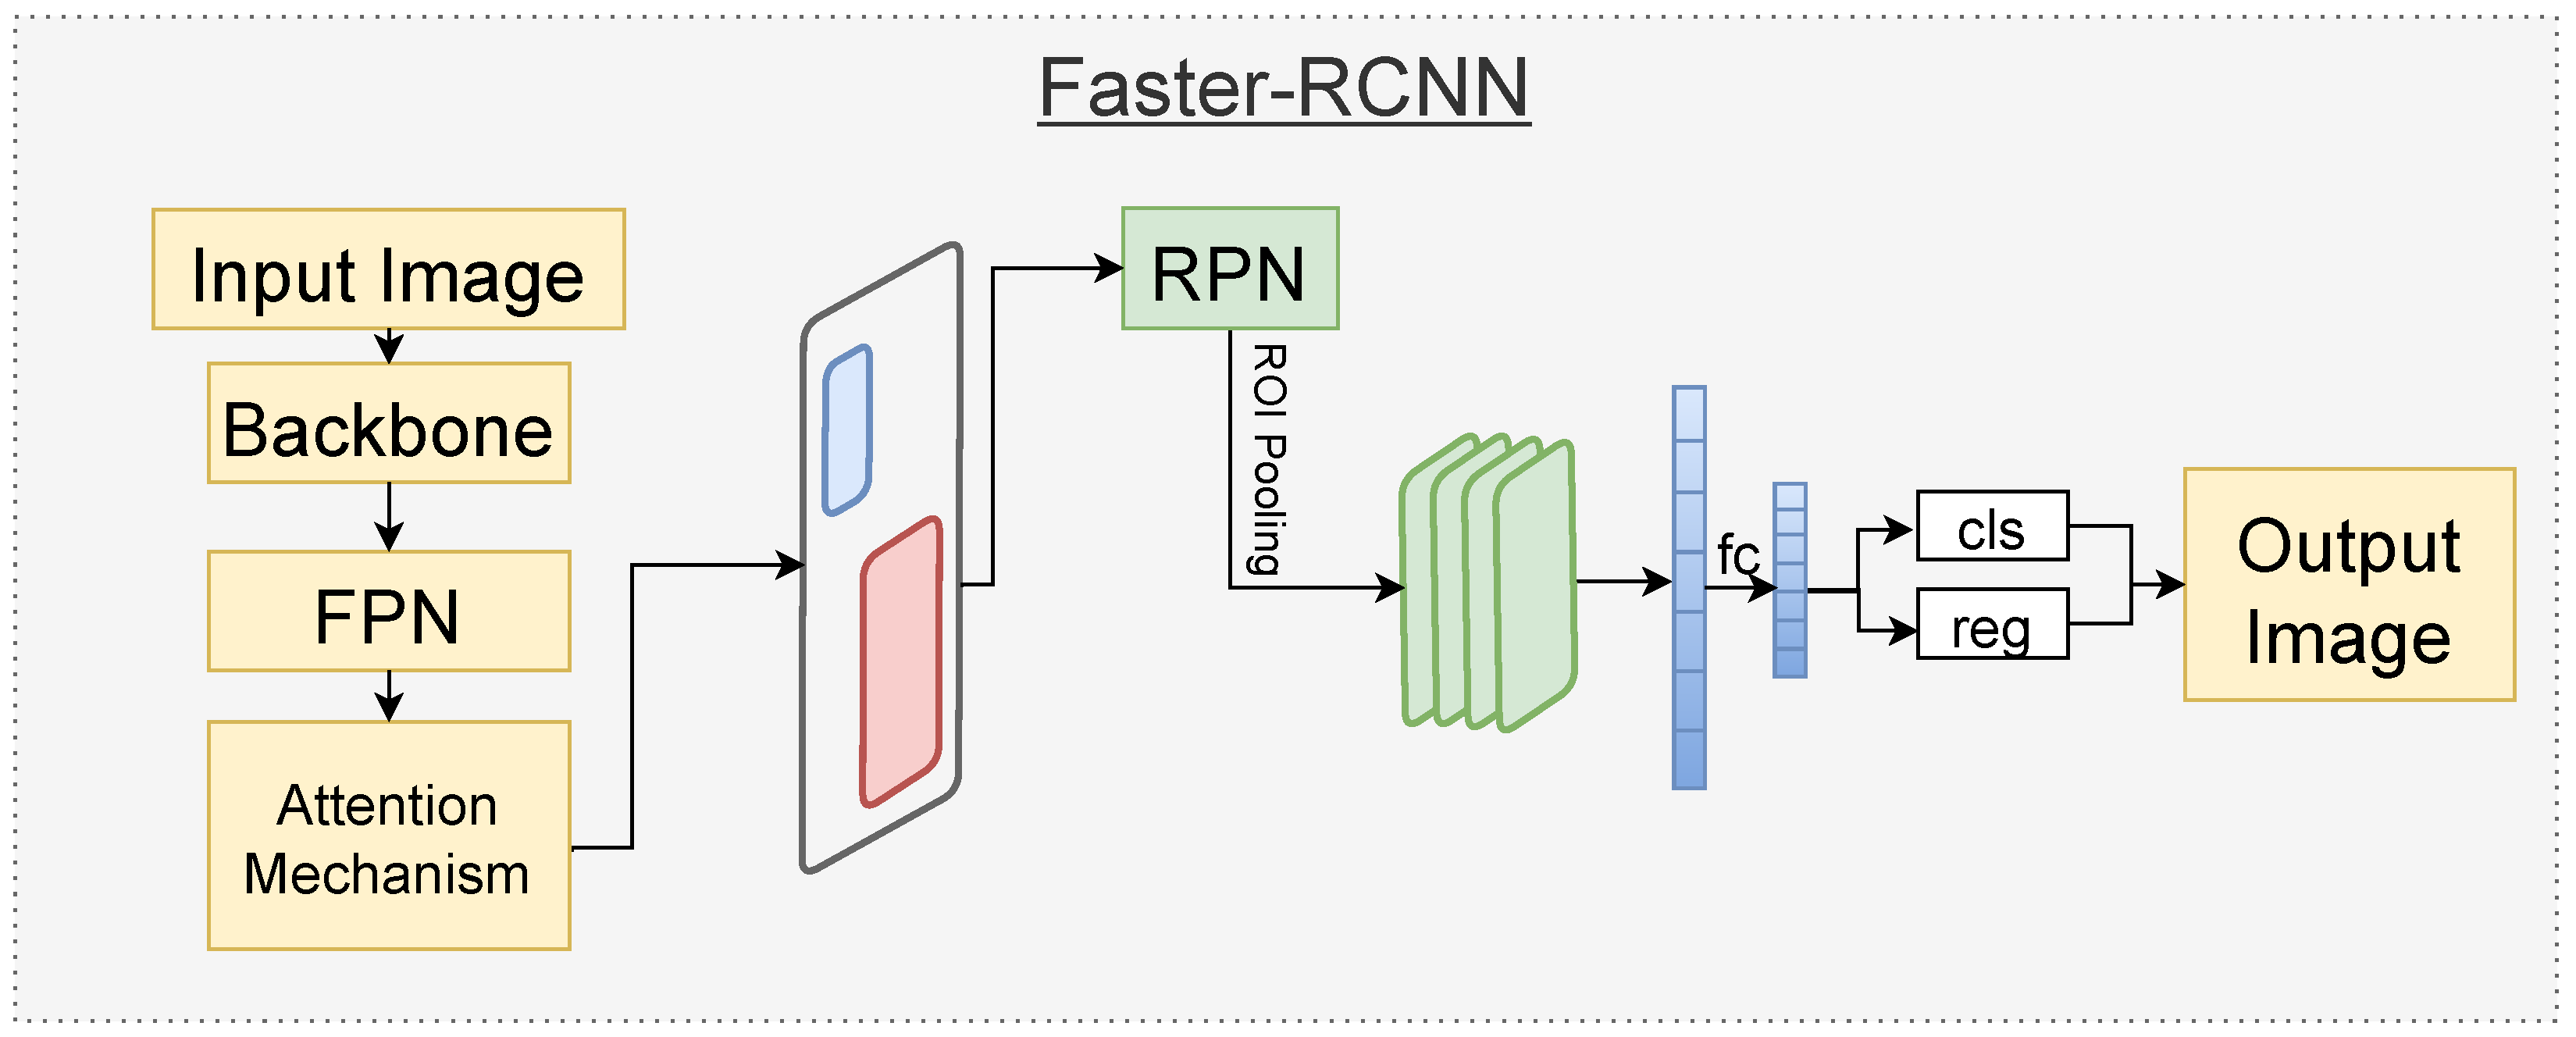
3.2. Detection Head
3.2.1. Faster-RCNN
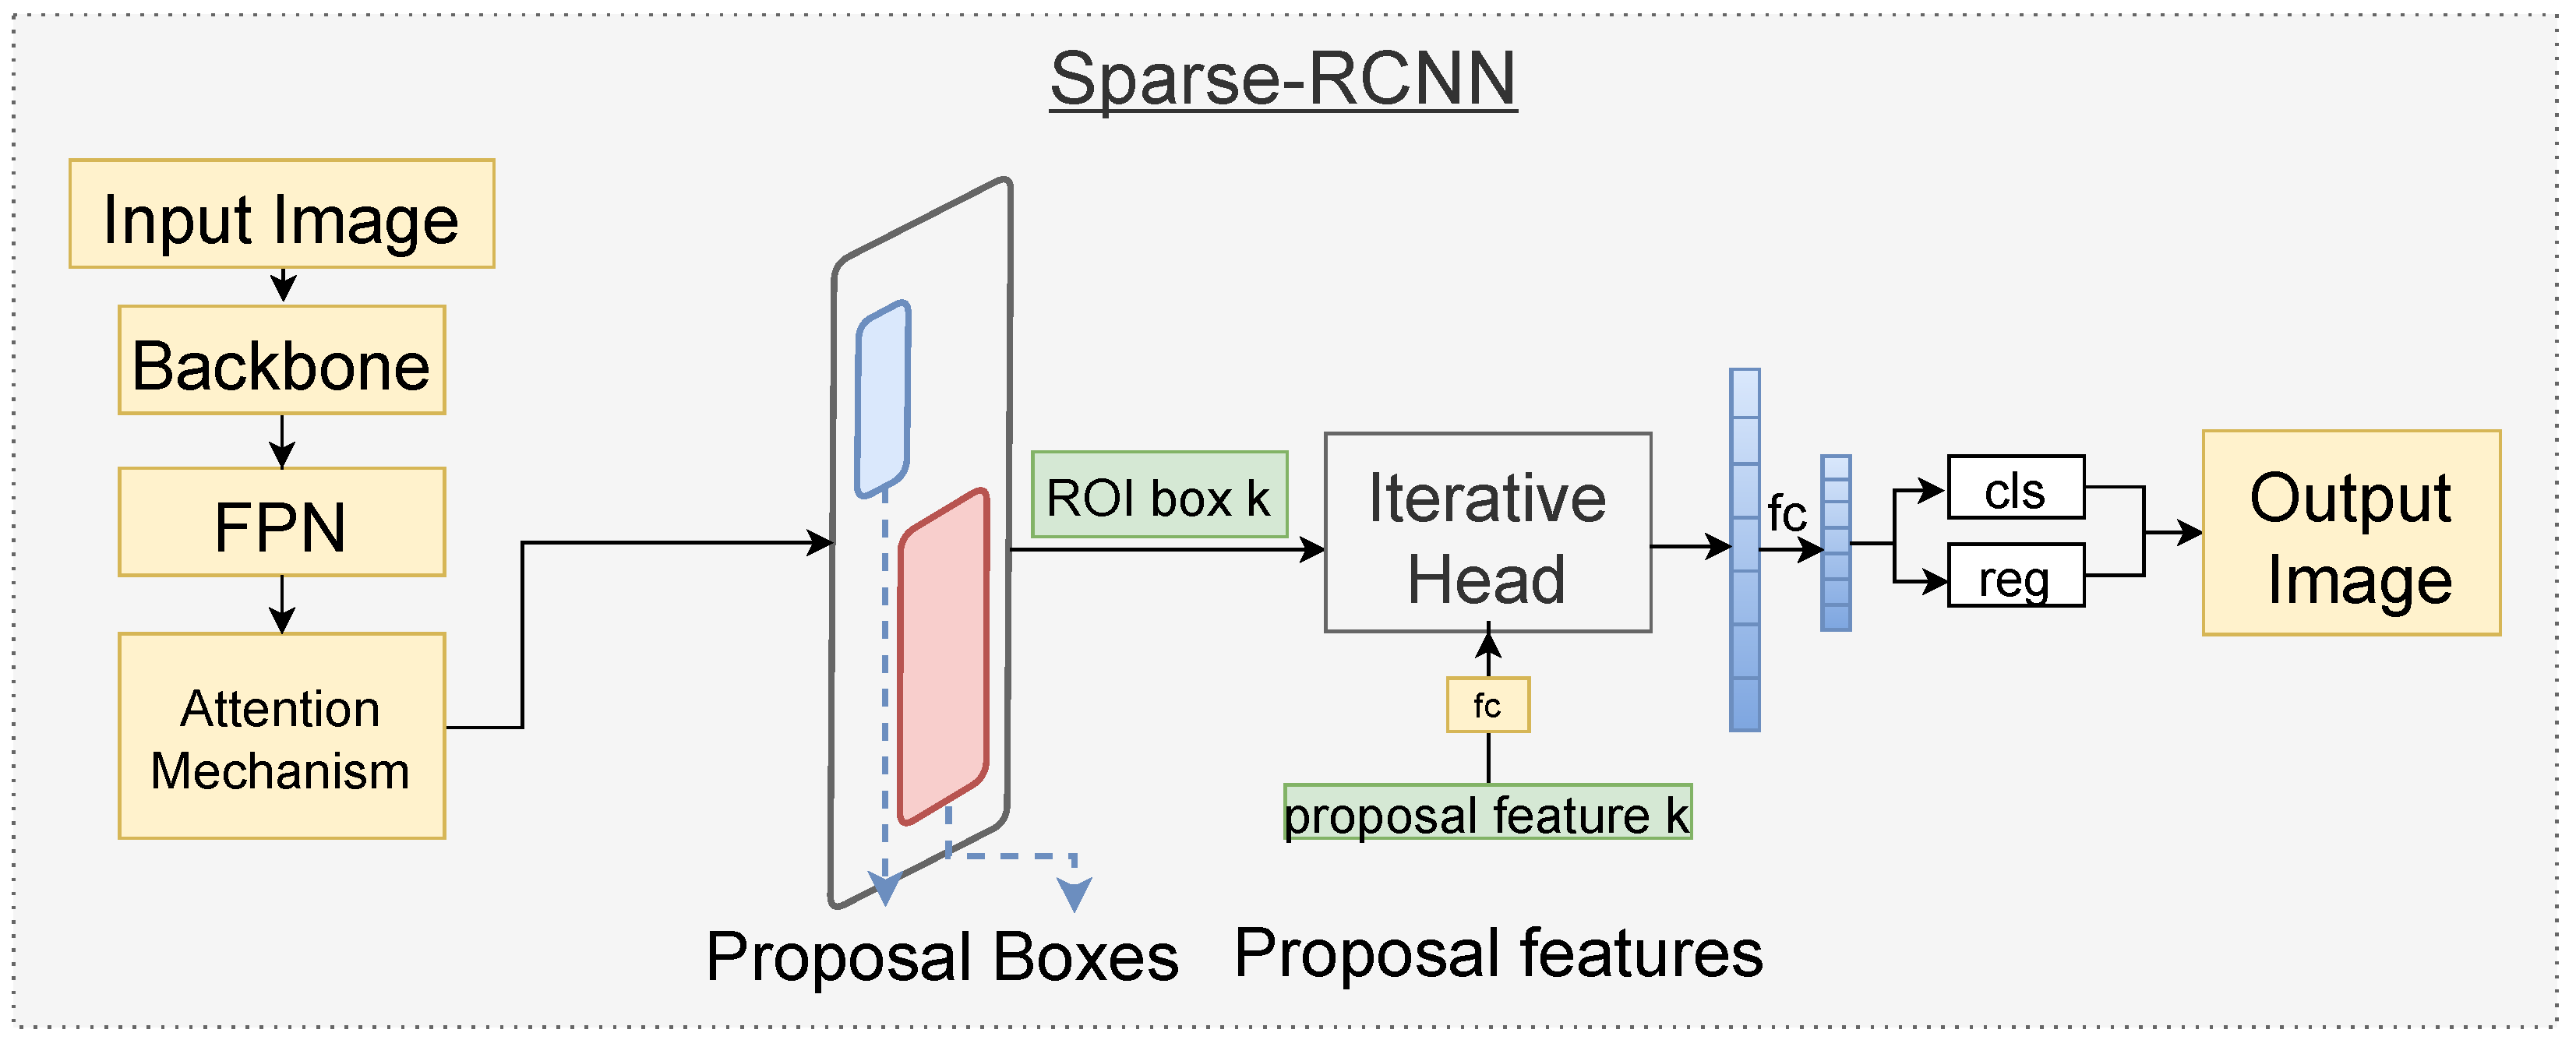
3.2.2. Sparse-RCNN
4. Experiments
4.1. Experimental Setup
4.2. Evaluation Metrics
4.2.1. Precision
4.2.2. Recall
4.2.3. F1-Score
4.2.4. Average Precision (AP)
4.2.5. Intersection over Union (IoU)
4.3. Dataset Details
5. Results and Discussion
5.1. DocBank
5.2. PublayNet
5.3. IIIT-AR-13K
5.4. Cross-Dataset Evaluation
5.5. Computational Analysis
6. Conclusions and Future Work
Author Contributions
Funding
Institutional Review Board Statement
Informed Consent Statement
Data Availability Statement
Conflicts of Interest
References
- To, W.M.; Yu, B. Rise in higher education researchers and academic publications. Emerald Open Res. 2020, 2, 3. [Google Scholar] [CrossRef] [Green Version]
- Smith, R. An Overview of the Tesseract OCR Engine. In Proceedings of the 9th International Conference on Document Analysis and Recognition (ICDAR 2007), Curitiba, Brazil, 23–26 September 2007; pp. 629–633. [Google Scholar] [CrossRef] [Green Version]
- Vargas, R.; Mosavi, A.; Ruiz, R. Deep Learning: A Review. Adv. Intell. Syst. Comput. 2017, 5. [Google Scholar] [CrossRef]
- Hashmi, K.A.; Ponnappa, R.B.; Bukhari, S.S.; Jenckel, M.; Dengel, A. Feedback learning: Automating the process of correcting and completing the extracted information. In Proceedings of the 2019 International Conference on Document Analysis and Recognition Workshops (ICDARW), Sydney, NSW, Australia, 22–25 September 2019; Volume 5, pp. 116–121. [Google Scholar]
- Saha, R.; Mondal, A.; Jawahar, C.V. Graphical Object Detection in Document Images. In Proceedings of the 2019 International Conference on Document Analysis and Recognition, ICDAR 2019, Sydney, Australia, 20–25 September 2019; pp. 51–58. [Google Scholar] [CrossRef]
- Hashmi, K.A.; Pagani, A.; Liwicki, M.; Stricker, D.; Afzal, M.Z. CasTabDetectoRS: Cascade Network for Table Detection in Document Images with Recursive Feature Pyramid and Switchable Atrous Convolution. J. Imaging 2021, 7, 214. [Google Scholar] [CrossRef]
- Nazir, D.; Hashmi, K.A.; Pagani, A.; Liwicki, M.; Stricker, D.; Afzal, M.Z. HybridTabNet: Towards Better Table Detection in Scanned Document Images. Appl. Sci. 2021, 11, 8396. [Google Scholar] [CrossRef]
- Hashmi, K.A.; Pagani, A.; Liwicki, M.; Stricker, D.; Afzal, M.Z. Cascade Network with Deformable Composite Backbone for Formula Detection in Scanned Document Images. Appl. Sci. 2021, 11, 7610. [Google Scholar] [CrossRef]
- Antonacopoulos, A.; Clausner, C.; Papadopoulos, C.; Pletschacher, S. Historical document layout analysis competition. In Proceedings of the 2011 International Conference on Document Analysis and Recognition, Beijing, China, 18–21 September 2011; pp. 1516–1520. [Google Scholar]
- Ren, S.; He, K.; Girshick, R.B.; Sun, J. Faster R-CNN: Towards Real-Time Object Detection with Region Proposal Networks. arXiv 2015, arXiv:1506.01497. [Google Scholar] [CrossRef] [Green Version]
- He, K.; Gkioxari, G.; Dollár, P.; Girshick, R.B. Mask R-CNN. arXiv 2017, arXiv:1703.06870. [Google Scholar]
- He, K.; Zhang, X.; Ren, S.; Sun, J. Deep Residual Learning for Image Recognition. arXiv 2015, arXiv:1512.03385. [Google Scholar]
- Bahdanau, D.; Cho, K.; Bengio, Y. Neural Machine Translation by Jointly Learning to Align and Translate. In Proceedings of the 3rd International Conference on Learning Representations, ICLR 2015, San Diego, CA, USA, 7–9 May 2015. [Google Scholar]
- Kalchbrenner, N.; Blunsom, P. Recurrent Continuous Translation Models. In Proceedings of the 2013 Conference on Empirical Methods in Natural Language Processing, EMNLP 2013, Grand Hyatt Seattle, Seattle, WA, USA, 18–21 October 2013; pp. 1700–1709. [Google Scholar]
- Luong, T.; Sutskever, I.; Le, Q.V.; Vinyals, O.; Zaremba, W. Addressing the Rare Word Problem in Neural Machine Translation. arXiv 2014, arXiv:1410.8206. [Google Scholar]
- Cho, K.; van Merrienboer, B.; Gülçehre, Ç.; Bougares, F.; Schwenk, H.; Bengio, Y. Learning Phrase Representations using RNN Encoder-Decoder for Statistical Machine Translation. arXiv 2014, arXiv:1406.1078. [Google Scholar]
- Vaswani, A.; Shazeer, N.; Parmar, N.; Uszkoreit, J.; Jones, L.; Gomez, A.N.; Kaiser, L.; Polosukhin, I. Attention Is All You Need. arXiv 2017, arXiv:1706.03762. [Google Scholar]
- Dai, X.; Chen, Y.; Xiao, B.; Chen, D.; Liu, M.; Yuan, L.; Zhang, L. Dynamic Head: Unifying Object Detection Heads with Attentions. arXiv 2021, arXiv:2106.08322. [Google Scholar]
- Li, M.; Xu, Y.; Cui, L.; Huang, S.; Wei, F.; Li, Z.; Zhou, M. DocBank: A Benchmark Dataset for Document Layout Analysis. arXiv 2020, arXiv:2006.01038. [Google Scholar]
- Zhong, X.; Tang, J.; Jimeno-Yepes, A. PubLayNet: Largest dataset ever for document layout analysis. arXiv 2019, arXiv:1908.07836. [Google Scholar]
- Mondal, A.; Lipps, P.; Jawahar, C.V. IIIT-AR-13K: A New Dataset for Graphical Object Detection in Documents. arXiv 2020, arXiv:2008.02569. [Google Scholar]
- Sun, P.; Zhang, R.; Jiang, Y.; Kong, T.; Xu, C.; Zhan, W.; Tomizuka, M.; Li, L.; Yuan, Z.; Wang, C.; et al. Sparse R-CNN: End-to-End Object Detection with Learnable Proposals. arXiv 2020, arXiv:2011.12450. [Google Scholar]
- Bhatt, J.; Hashmi, K.A.; Afzal, M.Z.; Stricker, D. A survey of graphical page object detection with deep neural networks. Appl. Sci. 2021, 11, 5344. [Google Scholar] [CrossRef]
- Hashmi, K.A.; Liwicki, M.; Stricker, D.; Afzal, M.A.; Afzal, M.A.; Afzal, M.Z. Current Status and Performance Analysis of Table Recognition in Document Images with Deep Neural Networks. IEEE Access 2021, 9, 87663–87685. [Google Scholar] [CrossRef]
- Tupaj, S.; Shi, Z.; Chang, C.H.; Alam, H. Extracting Tabular Information from Text Files; EECS Department, Tufts University: Medford, MA, USA, 1996. [Google Scholar]
- Wang, Y.; Haralick, R.M.; Phillips, I.T. Automatic table ground truth generation and a background-analysis-based table structure extraction method. In Proceedings of the Sixth International Conference on Document Analysis and Recognition, Seattle, WA, USA, 13 September 2001; pp. 528–532. [Google Scholar]
- Saha, R.; Mondal, A.; Jawahar, C.V. Graphical Object Detection in Document Images. arXiv 2020, arXiv:2008.10843. [Google Scholar]
- Qiao, S.; Chen, L.C.; Yuille, A. DetectoRS: Detecting Objects with Recursive Feature Pyramid and Switchable Atrous Convolution. In Proceedings of the IEEE/CVF Conference on Computer Vision and Pattern Recognition (CVPR), Nashville, TN, USA, 20–25 June 2021; pp. 10213–10224. [Google Scholar]
- Huang, Y.; Yan, Q.; Li, Y.; Chen, Y.; Wang, X.; Gao, L.; Tang, Z. A YOLO-Based Table Detection Method. In Proceedings of the 2019 International Conference on Document Analysis and Recognition (ICDAR), Sydney, NSW, Australia, 20–25 September 2019; pp. 813–818. [Google Scholar] [CrossRef]
- Ma, C.; Lin, W.; Sun, L.; Huo, Q. Robust Table Detection and Structure Recognition from Heterogeneous Document Images. arXiv 2022, arXiv:2203.09056. [Google Scholar]
- Mnih, V.; Heess, N.; Graves, A.; Kavukcuoglu, K. Recurrent Models of Visual Attention. arXiv 2014, arXiv:1406.6247. [Google Scholar]
- Jaderberg, M.; Simonyan, K.; Zisserman, A.; Kavukcuoglu, K. Spatial Transformer Networks. arXiv 2015, arXiv:1506.02025. [Google Scholar]
- Hu, J.; Shen, L.; Albanie, S.; Sun, G.; Wu, E. Squeeze-and-Excitation Networks. IEEE Trans. Pattern Anal. Mach. Intell. 2020, 42, 2011–2023. [Google Scholar] [CrossRef] [PubMed] [Green Version]
- Wang, X.; Girshick, R.B.; Gupta, A.; He, K. Non-local Neural Networks. arXiv 2017, arXiv:1711.07971. [Google Scholar]
- Wu, Y.; Kirillov, A.; Massa, F.; Lo, W.Y.; Girshick, R. Detectron2. 2019. Available online: https://github.com/facebookresearch/detectron2 (accessed on 29 April 2022).
- Liu, Z.; Lin, Y.; Cao, Y.; Hu, H.; Wei, Y.; Zhang, Z.; Lin, S.; Guo, B. Swin Transformer: Hierarchical Vision Transformer using Shifted Windows. arXiv 2021, arXiv:2103.14030. [Google Scholar]
- Liu, Z.; Mao, H.; Wu, C.Y.; Feichtenhofer, C.; Darrell, T.; Xie, S. A ConvNet for the 2020s. arXiv 2022, arXiv:2201.03545. [Google Scholar]
- Lin, T.; Dollár, P.; Girshick, R.B.; He, K.; Hariharan, B.; Belongie, S.J. Feature Pyramid Networks for Object Detection. arXiv 2016, arXiv:1612.03144. [Google Scholar]
- Courbariaux, M.; Bengio, Y.; David, J. BinaryConnect: Training Deep Neural Networks with binary weights during propagations. arXiv 2015, arXiv:1511.00363. [Google Scholar]
- Dai, J.; Qi, H.; Xiong, Y.; Li, Y.; Zhang, G.; Hu, H.; Wei, Y. Deformable Convolutional Networks. arXiv 2017, arXiv:1703.06211. [Google Scholar]
- Powers, D.M.W. Evaluation: From precision, recall and F-measure to ROC, informedness, markedness and correlation. arXiv 2020, arXiv:2010.16061. [Google Scholar]
- Zhang, E.; Zhang, Y. Average Precision. In Encyclopedia of Database Systems; Springer: Boston, MA, USA, 2009; pp. 192–193. [Google Scholar] [CrossRef]
- Blaschko, M.B.; Lampert, C.H. Learning to Localize Objects with Structured Output Regression. In Computer Vision—ECCV 2008; Forsyth, D., Torr, P., Zisserman, A., Eds.; Springer: Berlin/Heidelberg, Germany, 2008; pp. 2–15. [Google Scholar]
- Deng, J.; Dong, W.; Socher, R.; Li, L.; Li, K.; Fei-Fei, L. ImageNet: A large-scale hierarchical image database. In Proceedings of the 2009 IEEE Computer Society Conference on Computer Vision and Pattern Recognition (CVPR 2009), Miami, FL, USA, 20–25 June 2009; pp. 248–255. [Google Scholar] [CrossRef] [Green Version]


| Dataset | No of Classes | No of Images | |
|---|---|---|---|
| Train | Test | ||
| DocBank | 13 | 400,000 | 50,000 |
| PublayNet | 5 | 335,703 | 11,245 |
| IIIT-AR-13K | 5 | 9333 | 1955 |
| Model | Faster-RCNN (Baseline) | Faster-RCNN +DyHead | Sparse-RCNN +DyHead | |||
|---|---|---|---|---|---|---|
| Backbone | ResNet-50 | ResNet-50 | ConvNeXt (tiny) | Swin (tiny) | ResNet-50 | |
| Average Precision (AP) | paragraph | 74.35 | 80.01 | 87.51 | 40.46 | 84.52 |
| equation | 65.17 | 74.22 | 83.45 | 61.03 | 78.08 | |
| abstract | 83.22 | 86.40 | 92.07 | 90.40 | 91.61 | |
| table | 71.14 | 77.68 | 86.73 | 76.02 | 86.31 | |
| list | 54.88 | 66.82 | 81.31 | 68.71 | 76.97 | |
| section | 65.10 | 71.93 | 80.02 | 63.37 | 75.15 | |
| figure | 62.62 | 64.99 | 71.39 | 60.61 | 71.92 | |
| author | 44.79 | 55.72 | 76.36 | 72.4 | 74.18 | |
| footer | 64.51 | 70.61 | 81.84 | 77.03 | 78.66 | |
| caption | 71.12 | 75.65 | 83.32 | 75.75 | 80.78 | |
| date | 7.14 | 0 | 44.17 | 0 | 36.85 | |
| title | 77.27 | 79.80 | 85.96 | 85.45 | 82.44 | |
| reference | 77.31 | 82.18 | 88.13 | 81.91 | 87.03 | |
| mAP | 62.97 | 68.15 | 80.18 | 65.63 | 77.27 | |
| IoU | AP | Precision | Recall | F1-Score |
|---|---|---|---|---|
| 0.5 | 90.95 | 0.94 | 0.91 | 0.86 |
| 0.6 | 89.99 | 0.93 | 0.90 | 0.85 |
| 0.7 | 87.64 | 0.91 | 0.88 | 0.84 |
| 0.8 | 82.85 | 0.87 | 0.83 | 0.81 |
| 0.9 | 66.79 | 0.72 | 0.67 | 0.72 |
| Model | Faster-RCNN (baseline) | Faster-RCNN +DyHead | Sparse-RCNN +DyHead | |||
|---|---|---|---|---|---|---|
| Bacbone | ResNet-50 | ResNet-50 | ConvNeXt | Swint-tiny | ResNet-50 | |
| Average Precision (AP) | text | 91.3 | 92.72 | 94.29 | 92.23 | 92.71 |
| title | 81.2 | 85.94 | 88.72 | 85.31 | 82.75 | |
| list | 88.5 | 89.04 | 94.34 | 87.81 | 87.84 | |
| table | 94.3 | 96.57 | 97.62 | 96.73 | 95.32 | |
| figure | 94.5 | 94.01 | 96.12 | 94.23 | 92.05 | |
| mAP | 90 | 91.65 | 94.22 | 91.27 | 90.14 | |
| IoU | AP | Precision | Recall | F1-Score |
|---|---|---|---|---|
| 0.5 | 97.17 | 0.98 | 0.97 | 0.95 |
| 0.6 | 96.71 | 0.97 | 0.97 | 0.95 |
| 0.7 | 95.88 | 0.97 | 0.96 | 0.95 |
| 0.8 | 93.49 | 0.94 | 0.93 | 0.93 |
| 0.9 | 84.43 | 0.86 | 0.84 | 0.86 |
| Model | Faster-RCNN (baseline) | Faster-RCNN +DyHead | Sparse-RCNN +DyHead | |||
|---|---|---|---|---|---|---|
| Backbone | ResNet-50 | ResNet-50 | ConvNeXt (tiny) | Swin (tiny) | ResNet-50 | |
| Average Precision (AP) | table | 71.10 | 82.58 | 88.60 | 87.58 | 85.04 |
| logo | 2.55 | 3.67 | 52.70 | 42.01 | 21.48 | |
| figure | 37.45 | 39.96 | 64.01 | 64.69 | 51.10 | |
| signature | 17.73 | 43.38 | 66.17 | 66.75 | 53.56 | |
| natural_image | 37.67 | 52.81 | 77.21 | 82.16 | 81.22 | |
| mAP | 33.30 | 44.48 | 69.74 | 68.64 | 58.48 | |
| IoU | AP | Precision | Recall | F1-Score |
|---|---|---|---|---|
| 0.50 | 91.44 | 0.93 | 0.91 | 0.89 |
| 0.6 | 89.09 | 0.91 | 0.89 | 0.87 |
| 0.7 | 84.21 | 0.86 | 0.84 | 0.84 |
| 0.8 | 70.65 | 0.74 | 0.71 | 0.75 |
| 0.9 | 36.22 | 0.41 | 0.36 | 0.47 |
| Train Dataset | Test Dataset | Metrics [0.5:0.95] | |||
|---|---|---|---|---|---|
| Precision | Recall | F1-Score | mAP | ||
| 1. DocBank | PublayNet | 0.81 | 0.77 | 0.77 | 76.62 |
| IIIT-AR-13K | 0.46 | 0.37 | 0.44 | 36.72 | |
| 2. PublayNet | DocBank | 0.56 | 0.50 | 0.57 | 50.45 |
| IIIT-AR-13K | 0.42 | 0.36 | 0.41 | 36.25 | |
| 3. IIIT-AR-13K | DocBank | 0.53 | 0.47 | 0.57 | 46.74 |
| PublayNet | 0.65 | 0.60 | 0.66 | 59.53 | |
| Model | Backbone | Runtime (FPS) | No. of Parameters (in Millions) | GPU | Batch Size |
|---|---|---|---|---|---|
| Faster-RCNN (Baseline) | ResNet-50 | 9.25 | 41.3 | RTX3090 | 1 |
| Faster-RCNN + DyHead | ResNet-50 | 4.84 | 53.2 | RTX3090 | 1 |
| Faster-RCNN + DyHead | Swin (tiny) | 4.24 | 59.3 | RTX3090 | 1 |
| Faster-RCNN + DyHead | ConvNeXt (tiny) | 4.41 | 56.6 | RTX3090 | 1 |
| Sparse-RCNN + DyHead | ResNet-50 | 6.41 | 111.93 | RTX3090 | 1 |
Publisher’s Note: MDPI stays neutral with regard to jurisdictional claims in published maps and institutional affiliations. |
© 2022 by the authors. Licensee MDPI, Basel, Switzerland. This article is an open access article distributed under the terms and conditions of the Creative Commons Attribution (CC BY) license (https://creativecommons.org/licenses/by/4.0/).
Share and Cite
Naik, S.; Hashmi, K.A.; Pagani, A.; Liwicki, M.; Stricker, D.; Afzal, M.Z. Investigating Attention Mechanism for Page Object Detection in Document Images. Appl. Sci. 2022, 12, 7486. https://doi.org/10.3390/app12157486
Naik S, Hashmi KA, Pagani A, Liwicki M, Stricker D, Afzal MZ. Investigating Attention Mechanism for Page Object Detection in Document Images. Applied Sciences. 2022; 12(15):7486. https://doi.org/10.3390/app12157486
Chicago/Turabian StyleNaik, Shivam, Khurram Azeem Hashmi, Alain Pagani, Marcus Liwicki, Didier Stricker, and Muhammad Zeshan Afzal. 2022. "Investigating Attention Mechanism for Page Object Detection in Document Images" Applied Sciences 12, no. 15: 7486. https://doi.org/10.3390/app12157486
APA StyleNaik, S., Hashmi, K. A., Pagani, A., Liwicki, M., Stricker, D., & Afzal, M. Z. (2022). Investigating Attention Mechanism for Page Object Detection in Document Images. Applied Sciences, 12(15), 7486. https://doi.org/10.3390/app12157486