Abstract
The corrosion of steel reinforcement negatively influences the mechanical performance of reinforced concrete (RC) elements reducing both their strength capacity and ductility. Especially in seismic prone areas, the degradation of the cyclic behavior of corroded RC elements is more intense, limiting the service life of structures and leading to premature failures. In the present paper, in order to study the degraded behavior of the embedded (in concrete) steel reinforcement under cyclic loading, laboratory corrosion experiments were performed on embedded steel reinforcing bars. Thereafter, mechanical tests under dynamic loadings with gradually increased deformations were carried out. From the experimental study, hysteretic models of the non-linear behavior of steel bars were extracted in non-corroded and corroded conditions, in the case of both uniform and pitting corrosion. Based on the hysteretic models of steel bars, an analysis of the cyclic response of (non-corroded and corroded) RC columns was performed using the OpenSees code. The outcomes of the present study indicated the negative consequences of corrosion on the hysteretic behavior of steel reinforcing bars, demonstrating mainly the local reduction in their cross-section (pitting corrosion) combined with the loading history and buckling phenomena as the main factors which deviate the mechanical behavior of steel bars from the classic bilinear model of monotonic loading.
1. Introduction
As is widely known, corrosion poses a real threat for reinforced concrete structures especially when they are located in coastal areas. Reinforced concrete (RC) structures designed and built before the entry of seismic codes represent a source of seismic risk due to their vulnerability. International guidelines and standards in force for the seismic design of reinforced structures demand nonlinear static push-over or dynamic analysis, especially in earthquake prone areas. The use of finite element models (FEM) is a functional tool for the engineering community to analyze and assess RC structures by means of columns and beams. One of the most popular models is a force-based nonlinear fiber beam –column element [1,2], where each integration point is further discretized in fibers. These fibers are defined by their area along with the uniaxial constitutive laws of their materials, concrete and steel. However, their considerable limitation is their inadequacy to simulate the response of members under the corrosion damage.
Besides the continuous exposure of coastal RC structures in a corrosive environment, in cases where structures are located in seismic prone areas, structures are additionally subjected to dynamic loads due to intense seismic events. Another shortcoming of the FE models is that they do not consider the loading history of steel reinforcement and the number of inelastic cycles, since they can limit the service life of the structure. Thus, the need to propose a reliable numerical model to predict the dynamic response of existing RC structures subjected to corrosion is a matter of urgency.
Yet, most of the abovementioned models neglect the coupling effect of corrosion and fatigue degradation. In fact, the majority of existing building stock of RC structures in marine environments is threatened by aggressive environmental factors, as the corrosion of steel reinforcement can have detrimental effects on the structural integrity of RC structures, leading to premature unexpected failure. Corrosion agents drastically reduce the effective cross-sectional area of the reinforcing bar, alter its mechanical response and affect the bond between steel and concrete. Moreover, the corrosion damage of reinforcing bars was only restricted by the consideration of an average reduced area or a reduced yield strength criterion and not of reduced fatigue life or ductility loss. Hence, the abovementioned implications should be included in the FE models to obtain a reliable predictive model of the RC element behavior.
The degradation of the hysteretic behavior of steel due to fatigue (via pinching factor modelling) has been investigated by numerous former studies, including the modelling of hysteretic loops of S400 grade steel [3]. Nevertheless, for the complete definition of the hysteretic response of the current two-phase B500c grade steel, the study of reinforcing bars of different diameters at various imposed strain amplitudes or in progressively increasing blocks and at different slenderness ratio values is required to insert the influence of buckling phenomena on the mechanical behavior. Furthermore, to establish the mechanical behavior of corroded steel bars, a large number of experimental tests are required, considering different levels of material damage and different geometries of the pits.
To date, several researchers have attempted to study the cyclic behavior of corroded steel reinforcement and to improve finite element models and validate them via comparison with experimental results [4,5,6,7,8]. As is well known, the buckling of steel reinforcement in RC columns is the most common type of failure mechanism observed. During the last two decades, several studies have been conducted towards the development of buckling models for steel reinforcement and the simulation of buckling of steel reinforcing bars embedded in concrete [9,10,11,12,13,14]. Moreover, few experimental studies have been conducted to assess the flexural behavior of corroded reinforced concrete beams [15,16,17]. Yet, there is still no accurate model that has been extensively validated against experimental data. Based on the abovementioned remarks, the objective of the study was to investigate the structural behavior under cyclic loading of RC columns subjected both to uniform and pitting corrosion.
The presented remarks highlight the intense effect of pitting corrosion on the structural performance and failure mode of steel reinforcement and the significance of conducting cyclic loadings to structures subjected to deterioration.
2. Experimental Procedure
In the current experimental study, the mechanical response of corroded embedded steel reinforcing bars under dynamic loadings was studied to simulate the seismic behavior of steel reinforcement in existing corroded RC structures. For this reason, the experimental procedure was divided in two phases. Primarily, 34 reinforced concrete specimens were cast and subsequently corrosion tests via imposed current density were carried out. Upon completion of the corrosion process, the corrosion damage of all specimens was estimated and thereafter mechanical tests on non-corroded and corroded steel bars were performed under dynamic loadings imposing gradually increased deformations to study their non-linear hysteretic behavior.
2.1. Specimens and Materials
In the current study, 34 prismatic reinforced concrete specimens, each with dimensions of 80 × 80 × 320 (mm) were cast with concrete class C20/25 and a centrally positioned ribbed reinforcing bar of nominal diameter (d0) equal to 16 mm. The total length of the reinforcing bars was equal to 340 mm, while the technical class of steel was B500c, the chemical composition of which is summarized in Table 1. Moreover, two adjacent surfaces of each prismatic specimen were protected with a special anticorrosive coating (epoxy resin), so as to simulate the reinforcing bars positioned in the corners of RC elements in existing structures. The materials were appropriately selected to represent a typical structure of the period 1990–2010 located in coastal and earthquake prone areas of the Mediterranean basin (Greece, Turkey, Italy, Egypt), designed and built by neglecting the more recent guidelines of EN 206 on the use of concrete class of C25/30 or C30/37.

Table 1.
Chemical composition of B500c steel reinforcing bars.
Preceding the concrete mixing into the molds, the initial mass of all reinforcing steel bars was recorded. Afterwards, all reinforcing steel bars were positioned into the molds to cast the concrete, which was compacted via a table vibrator (Figure 1). For the concrete mixture, a Portland cement was used, with a water–cement ratio equal to 0.55 and a 20 mm maximum size coarse aggregate. The total amount of RC specimens was kept for three days in a wet environment at 22 °C. Upon the completion of wetting, the molds were carefully removed, and the specimens were cured for 28 days, once again in a wet environment under the same temperature of 22 °C (Figure 2). The mean value of 28-day recorded compressive strength was measured on concrete cube specimens of 200 mm3 with an average value of fc equal to 30 MPa.
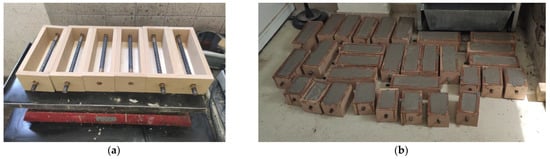
Figure 1.
(a) Molds on the table vibrator prior to concreting the RC specimens (b) RC specimens after the concreting procedure.
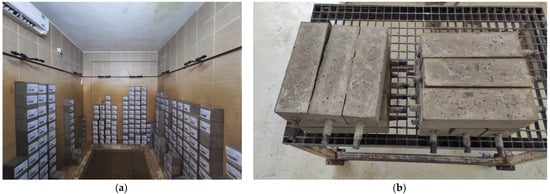
Figure 2.
(a) Curing room for concrete specimens. (b) Embedded steel reinforcing bars after the curing of concrete.
2.2. Accelerated Corrosion Method
It is common knowledge that natural corrosion is a relatively slow process, with a required period for the onset of corrosion, even for marine environments. The accelerated technique adopted in the present study was the impressed current density method, where a power supply is used to induce corrosion by applying a direct electric current. In this provision, the embedded reinforcing steel bar acts as the anode, a stainless-steel bar acts as the cathode and the 5% sodium chloride solution (NaCl) by the weight of water in which all specimens were immersed acts as the electrolyte (Figure 3).
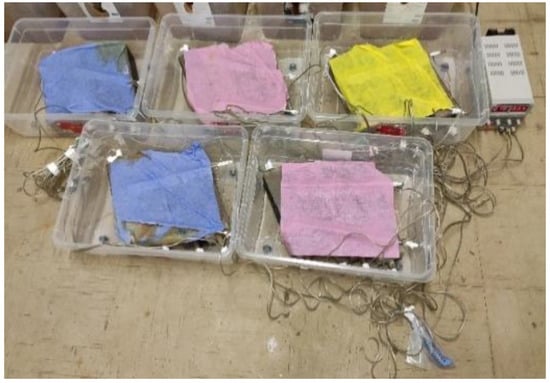
Figure 3.
Depiction of the corrosion set up.
The selected content of the NaCl solution better simulated the case in the regions of Mediterranean basin, where the hot climate results in a higher salinity of the seawater, in contrast to northern countries. Moreover, in the Mediterranean basin, the salinity of the sea increases during the summer periods due to the high temperatures recorded [18,19].
In light of the real severity of coastal conditions, during the corrosion periods of the specimens, ponding cycles of wetting and drying conditions were applied because splash and tidal environments are the most aggressive among the three cases, given the high chloride concentrations [19,20]. Specifically, in light of the current climatic conditions in the Mediterranean basin, a cyclic exposure was adopted, with 9 h wet in the electrolyte mode and 15 h in the dry mode.
With a view to achieving different levels of corrosion damage on reinforcing steel bars, all specimens remained in the tanks for different exposure times, inducing a current density equal to 1.0 mA/cm2 corresponding to a current equal to 0.105 A, based on Faraday’s law. Taking into account the disparity between the theoretical predicted value of mass loss provided by Faraday’s law and the actual recorded mass loss, as already highlighted by several studies [21,22], all specimens remained in the corrosion cells up to a desired theoretical value of mass loss of 15%.
Finally, it is worth mentioning that a certain length equal to 210 mm in the middle of the steel bars was allowed to corrode during the corrosion experiments and the remaining length was protected and carefully covered with wax, so as not to allow failure near the grips during the mechanical tests. For the evaluation of corrosion damage, only the exposed surface was examined.
2.3. Mechanical Tests
Upon completion of the corrosion tests, all specimens were submitted to low cycle fatigue tests (LCF) with the use of a servohydraulic MTS 250 kN machine. More specifically, cyclic fatigue tests were conducted under displacement control on non-corroded and all cases of corroded reinforcing bars. The protocol for the execution of the mechanical tests was elaborated; a cyclic horizontal displacement history, gradually increasing, with three complete cycles for each drift was imposed, similar to the strain histories followed by Kashani et al. [23] and Rodriguez et al. [24]. The sequence of the gradually increased strain amplitudes was ±0.02%, ±0.04%, ±0.06%, ±0.08%, ±0.1%, ±0.12%, ±0.14%, ±0.16%, ±0.18%, ±0.2%, ±0.4%, ±0.6%, ±0.8%, ±1.0%, ±1.5%, ±2.0%, ±2.5%, ±3.5% and ±5.0%, as depicted in Figure 4.
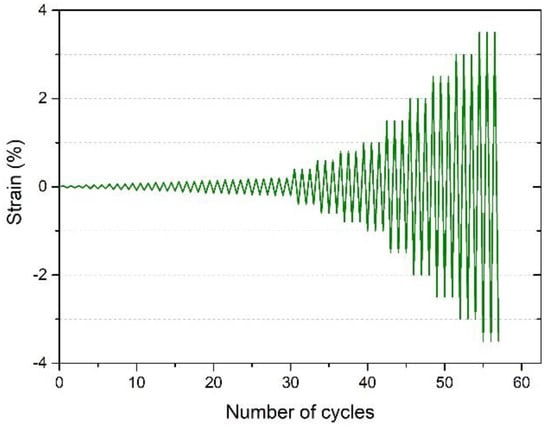
Figure 4.
Cyclic horizontal displacement history.
The testing frequency was fixed equal to 2.0 Hz, which corresponds to medium and large-scale seismic events. The free length in the fatigue tests for the steel bars was set to be equal to 240 mm, as depicted in Figure 5, in order to simulate the stirrups spacing in old structures of previous decades. As is known, it was previously common practice in construction to place wide stirrups in RC elements, at about four pieces per unit of meter. All tests were run up to failure and the total number of complete cycles was recorded.
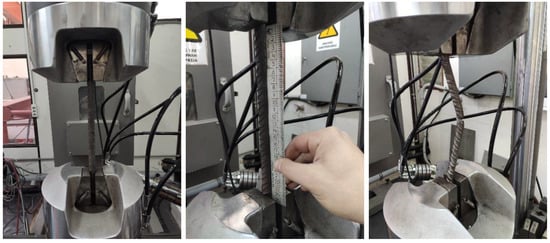
Figure 5.
Test set-up of the experimental procedure.
2.4. Corrosion Damage Estimation
Upon completion of the mechanical tests, all reinforcing bars were revealed and carefully removed out of the concrete specimens to assess their corrosion damage level, expressed by means of their percentage mass loss.
2.4.1. Mass Loss (Gravimetric Measurements)
After the removal, all specimens were cleaned with a bristle brush following the ASTM G1-72 standard [25] to remove corrosion oxides and debris. Afterwards, the corrosion damage of the steel bars, reduced to their corroded length, was estimated in terms of mass loss according to the following equation:
where η accounts for the percentage mass loss and Mref and Mcor stand for the mass of the non-corroded (reference) and the corroded specimen, respectively.
2.4.2. Mean Reduced Cross Section
In existing structures, the assessment of steel reinforcement’s corrosion damage is a complex procedure, since the reinforcing steel bars are embedded into concrete and are not visible and easily accessible. Moreover, the corrosion damage owed to the chloride ions’ presence is described by intense non-uniformity, which is depicted with large pits on the surface of reinforcing steel bars and local cross-sectional reduction.
For this purpose, the recorded values of percentage mass loss of steel bars were expressed in terms of corrosion penetration (depth), using Equation (2) [26,27]:
where x is the corrosion penetration depth (in mm), η is the corrosion level in terms of percentage mass loss and do is the nominal diameter of the steel bar (in mm).
Based on international technical standards, such as fib Model Code [27], the term of corrosion penetration follows the assumption of an average corrosion penetration depth (x) around the circumference of a steel bar, which leads to a mean reduced diameter dred corresponding to a uniform (mean) residual cross-section, as shown in Figure 6 with the blue color.
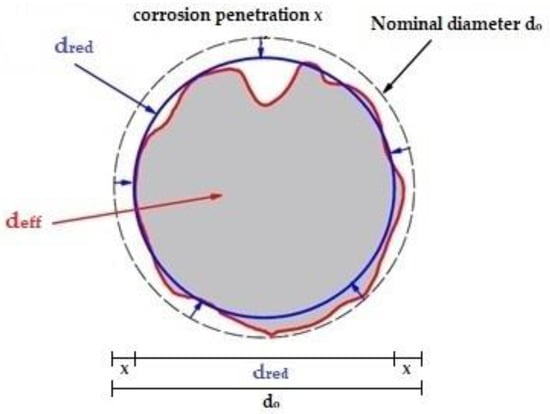
Figure 6.
Corrosion penetration depth (x) and mean reduced cross-section considering uniform corrosion around the steel bar’s circumference.
3. Experimental Results and Discussion
3.1. Corrosion Damage of Steel Reinforcing Bars
The results of the accelerated corrosion procedure are summarized in Table 2. In order to quantify the corrosion damage of steel bars in a uniform way, the mass loss and the mean reduced diameter, dred, of each steel bar were calculated by Equations (1) and (2). However, several embedded (in concrete) steel bars demonstrated uneven corrosion damage along their length and circumference, since the aggressive corrosive factors were diffused and acted mainly in areas of concrete with a high porosity or in areas of the concrete cover with defects or cracks. Due to this fact, large pits and the localized loss of their initial cross-section were observed locally on the embedded corroded steel bars. In order to estimate the actual local damage, the effective diameter deff of corroded steel bars was measured using a digital Vernier in the critically reduced cross sections. Representative figures of the localized corrosion damage are given in Figure 7 and uniform corrosion is depicted in Figure 8.
Table 2.
Results of the accelerated corrosion tests on the embedded steel reinforcing bars.
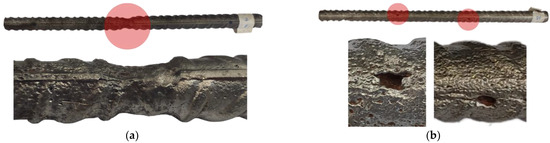
Figure 7.
Areas (red dots) of pitting corrosion of steel reinforcing bars: (a) localized reduction in the cross-section; (b) pits on the surface of the corroded steel bar.
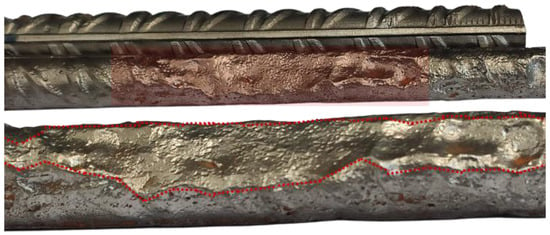
Figure 8.
Area of uniform corrosion (in red range) in certain parts of the length of the steel reinforcing bar.
As can been observed from Table 2, for low levels of corrosion damage up to 6% mass loss, the type of steel corrosion was characterized as uniform with a corresponding percentage reduction in the nominal diameter of steel bars up to 3.0% (from d0 = 16 mm to dred = 15.52 mm) and of the cross-section up to 5.9%. In that case, as has been indicated in previous studies [28,29], corrosion leads to a slight reduction in the mechanical properties of steel bars, but also leads to significant degradation on the local conditions of steel–concrete bond mechanism. For higher levels of corrosion, corresponding to a mass loss in steel bars greater than 6%, the type of corrosion changes to pitting corrosion due to the appearance of local large pits on the surface of the steel bars. On that occasion, the assessment of the corroded steel reinforcement, expressed in the terms of either mass loss or corrosion penetration depth, needs special attention, since intense pits lead to a significant deviation of the effective reduced diameter (deff) in reference to the mean reduced diameter (dred) calculated on the basis of uniform corrosion penetration (x).
In the following graph in Figure 9, the values of the mean reduced diameter (dred) and the actually effective diameter (deff) are depicted to emphasize the differences between uniform and pitting corrosion of steel reinforcement. More specifically, as observed in Figure 9, for a theoretical corrosion level of 6.5–7% of mass loss, the actual effective diameter may deviate from the mean uniform diameter by 9.3% to 31.3%, while for higher levels of damage, at about 11.0–11.5% mass loss, may differ from 8.6% up to 46.9%. Focusing on the reduction in the cross-section, a term which is taken into account in the design of RC elements, these deviations between dred and deff demonstrate at a greater level the huge negative impact of pitting corrosion on steel reinforcement. The percentage decrease in the actual residual cross-section (calculated by deff) in reference to the reduced cross-section (calculated by dred)was calculated by Equation (3). In detail, for a mass loss of about 6.5–7% the effective cross-section of corroded steel bar dropped by 17.7% up to 54.1% in reference to the mean reduced cross-section, while for mass loss of about 11–11.5% the reduction was recorded from 16.5% up to 71.8%. The obtained results agree with the results of previous studies on pit geometry measurements, where the statistically significant deviation between the mean (uniform) pit depth and the maximum (effective) pit depth is referred to [30,31,32,33,34].
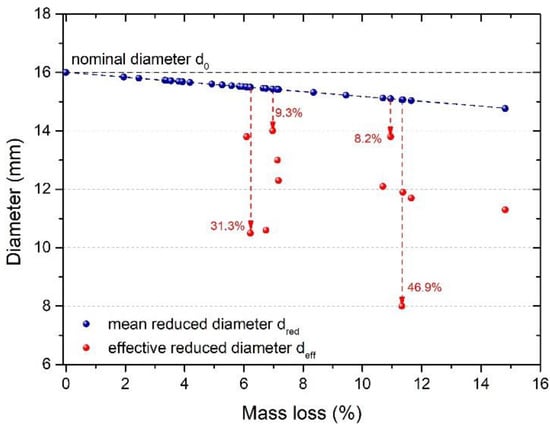
Figure 9.
Reduction in the diameter in terms of the mean reduced diameter (dred) and the effective reduced diameter (deff) in contrast to the nominal diameter (d0) in the function with mass loss of steel bars.
Following the above observations, the effective residual diameter due to pitting corrosion has great significance especially in the case of dual phase steel reinforcement. As is well known, the outer ring of the martensitic phase in the circumference of dual phase steel reinforcing bars, such as class of Tempcore B500c, is responsible for the strength capacity. Thus, the reduction in or the absolute loss of the martensitic layer due to pitting corrosion has a negative impact on the mechanical response of this type of steel bar. Several studies have demonstrated the reduction in the mechanical response due to either uniform corrosion or pitting corrosion and have introduced the term pitting factor in order to express the severity of localized material damage in the latter case [35,36,37]. In this framework, Imperatore et al. [38] collected several experimental data [30,39,40,41,42,43] of corroded steel reinforcing bars and proposed degradation laws of mechanical properties for uniform and pitting corrosion.
3.2. Stress–Strain Behavior of Steel Reinforcing Bars under Dynamic Loading
As described in Section 2.3, mechanical tests on the non-corroded and corroded steel bars were performed under dynamic loading imposing a gradually increased strain history (Figure 4). The main results of the mechanical tests under dynamic loading for each steel bar, in terms of total cycles to failure (Nf), strain at failure cycle (eu), maximum stress at failure cycle (σmax,u) and maximum recorded tensile and compressive stress, (σmax) and (σmin) respectively, are summarized in Table 3.
Table 3.
Results of the mechanical tests on steel reinforcing bars under dynamic loading with a gradually increasing strain history.
Focusing on the results of non-corroded steel bars, it was observed that there was a reduced bearing capacity in the maximum compressive load of about 25% in respect with the maximum tensile load, from 557 MPa to 447 MPa (average values), since buckling phenomena appeared due to the high L/d0 ratio (free length in fatigue 240 mm to nominal diameter L/d0 = 15).
The dynamic response of steel reinforcing bars was degraded due to corrosion and the reduction degree of the bearing capacity was significantly dependent on the type of corrosion (uniform or pitting corrosion). In the case of low levels of corrosion damage up to 6% mass loss, there was no decrease in the number of cycles up to failure. However, a slight reduction in the strength capacity both for tensile and compressive loads was recorded in contrast to the non-corroded (reference) conditions; in detail, the percentage loss of maximum tensile stress dropped by 8.9% and the maximum compressive stress reduced by 7.1%, respectively.
In the case of higher corrosion damage, characterized as pitting corrosion, a reduction in the number of cycles up to failure was observed, a fact that depends mainly on the maximum depth of pits and the effective diameter deff, which leads to a crucial residual cross-section [30,31,32,33,34,35]. Similarly, significant degradation was denoted in terms of strength capacity, both in tensile and compressive branch. Particularly, the reduction in the tensile branch ranged from 10.7% up to 34%, whereas the reduction in the compressive branch ranged from 7.2% up to 29.9%. The degradation of mechanical properties was strongly related to the depth of the pits, since the effective diameter and the actually residual cross-section of corroded steel bar was significantly decreased, as already mentioned in the previous section. Moreover, the change in the reinforcing bar’s surface around the pitting area caused an increase in the stress concentration, a fact that may be fatal for the load capacity of the material. Useful information concerning the dynamic response of corroded steel reinforcing bars could be extracted by an overall examination of the stress–strain curves. For this reason, representative stress–strain graphs of mechanical tests are cited in Figure 10.
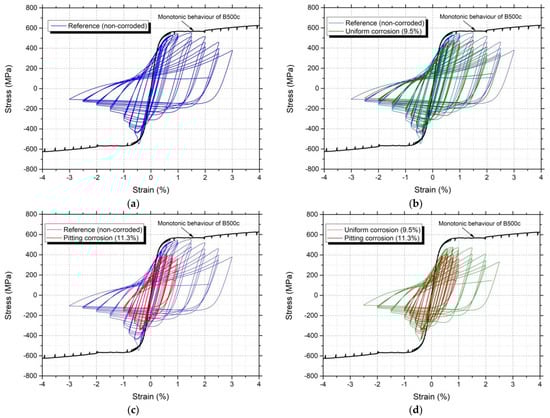
Figure 10.
Stress–strain curves for all cases of dynamic loading compared to the curve obtained from the monotonic loading: (a) dynamic loading of a non-corroded specimen toward monotonic behavior; (b) dynamic loading of a corroded specimen in the case of uniform corrosion toward monotonic behavior, (c) dynamic loading of a corroded specimen in the case of pitting corrosion toward monotonic behavior and (d) dynamic loading in the case of uniform corrosion in comparison with pitting corrosion.
Initially, when examining the stress–strain curves of the above-mentioned diagrams, it was observed that the non-linear hysteretic behavior of steel reinforcing bars differed from the mechanical response under monotonic (pseudo-static) loading. It was also obvious that for a constant strain amplitude of the strain history, the load-carrying capacity progressively decreased in each loading cycle, due to the high dynamic loadings that developed, which introduced fatigue effects in the material.
Regarding the mechanical behavior during the compressive loading of steel bars, taking into account the accumulation of material damage due to fatigue as well as buckling phenomena, a huge drop in the compressive load carrying capacity was encountered with the progression of the loading cycles of steel either for the uncorroded bars or for the corroded ones, taking into account uniform corrosion or localized pitting corrosion. For all the cases in Figure 10 under investigation, the strength (compressive) capacity was recorded approximately equal to 400 MPa during the initial loading by imposing small deformation values (in the elastic zone of the material), while thereafter progressively increasing the imposed deformations decreased the maximum recorded compressive strength rapidly to a value of approximately 100 MPa towards the latter loading cycles.
In the case of pitting corrosion, the aforementioned remarks displayed a higher rate of degradation of the steel bars and a decrease in their load-bearing capacity under dynamic loading. In addition, pitting corrosion created an irregular cross-sectional shape for the corroded bars. This created varying strong and weak bending axes along the bar which directly affected the buckling behavior of the corroded bars. As a result, corrosion significantly reduced the buckling capacity of corroded bars and may result in the change of the failure mechanism to fatigue failure of the steel. In particular, in all tests the failure area of the steel bars was expected to occur at the mid-free length, as the inelastic buckling of the steel dominates the induced material damage at this point. Notwithstanding, in pitting corrosion specimens, changes in the failure mechanism of the corroded steels were recorded, as the large geometric irregularity in the pitting areas, the significant reduction in the residual active area favored in these areas the accelerated propagation of the fatigue crack leading to the failure (Figure 11).
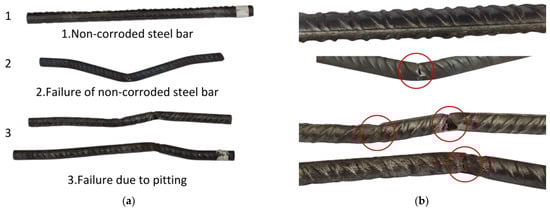
Figure 11.
Differences of the failure mechanism due to pitting corrosion: (a) overall view of steel reinforcing bars; (b) focus on the failure area of corroded steel bars in contrast to the non-corroded bar (as shown in red cycles).
4. Modeling the Stress–Strain (σ-ε) Behavior of Steel Bars under Dynamic Loading
Taking into consideration the extracted stress–strain diagrams and the findings of the previous section, the non-linear hysteretic behavior of the reinforcing steel was simulated. In detail, from the analysis of all extracted stress–strain curves under dynamic loading, the hysteretic models of the steel were obtained for the following cases:
- (i)
- non-corroded (reference);
- (ii)
- uniform corrosion;
- (iii)
- pitting corrosion.
As previously stated, the localized corrosion of steel by means of pitting is characterized by a particular non-uniformity in the sense of the length and perimeter of the material, resulting in the fluctuating of the residual active area for each specimen. As a result, the modelling of the corroded steel in the case of pitting corrosion took into consideration the most unfavorable cases from the tested specimens.
The modelling of the non-linear behavior of the steel adopted the hysteretic model of steel as defined in the OpenSees analysis code [44] and the proposed tension and compression envelope curves of corroded rebars is shown in Figure 12. For this purpose, the points P1+, P2+, P3+, P1−, P2−, P3− were defined to establish the hysteretic model for each case (Table 4). The abovementioned points were determined by the envelope curves of the experimental tests. As presented in the previous section of the experimental results, the compressive load bearing capacity of steel bars was significantly affected due to the buckling phenomena related to the wide stirrups spacing (Φ8/240 mm). More precisely, in non-corroded conditions the maximum recorded compressive stress was approximately equal to 400 MPa, while rapid degradation was observed as the imposed deformations increased. In corroded conditions, the reduction in the cross-section led to strong and weak bending axes along the steel bar resulting in degrading buckling resistance of corroded bars, which is reflected by the points P1−, P2− and P3−.
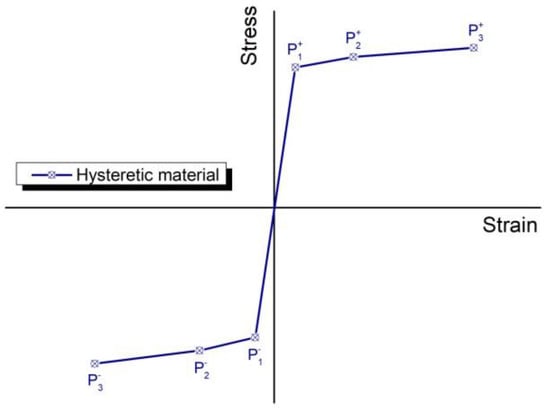
Figure 12.
Proposed characteristic points of hysteretic curves in tension and compression.
The uniaxial Hysteretic material model in the OpenSees is a generic hysteric model that can be used to model the stress–strain behavior of a material or force–displacement behavior of a structural component. The backbone curves in tension and compression can be defined by three points.
Figure 13, Figure 14 and Figure 15 represent the envelope of the hysteretic models for each case of the tested conditions, namely (i) non-corroded (reference) conditions, (ii) uniform corrosion for 9.5% mass loss corresponding to a residual cross-section equal to 181.9 mm2 and (iii) pitting corrosion, for a theoretical mass loss of 11.7% and mean reduced cross-section equal to 177.7 mm2. The remarkable point in the case of pitting corrosion is that the actual residual cross-section of the steel bar was equal to 107.5 mm2, i.e., reduced by 39.5% compared to the mean reduced cross-section.
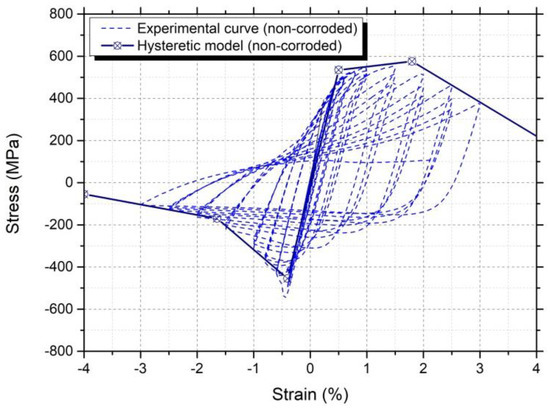
Figure 13.
Hysteretic curve for non-corroded steel reinforcement.
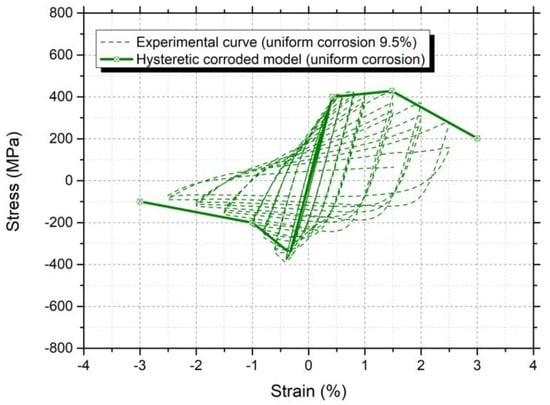
Figure 14.
Hysteretic curve for corroded steel reinforcement in the case of uniform corrosion.
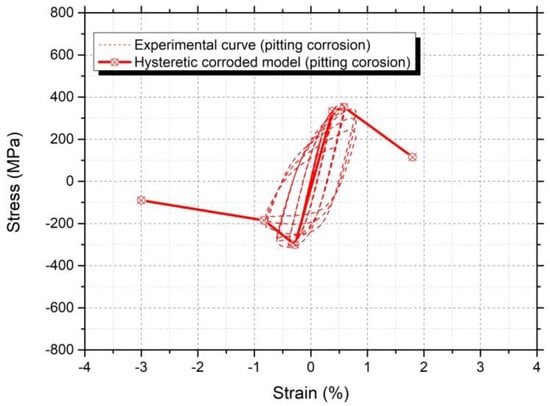
Figure 15.
Hysteretic curve for corroded steel reinforcement in the case of pitting corrosion.
5. Analysis of the Seismic Response of Corroded RC Columns
In the present section, the seismic response of a reinforced concrete column was simulated through analysis within the OpenSees code [44], taking into account the extracted hysteretic models of steel reinforcing bars presented in the previous section. For the analysis, data from a previous experimental work of the authors were acquired [19], in which the seismic response of a reinforced concrete column was simulated under both non-corroded (reference) and corroded conditions.
5.1. Test Set-Up and Results of the Cyclic Behaviour of RC Columns
Based on the previous experimental work of the authors [19], the behavior of two reinforced concrete columns under dynamic loading was investigated as a simulation of seismic events, in corroded and non-corroded conditions.
The columns of a square section 300 × 300 mm2 had a height of 1600 mm, while the base had a rectangular section of 1200 × 800 mm2 with a height of 600 mm. The materials that were used were C20/25 concrete class and B500c grade of steel reinforcement. The longitudinal reinforcement of each column consisted of four corner bars of nominal diameter 16 mm (4Ø16), while the transverse reinforcement consisted of stirrups of a nominal diameter of 8 mm at 250 mm intervals (Σ Ø8/250). The thickness of the concrete cover was equal to 25 mm (Figure 16).
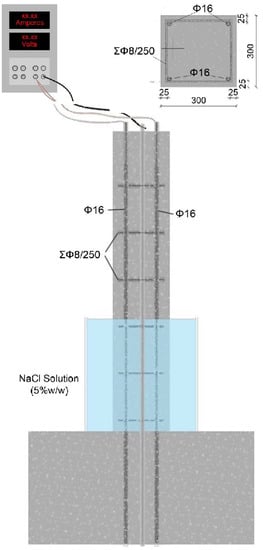
Figure 16.
Schematic illustration of the geometry of the column.
In order to evaluate the mechanical behavior of a typical column, before and after corrosion, a laboratory-accelerated corrosion experiment was conducted on one of the columns, at a height of 600 mm from the base, in the presence of a 5% NaCl solution.
After the accelerated corrosion tests, mechanical tests were carried out applying repeated loads that gradually increased, with imposed displacements of the top of each column (drifts) according to the following sequence: 0.2%, 0.8%, 1.0%, 1.25%, 1.50%, 2.0%, 2.5% and 3.5% to 5%, each with three repetitions with a simultaneous imposition of a constant axial load equal to 350 kN.
The following force–displacement curves (Figure 17 and Figure 18) were obtained from the cyclic loading of the columns, which reflect their mechanical behavior under seismic loads [19]. It is noteworthy that the failure of the tested columns (non-corroded and corroded) was due to the concrete crushing at the column base. Inelastic buckling of steel reinforcing bars was also observed [19].
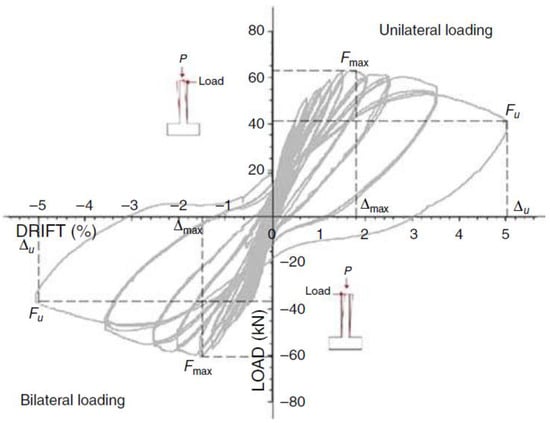
Figure 17.
Non-linear response of the non-corroded column [19].
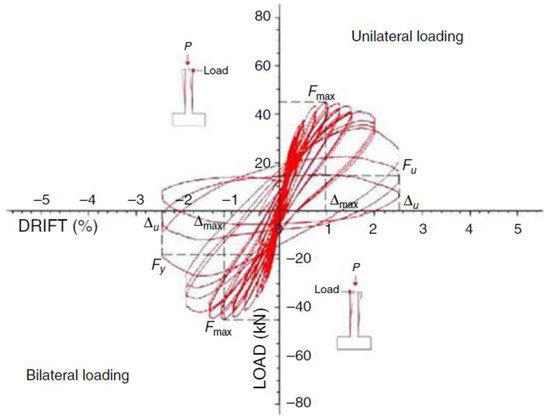
Figure 18.
Non-linear response of the corroded column [19].
From the force–displacement curve of the non-corroded column (Figure 17), it was obvious that the loading history had a significant effect on bearing capacity of the RC element. More specifically, the maximum tensile load was recorded equal to 63 kN, corresponding to a drift equal to 1.75%, while the tensile load during the last loading cycle dropped to 42 kN at a drift equal to 5%. Similarly, in the compressive branch the maximum load was recorded equal to 60 kN corresponding to a drift equal to 1.5%, while at the failure cycle (drift equal to 5%), the bearing capacity was degraded to 38 kN.
In the case of the corroded column (Figure 18), a huge reduction in the bearing capacity and ductility was observed. The maximum tensile load decreased in contrast to non-corroded conditions, from 63 kN to 44 kN and the maximum compressive load from 60 kN to 45 kN, respectively. The maximum recorded loads were degraded due to corrosion by 30% and 25% in the tensile and compressive branch, respectively. Moreover, the failure of the corroded column occurred at a drift equal to 2.5%, i.e., a 50% reduction relative to the non-corroded column.
Due to the loading history and significant inelastic buckling of corroded steel reinforcing bars, there was also an enormous drop in the strength capacity of the corroded column during the cyclic loading. In detail, the maximum tensile load at the failure cycle degraded by 66% and the corresponding compressive load by 60%, respectively. The overall degraded mechanical response of the corroded RC column in terms of both strength capacity and ductility indicates the negative impact of corrosion.
5.2. Validation of the Hysteretic Seismic Response of RC Columns via OpenSees
The behavior of the column was modelled with a force-based nonlinear fiber beam –column element, which employed six integration points and each integration point was further discretized in fibers. The fiber section was further segmented into concrete fibers (confined core concrete and unconfined cover concrete) and steel fibers with a uniaxial stress–strain relationship. For the purposes of the present study, the material Concrete02 Material - Linear Tension Softening was chosen from the OpenSees library. This material generates concrete with a low tensile strength and was chosen in order to assess the deterioration of the concrete at the base of the column where tension and compression act in sequential order and cause the concrete cover to detach.
For the steel reinforcement, the hysteretic steel material as extracted in the previous section was employed in order to exhibit the corrosive factor under dynamic loading. The selection of the trilinear model over the simple bilinear and Menegotto–Pinto model was performed as both the bilinear and the Menegotto–Pinto models are perfectly symmetric in the tensile and compression branches without taking into account buckling effects, while at the same time they do not take into account the loading history of the steel and the damage it has undergone. Furthermore, the bond slip of the longitudinal reinforcement at the column–foundation interface was neglected since the steel reinforcement was fully anchored to the concrete.
Considering the hysteretic model of non-corroded steel reinforcement as described in the previous section, the non-corroded column simulated rather accurately the seismic response in the anion branch, as reflected in Figure 19. In the first drifts up to 3.5%, the model followed closely the degradation of bearing capacity per cycle due to cyclic loading. In the cation branch its response was very near to that of the experimental one, with the only relatively large divergence exhibited at the displacement corresponding to the maximum force, since the model overestimated it by 8%. Moreover, the total number of cycles to failure acquired form the model fully coincided with the corresponding experimental number. To conclude, the non-corroded model sufficiently simulated the cyclic behavior of the RC column, both in terms of force and displacement.
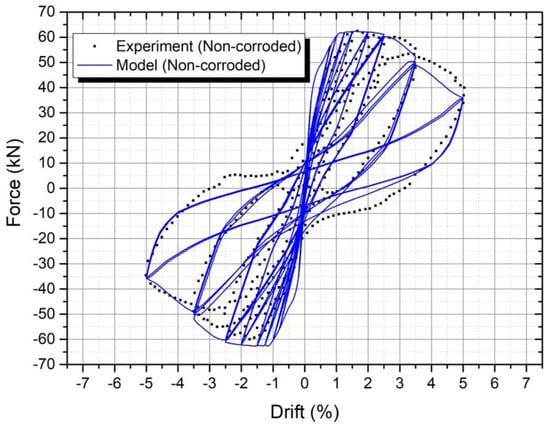
Figure 19.
Non-linear response of the non-corroded column (model).
The analysis of cyclic behavior of corroded RC column taking into account the hysteretic model of the corroded steel reinforcement for uniform corrosion was insufficient to demonstrate the experimental results of the corroded RC column, despite the reduced values of steel reinforcement’s mechanical properties inserted. As observed from the diagram in Figure 20, it was obvious that the model overestimated the bearing capacity of the corroded RC column both in tensile and compressive loads. In detail, in the anion branch the value of the maximum force showed a 10% deviation from the actual value (from 50 kN to 45 kN), while in the cation branch the value of the maximum force differed from the experiment by about 8.5% (from 49 kN to 45 kN), deviation that was apparently improved compared to the anion branch. In the latter drifts, the force under which the failure occurred was 28.9 kN and was twice the value of the experimental one. Regarding the force recorded in the last drift before failure, the force, as in the anion branch, was well beyond the true value (62% higher). The abovementioned differences between the analytical model and experimental results were due to the consideration of a uniform type of corrosion, while in actuality the corrosion damage of embedded (in concrete) steel reinforcement is recognized as pitting corrosion.
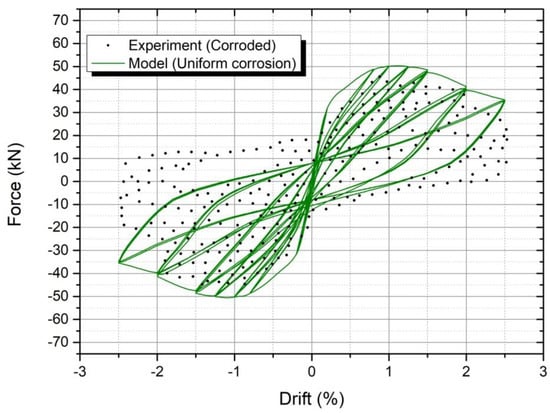
Figure 20.
Non-linear response of the column with uniform corrosion of steel reinforcement (model).
Accounting for the hysteretic model of corroded steel reinforcement for pitting corrosion, the analysis demonstrated a convergence in respect to the experimental results, as reflected in Figure 21. The cyclic behavior extracted from the model was in good agreement with the experimental one; more specifically, there was an absolute match in both the anion and cation branches at drifts up to 1.5%, whereas the differences occurred for larger strain ranges in cation branch, where the value of the maximum force showed a 28% deviation from the actual recorded value. As a matter of fact, this divergence might have been due to the fact that the hysteretic model of the corroded steel reinforcement was set from the experimental results with a mass loss equal to 15%, whereas the actual recorded mass loss of steel rebars of the experimental tests varied from 14% to 20%, thereby resulting in a difference in the reduced effective cross section. As mentioned in the previous section, corrosion damage in embedded steel bars may vary resulting in different maximum pit depths and actual residual cross sections which can alter the bearing and ductility capacity among different steel bars. Taking into account the beneficial number of cycles corresponding to 70–80% of the bearing capacity, the latter cycles may be omitted; thus, the model demonstrated sufficient convergence in respect to the experimental results for its useful lifetime.
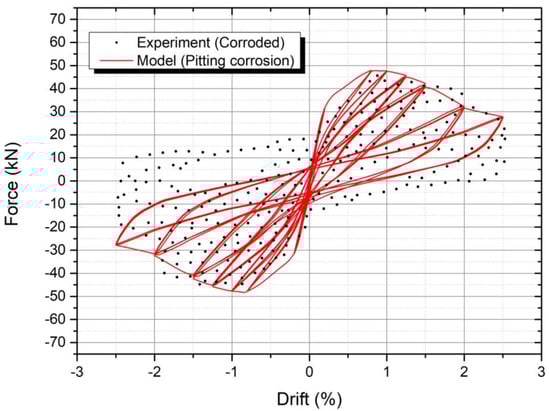
Figure 21.
Non-linear response of the column with pitting corrosion of steel reinforcement (model).
6. Conclusions
In the present work, an experimental study upon the effect of corrosion on the hysteretic behavior of steel reinforcing bars was conducted, from which non-linear hysteretic models of steel bars were extracted. Based on these, an FEM analysis of the cyclic behavior of non-corroded and corroded RC columns was performed in order to validate them. The main outcomes of the manuscript are as follows:
- Pitting corrosion can cause a significant reduction in the actual residual cross-section of steel bars, since deviation between the mean reduced diameter (dred) and the effective diameter (deff) was depicted. Due to the reduction in the cross-section and stress concentration development in the area around the pits, rapid failure and change of the failure mechanism occurred under the dynamic loading of the corroded steel bars;
- Due to the combined action of the loading history and the buckling phenomena, the hysteretic behavior of the non-corroded steel reinforcing bar gradually degraded and differed from the classic bilinear σ-ε model, which is taken into account by the current international regulations. In the case of corrosion, the envelope curve of the hysteretic model was further degraded due to corrosion damage.
- For corroded steel reinforcing bars, the envelope curve of the hysteretic model was further degraded; in the case of uniform corrosion, a slight reduction was presented depending on the percentage mass loss, whereas in the case of pitting corrosion a significant drop was denoted, both in terms of strength but mainly of ductility;
- An attempt was made to quantify the corrosive factor in the hysteretic behavior of steel reinforcement. The proposed models simulating the cyclic behavior of the non-corroded and corroded RC column, especially in the case of steel reinforcement suffering from pitting corrosion, were in good agreement with the experimental results, both in terms of bearing capacity and useful lifetime.
Author Contributions
Methodology, M.B., K.K. and C.A.; software, M.B. and K.K.; validation, M.B.; investigation, M.B.; writing—original draft preparation, M.B. and K.K.; writing—review and editing, C.A.; supervision, C.A. All authors have read and agreed to the published version of the manuscript.
Funding
This research received no external funding.
Conflicts of Interest
The authors declare no conflict of interest.
References
- Spacone, E.; Filippou, F.C.; Taucer, F.F. Fibre beam-column model for non-linear analysis of r/c frames: Part I: Formulation. Earthq. Eng. Struct. D 1996, 25, 711–725. [Google Scholar] [CrossRef]
- OpenSees. The Open System for Earthquake Engineering Simulation. PEER 2011. University of California: Berkeley, CA, USA. Available online: https://www.researchgate.net/publication/224243712_OpenSees_A_Framework_for_Earthquake_Engineering_Simulation (accessed on 15 June 2022).
- Apostolopoulos, C.; Konstantopoulos, G.; Koulouris, K. Seismic resistance prediction of corroded S400 (BSt420) reinforcing bars. Int. J. Struct. Integr. 2018, 9, 119–138. [Google Scholar] [CrossRef]
- Apostolopoulos, C.A.; Papadopoulos, M.P. Tensile and low cycle fatigue behavior of corroded reinforcing steel bars S400. Constr. Build. Mater. 2007, 21, 855–864. [Google Scholar] [CrossRef]
- Kashani, M.M.; Crewe, A.J.; Alexander, N.A. Nonlinear cyclic response of corrosion damaged reinforcing bars with the effect of buckling. Constr. Build. Mater. 2013, 41, 388–400. [Google Scholar] [CrossRef]
- Lehman, D.E.; Moehle, J.P.; Mahin, S.A.; Calderone, A.C.; Henry, H. Experimental valuation of Seismic Design Provisions for Circular Reinforced Concrete Columns. J. Struct. Eng. 2004, 130, 869–879. [Google Scholar] [CrossRef]
- Berry, M.; Eberhard, M.O. Performance Models for Flexural Damage in Reinforced Concrete Columns; University of California: Berkeley, CA, USA, 2008. [Google Scholar]
- Apostolopoulos, C.A. Mechanical behavior of corroded reinforcing steel bars S500s tempcore under low cycle fatigue. Constr. Build. Mater. 2007, 21, 1447–1456. [Google Scholar] [CrossRef]
- Monti, G.; Nuti, C. Nonlinear cyclic behaviour of reinforcing bars including buckling. J. Struct. Eng. 1992, 118, 3268–3284. [Google Scholar] [CrossRef]
- Mau, S.T.; El-Mabsout, M. Inelastic Buckling of Reinforcing Bars. J. Eng. Mech. 1989, 115, 1–17. [Google Scholar] [CrossRef]
- Kashani, M.M.; Crewe, A.J.; Alexander, N.A. Nonlinear stress-strain behaviour of corrosion damaged reinforcing bars including inelastic buckling. Eng. Struct. 2013, 48, 417–429. [Google Scholar] [CrossRef]
- Dhakal, R.P.; Maekawa, K. Modeling for postyield buckling of reinforcement. J. Struct. Eng. 2002, 128, 1139–1147. [Google Scholar] [CrossRef] [Green Version]
- Zong, Z.; Kunnath, S.; Monti, G. Material Model Incorporating Buckling of Reinforcing Bars in RC Columns. J. Struct. Eng. 2013, 140, 04013032. [Google Scholar] [CrossRef]
- Kunnath, S.K.; Heo, Y.; Mohle, J.F. Nonlinear uniaxial material model for reinforcing steel bars. J. Struct. Eng. 2009, 135, 335–343. [Google Scholar] [CrossRef]
- Kioumarsi, M.; Benenato, A.; Ferracuti, B.; Imperatore, S. Residual Flexural Capacity of Corroded Prestressed Reinforced Concrete Beams. Metals 2021, 11, 442. [Google Scholar] [CrossRef]
- Jiang, C.; Ding, H.; Gu, X.; Zhang, W. Failure mode-based calculation method for bending bearing capacities of normal cross-sections of corroded reinforced concrete beams. Eng. Struct. 2022, 258, 114113. [Google Scholar] [CrossRef]
- Jiang, C.; Ding, H.; Gu, X.; Zhang, W. Bending failure modes and simplified bending capacity calculation methods for normal cross-sections of corroded RC beams. J. Build. Struct. 2022, 43, 1–10. [Google Scholar] [CrossRef]
- Valdez-Salas, B.; Ramirez, J.; Eliezer, A.; Schorr, M.; Ramos, R.; Salinas, R. Corrosion assessment of infrastructure assets in coastal seas. J. Mar. Eng. Technol. 2016, 15, 124–134. [Google Scholar] [CrossRef] [Green Version]
- Apostolopoulos, C.; Drakakaki, A.; Basdeki, M. Seismic assessment of RC column under seismic loads. Int. J. Struct. Integr. 2019, 10, 41–54. [Google Scholar] [CrossRef]
- EN 206-1; Concrete. Part 1: Specification, Performance, Production and Conformity. BSI: London, UK, 2000.
- Dong, B.; Fang, G.; Liu, Y.; Dong, P.; Zhang, J.; Xing, F.; Hong, S. Monitoring reinforcement corrosion and corrosion-induced cracking by X-ray microcomputed tomography method. Cement. Concr. Res 2017, 100, 311–321. [Google Scholar] [CrossRef]
- Hong, S.; Zheng, F.; Shi, G.; Li, J.; Luo, X.; Xing, F.; Tang, L.; Dong, B. Determination of impressed current efficiency during accelerated corrosion of reinforcement. Cem. Concr. Compos. 2020, 108, 103536. [Google Scholar] [CrossRef]
- Kashani, M.M.; Barmi, A.; Malinova, V. Influence of inelastic buckling on low-cycle fatigue degradation of reinforcing bars. Constr. Build. Mater. 2015, 94, 644–655. [Google Scholar] [CrossRef] [Green Version]
- Rodriguez, M.E.; Botero, J.C.; Villa, J. Cyclic stress–strain behavior of reinforcing steel including the effect of buckling. J. Struct. Eng. 1999, 125, 605–612. [Google Scholar] [CrossRef]
- ASTM Standard G1; Standard Practice for Preparing, Cleaning, and Evaluating Corrosion Test Specimens. ASTM International: West Conshohocken, PA, USA, 2011.
- Mak, M.W.T.; Desnerck, P.; Lees, J.M. Corrosion-induced cracking and bond strength in reinforced concrete. Constr. Build. Mater. 2019, 208, 228–241. [Google Scholar] [CrossRef]
- CEB-FIP. FIB Model Code 2010; Structural Concrete; Ernst and Sohn: Lausanne, Switzerland, 2013; pp. 152–189. [Google Scholar]
- Koulouris, K.; Apostolopoulos, C. Study of the Residual Bond Strength between Corroded Steel Bars and Concrete—A Comparison with the Recommendations of Fib Model Code 2010. Metals 2021, 11, 757. [Google Scholar] [CrossRef]
- Koulouris, K.; Apostolopoulos, C. An experimental study on effects of corrosion and stirrups on bond behavior of reinforced concrete. Metals 2020, 10, 1327. [Google Scholar] [CrossRef]
- Apostolopoulos, C.A.; Demis, S.; Papadakis, V.G. Chloride-induced corrosion of steel reinforcement—Mechanical performance and pit depth analysis. Constr. Build. Mater. 2013, 38, 139–146. [Google Scholar] [CrossRef]
- Wang, X.; Zhang, W.; Gu, X.; Dai, H. Determination of residual cross-sectional areas of corroded bars in reinforced concrete structures using easy-to-measure variables. Constr. Build. Mater. 2013, 38, 846–853. [Google Scholar] [CrossRef]
- Ribeiro, R.B.; Silva, J.W.J.; Hein, L.R.O.; Pereira, M.C.; Codaro, E.N.; Matias, N.T. Morphology characterisation of pitting corrosion on sensitized austenitic stainless steel by digital image analysis. ISRN Corros. 2013, 7, 905942. [Google Scholar] [CrossRef] [Green Version]
- Du, Y.G.; Clark, L.A.; Chan, A.H.C. Effect of corrosion on ductility of reinforcing bars. Mag. Concr. Res. 2005, 57, 407–490. [Google Scholar] [CrossRef] [Green Version]
- Tang, F.; Lin, Z.; Chen, G.; Yi, W. Three-dimensional corrosion pit measurement and statistical mechanical degradation analysis of deformed steel bars subjected to accelerated corrosion. Constr. Build. Mater. 2014, 70, 104–117. [Google Scholar] [CrossRef]
- Fernandez, I.; Bairan, J.M.; Marν, A.R. Mechanical model to evaluate steel reinforcement corrosion effects on σ–ε and fatigue curves. Experimental calibration and validation. Eng. Struct. 2016, 118, 320–333. [Google Scholar] [CrossRef] [Green Version]
- Rajagopal, R.; Sharma, S.; Pillai, R.G.; Subramanian, S.J. Assessment of Stress-Strain Behavior of Corroded Steel Reinforcement Using Digital Image Correlation (DIC). J. Test. Eval. 2018, 46, 1874–1890. [Google Scholar] [CrossRef]
- Palsson, R.; Mirza, S.M. Mechanical Response of Corroded Steel Reinforcement of Abandoned Concrete Bridge. Struct. J. 2002, 99, 157–162. [Google Scholar]
- Imperatore, S.; Rinaldi, Z.; Drago, C. Degradation relationships for the mechanical properties of corroded steel rebars. Constr. Build. Mater. 2017, 148, 219–230. [Google Scholar] [CrossRef]
- Apostolopoulos, C.; Drakakaki, A.; Basdeki, M.; Apostolopoulos, A. Degradation Laws of Mechanical Properties of Corroded Steel Bar of Existing Structures on Coastal Areas. In Proceedings of the 10th International Symposium on the Conservation of Monuments in the Mediterranean Basin, Athens, Greece, 20–22 September 2017. [Google Scholar]
- Apostolopoulos, C.; Michalopoulos, D. The impact of corrosion on the mechanical behavior of steel undergoing plastic deformation. Mater. Corros. 2007, 58, 5–12. [Google Scholar] [CrossRef]
- Fernandez, I.; Bairán, J.M.; Marí, A.R. Corrosion effects on the mechanical properties of reinforcing steel bars. Fatigue and r–e behavior. Constr. Build. Mater. 2015, 101, 772–783. [Google Scholar] [CrossRef]
- Cobo, A.; Moreno, E.; Canovas, M.F. Mechanical properties variation of B500SD high ductility reinforcement regarding its corrosion degree. Mater. Constr. 2011, 61, 517–532. [Google Scholar]
- Moreno, E.; Cobo, A.; Palomo, G.; González, M.N. Mathematical models to predict the mechanical behavior of reinforcements depending on their degree of corrosion and the diameter of the rebars. Constr. Build. Mater. 2014, 61, 156–163. [Google Scholar] [CrossRef]
- Mazzoni, S.; McKenna, F.; Scott, M.H.; Fenves, G.L. OpenSees Command Language Manual; University of California: Berkeley, CA, USA, 2006. [Google Scholar]
Publisher’s Note: MDPI stays neutral with regard to jurisdictional claims in published maps and institutional affiliations. |
© 2022 by the authors. Licensee MDPI, Basel, Switzerland. This article is an open access article distributed under the terms and conditions of the Creative Commons Attribution (CC BY) license (https://creativecommons.org/licenses/by/4.0/).