1. Introduction
Currently, the increase and easier use of quality images are leading to their intensive use in the Architecture, Engineering, Construction, and Operations (AECO) sector along the whole life cycle of construction assets, including in their Facility and Asset Management (FM/AM) [
1,
2]. It is recognized that object recognition, object segmentation and semantic segmentation are important to support construction and FM/AM activities: inspection, progress monitoring, resource tracking and as-built modeling [
1].
Data acquisition by new technologies in the engineering and architectural field has demonstrated wide diffusion, mainly due to the capacity to digitalize constructive elements and artefacts with accuracy and generate information models useful for the phases of analysis, simulation and interpretation [
3]. In this way, the integration of multiple layers of information is offered that can be linked across industry, community, researchers and all the construction stakeholders with flexibility and timeliness, which traditional techniques could not demonstrate [
4]. Moreover, the increasing complexity of buildings highlights the need for the AECO sector to manage a large amount of data, where digitalization is the current solution [
5]. In this scenario, the building digitalization process offers the opportunity to create virtual databases able to collect data from different disciplines in an efficient way [
6,
7,
8].
This work aims to explore the potential of machine learning and deep learning approaches for the supervised classification of degradation pathologies applied to a case study, which can be reproduced in other building typologies. The research activity aims to develop an innovative workflow, applicable to existing buildings, where it is possible to automatize the recognition and classification of degradation pathologies and their characteristics, to allow integrated FM/AM through a BIM model.
The particularity of the approach resides in the use of artificial intelligence (AI) solutions to automatically classify anomalies, not only by type but also to include their parameters, such as surface, gravity and the urgency of the intervention, and, finally, to combine these results in a BIM platform oriented to FM and AM. The established workflow can be divided into four steps.
First, data acquisition with the application of a Terrestrial Laser Scanner (TLS) was carried out, which is a type of digital survey and a non-destructive technique. As a result, partial point clouds were obtained at each station, and after a subsequent data elaboration step through the application of software algorithms, an integral point cloud of the whole complex with the building geometry assembly was obtained. Then, by applying the scan to the BIM process, a 3D modeling step was developed, in which it was possible to achieve the reconstruction of complex geometries and creation of automatic families using programming software and plug-ins such as Dynamo. On the other hand, a data processing step with the identification of pathologies based on the photos of several building defects was performed, applying deep learning (DL) algorithms. Finally, the integration of the DL model in Revit as a plug-in was performed, to proceed with the automatic anomaly detection. For future work, a database is intended to be designed, gathering maintenance actions of different components, as well as its periodicity and service life, with the main objective of making the search easier and encouraging users and managers to protect historical heritage.
In addition to the numerous advantages of the application of the BIM process for FM/AM during the different phases of a project, several problems were also identified. The most obvious is probably the one related to the complicated digital recognition and categorization of façade anomalies (to identify deterioration phenomena), a topic that this research intends to address.
The challenge and the scientific contribution of this research are the automation of the anomaly assessment processes that usually are carried out manually, in which the anomalies’ interpretation and their representation both present complexities that lead to differences when compared with the reality. Another point of interest is that this automation is not only limited to geometric reconstruction as far as the detection of this is restricted to categorization and numerical data. Thus, it will finally be possible to generate a virtual container of information in a BIM environment, both geometric and informative, which will become the basis of a rational, transparent and verifiable reconstruction of the architectural evidence with the potential for maintenance and protection of the built environment. The main relevance of this work is the validation of the linkup between DL prediction and BIM models based on the pilot developed.
2. Digitalization and Computer Vision Technics
2.1. BIM
Building Information Modeling (BIM) represents a methodology able to manage a building in its entire life cycle. However, its use remains limited and it is rarely adopted by facility/asset managers, mainly due to its complex 3D modeling requirements and the lack of shared references and strategic guidelines for semantic data. On the other hand, with the advent of artificial intelligence (AI) solutions, the need for automated and reliable methods to classify 3D point clouds or meshes is becoming fundamental. Several methodologies are based on the automatic classification and/or segmentation of architectural elements with the use of deep learning (DL) methods, allowing the development of algorithms that are able to make decisions based on empirical training data, as a preparative phase for the BIM process [
9,
10,
11].
The issue of automatically detecting anomalies in buildings has been developing. However, there is a general lack of standards for the representation of building pathologies, usually described by generic patterns and colors annotated on a specific legend in a 2D graphic representation [
10]. The inspection and monitoring of these anomalies are crucial in planning maintenance and repairs. This thus provides an innovative scientific basis for study and research: the documentation becomes a sort of three-dimensional digital backup of an asset in its current state. Additionally, the integration of the results into BIM digital models will help managers to decide on the implementation of the most adequate FM/AM strategies to optimize the interventions of maintenance, rehabilitation and restoration. Thus, the BIM environment serves as a collector and container of information, from which the information can be processed and extracted by computer vision techniques, namely Convolutional Neural Networks (CNN), and digitalization techniques, such as laser scanning and photogrammetry, which help to represent the pathologies in the BIM environment.
2.2. Convolutional Neural Network
As a deep learning algorithm, the CNN is commonly applied to input images, assigning importance to various features in the image and learning through this process how to differentiate between them [
12]. CNN is very useful for supervised and unsupervised learning. In the current work, CNN is employed for supervised learning, since the inputs of the system and the outputs to obtain are known.
As for supervised learning, an input image can be categorized and classified by means of a CNN, since it learns and maps a given image to its corresponding category by detecting the features of the image. A CNN is composed of layers, and the more layers the CNN has, the greater is the learning rate of the CNN for high-level feature representations for the classification task. Based on rearranging the CNN layers, several architectures have been developed for several purposes, such as LeNet [
13], which was applied to handwritten digit identification, AlexNet [
14,
15], which is a small architecture for computer vision, and Residual Network (ResNet) [
16], used in the present study. ResNet from Microsoft allows the identification of skip connections in the residual blocks, which allows us to train very deep CNN architectures.
CNN architectures have been used by computer vision algorithms for image classification, detection, generation and segmentation, as presented in the next section. However, for many practical scenarios, there is not enough data available for supervised learning. Thus, in these cases, the CNN is trained for a different problem, where a large amount of training data is available, and then the CNN has to learn the new task by means of transferring knowledge from one task to another [
12], which is denominated as a fine-tuning mechanism.
Nonetheless, related to the lack of datasets and to avoid overfitting, data augmentation is one approach that aims to regularize the networking using data-level techniques. When the number of training examples is low, data augmentation can enlarge the dataset to allow the more robust training of large-scale models. This approach of regularization of the CNN consists of making several copies from a single image using operations such as rotation, cropping, flipping, scaling and translation.
To evaluate the quality of the predictions produced by the networks on the training data, the loss function is used, which is the final layer of the CNN. It quantifies the difference between the estimated output of the model and the correct output. In this case, the F1 score was implemented, and it combines the measurements of precision and recall to produce a single value that indicates the overall quality of the model. This metric works well even with datasets that have disproportionate classes [
17].
2.3. Computer Vision
Based on CNN, computer vision consists of a technology that accepts inputs in the form of images (photos or videos) and provides the automatic analysis of these images [
18,
19]. Moreover, information and data science include methods for representing building information [
20] and methods for AI processing of data, including machine learning (ML) and pattern recognition [
21,
22,
23].
The semantic understanding process is based on the image collection (image databases) for construction anomalies’ detection.
The image recognition process permits the objects’ or patterns’ automatic recognition from one or more images. The image segmentation process consists of the image being partitioned into different regions according to established criteria as expressive features permitting the shape information’s extraction, the noise background reduction and, consequently, making image recognition easier. Thus, image segmentation is naturally applied before image classification [
24].
In the construction sector, different applications have been developed. The 3D point cloud classification process based on machine learning has been used for the automatic recognition of architectural components such as columns, facades or windows in large datasets [
25]; archeologic mosaic image segmentation based on deep cascade learning [
26] for the remote inspection of reinforced concrete (RC) structures using Unmanned Aerial Vehicles (UAVs) and based on the advanced digital image processing the automatic identification of various types of RC pathologies, particularly biological colonies, efflorescence, cracks and exposed steel rebars [
10,
27]; automatic surface concrete damage recognition (cracks, rebar exposure, delamination and intact surface) utilizing a multi-level attention convolutional neural network [
28]; concrete surface cracks’ automatic identification and analysis using deep learning and machine learning techniques [
29,
30,
31,
32]; and concrete spalling [
33]. All of this research highlights the accuracy and importance of these methods for the inspection, maintenance and preservation of the built assets and to assure their performance and quality along with their service life. Computer vision-based techniques have been developed to automatically detect and categorize surface concrete anomalies, avoiding human visual inspections and the associated probability of error.
The research project makes use of computer programming systems for the processing of all the data collected and its automation in a BIM environment, which will constitute the geometric basis from which in-depth and analytical scientific research will be undertaken. The data processing and training pipeline for the DL models are built using the Python programming language with the PyTorch [
34] framework, besides others. The models are trained in a single GPU NVIDIA Tesla V100, and the metrics and result statistics are obtained using scikit-learn [
35].
3. Materials and Methods
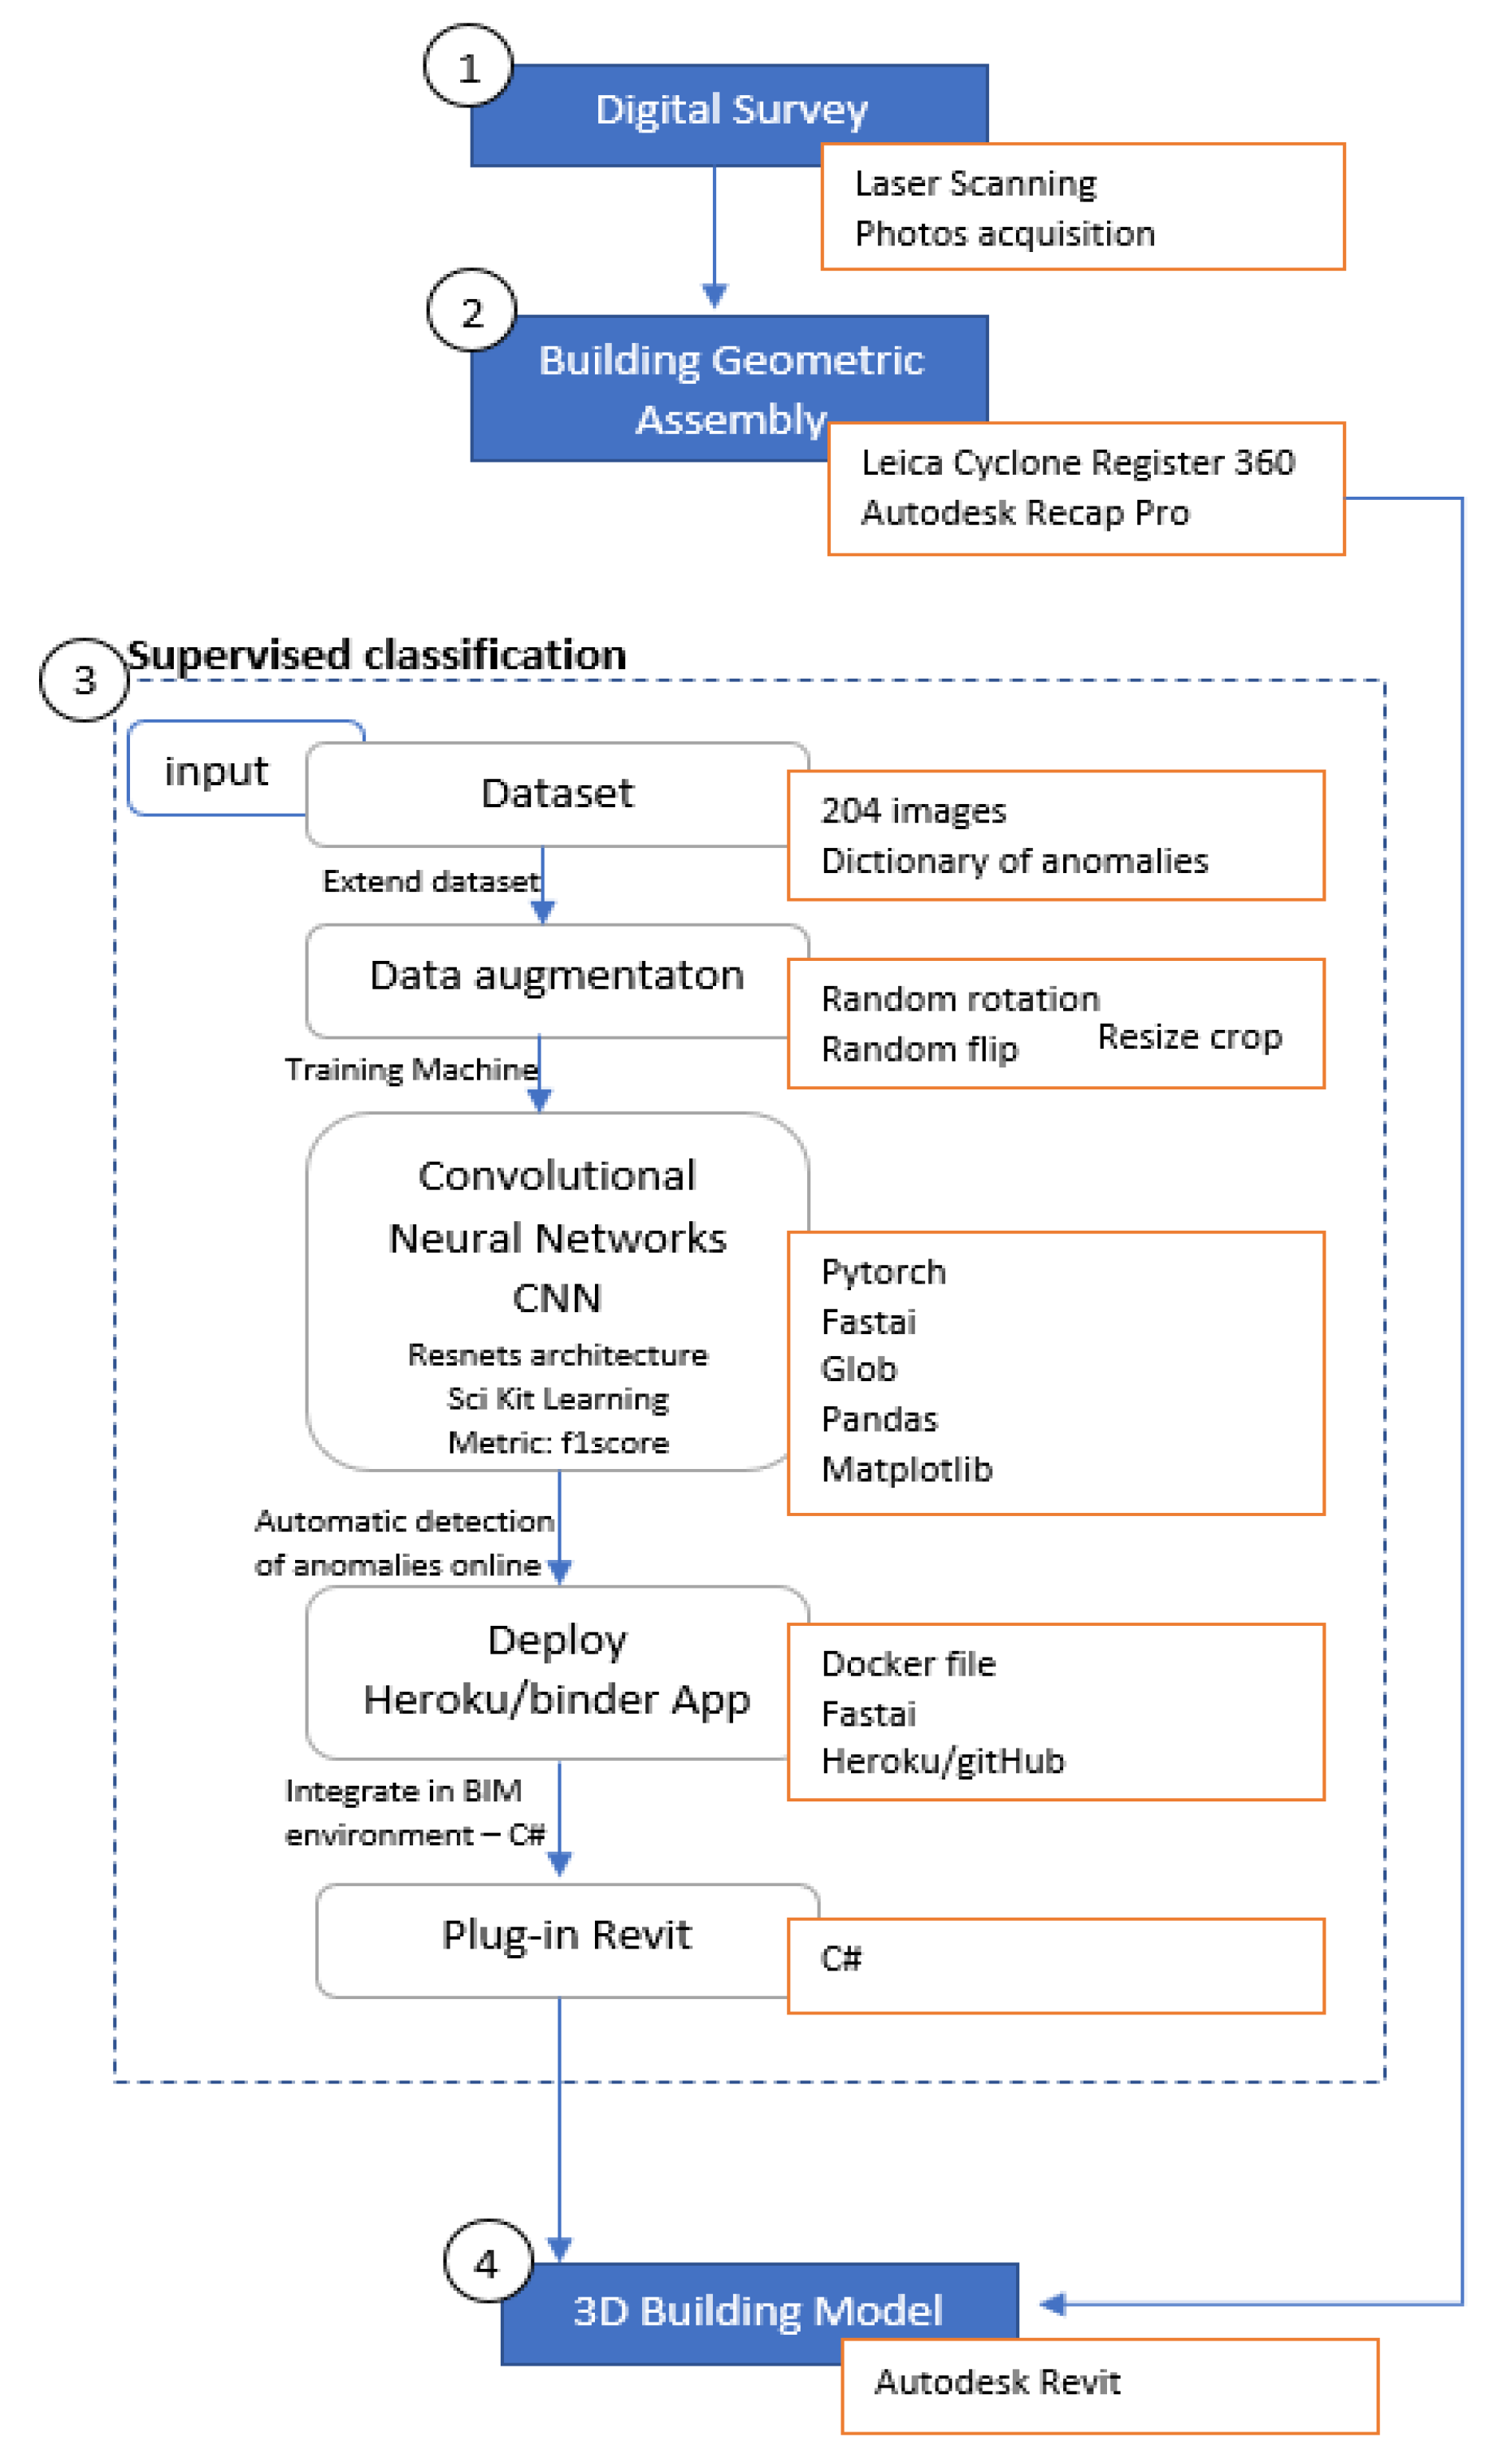
Having the objective of this work in mind, which is to automatize the recognition and classification of building anomalies and to connect this with the BIM model, the following methodology (presented in
Figure 1) was adopted, whose implementation will be described in the section of the case study (
Section 4).
Regarding the survey and data acquisition, the methodology used the integration of data from different sources: direct observation, fieldwork and labs, archival data and laser scanning. The main goal is to obtain a 3D point cloud and orthoimages, both to be used as a geometrical and morphological basis by engineers and architects in the development of interventions in the built environment. Thus, the Scan-to-BIM workflow was applied: this is a reverse modeling technique that uses digital sensing technologies to obtain point clouds, which become the basis for BIM modeling. The so-called workflow is divided into three steps: (i) survey design with the position of the scans, (ii) data processing and (iii) BIM modeling.
Moreover, a dataset composed of images of several anomalies from several buildings was collected and recorded. These images were organized and classified according to the type of anomalies, in which a dictionary of images was developed by means of the one hot encoding process in DL. Then, they were used as the input parameters for the development of the image recognition process in the DL model. The building geometric assembly and the data processing step consisted of processing the results obtained in the Cyclone Register 360 software. Two sub-phases are scheduled: (i) the reconstruction of a 3D geometric model of the structure based on georeferenced images and laser scanner algorithms, and (ii) the automatic identification of pathologies based on the collected images and through the application of image processing tools to be explained below. The data processing was performed with Cyclone Register 360 software utilizing the Iterative Closest Point algorithm.
The supervised classification consists in the automatic identification of created pathologies based on the collected images and through the application of image processing tools available by means of deep learning tools (DL). The 3D building model was developed by means of the 3D point cloud obtained. The scanner processing was performed in Cyclone Register 360 software from Leica; then, by means of RECAP Pro, it was possible to import the point cloud into Autodesk Revit software.
4. Case Study
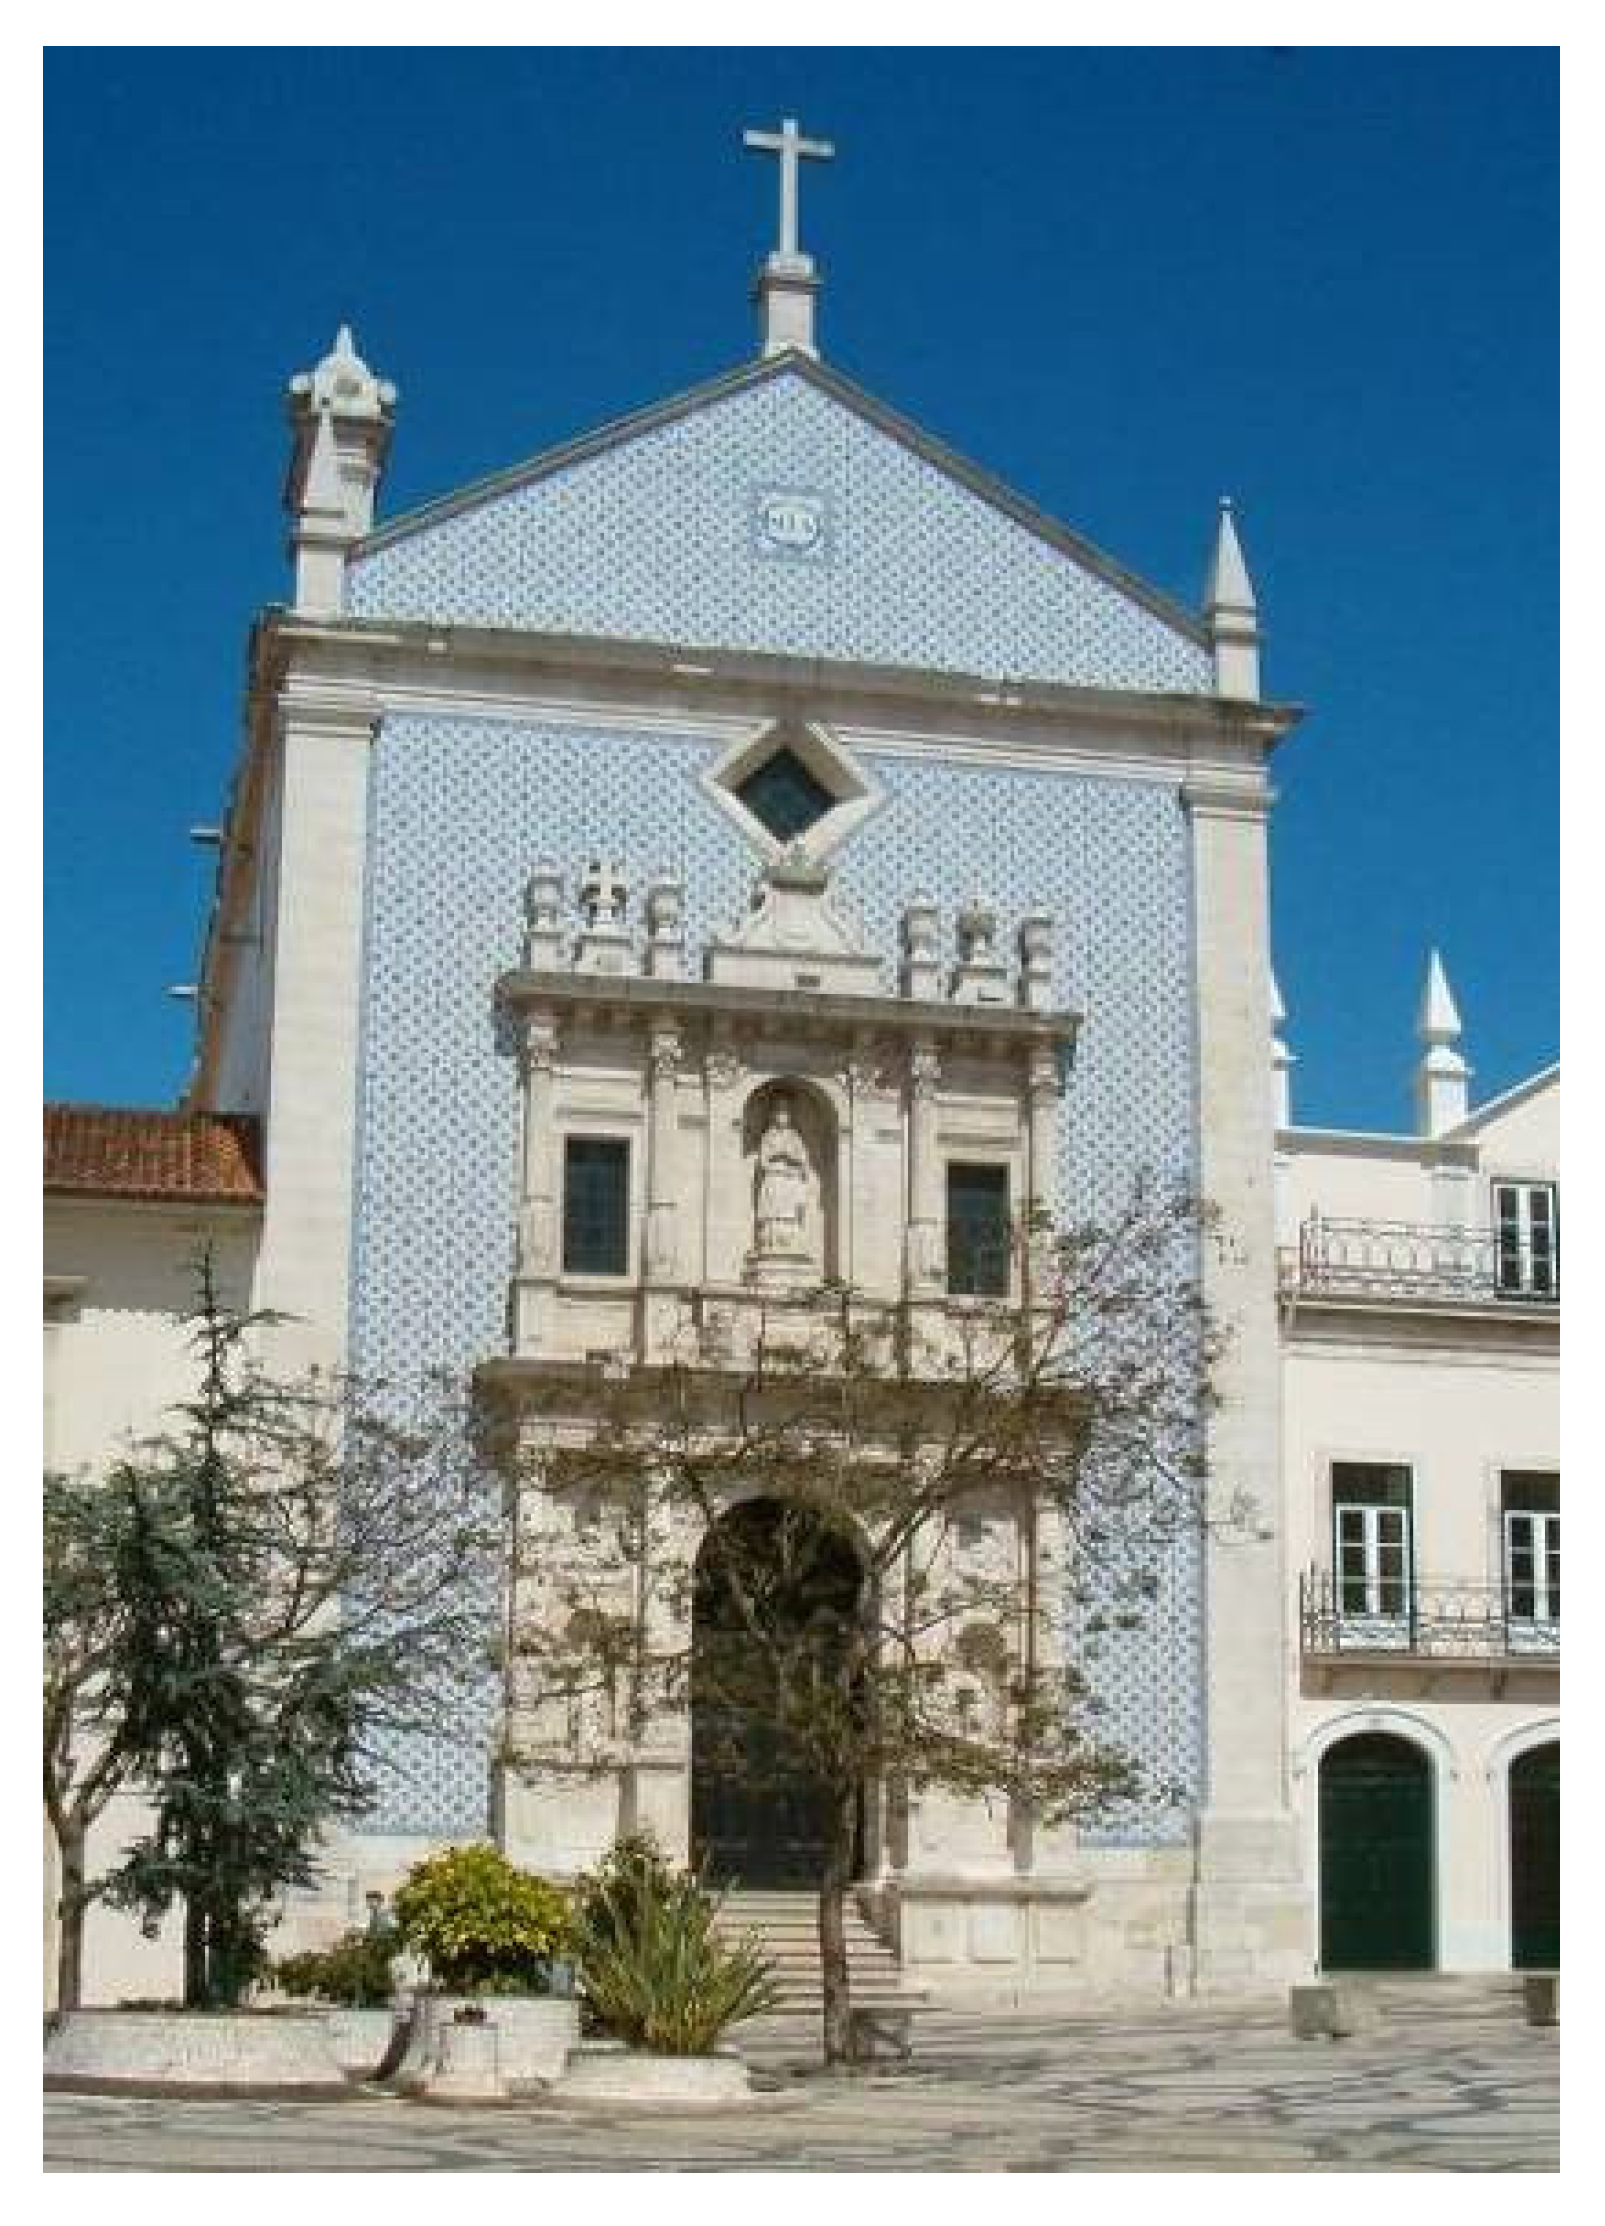
To implement the designed methodology a case study was chosen. The case study is the Church of Santa Casa da Misericordia of Aveiro (
Figure 2 and
Figure 3), in Aveiro, Portugal, which was built in the XVI and XVII centuries and is an important part of the architectural and historical heritage of the city of Aveiro in mainland Portugal. Designed by the architect Gregório Lourenço, the church is characterized by a religious, mannerist architecture. It presents a rectangular plan composed of a single nave and deep chancel and the rectangular inner courtyard of the Dispatch House. The roof is composed of two slopes with ceramic tile cover. Over the centuries, this building has benefited from several restoration and consolidation interventions. It is a masonry structure, with wedges and opening frames of stone, with a ceramic tile coating on the interior facade, vaults and pulpit and baptismal sinks of limestone.
The front of the church, 14 m wide, develops through rectilinear lines marked by the wedges that finish as Tuscan pilasters, on which rests the general threshold, growing up the triangular pediment, bordered laterally by small pyramids with a pedestal in the extension of the wedges as in the line of the eaves. In the center, the finish is achieved by a high cross of stone, also with a pedestal, in the closure of the gable. The austere character of the church’s frontage is aggravated by the application of stamped blue and white ceramic tiles, dated from 1867 [
36].
The building was surveyed for data acquisition by utilizing different sources, namely direct observation, fieldwork, archival data and a Terrestrial Laser Scanner (TLS), to obtain a 3D point cloud. Regarding the survey campaign developed with the TLS, the instrument used was the Leica BLK360. This equipment is a stationary laser scanner of the Continuous Wave–Frequency Modulation (CW-FM) type. The system can measure with great precision the direction of pointing, in addition to a distance meter that emits continuous light radiation. A survey design should first define the TLS station locations to ensure complete coverage of the object at the required spatial resolution and to avoid areas of occlusion. Considering the architectonical features in the interior space of the church, the instrument was set to have a resolution of 6 mm in 10 m. The 3D point cloud model was obtained by means of 12 scans. With a total of 12 internal scans and 5 external scans (belonging only to the façade), the TLS acquisition campaign took almost 3 h, with a single-scan time of approximately 6 min.
The 3D building model was produced by means of the 3D point cloud obtained. The scanner processing was performed in Cyclone Register 360 software from Leica, which processes the scans to eliminate the reconstruction of a 3D geometric model of the structure based on georeferenced images and laser scanner algorithms. The data processing was performed with Cyclone Register 360 utilizing the Iterative Closest Point algorithm: given the set of scans, the ICP algorithm searches for all the possible connections between the pairs of point clouds with overlap. For each connection, a pairwise ICP is performed and the best matching point pairs between the two scans are saved. A final non-linear minimization is run only among these matching point pairs of all the connections. The global registration error of these point pairs is minimized, having as unknown variables the scan poses [
37].
As previously noted, the scanner processing was performed in Cyclone Register 360 software; then, by means of RECAP Pro, it was possible to import the point cloud into the Revit software, in which the building modeling was performed. Regarding the accuracy of the geometry, the level of development used was LOD 300, which allows the modeling of specific families, objects or assemblies in terms of quantity, size, shape, location and orientation. It also allows the addition of parametric information to objects, by means of the creation of shared parameters, with information belonging to the output corresponding to the construction period, demolition, type of anomaly, severity, percentage of surface and intervention actions.
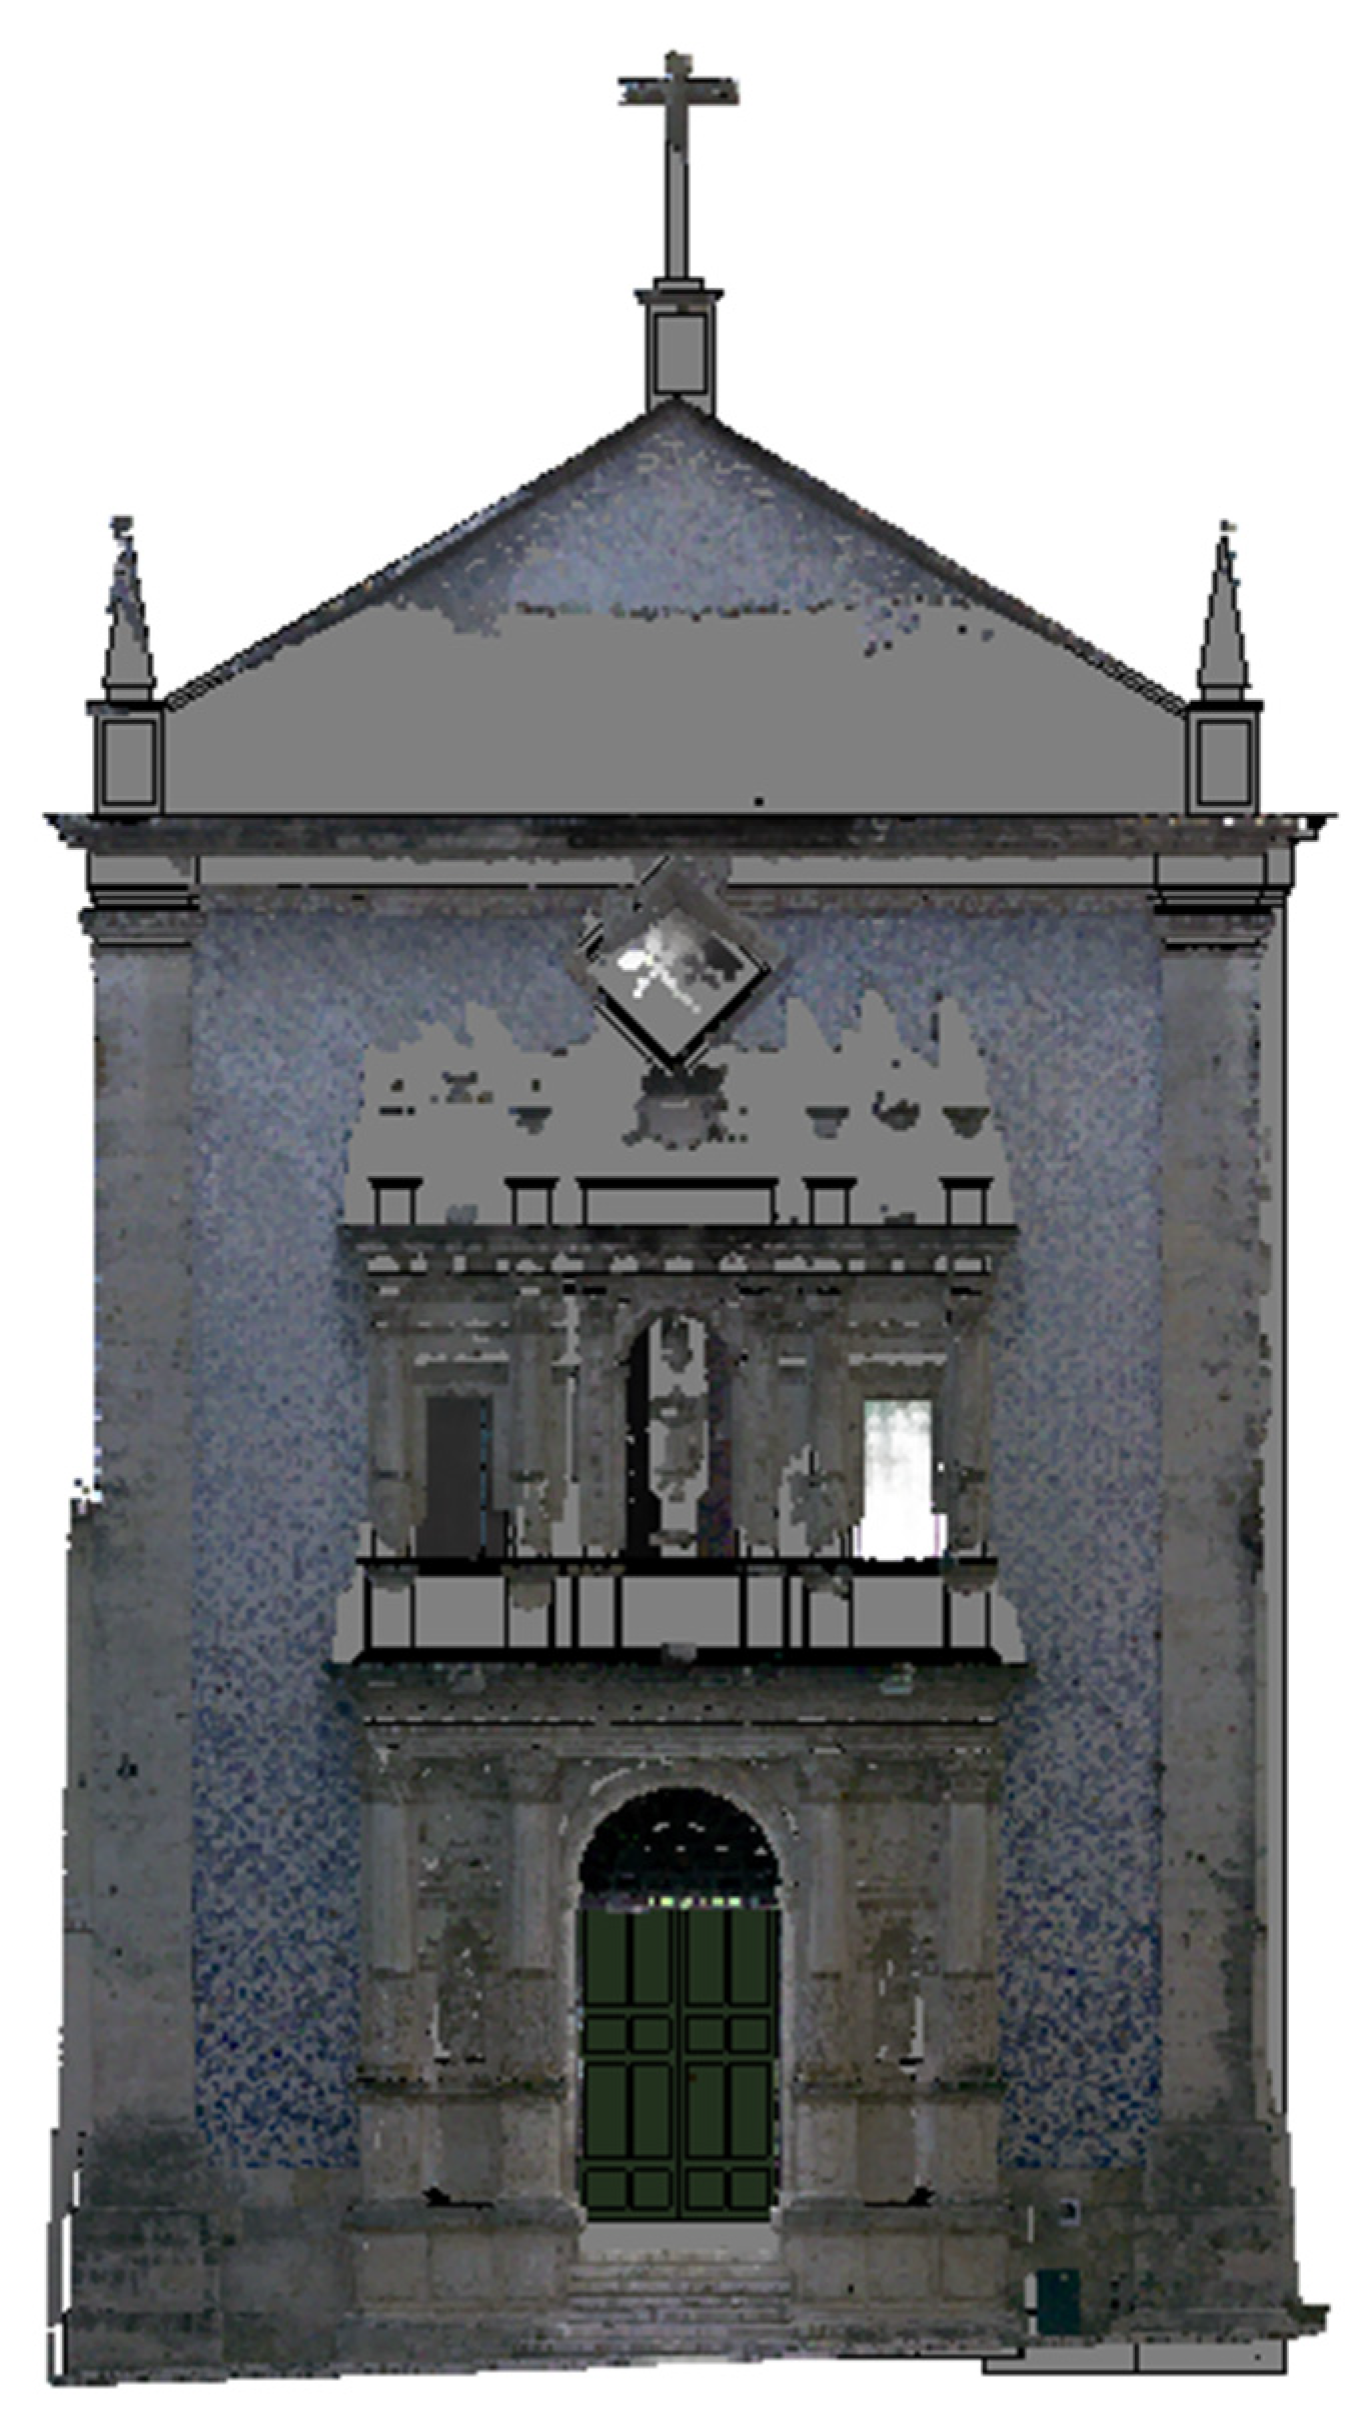
Figure 4 represents the 3D point cloud and the BIM model produced in Revit.
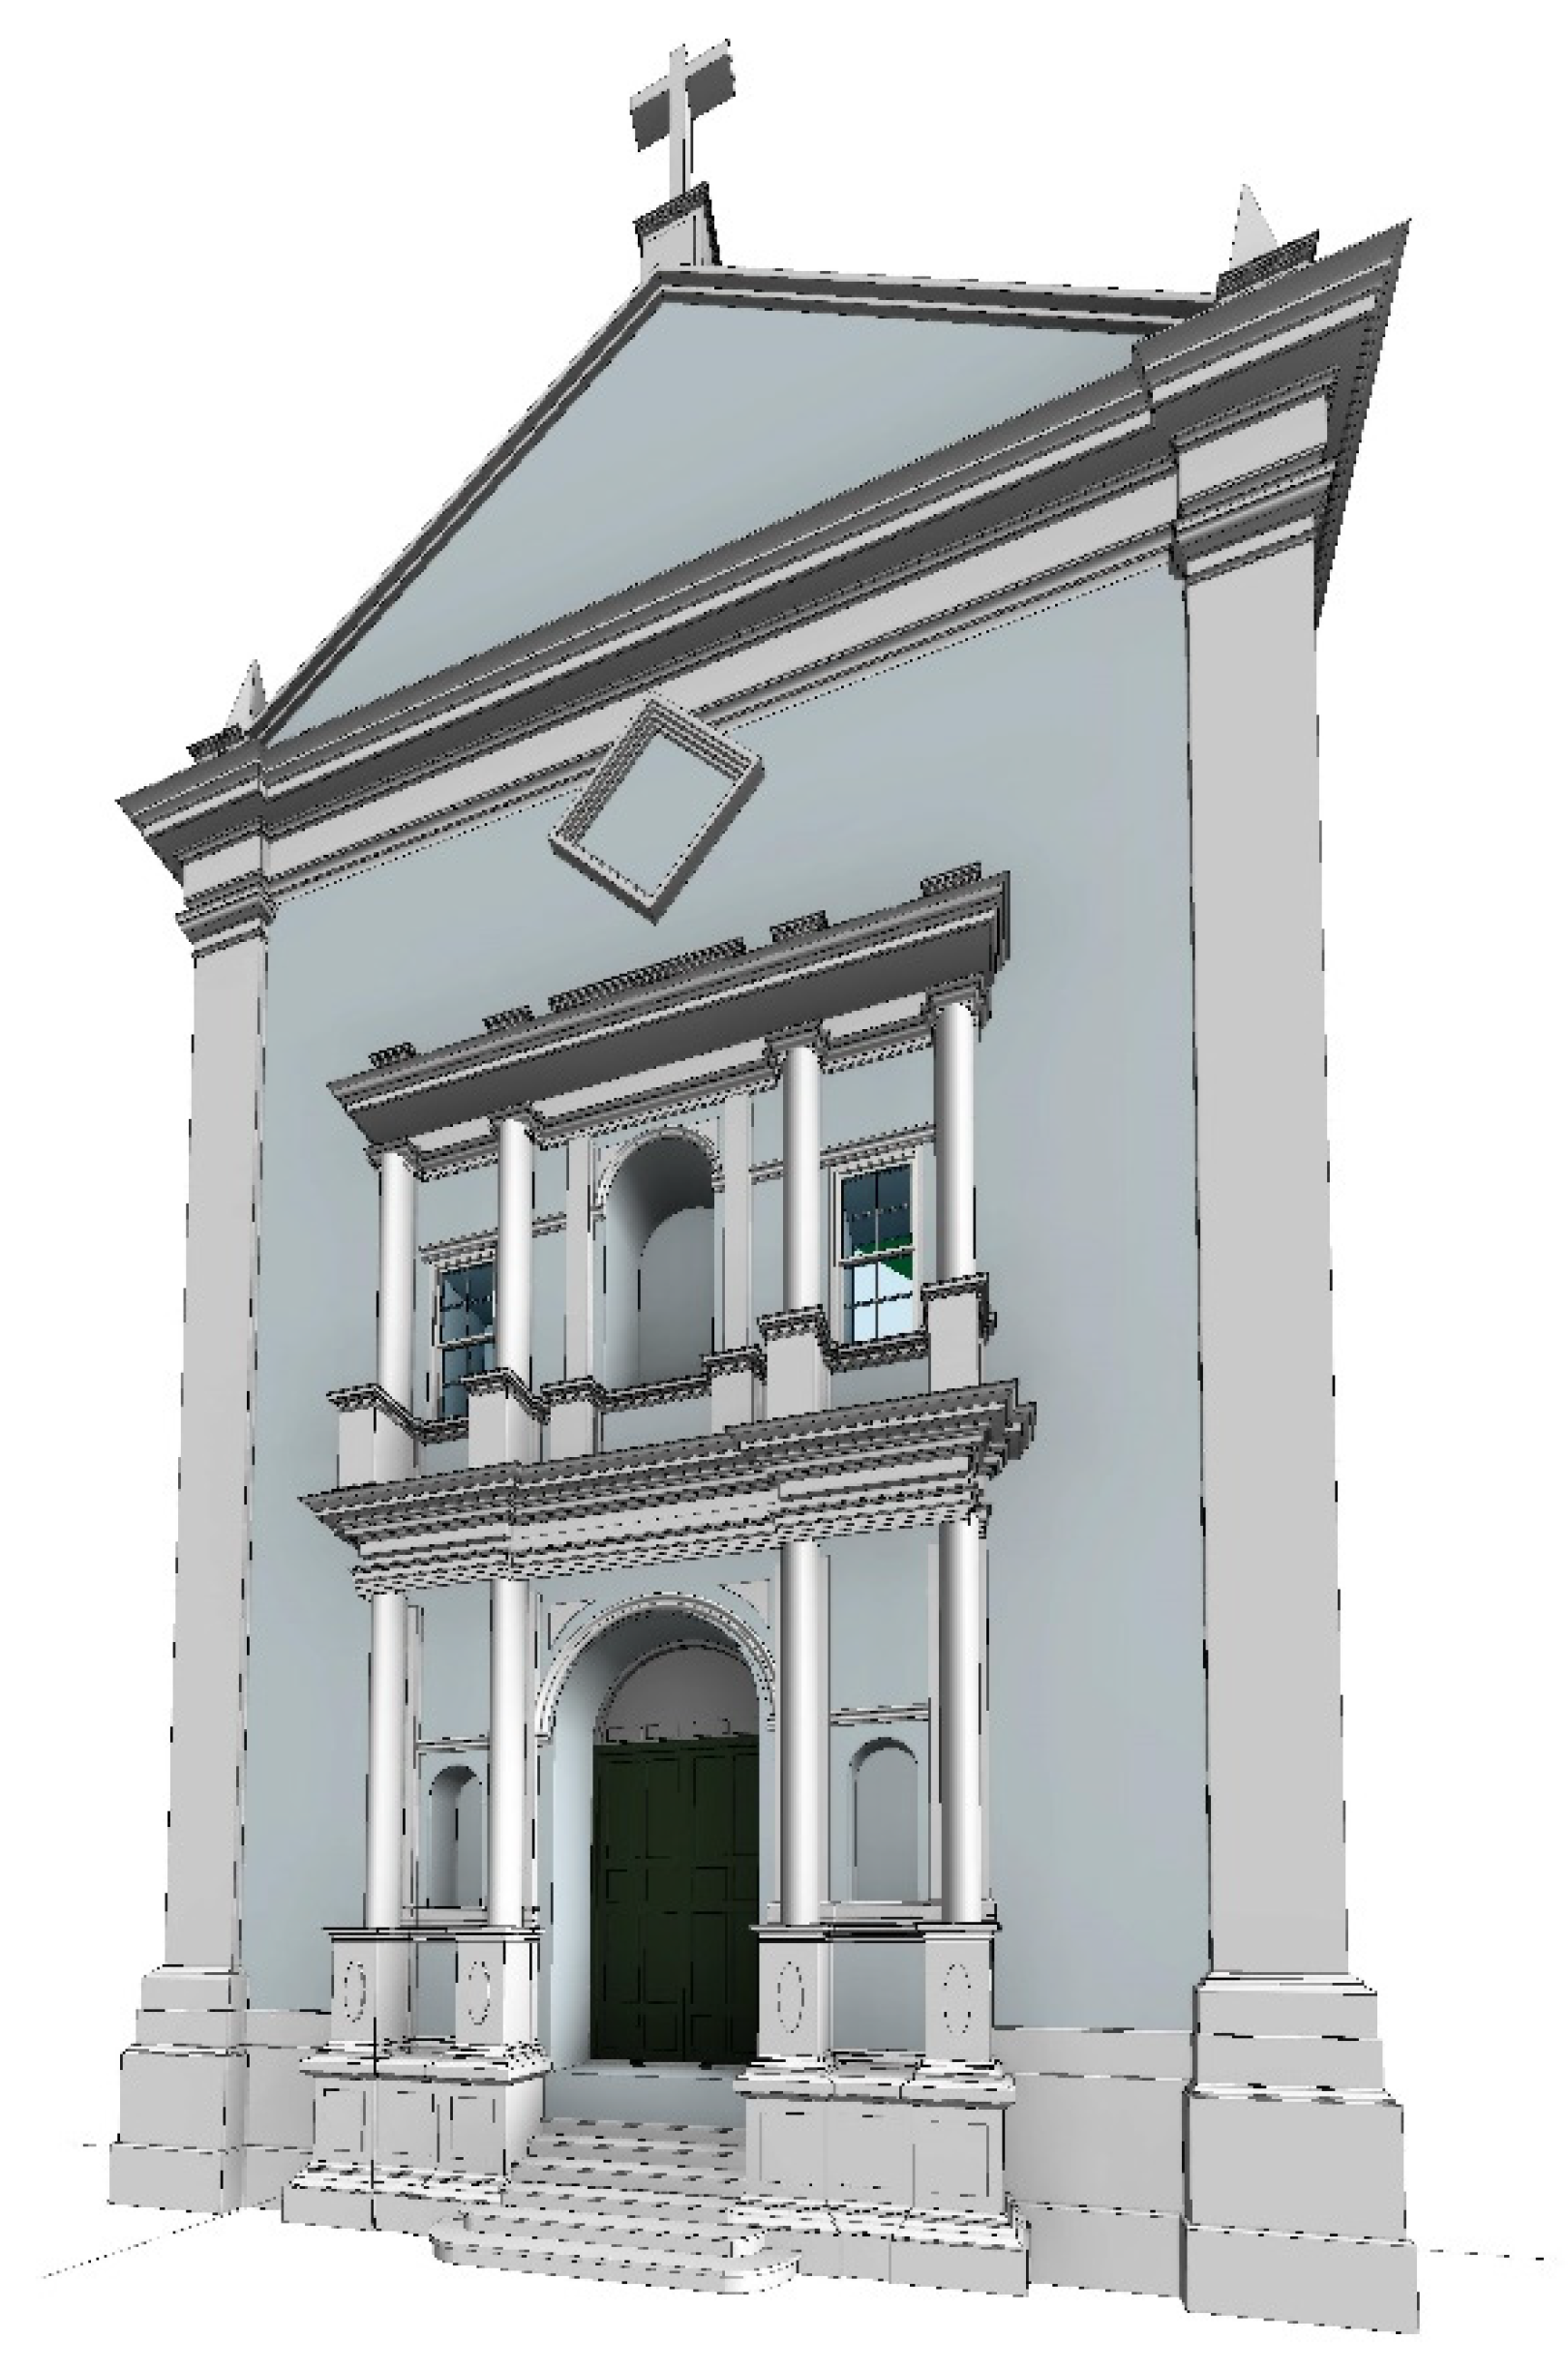
Figure 5 presents the BIM model in Revit. This step makes it possible to obtain the digital representation of the building, which allows for the integration of parametric data into objects and for the coordination of the model by several stakeholders and facility managers.
Besides the TLS survey, a dataset composed of 204 images was gathered. Several anomalies from several buildings were taken and recorded. In this process of data acquisition, the color of the surface was varied so as not to hinder the algorithm. Thus, in the next section, the supervised classification performed by means of images will be explored.
4.1. Dataset Gathering
Data are essential to train DL models [
38]. In the current work, a dataset of images and their respective labels were the input to train the computer vision model. In total, 204 images of anomalies from different buildings were considered in the dataset.
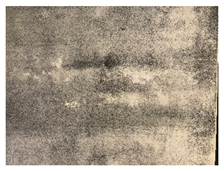
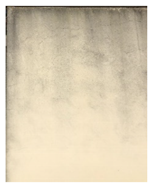
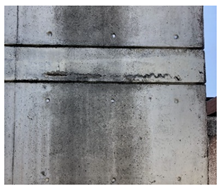
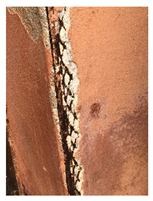
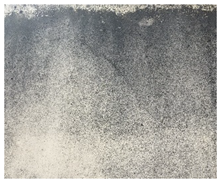
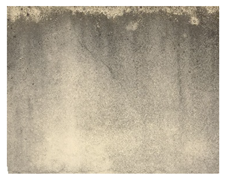
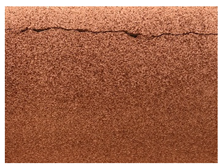
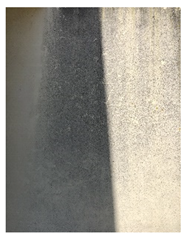
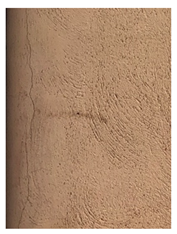
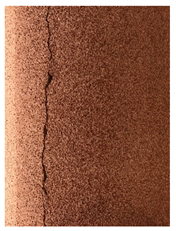
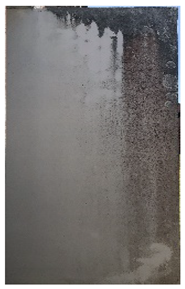
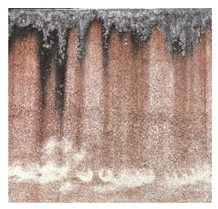
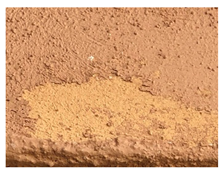
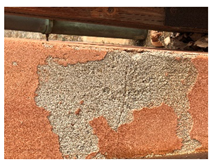
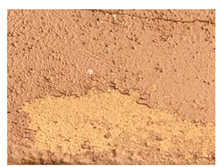
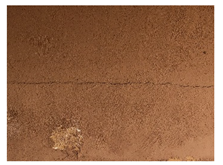
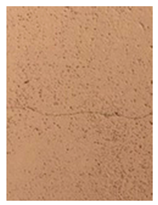
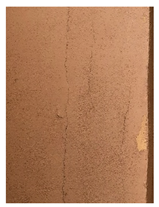
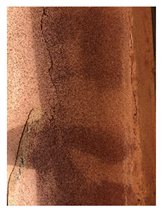
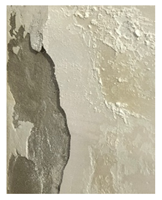
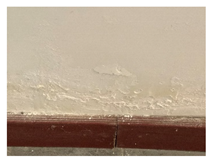
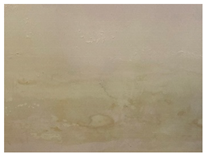
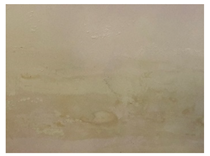
Table 1 presents examples of the classes and the images considered for this work.
The images presented in
Table 1 are part of the dataset used to train the DL model. The neural networks learn and map the input image to its corresponding category by detecting the features of the image. After the model is trained, the new images with anomalies will be classified and categorized by the fine-tuning mechanism.
4.2. Supervised Classification—Data Processing
In this step, the automatic identification of the created pathologies based on the collected images and through the application of image processing tools available by means of deep learning tools (DL) is implemented. This step adopts supervised classification, in which the DL model is trained considering the representative data to classify by the user.
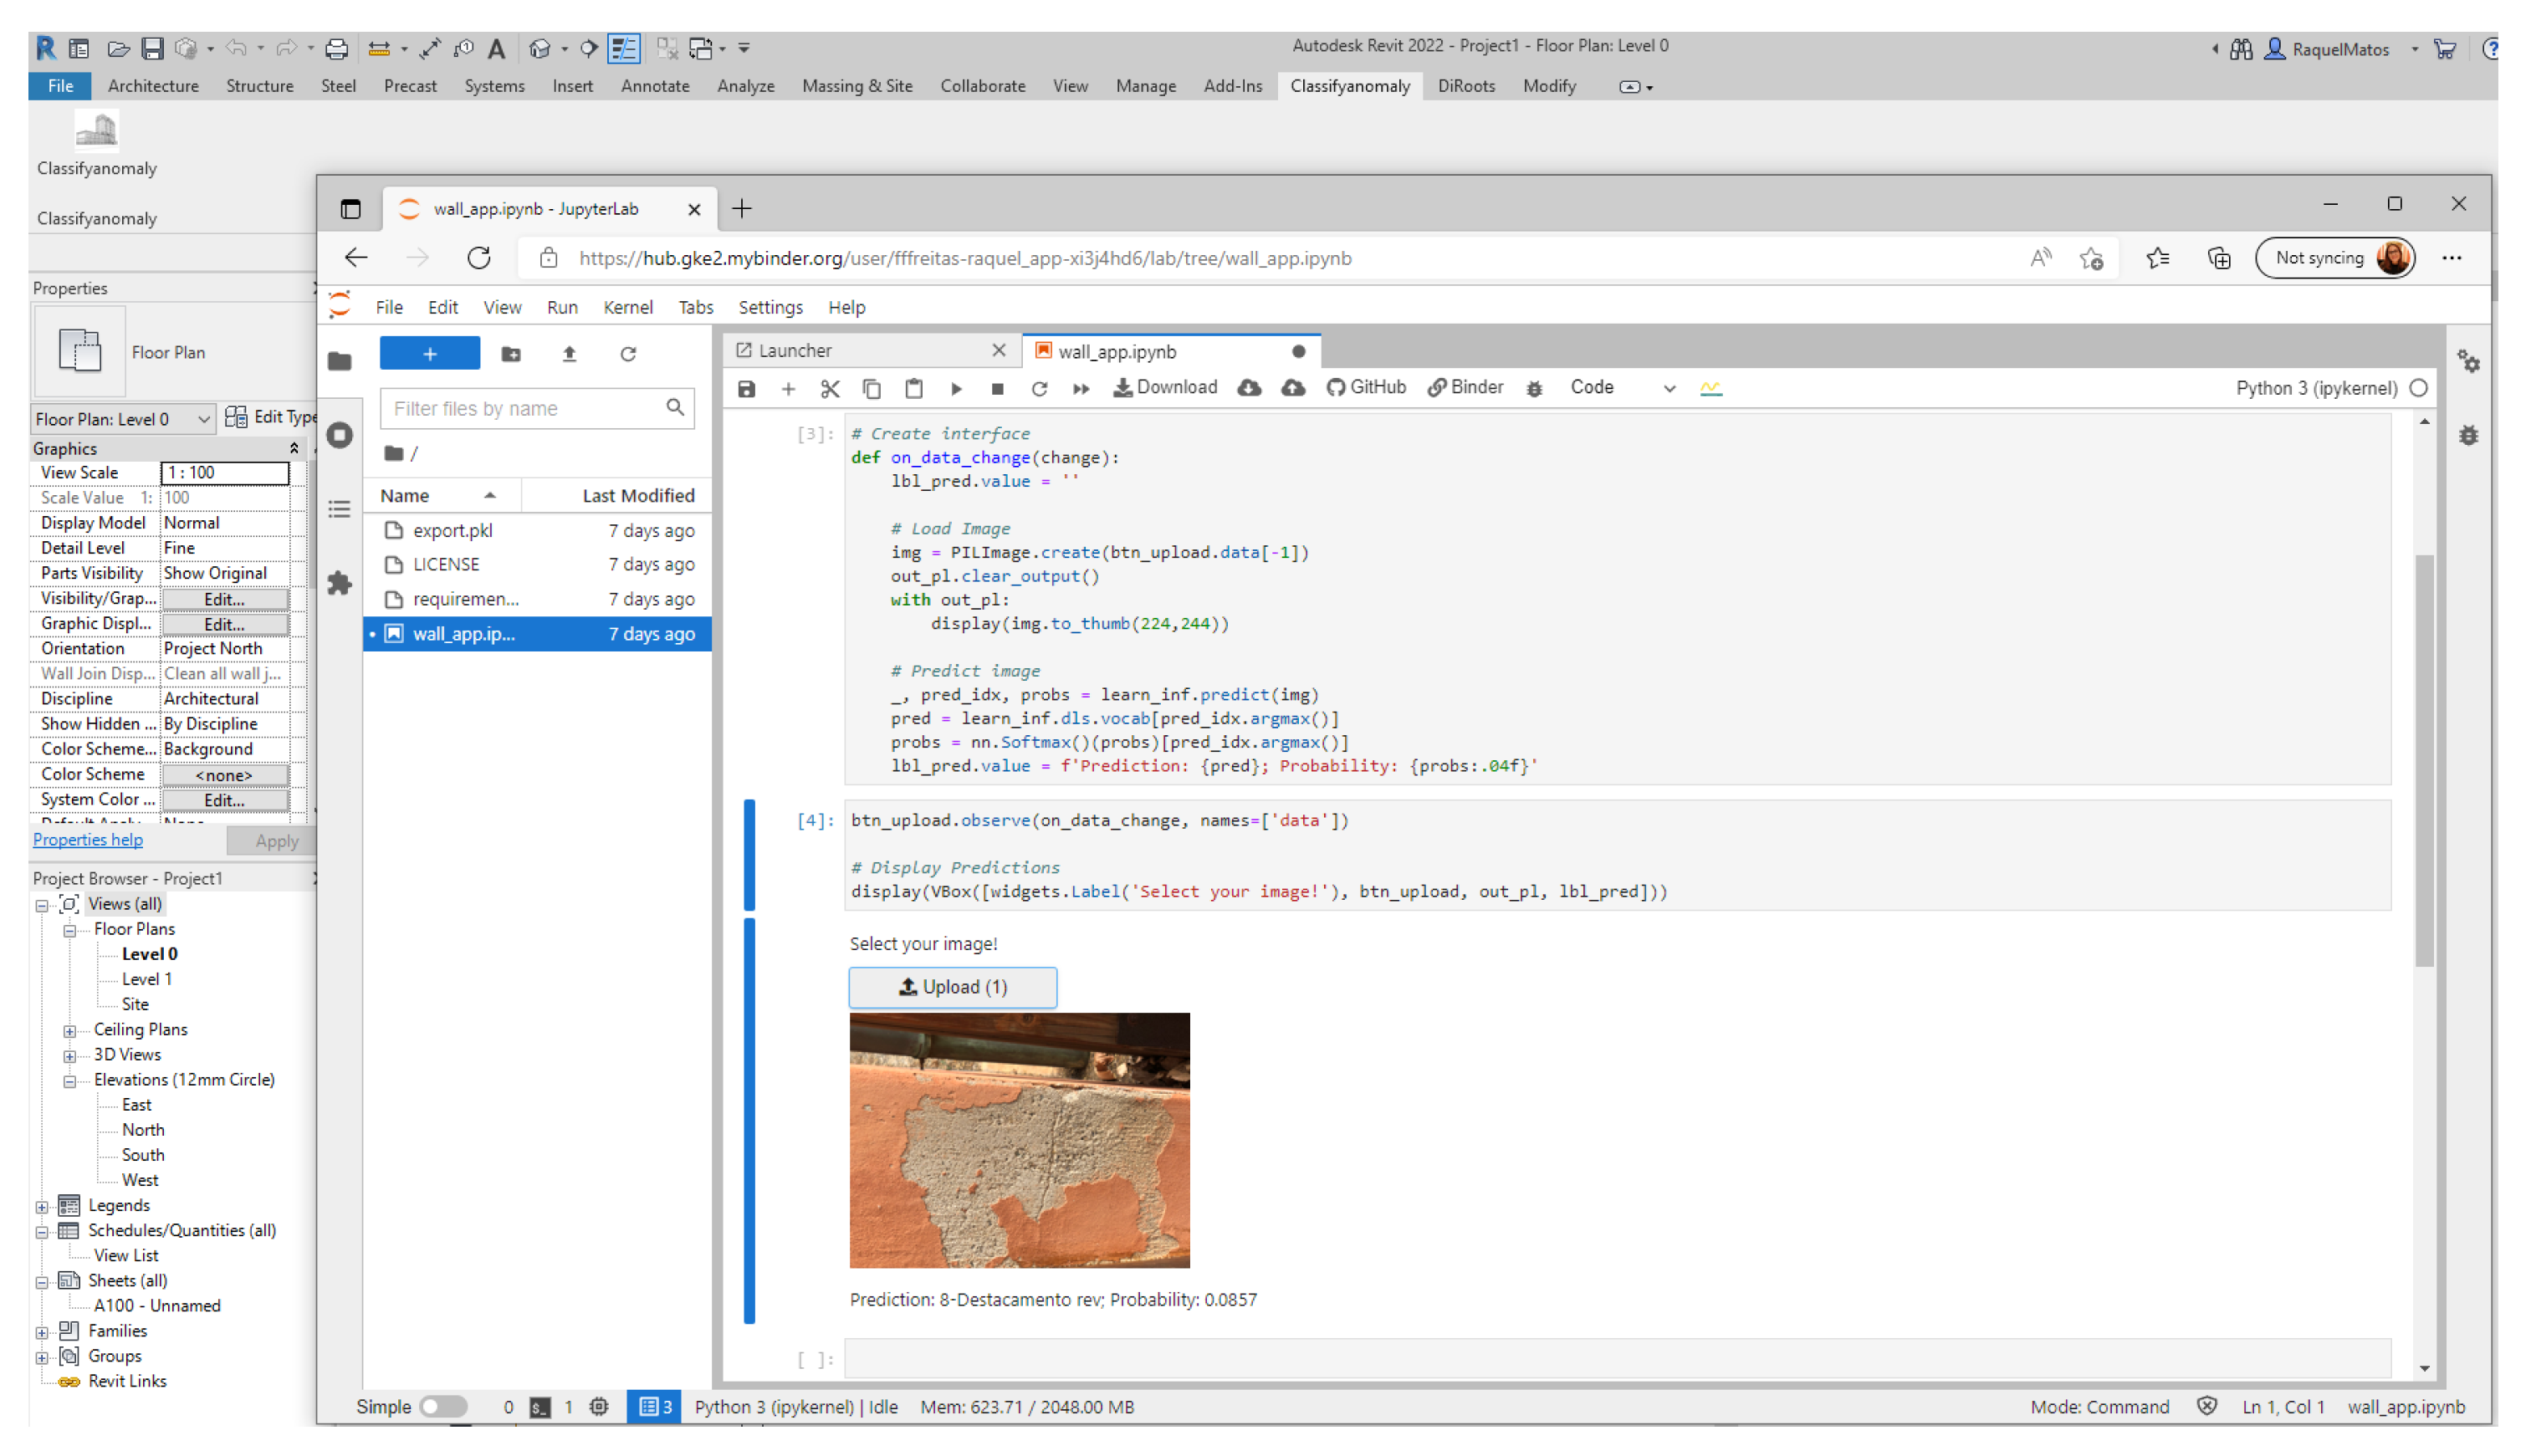
The machine learning model was produced in Jupyter Lab, where PyTorch, fast.ai, pandas, glob and matplotlib were some of the libraries used to proceed with the model. This DL model is placed online by means of an application web on Binder. This application web is then connected to Revit by means of a plug-in, which allows the subsequent automated classification of anomalies within Revit.
The dataset collected during the data acquisition represents several building anomalies and it was used to proceed with a DL model to automate the detection of anomalies in facades. In the DL model, the automatic segmentation and classification are performed by the PyTorch pipeline, where the images are pre-processed. First, all images are labeled according to their structural defects, which, in this case, correspond to 14 classes (each class corresponds to an anomaly). Then, each image is resized to the dimensions of 224 × 224 pixels to fit within the GPU memory.
The full image dataset consists of 204 images, which were subject to a random split to obtain 80% of the images as a training dataset and 20% as a validation/test dataset. Since the dataset of images was not particularly large, to avoid overfitting of the models, the dataset was enlarged using data augmentation, by applying random transformations into the training dataset, as follows:
- -
random rotation in an angle between [−45; 45 degrees] with a probability of 100%;
- -
random horizontal flip with a probability of 50%;
- -
random vertical flip with a probability of 50%;
- -
random resized crop of the images with a scale of 0.8, 1.0 and a ratio of 1.
The transformation of all images to black-and-white (BW) format was also included, to ensure that the models could learn the structural defect features presented in the images. All images were then normalized, so their pixel color values varied within the range of ∈ R[−1.,1.]. Afterwards, the images were converted to tensor format to be used by the CNN model.
As the main backbone model for the classification task, the Residual Network (ResNet) was selected as the base architecture. ResNets were first proposed in [
16] and consist of a deep neural network (DNN) built as blocks of convolutional layers together with shortcut connections (or skip layers) that help the ResNet to avoid problems associated with DNNs—in particular, the well-known gradient vanishing/exploding problem [
39]. In this analysis, the discriminant power of the ResNet with an increasing number of layers—ResNet-18, ResNet-34, ResNet-50 and ResNet-101—was tested.
All models were trained using the Adam optimizer [
40] with an initial learning rate of 3e-4; the models were trained for 10 epochs, and the learning rate was reduced by half of its value every time the loss did not improve. This dynamic change in value for the learning rate is referred to as a reduction in the plateau. As a loss function for the model, the negative log-likelihood (NLLLoss) was used, which was appropriate to this case due to the number of classes in the dataset. To evaluate the performance of each CNN model, the F1 score metric was used. The values of the scores for each ResNet architecture are displayed in
Table 2.
The F1 score is a metric that combines precision with recall, and its value indicates the general quality of the model. By means of the architectures used—ResNet—the model had obtained more than 50% accuracy, except for ResNet-101. It is possible to notice that 34-layer/residual nets are comparably more accurate.
For the architectures used and presented in
Table 2, it is possible to conclude that the precision is above 50% and less than 75%. This can be justified by the size of the dataset, which promotes the phenomenon of overfitting. Since the dataset will continue to be increased with photos, it is expected that the accuracy will increase.
In this case, more layers in the learning model do not always means a better learning model with a lower rate of error. When the dataset is not particularly large, adding more layers to the deep neural networks causes the model to become stagnant or start to degraded. When deeper networks are able to start converging, with the network depth increasing, the accuracy becomes saturated and then degrades rapidly [
16].
According to [
16], the 18-layer plain/residual nets are comparably accurate, but the 18-layer ResNet converges faster. According to this author, the deeper ResNet has smaller magnitudes of responses, and when there are more layers, an individual layer of ResNet tends to modify the signal less.
4.3. Plug-In into Revit
In this step, a DL model for the automated classification of building anomalies was developed in Python, and it is available online by means of an app. Then, it was possible to integrate this application into the Revit software, by means of a script in C#.
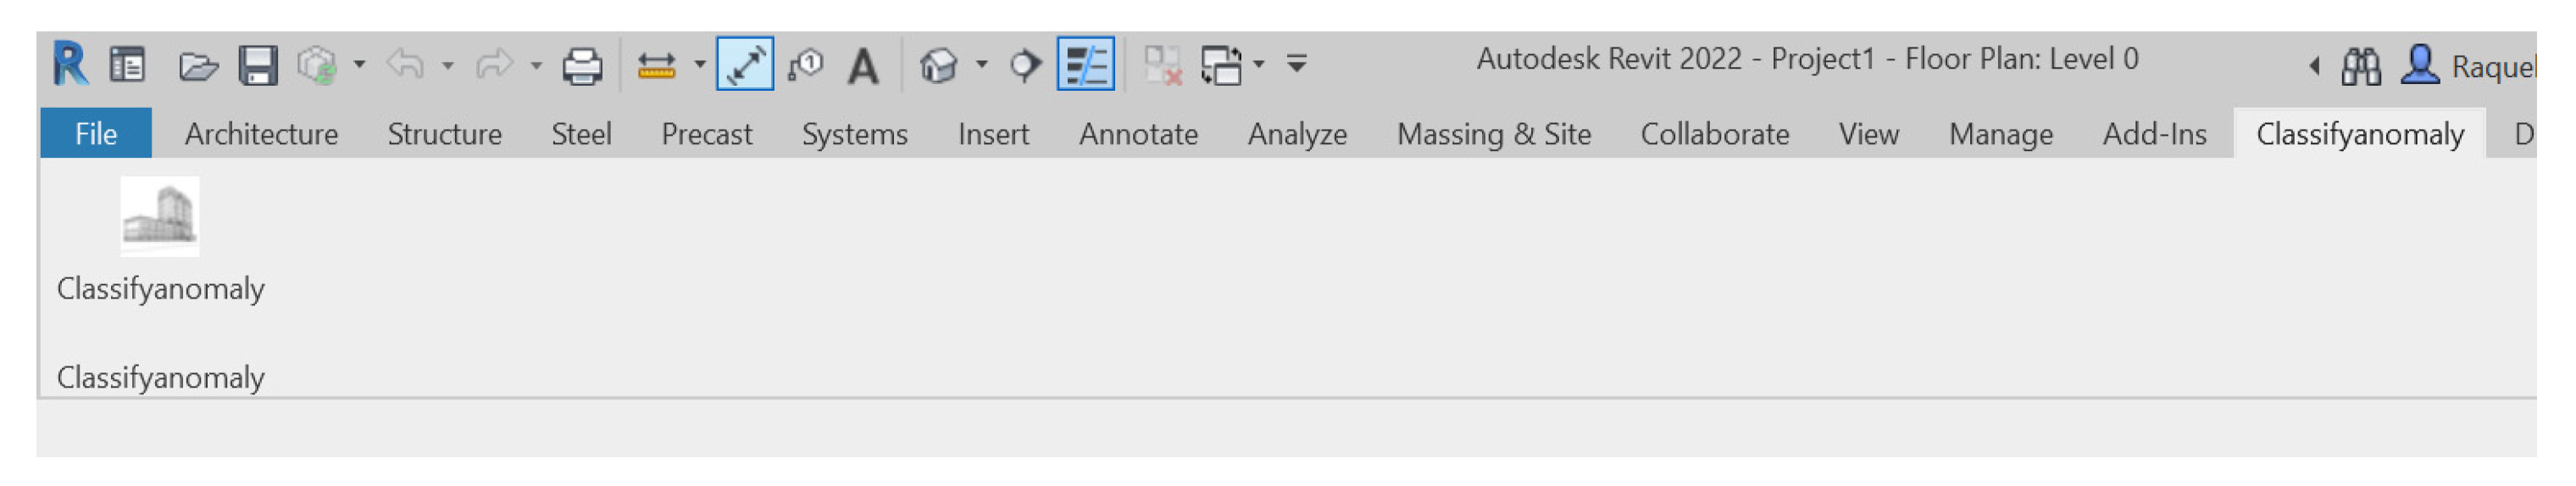
The DL model has the main objective of automatically detecting building anomalies. To be connected with Revit, this model was integrated into the software by means of the NET, the API provided by Autodesk Revit, which allows programming in C#. Besides this, the Software Development Toolkit (SDK) was installed for Autodesk Revit 2022 and provides extensive NET code samples and documentation to develop the Revit API.
The add-in in Ribbon was added, as well as the button “Classifyanomaly” (
Figure 6).
The app is available at
https://bit.ly/3sMavvd (accessed on 20 July 2022). This link is associated with the app and, when used, it will open a webpage by means of Binder, in which it is possible to upload images of building anomalies.
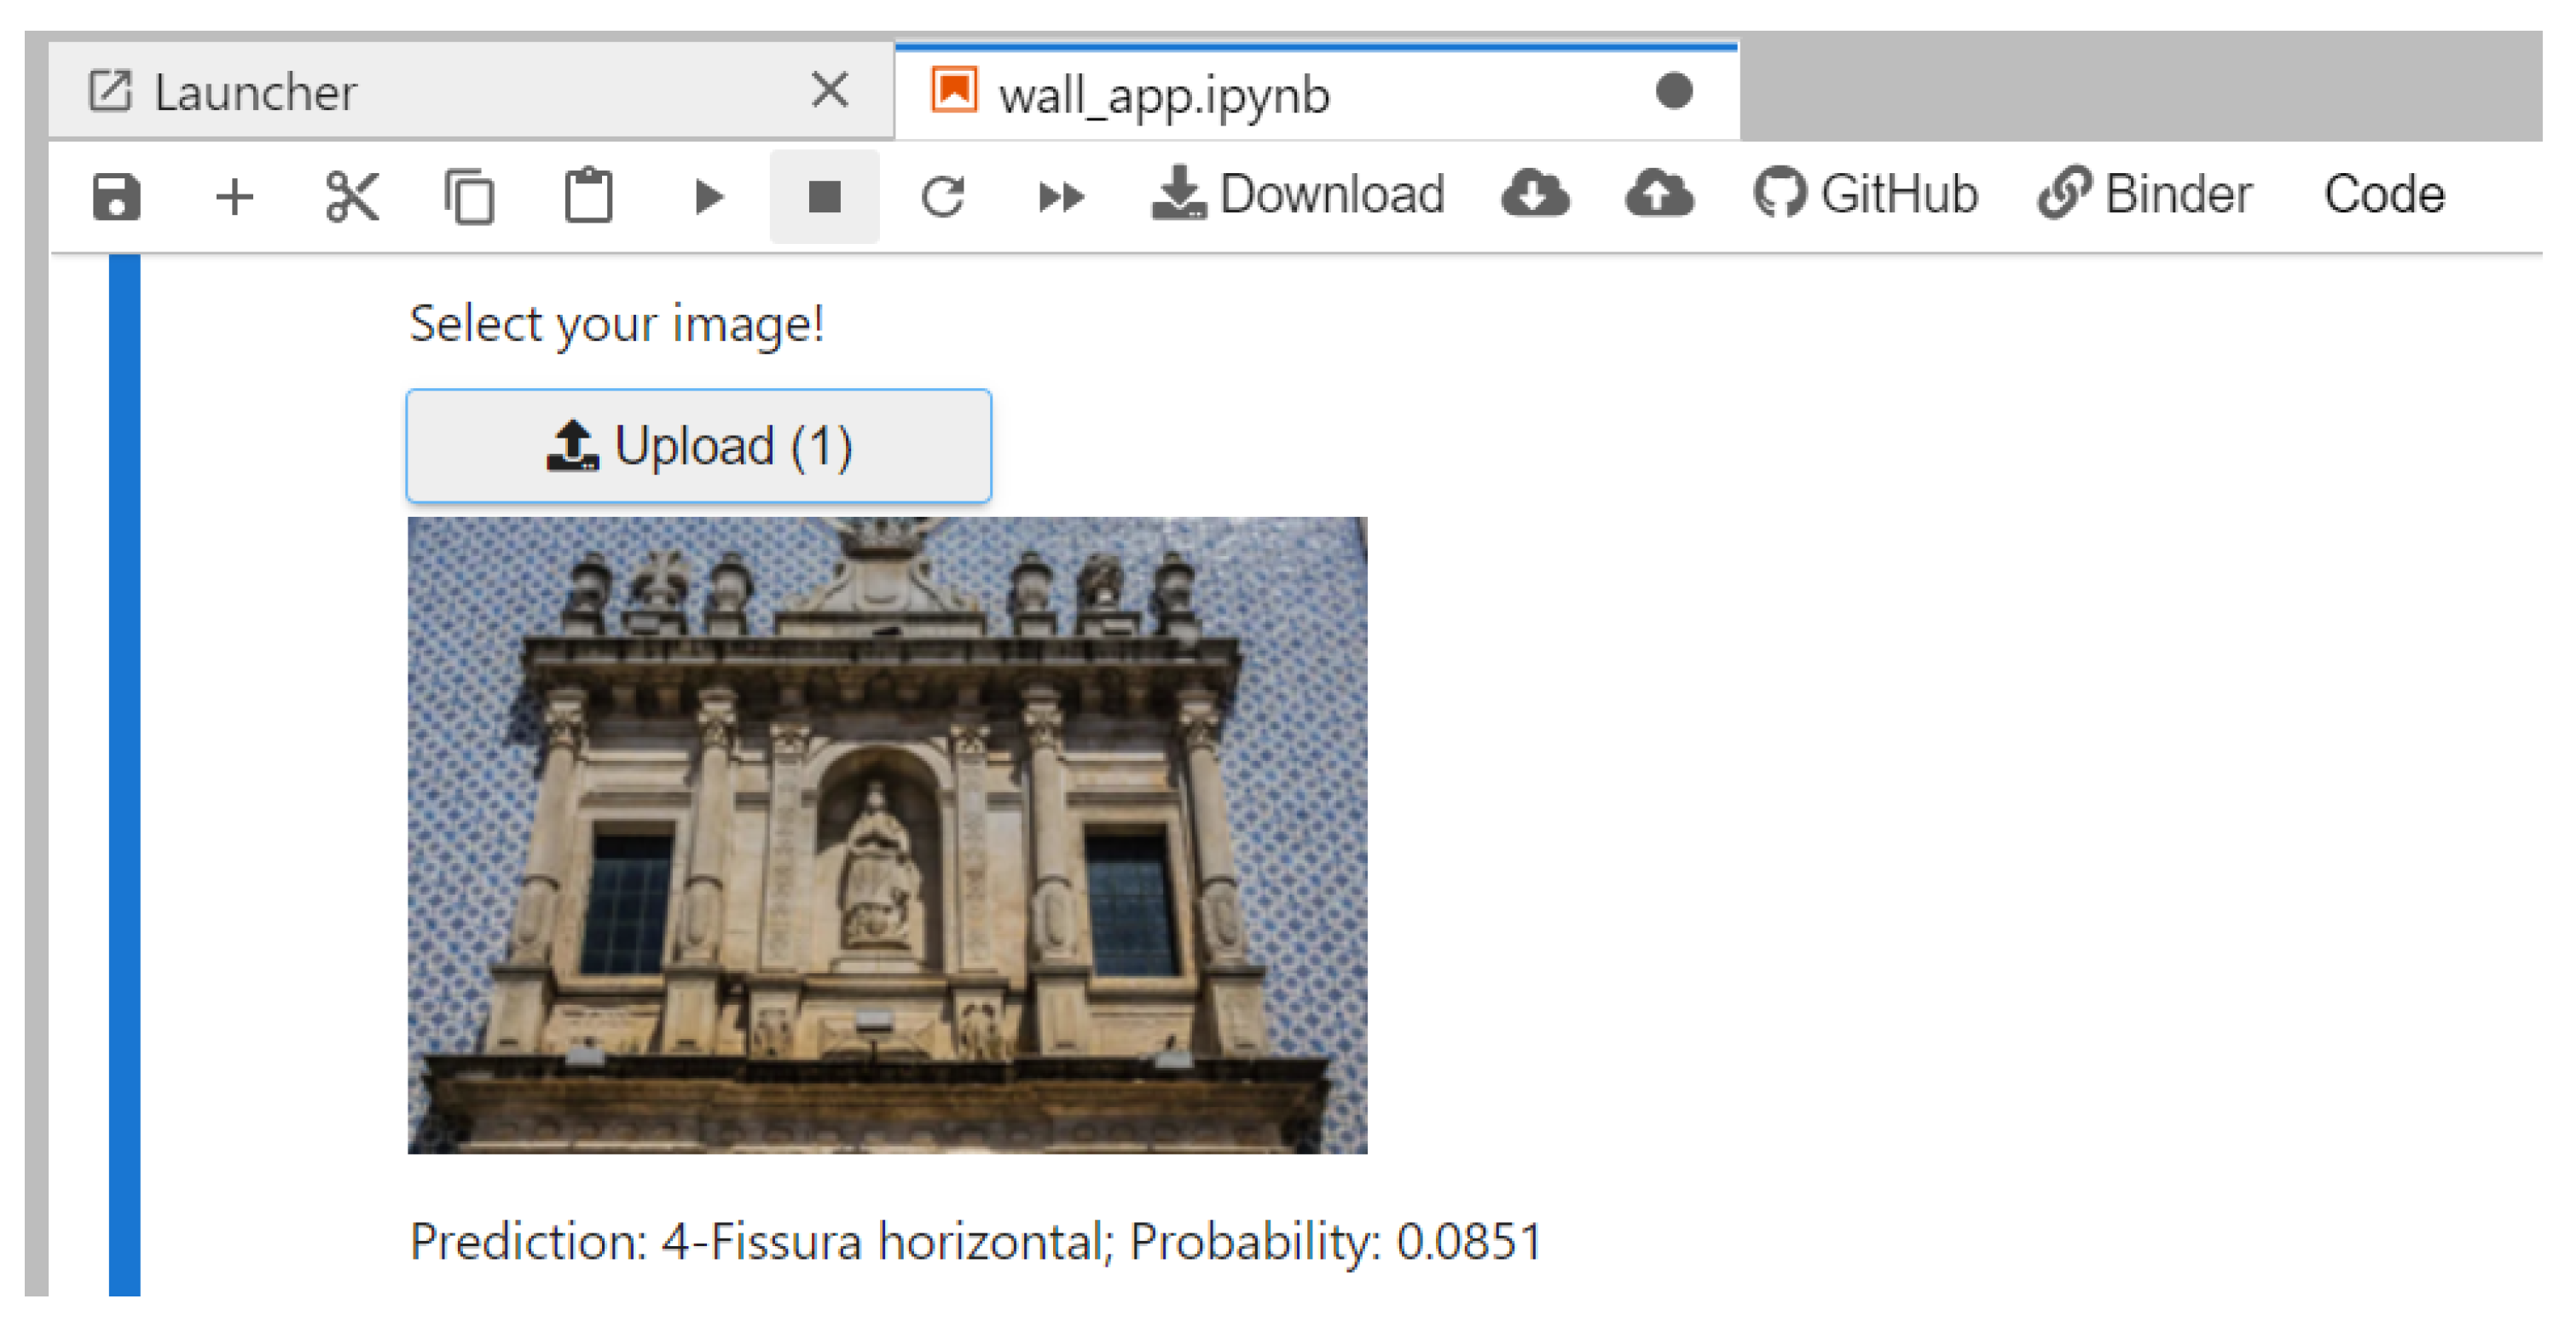
Figure 7 and
Figure 8 present the app for classifying images by means of Binder and examples of anomaly classification by means of the DL model.
Previously, the DL model learned how to classify the images by means of the dataset of images previously introduced. After the uploading of a new image to classify, the probability of this image belonging to the classification is given.
Figure 9 presents the classification of an anomaly for which the application generated an inappropriate classification.
Sometimes, the classification is not correct, as presented in
Figure 9. However, by increasing the dataset, it will be possible to increase the accuracy of the prediction model. Besides this, another application that is more user-friendly and direct is intended to be used, such as Heroku. This would give more visibility to the app and would make it possible to be used by all the stakeholders and users of the BIM methodology.
The image classified and the information about the anomaly can be integrated into the BIM model by means of shared parameters and object properties. This would be essential to contribute to the process of monitoring the building condition and to avoid data fragmentation. The BIM methodology, as a collaborative methodology, allows users to access this add-in and it can be used by all stakeholders in the project.
4.4. Database Design
Preventive maintenance and planned conservation involve the drafting of a plan, which, based on the assessment of the building’s health, provides a program of checks and actions to monitor and resolve any critical issues. Information on damage or problems that may arise, a control program to monitor their occurrence or development and actions to be taken can be entered for each element. Based on these data, the system allows the condition assessment of the element and restoration activities to be recorded over time, and future inspections and actions to be planned. The database has been developed based on the classes of the anomalies included in this work, and it will be presented in future works.
5. Results
During this work, a methodology was developed that included building digitalization techniques, 3D building modeling, a prediction model based on DL algorithms and an add-in development to integrate the prediction model into Revit.
It was realized that although laser scanning is an easy and fast technique to obtain the digital geometry of the building, in this case study, the variation of the scanners along the building height was not possible. For this reason, there were some gaps in the 3D point cloud obtained.
Regarding the DL prediction model developed, it was verified that the accuracy of the algorithm ranged between 50% and 75%. This means that the recognition of the building anomalies by introducing new images is possible and correct, but, in specific cases, the classification is not rigorous. Regardless of the data augmentation functions applied, the accuracy obtained is a result of the small dataset gathered and also possible overfitting. Besides this, most of the time, building anomalies do not appear isolated. In this study, individual and combined classes of anomalies were created for the training dataset. However, more combinations of anomalies must be set to avoid the overfitting phenomenon. As long as the dataset is fed with more images, better accuracy from the model is expected.
Then, an add-in was developed to integrate the prediction model into the Revit software. This step was performed by means of Binder to make it possible to provide an online app available for all users. Afterwards, a script in C# was developed, which provides a link from the Binder app to the Ribbon button of the Revit software. Despite being free, Binder apps present all the code when the app is open to upload the image, which is not user-friendly for those who are not familiar with programming. Thus, the usage of another application that is more user-friendly and direct is intended, such as Heroku, under the payment of a license. This would give more visibility to the app and would make it possible to be used by all the stakeholders and users of the BIM methodology. The case study presented in the current work made it possible to validate the linkage between DL prediction models and the BIM environment, which contributes to a more efficient process of anomaly detection in Revit software.
Building digitalization has been seen as a solution to deal with the increasing complexity and amount of data in AECO and their consequent management. This, along with computer vision techniques and the BIM methodology, facilitates the decision-making during the building life cycle and helps in the implementation of the most adequate FM/AM strategies to optimize interventions of maintenance, rehabilitation and restoration.
6. Conclusions
This work aimed to provide an automated tool to recognize and classify building anomalies inside the BIM environment. In this case, BIM would be a container of all information related to images and object degradation and a promoter of collaboration between stakeholders and managers. It also allows for automated anomaly assessment, as well as updating the information in real time in the BIM model, avoiding loss of information and supporting the decision-making for asset management. The case study showed the linkage between the models, which was an important step to present a Revit software tool with complete features using deep learning.
The study presented provides a significant contribution to historical building management, since the automated recognition and classification of building anomalies will allow the prediction of the degradation of the assets, and not only record historical information but also interpolate a classification and prediction model with the BIM methodology.
In addition, as future works, to improve the integrated management in building conservation, the research also aims to develop a database of maintenance actions, correlated with the anomalies’ identification and characterization. The main purpose of this database is to encourage and support the AECO sector stakeholders, including archaeologists, conservators and restorers, to adopt effective preventive and predictive maintenance in the field of cultural heritage.


 ,
, 


