Article

Multi-Mode Compact Microscopy for High-Contrast and High-Resolution Imaging

Intelligent Optical Module Research Center, Korea Photonics Technology Institute (KOPTI), 9, Cheomdan Venture-ro 108beon-gil, Buk-gu, Gwangju 61007, Korea
*
Author to whom correspondence should be addressed.
Appl. Sci. 2022, 12(15), 7399; https://doi.org/10.3390/app12157399
Submission received: 1 July 2022 / Revised: 15 July 2022 / Accepted: 19 July 2022 / Published: 23 July 2022

Abstract

:
We report a multi-mode compact microscope (MCM) for high-contrast and high-resolution imaging. The MCM consists of two LED illuminations, a magnification lens, a lift stage, and a housing with image processing and LED control boards. The MCM allows multi-modal imaging, including reflection, transmission, and higher magnification modes. The dual illuminations also provide high-contrast imaging of various targets such as biological samples and microcircuits. The high dynamic range (HDR) imaging reconstruction of MCM increases the dynamic range of the acquired images by 1.36 times. The microlens array (MLA)-assisted MCM also improves image resolution through the magnified virtual image of MLA. The MLA-assisted MCM successfully provides a clear, magnified image by integrating a pinhole mask to prevent image overlap without additional alignment. The magnification of MLA-assisted MCM was increased by 3.92 times compared with that of MCM, and the higher magnification mode demonstrates the image resolution of 2.46 μm. The compact portable microscope can provide a new platform for defect inspection or disease detection on site.

1. Introduction

Low-cost and miniaturized microscopes provide various functional roles in applications ranging from disease diagnostic [1,2,3], food monitoring [4,5], and biological research [6,7]. Portable microscopic imaging systems are also useful for point-of-care testing (POCT) or remote health care systems [8,9]. Recently, low-cost, compact microscopes that are capable of not only COVID-19 screening but also live cell imaging have been introduced [6,10]. However, miniaturized microscopes often have obstacles regarding imaging performance, such as low-image-contrast and low-spatial-resolution due to the limitations of optical power [11]. To address these limitations, a microscope with functional illuminations and image processing techniques has been introduced to acquire high-contrast and high-resolution images [12,13]. Illuminations, such as LED arrays and smartphone displays, allow for the acquisition of various contrast images, and these images are improved with image reconstruction [14,15]. Moreover, a laser diode is used in fluorescence imaging applications, which additionally require a filter to distinguish between emission light and noise [16].
The miniaturized microscope exhibits various imaging applications imaging such as fluorescence [16,17,18], dark-field [19,20], and phase-contrast imaging [21,22]. The portable microscopic systems are mostly equipped with an additional lens and light-emitting diode (LED) illumination on a smartphone or a compact camera to implement functional magnified imaging. The smartphone-based microscopes have compact and portable, whereas the systems often lack a lift stage for fixing and focusing a sample. Such portable microscopes can be classified into a transmission type and a reflection type microscope according to image acquisition methods. Transmission-type optical microscopy can detect a microstructure through the light on the back of a sample [23,24,25], but this approach can only observe transparent samples such as sectioned biological specimens. Reflection optical microscopy can capture a microscopic image by using reflected light from a sample [11,26]. However, the reflected light microscopy acquired low-contrast images when observing a transparent sample due to low reflection signals.
Solid immersion lens (SIL) microscopy is a technique to increase spatial resolution by placing a high-refractive-index hemisphere or microsphere on a target object [27,28]. The SIL technique offers a high numerical aperture (NA), high magnification, and high resolution by efficiently collecting light [29,30]. However, the SIL requires highly precise alignment between the target and solid material, such as a microsphere, to observe desired locations. A precision stage is mainly used for positioning the solid material; thus, the whole system becomes bulky.
Here we report a multi-mode compact microscope (MCM) for high-contrast and high-resolution imaging, as shown in Figure 1a,b. The MCM features ring-type lighting on the top surface, an imaging module, a compact lift stage, and bottom LED illumination. The image-capturing module consists of an objective lens and image sensor (Sony 8MP IMX 219 sensor, pixel size: 1.12 μm × 1.12 μm, 30 fps). As shown in Figure 1c, a compact microscope housing mounts all components, including a processor board (Raspberry Pi 4 Model B) for image processing and a customized circuit board for illumination control. The total cost to configure the MCM is about USD 300, and this cost is reasonable compared to other low-cost microscopes that require a smartphone. The focused image can be adjusted by positioning a sample location with the lift stage. The LED illumination controls allow assorted microscopic imaging, and high dynamic range (HDR) reconstruction offer high-contrast images. The processed images are transmitted to an external monitor. The resolution and magnification of the MCM were increased through a virtual magnified image of a microlens array (MLA). The object is magnified through a single virtual image captured by two lenses in reflection and transmission modes, whereas the MLA generates an additional virtual image and enlarges the image in a higher magnification mode, as shown in Figure 1d,e.

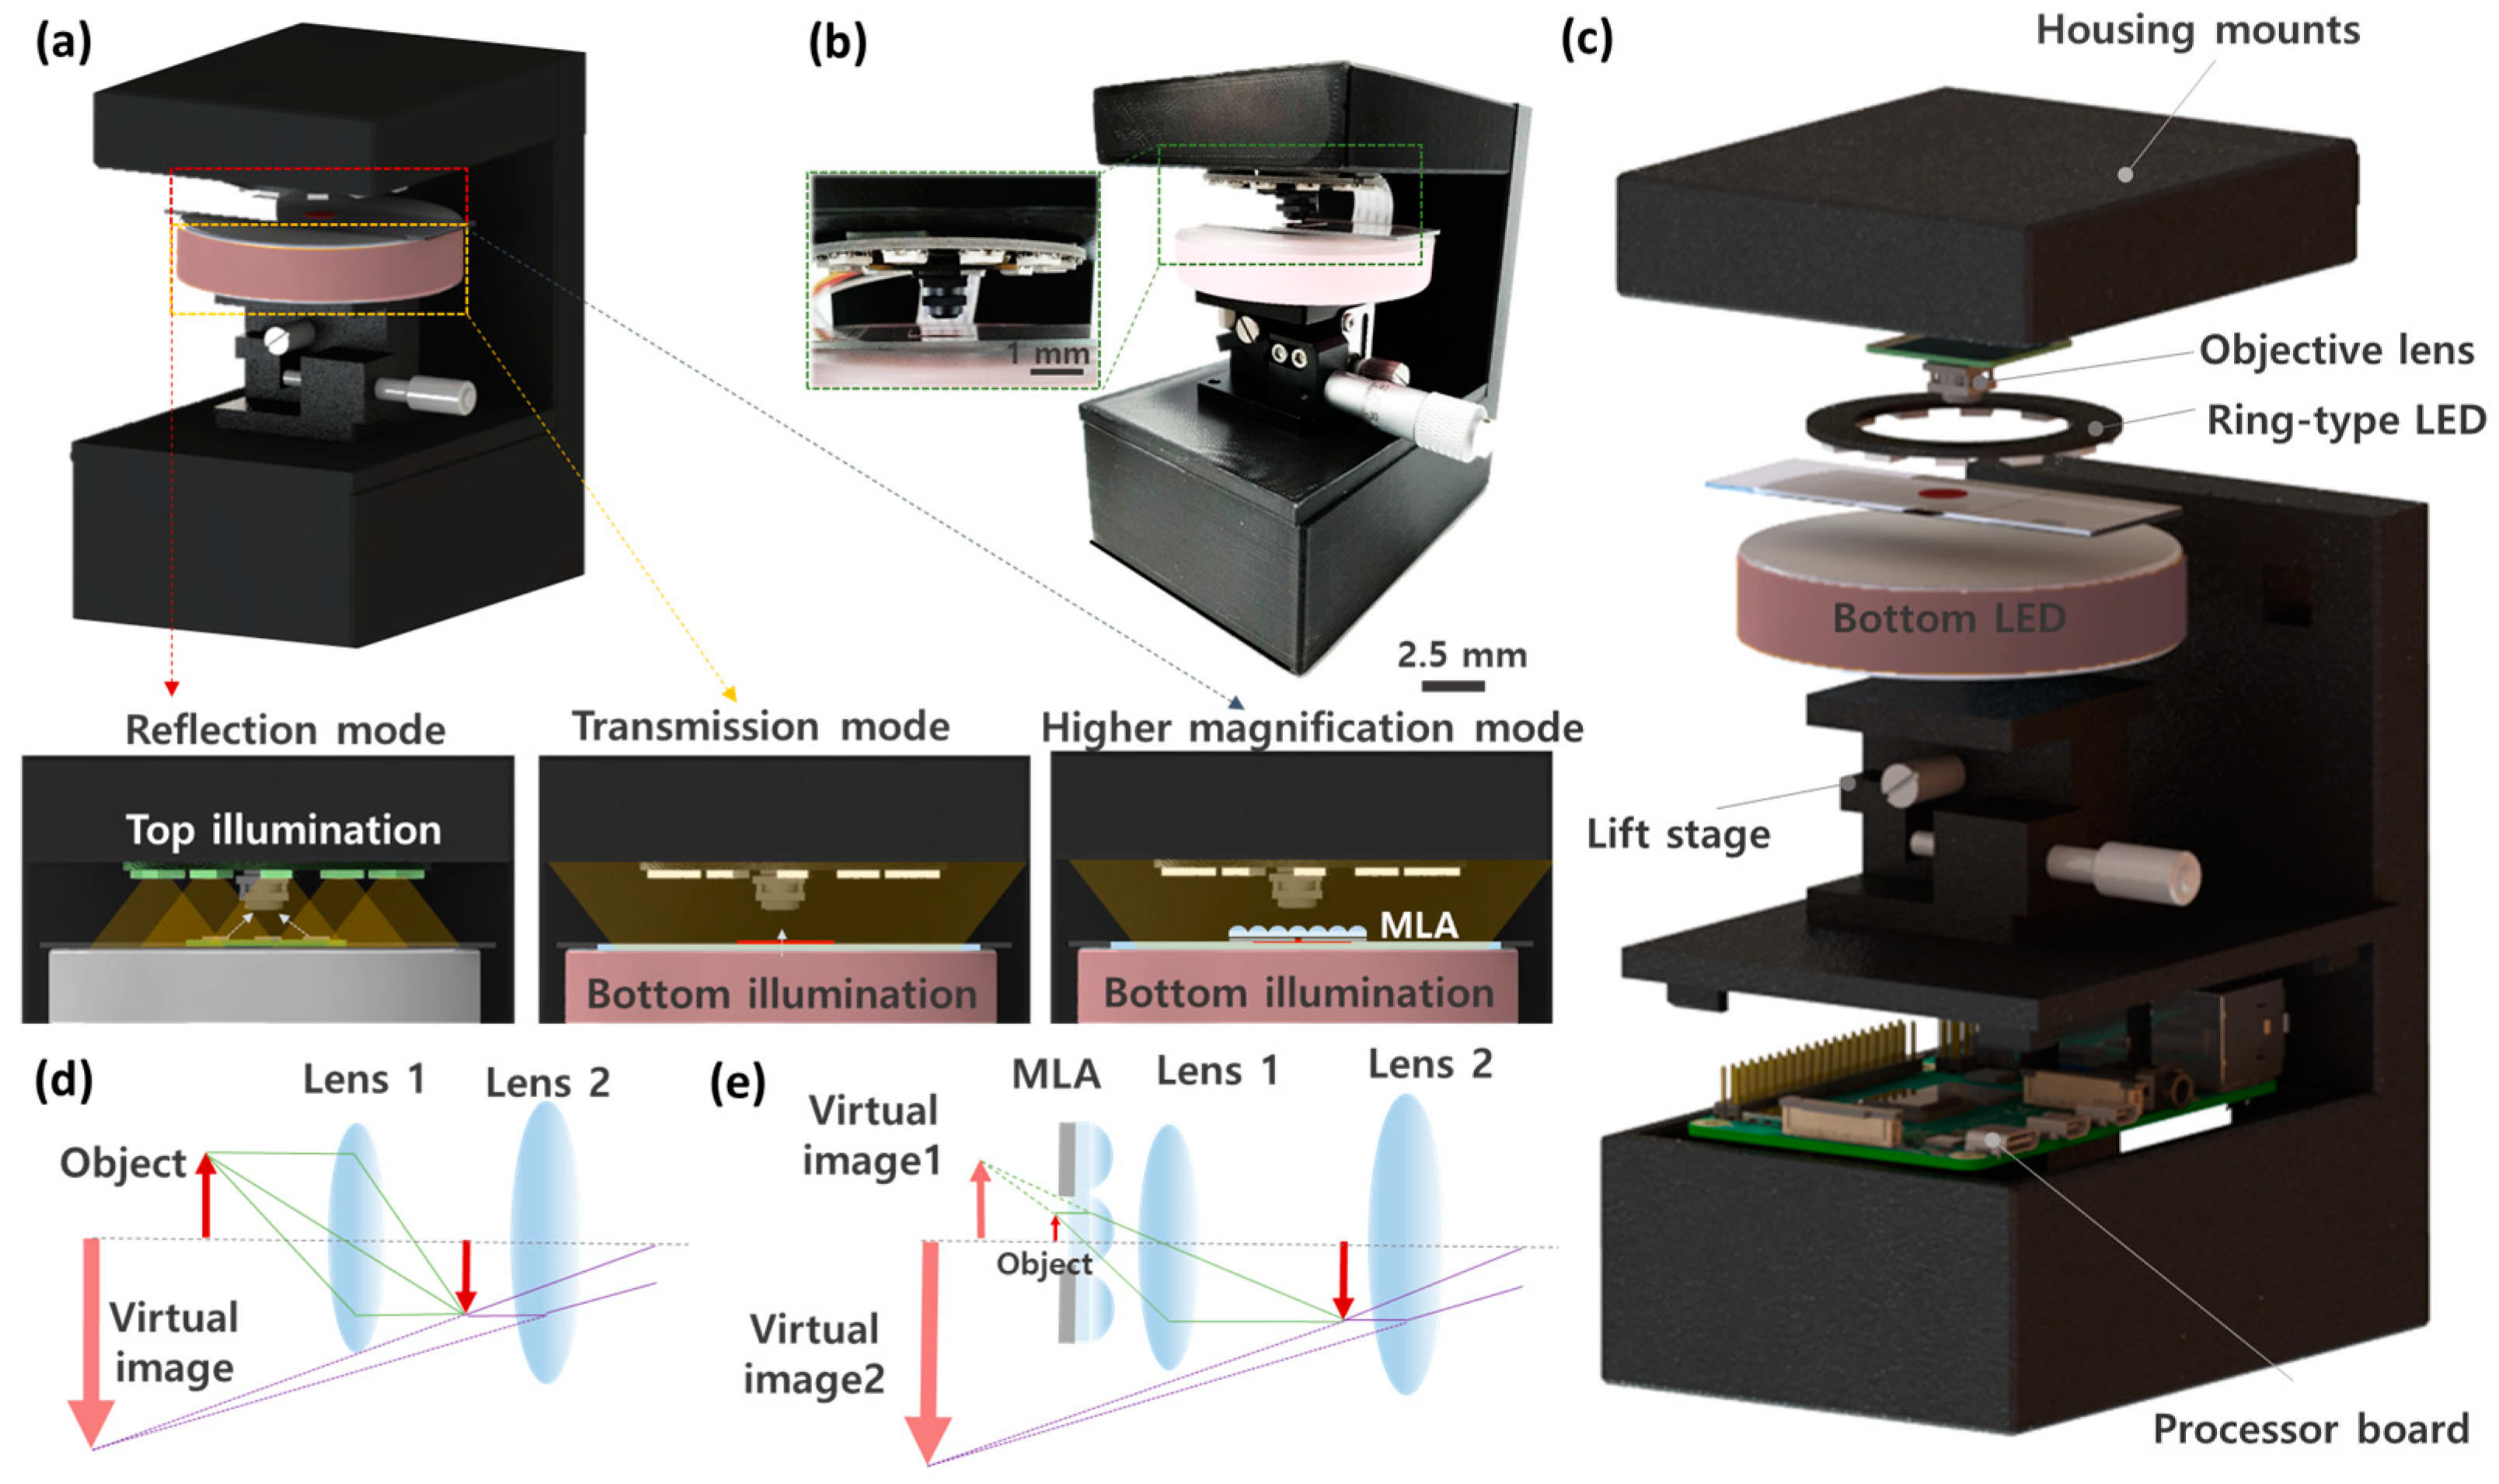
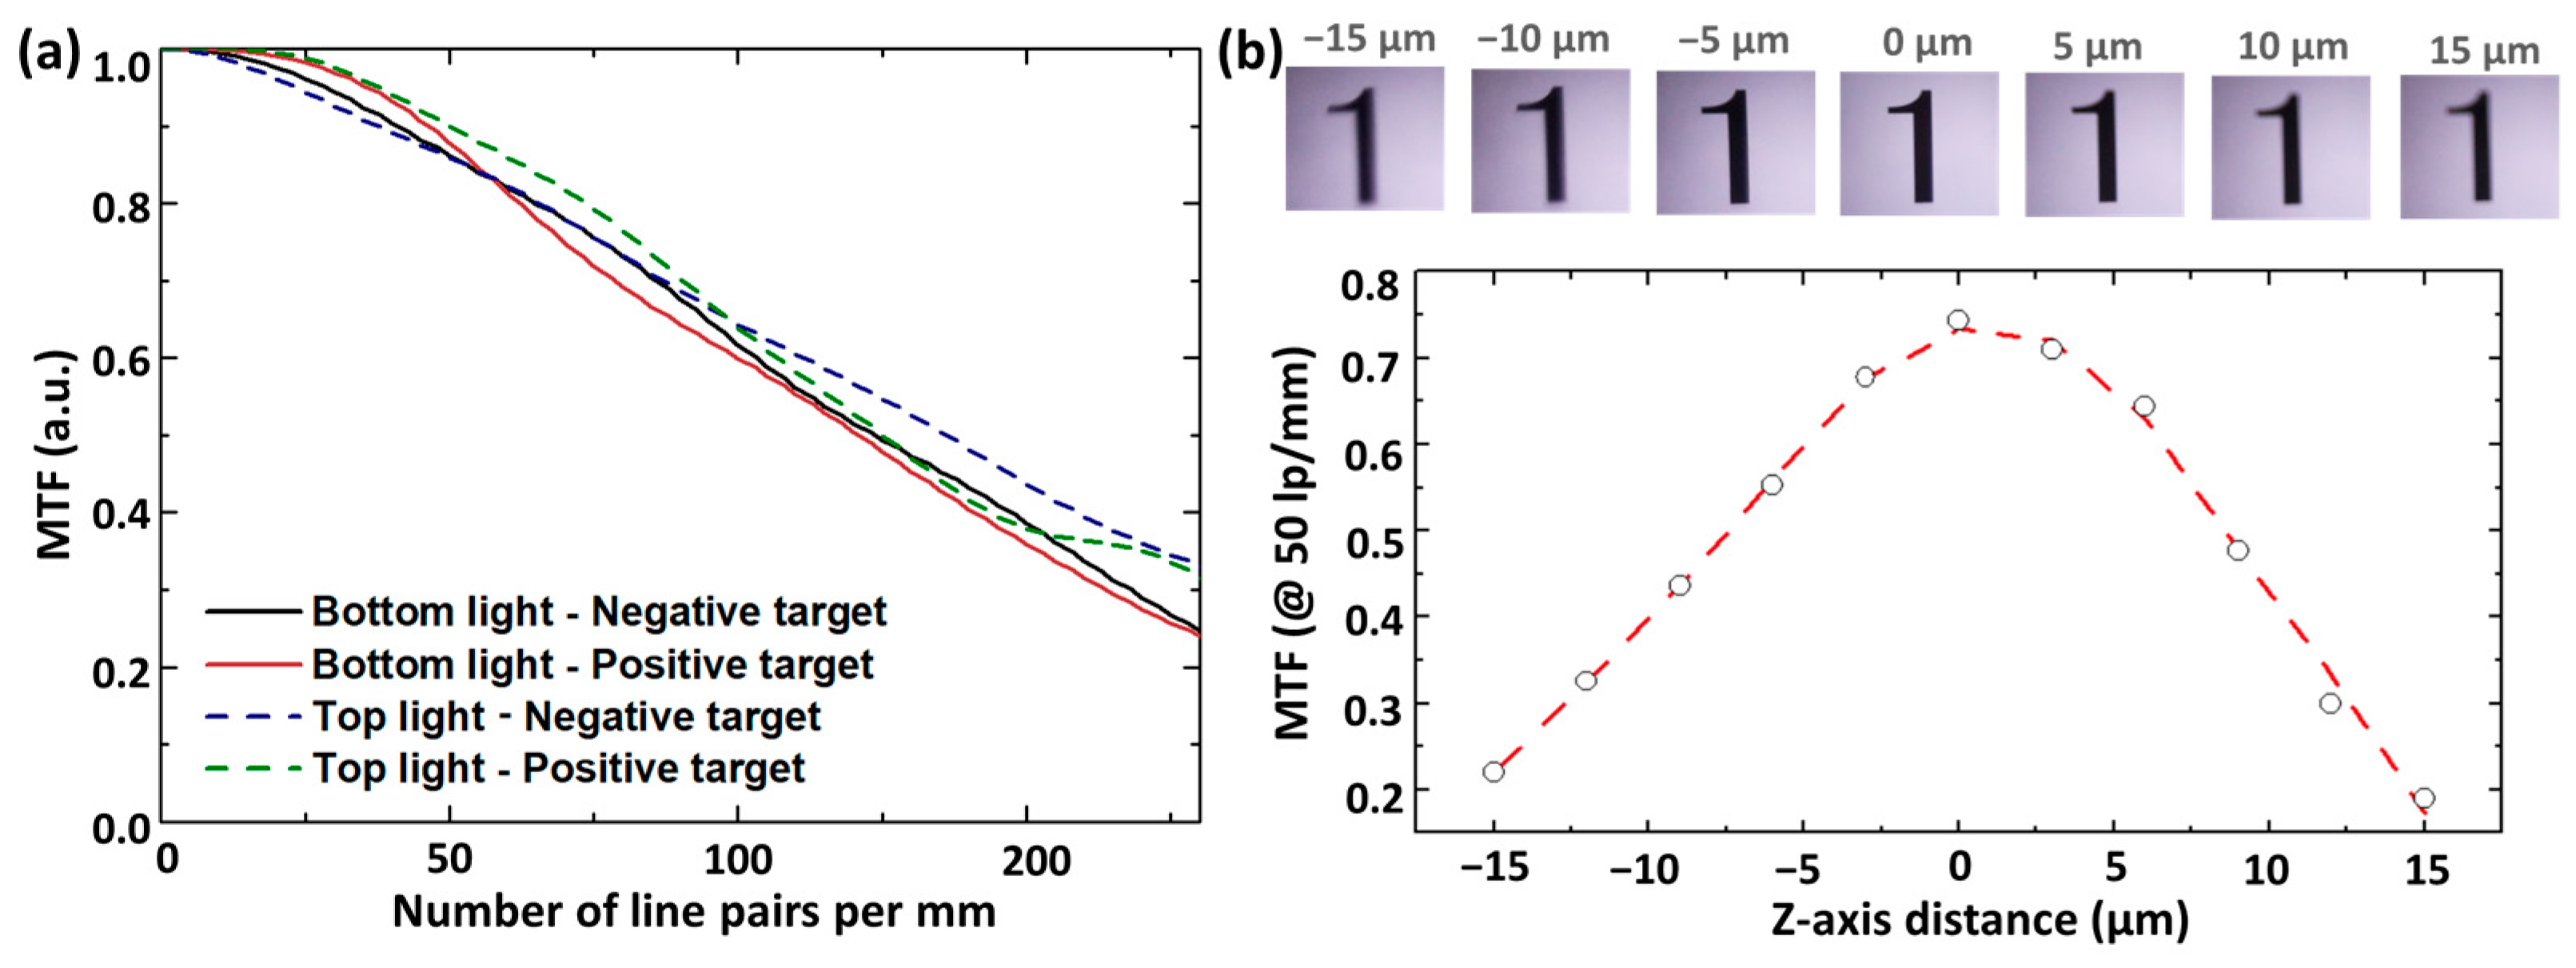
2. Optical Characterization of MCM

The imaging performance of MCM was analyzed by using a USAF 1951 resolution test target. The USAF 1951 resolution test (MIL-STD-150A) is a standardized method for verifying microscopic resolution [31,32]. Figure 2a,b exhibit the captured negative and positive USAF 1951 targets through the bottom illumination. The MCM shows an imaging area of 6090 μm × 5950 μm and a magnification of 2.15×. In order to clearly observe detailed patterns in the center area of the USAF 1951 target, the captured images were magnified through digital zoom. As a result of analyzing the intensity profiles of the target patterns in the magnified images, the MCM clearly observes group 7 element 1, which means that the resolving power of MCM achieves 3.91 μm, as shown in Figure 2c,d.
The modulation transfer function (MTF) of the captured images was analyzed in a transmission and reflection light microscopy mode through the slanted-edge method (ISO 12233) for detailed comparisons, as shown in Figure 3a. The slanted-edge method offers MTF values corresponding to the spatial frequency by analyzing the pixels in a user-defined region of an image [33]. The experimental results show that the spatial frequency corresponding to MTF 50 of the reflection light mode using the top light exhibits 135 lp/mm in the negative target, which is a slightly higher value compared to the transmission light mode of 123 lp/mm. As shown in Figure 3b, the MTF values were also analyzed by using the analysis method of thru-focus MTF according to the target distances to observe the imaging depth of field. The images were captured by changing the position of the object through the z-axis stage, and the MTF was calculated at the spatial frequency of 50 lp/mm. As a result, the images captured at distances of about ±15 μm show the MTF above 0.2. This means that the depth of field of the MCM objective lens is 30 μm.

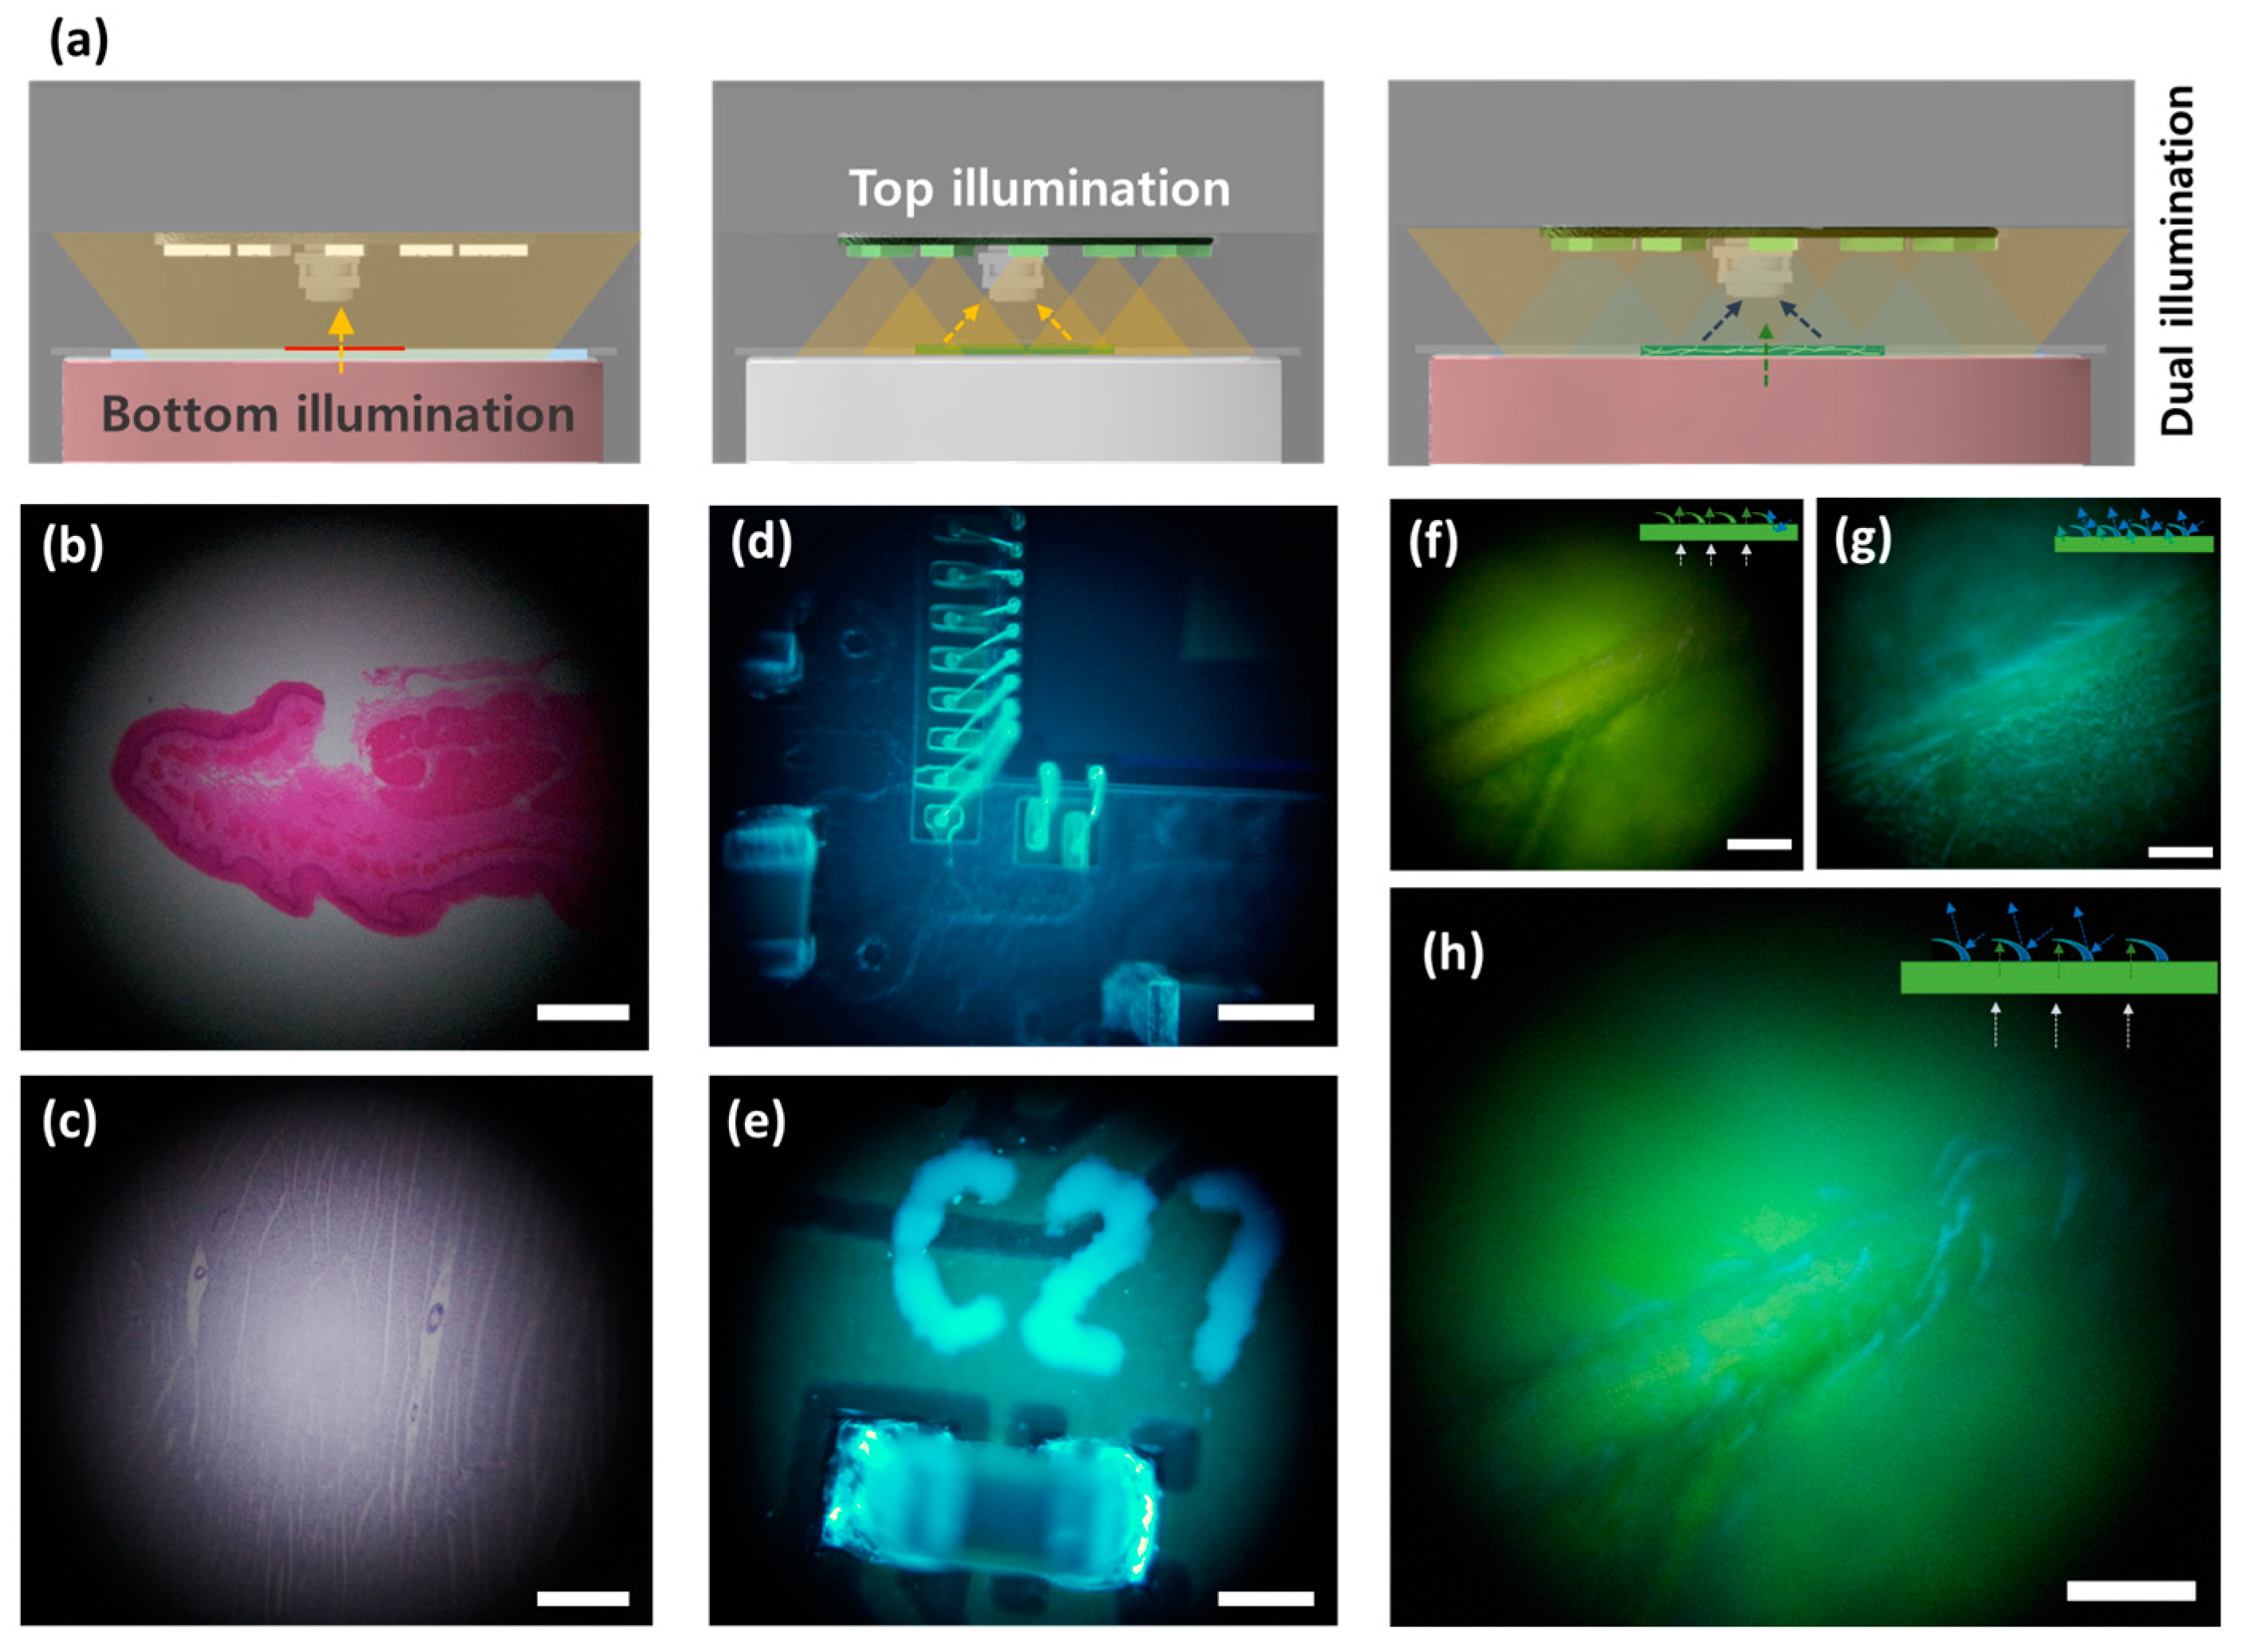
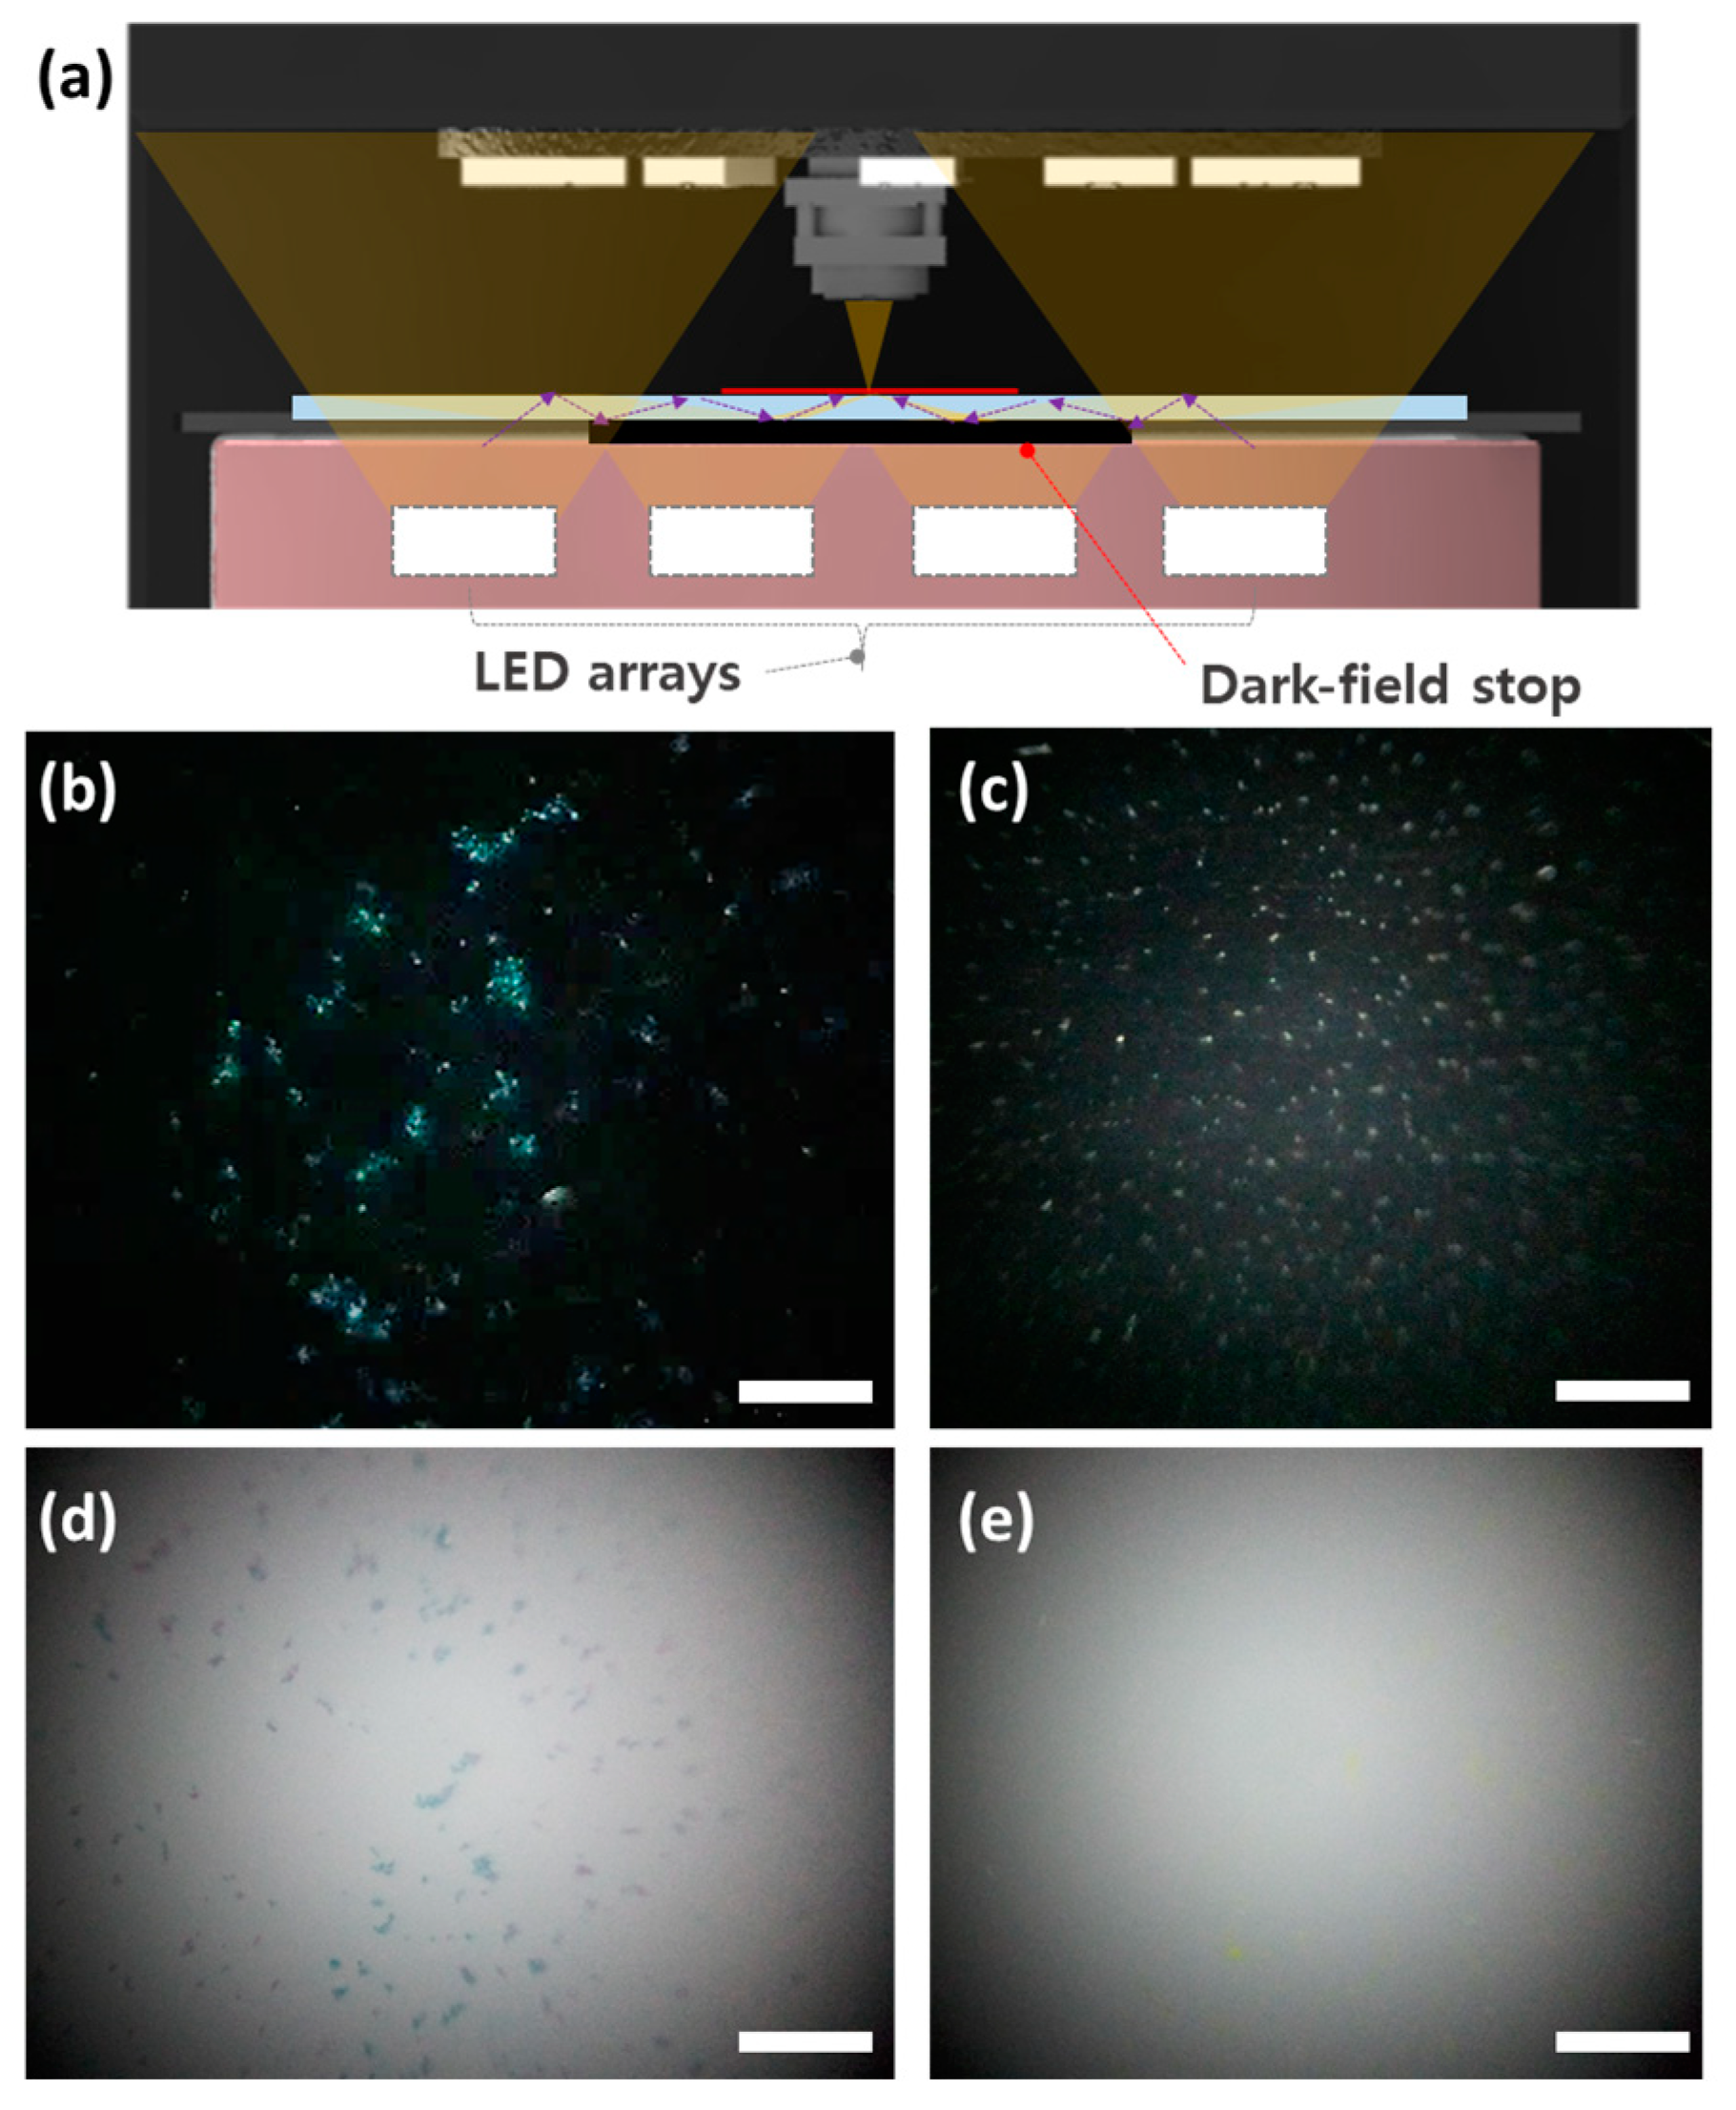
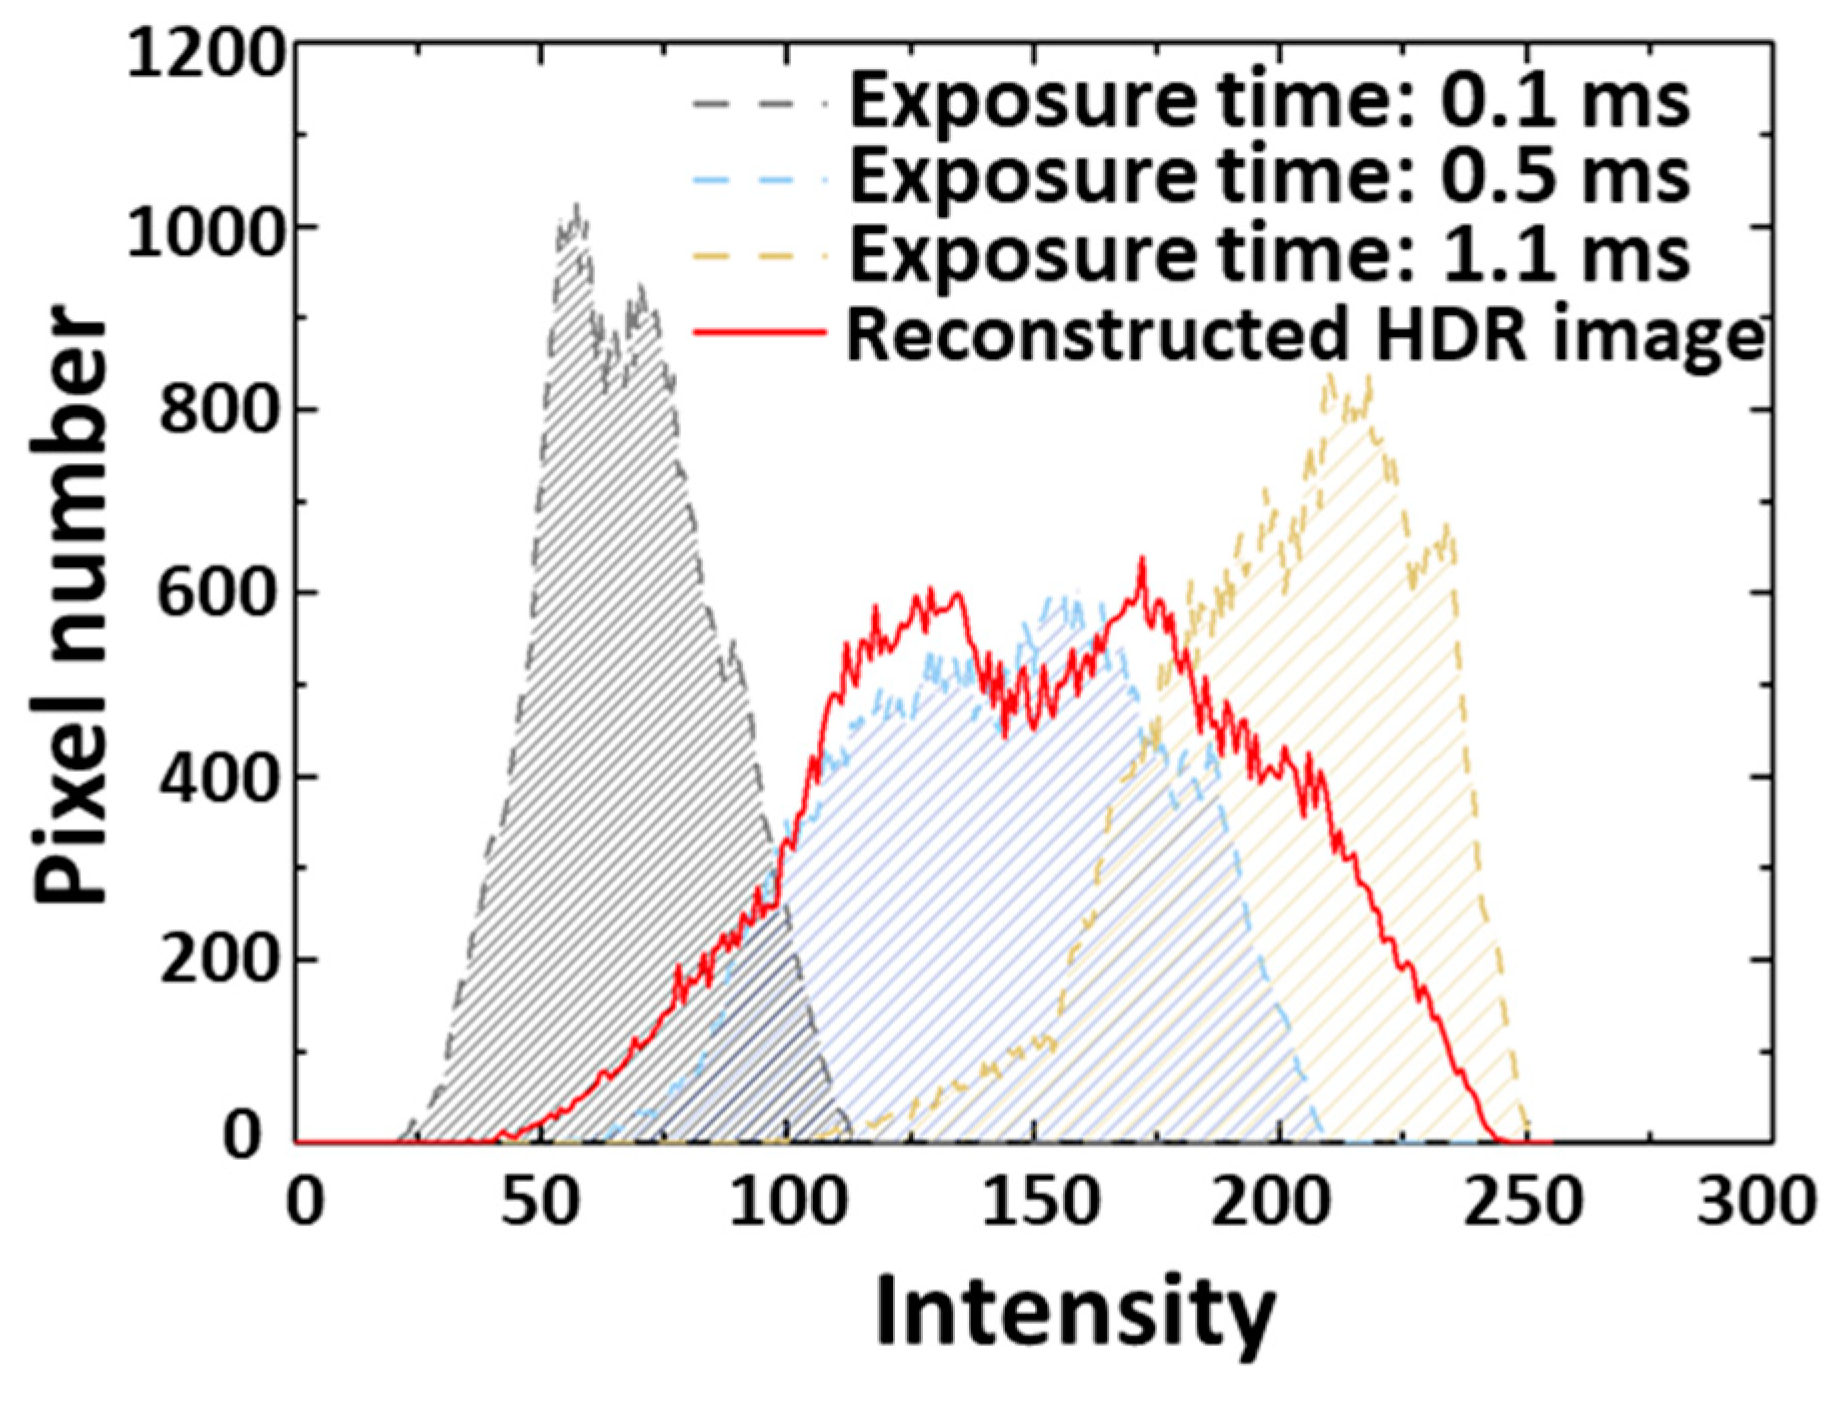
3. Multi-Illumination for High-Contrast Imaging

Various targets were captured in different lighting environments for multi-illumination imaging, as shown in Figure 4a. Figure 4b,c show stratified squamous epithelium and cardiac muscle cells from mice captured in the transmission light mode. The transmission optical microscopy mode using the top illumination can be used for biomedical research and disease diagnosis because this mode is effective for observing transparent specimens. Figure 4d exhibits gold wires bonded on an image sensor chip, and Figure 4e shows an SMD capacitor mounted on a printed circuit board (PCB). The reflection light microscopy mode can efficiently observe the defects of soldering interconnection on circuit boards in resource-limited areas. A dual illumination mode that simultaneously implements the bottom and top illuminations was compared with a bottom single illumination mode. The experimental results show that the single illumination modes offer low-contrast images that are difficult-to-distinguish leaf hairs, as shown in Figure 4f,g. On the other hand, the dual illumination mode clearly observes leaf hairs due to the additional reflection lights of the top illumination with a different color, as shown in Figure 4h. These results indicate that the dual illumination mode provides high-contrast imaging in complex 3D structures.
Dark-field microscopy was demonstrated by using the MCM with a dark-field stop on the bottom illumination, as shown in Figure 5a. The central light that directly illuminates a sample is blocked by a dark-field stop, and the outer light is reflected by the slide and transmitted to the sample. The reflected light is scattered on the sample, and the objective lens collects the scattered light. Figure 5b,c show the dark-field microscopic images of yeast and sugar captured through the dark-field compact microscope. The background appears black because scattered light only is exhibited in the sample, excluding the background. The dark-field microscopic images offer higher contrast compared to the bright-field images by reducing background noise, as shown in Figure 5d,e.
High dynamic range (HDR) imaging was performed by using various contrast images acquired by different exposure times, as shown in Figure 6a [34]. The reconstruction of image arrays assists in increasing the image contrast [35,36,37]. For the HDR reconstruction, the captured images were aligned by matching the edge of the images. The aligned images were merged by computing a weighted average of each pixel. The weight of intensity was decided by the contrast, saturation, and well-exposedness of images. The HDR image algorithm comprises the signal representation of a Laplacian decomposition and Gaussian pyramid. As shown in Figure 6b, six images with different contrasts were captured by increasing the exposure times from 0.1 ms to 1.1 ms. Then, the captured images were integrated into a single HDR image through the HDR image processing algorithm shown in Figure 6c. As shown in Figure 7, the reconstruction algorithm offers a clear, high-contrast image, and the images were analyzed through histograms to quantitatively compare contrast variation. As a result, the histogram area of the reconstructed image is increased by more than 1.36 times that of a single-exposure image. This result indicates that the reconstructed HDR image shows a high dynamic range and contains more brightness data volume compared with the image before reconstruction.

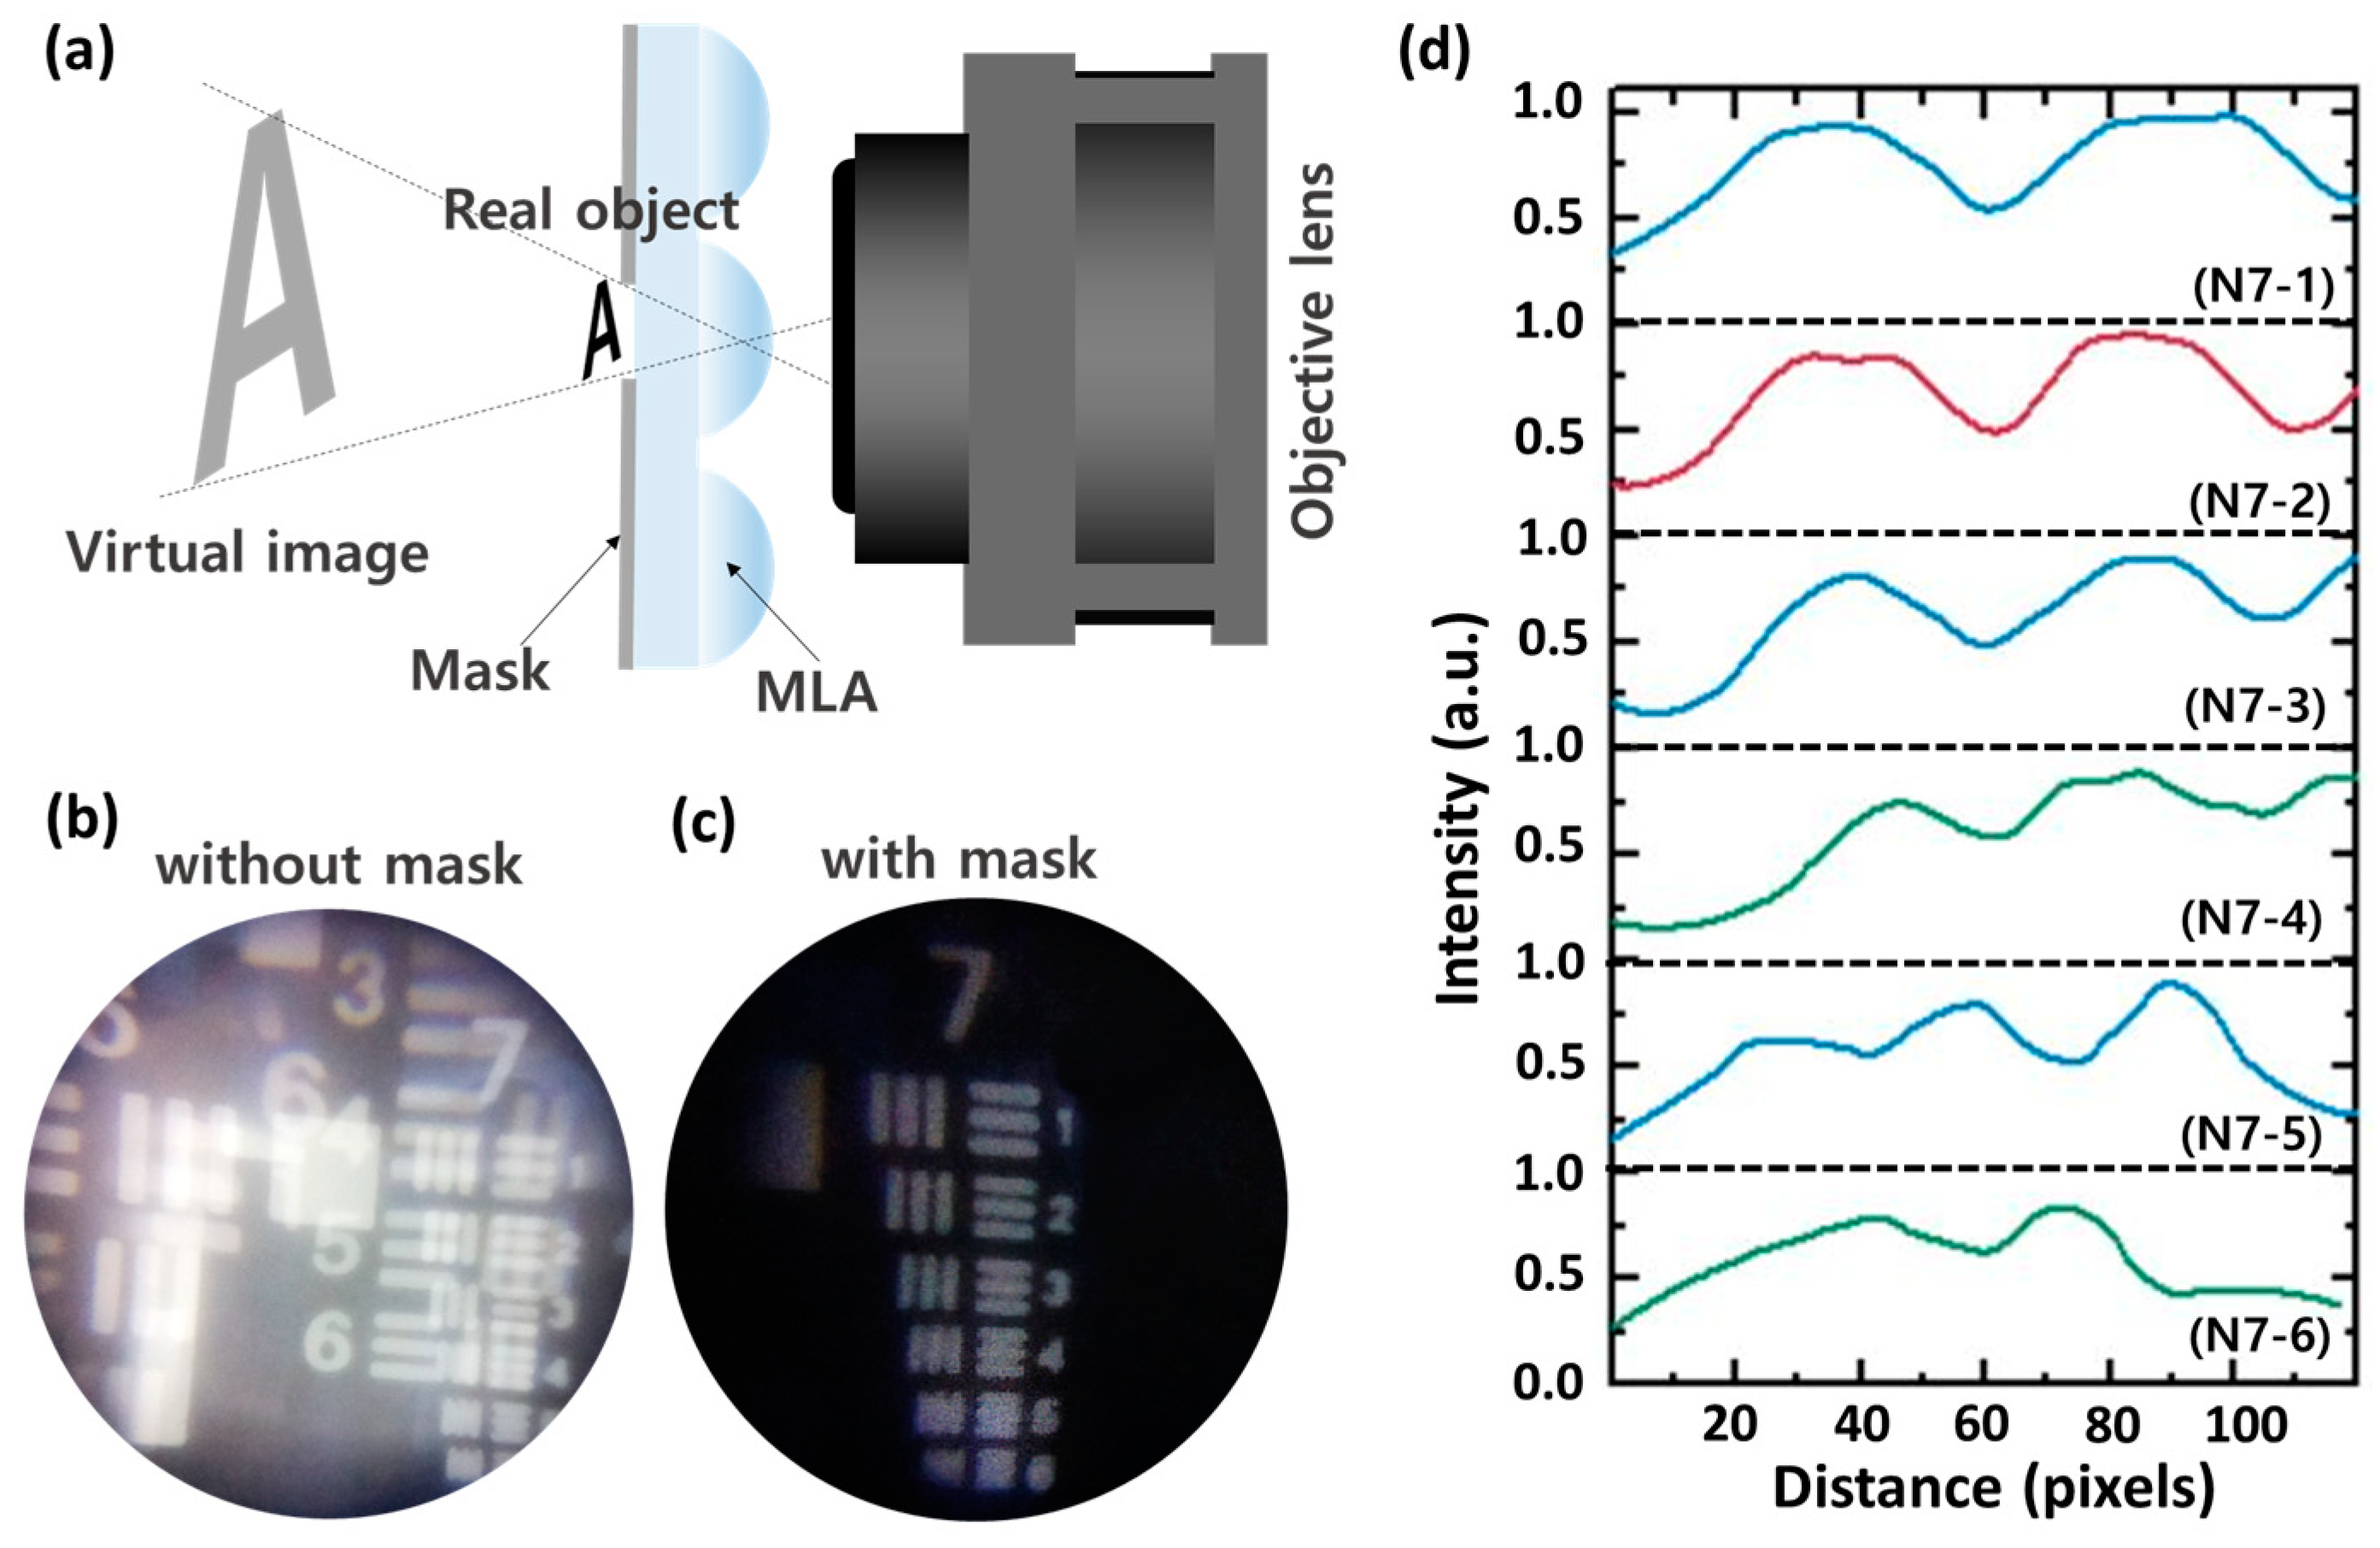
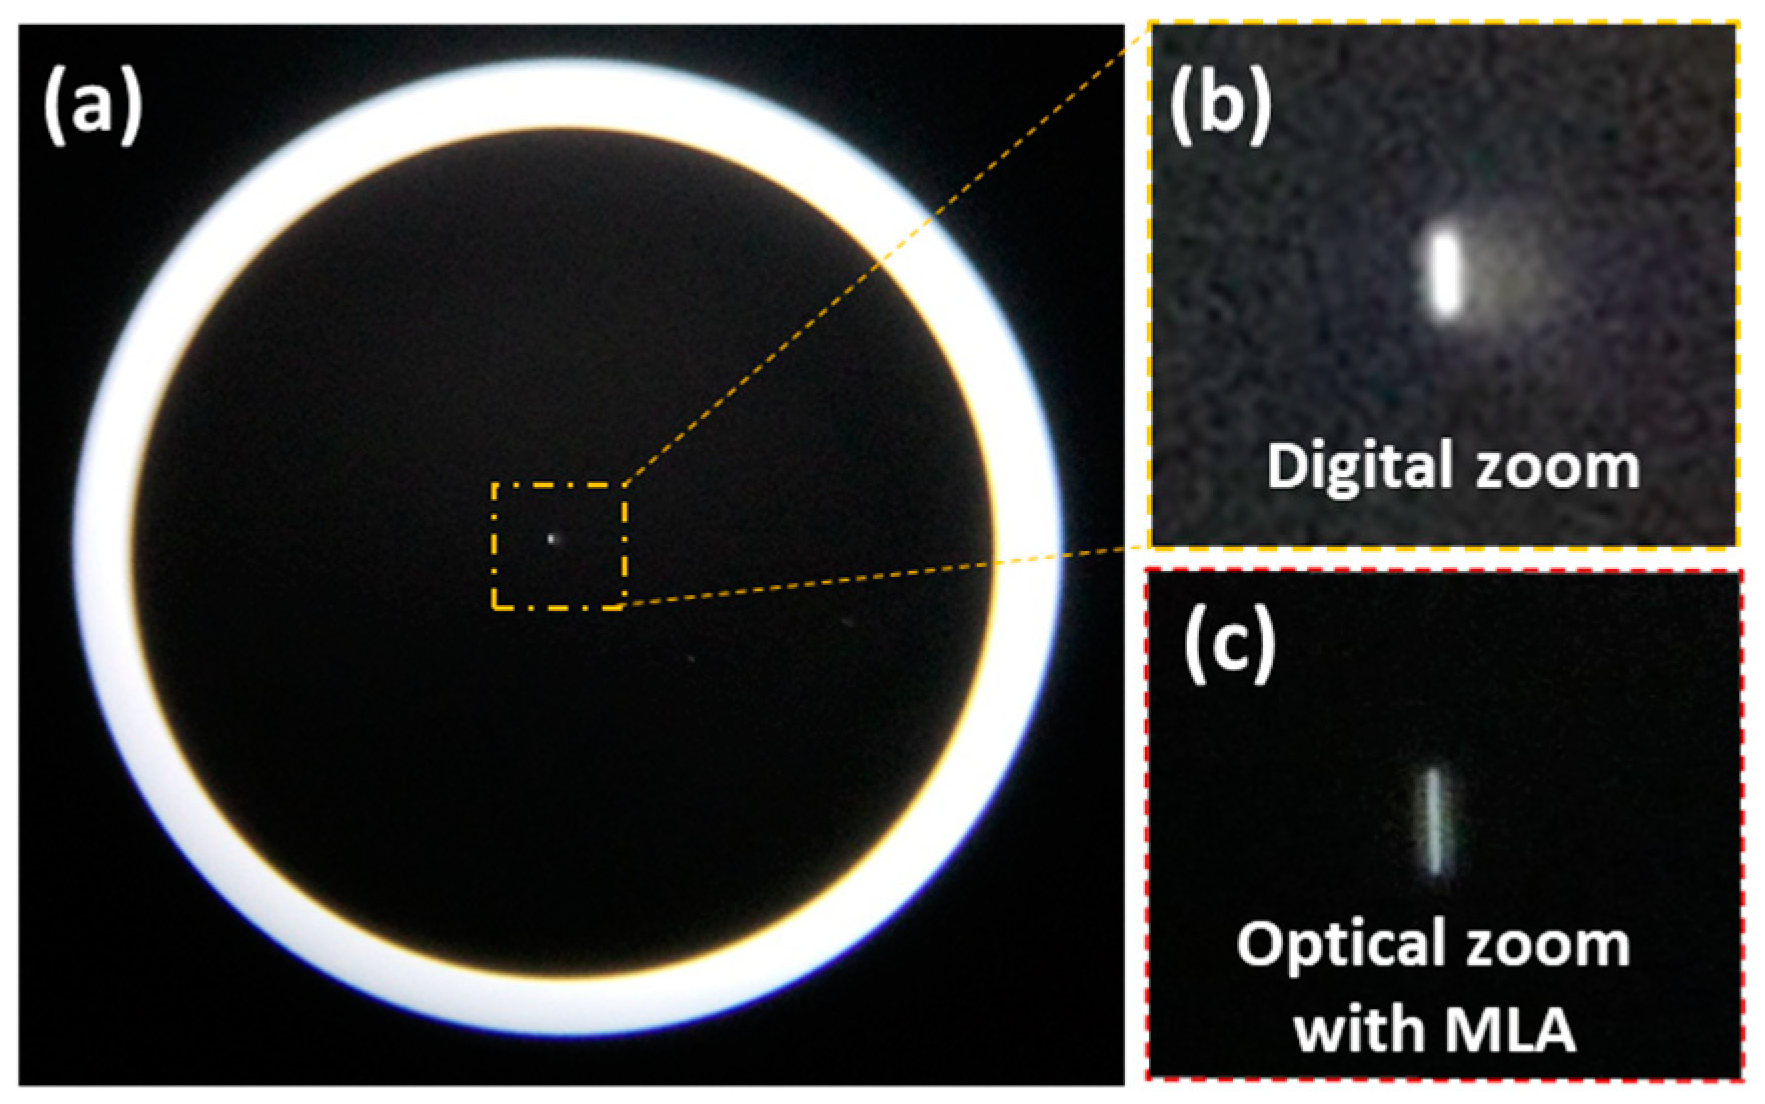
4. MLA-Assisted Higher Magnification Imaging

Previously, solid immersion lens (SIL) microscopy usually used single microlens to enhance the magnification [38,39]. However, SIL microscopy has a limitation in the difficulty of aligning between an objective lens and microlens. The MLA-assisted MCM can provide numerous observation regions through pinhole arrays, which facilitate aligning the lenses and finding the region of interest (ROI) of an object. An enlarged virtual image of a target object can be observed through MLA when the target object is located closer than the focal length of MLA, as shown in Figure 8a. The MLA-assisted MCM can also increase the magnification of the imaging system by capturing a virtual image of MLA. However, image overlap can occur through adjacent microlenses; thus, a pinhole mask was formed between a target and MLA. The experimental results show that the MLA-assisted MCM without the pinhole mask offers an overlapped image, whereas the system with the mask provides a clear, magnified image, as shown in Figure 8b,c. The MLA-assisted MCM observes the group 7 element 5 of USAF 1951, which represents that the resolving power of MLA-assisted MCM demonstrates 2.46 μm, as shown in Figure 8d.
A scratch pattern with a dimension of 1 × 16 μm (Scratch & Dig Target, ISO 10110, Grade# 0.004) was observed through the MLA-based MCM, as shown in Figure 9. The MLA-based MCM observes a clear pattern compared with the digital zoom image of MCM, which offers a blur edge pattern due to the artificially-enlarged pixels. The magnification of MLA-assisted MCM is 8.43×, which is 3.92 times higher than that of MCM.

5. Conclusions

In summary, we have successfully demonstrated a multi-mode compact microscope (MCM) for high-contrast microscopic imaging. The MCM containing a bidirectional illumination module effectively transmits light to a sample and allows multi-mode imaging according to the materials and structures of the sample. The MCM achieves a spatial frequency of 135 lp/mm. The integral image reconstructed by the HDR algorithm clearly increases the dynamic range by 1.36 times compared to that of a single-exposure image. The MLA-assisted MCM successfully achieves a resolving power of 2.46 μm and a magnification of 8.43, owing to the virtual magnified imaging of MLA. This compact microscope can offer a novel and practical direction for machine vision and biomedical applications.

Author Contributions

Conceptualization, K.K.; methodology, K.K. and Y.H.; validation, K.K., Y.H. and J.P.; formal analysis, K.K., Y.H. and J.P.; investigation, K.K.; resources, K.K.; data curation, K.K. and J.P.; writing—original draft preparation, K.K., Y.H. and J.P.; writing—review and editing, K.K., Y.H. and J.P.; visualization, K.K.; supervision, K.K.; project administration, K.K.; funding acquisition, K.K. All authors have read and agreed to the published version of the manuscript.

Funding

This research was financially supported by a grant of the National Research Foundation of Korea (NRF) (No. 2021R1F1A1048603, PG2021039), Ministry of Science and ICT, South Korea (PG2021039), the Ministry of SMEs and Startups (No. S3103859), and the Ministry of Trade, Industry and Energy (No. 20020866).

Institutional Review Board Statement

Not applicable.

Informed Consent Statement

Not applicable.

Data Availability Statement

The data that support the findings of this study are available from the corresponding author upon reasonable request.

Conflicts of Interest

The authors declare no conflict of interest.

References

  1. Shrivastava, S.; Trung, T.Q.; Lee, N.-E. Recent progress, challenges, and prospects of fully integrated mobile and wearable point-of-care testing systems for self-testing. Chem. Soc. Rev. 2020, 49, 1812–1866. [Google Scholar] [CrossRef] [PubMed]
  2. Ning, B.; Yu, T.; Zhang, S.; Huang, Z.; Tian, D.; Lin, Z.; Niu, A.; Golden, N.; Hensley, K.; Threeton, B. A smartphone-read ultrasensitive and quantitative saliva test for COVID-19. Sci. Adv. 2021, 7, eabe3703. [Google Scholar] [CrossRef] [PubMed]
  3. Banik, S.; Melanthota, S.K.; Arbaaz; Vaz, J.M.; Kadambalithaya, V.M.; Hussain, I.; Dutta, S.; Mazumder, N. Recent trends in smartphone-based detection for biomedical applications: A review. Anal. Bioanal. Chem. 2021, 413, 2389–2406. [Google Scholar] [CrossRef]
  4. Coskun, A.F.; Wong, J.; Khodadadi, D.; Nagi, R.; Tey, A.; Ozcan, A. A personalized food allergen testing platform on a cellphone. Lab Chip 2013, 13, 636–640. [Google Scholar] [CrossRef] [PubMed] [Green Version]
  5. Rateni, G.; Dario, P.; Cavallo, F. Smartphone-Based Food Diagnostic Technologies: A Review. Sensors 2017, 17, 1453. [Google Scholar] [CrossRef]
  6. Berdeu, A.; Laperrousaz, B.; Bordy, T.; Mandula, O.; Morales, S.; Gidrol, X.; Picollet-D’hahan, N.; Allier, C. Lens-free microscopy for 3D + time acquisitions of 3D cell culture. Sci. Rep. 2018, 8, 16135. [Google Scholar] [CrossRef]
  7. Yang, K.; Wu, J.; Santos, S.; Liu, Y.; Zhu, L.; Lin, F. Recent development of portable imaging platforms for cell-based assays. Biosens. Bioelectron. 2019, 124–125, 150–160. [Google Scholar] [CrossRef]
  8. Ayardulabi, R.; Khamespanah, E.; Abbasinia, S.; Ehtesabi, H. Point-of-care applications of smartphone-based microscopy. Sens. Actuators A Phys. 2021, 331, 113048. [Google Scholar] [CrossRef]
  9. Kaile, K.; Fernandez, C.; Godavarty, A. Development of a Smartphone-Based Optical Device to Measure Hemoglobin Concentration Changes for Remote Monitoring of Wounds. Biosensors 2021, 11, 165. [Google Scholar] [CrossRef]
  10. Ganguli, A.; Mostafa, A.; Berger, J.; Aydin, M.Y.; Sun, F.; Ramirez, S.A.S.; Valera, E.; Cunningham, B.T.; King, W.P.; Bashir, R. Rapid isothermal amplification and portable detection system for SARS-CoV-2. Proc. Natl. Acad. Sci. USA 2020, 117, 22727–22735. [Google Scholar] [CrossRef]
  11. Liu, Y.; Rollins, A.M.; Levenson, R.M.; Fereidouni, F.; Jenkins, M.W. Pocket MUSE: An affordable, versatile and high-performance fluorescence microscope using a smartphone. Commun. Biol. 2021, 4, 334. [Google Scholar] [CrossRef] [PubMed]
  12. Jung, D.; Choi, J.-H.; Kim, S.; Ryu, S.; Lee, W.; Lee, J.-S.; Joo, C. Smartphone-based multi-contrast microscope using color-multiplexed illumination. Sci. Rep. 2017, 7, 7564. [Google Scholar] [CrossRef] [PubMed] [Green Version]
  13. Lee, K.C.; Lee, K.; Jung, J.; Lee, S.H.; Kim, D.; Lee, S.A. A Smartphone-Based Fourier Ptychographic Microscope Using the Display Screen for Illumination. ACS Photonics 2021, 8, 1307–1315. [Google Scholar] [CrossRef]
  14. Kheireddine, S.; Perumal, A.S.; Smith, Z.J.; Nicolau, D.V.; Wachsmann-Hogiu, S. Dual-phone illumination-imaging system for high resolution and large field of view multi-modal microscopy. Lab Chip 2019, 19, 825–836. [Google Scholar] [CrossRef] [PubMed] [Green Version]
  15. Greenbaum, A.; Akbari, N.; Feizi, A.; Luo, W.; Ozcan, A. Field-portable pixel super-resolution colour microscope. PLoS ONE 2013, 8, e76475. [Google Scholar] [CrossRef] [PubMed] [Green Version]
  16. Dai, B.; Jiao, Z.; Zheng, L.; Bachman, H.; Fu, Y.; Wan, X.; Zhang, Y.; Huang, Y.; Han, X.; Zhao, C.; et al. Colour compound lenses for a portable fluorescence microscope. Light Sci. Appl. 2019, 8, 75. [Google Scholar] [CrossRef] [PubMed]
  17. Wei, Q.; Acuna, G.; Kim, S.; Vietz, C.; Tseng, D.; Chae, J.; Shir, D.; Luo, W.; Tinnefeld, P.; Ozcan, A. Plasmonics Enhanced Smartphone Fluorescence Microscopy. Sci. Rep. 2017, 7, 2124. [Google Scholar] [CrossRef]
  18. Sung, Y.; Campa, F.; Shih, W.C. Open-source do-it-yourself multi-color fluorescence smartphone microscopy. Biomed. Opt. Express 2017, 8, 5075–5086. [Google Scholar] [CrossRef]
  19. Orth, A.; Wilson, E.R.; Thompson, J.; Gibson, B.C. A dual-mode mobile phone microscope using the onboard camera flash and ambient light. Sci. Rep. 2018, 8, 3298. [Google Scholar] [CrossRef] [Green Version]
  20. Sun, D.; Hu, T.Y. A low cost mobile phone dark-field microscope for nanoparticle-based quantitative studies. Biosens. Bioelectron. 2018, 99, 513–518. [Google Scholar] [CrossRef]
  21. Zhang, Y.; Shin, Y.; Sung, K.; Yang, S.; Chen, H.; Wang, H.; Teng, D.; Rivenson, Y.; Kulkarni, R.P.; Ozcan, A. 3D imaging of optically cleared tissue using a simplified CLARITY method and on-chip microscopy. Sci. Adv. 2017, 3, e1700553. [Google Scholar] [CrossRef] [PubMed] [Green Version]
  22. Bian, Y.; Jiang, Y.; Huang, Y.; Yang, X.; Deng, W.; Shen, H.; Shen, R.; Kuang, C. Smart-phone phase contrast microscope with a singlet lens and deep learning. Opt. Laser Technol. 2021, 139, 106900. [Google Scholar] [CrossRef]
  23. Navruz, I.; Coskun, A.F.; Wong, J.; Mohammad, S.; Tseng, D.; Nagi, R.; Phillips, S.; Ozcan, A. Smart-phone based computational microscopy using multi-frame contact imaging on a fiber-optic array. Lab Chip 2013, 13, 4015–4023. [Google Scholar] [CrossRef]
  24. Rivenson, Y.; Koydemir, H.C.; Wang, H.; Wei, Z.; Ren, Z.; Günaydın, H.; Zhang, Y.; Göröcs, Z.; Liang, K.; Tseng, D.; et al. Deep learning enhanced mobile-phone microscopy. ACS Photonics 2018, 5, 2354–2364. [Google Scholar] [CrossRef]
  25. Meng, X.; Huang, H.; Yan, K.; Tian, X.; Yu, W.; Cui, H.; Kong, Y.; Xue, L.; Liu, C.; Wang, S. Smartphone based hand-held quantitative phase microscope using the transport of intensity equation method. Lab Chip 2017, 17, 104–109. [Google Scholar] [CrossRef] [PubMed]
  26. Zhu, H.; Mavandadi, S.; Coskun, A.F.; Yaglidere, O.; Ozcan, A. Optofluidic fluorescent imaging cytometry on a cell phone. Anal. Chem. 2011, 83, 6641–6647. [Google Scholar] [CrossRef] [PubMed] [Green Version]
  27. Wang, L.; Bateman, B.; Zanetti-Domingues, L.C.; Moores, A.N.; Astbury, S.; Spindloe, C.; Darrow, M.C.; Romano, M.; Needham, S.R.; Beis, K. Solid immersion microscopy images cells under cryogenic conditions with 12 nm resolution. Commun. Biol. 2019, 2, 74. [Google Scholar] [CrossRef]
  28. Lee, G.J.; Kim, H.M.; Song, Y.M. Design and fabrication of microscale, thin-film silicon solid immersion lenses for mid-infrared application. Micromachines 2020, 11, 250. [Google Scholar] [CrossRef] [Green Version]
  29. Koyama, K.; Yoshita, M.; Baba, M.; Suemoto, T.; Akiyama, H. High collection efficiency in fluorescence microscopy with a solid immersion lens. Appl. Phys. Lett. 1999, 75, 1667–1669. [Google Scholar] [CrossRef]
  30. Wu, Q.; Ghislain, L.P.; Elings, V. Imaging with solid immersion lenses, spatial resolution, and applications. Proc. IEEE 2000, 88, 1491–1498. [Google Scholar]
  31. Hopkins, R.E.; Dutton, D. Lens Test Standardization Study; The Institute of Optics—University of Rochester: Rochester, NY, USA, 1970. [Google Scholar]
  32. Stefanoiu, A.; Scrofani, G.; Saavedra, G.; Martínez-Corral, M.; Lasser, T. What about computational super-resolution in fluorescence Fourier light field microscopy? Opt. Express 2020, 28, 16554–16568. [Google Scholar] [CrossRef] [PubMed]
  33. Masaoka, K.; Yamashita, T.; Nishida, Y.; Sugawara, M. Modified slanted-edge method and multidirectional modulation transfer function estimation. Opt. Express 2014, 22, 6040–6046. [Google Scholar] [CrossRef] [PubMed]
  34. Mertens, T.; Kautz, J.; Van Reeth, F. Exposure fusion. In Proceedings of the 15th Pacific Conference on Computer Graphics and Applications (PG′07), Maui, HI, USA, 29 October 2007–2 November 2007; pp. 382–390. [Google Scholar]
  35. Kim, K.; Jang, K.W.; Ryu, J.K.; Jeong, K.H. Biologically inspired ultrathin arrayed camera for high-contrast and high-resolution imaging. Light. Sci. Appl. 2020, 9, 28. [Google Scholar] [CrossRef] [PubMed] [Green Version]
  36. Kim, K.; Jang, K.-W.; Bae, S.-I.; Kim, H.-K.; Cha, Y.; Ryu, J.-K.; Jo, Y.-J.; Jeong, K.-H. Ultrathin arrayed camera for high-contrast near-infrared imaging. Opt. Express 2021, 29, 1333–1339. [Google Scholar] [CrossRef] [PubMed]
  37. Bae, S.I.; Kim, K.; Jang, K.W.; Kim, H.K.; Jeong, K.H. High Contrast Ultrathin Light-Field Camera Using Inverted Microlens Arrays with Metal–Insulator–Metal Optical Absorber. Adv. Opt. Mater. 2021, 9, 2001657. [Google Scholar] [CrossRef]
  38. Kim, W.-C.; Moon, H.; Lee, W.-S.; Lim, G.; Choi, G.-J.; Kang, D.; Lee, H.; Park, N.-C. Investigation on achieving super-resolution by solid immersion lens based STED microscopy. Opt. Express 2017, 25, 16629–16642. [Google Scholar] [CrossRef]
  39. Ostertag, E.; Lorenz, A.; Rebner, K.; Kessler, R.W.; Meixner, A.J. Extension of solid immersion lens technology to super-resolution Raman microscopy. Nanospectroscopy 2014, 1. [Google Scholar] [CrossRef]
Figure 1. Multi-mode compact microscope (MCM) for high contrast microscopic imaging. (a) A schematic illustration of MCM consisting of a ring-type top illumination, an imaging lens, a z-axis lift stage, a bottom illumination, and a housing with circuit boards. The ring-type top illumination is intended for reflection light microscopy mode, and the bottom illumination is used for transmitted light microscopy mode. Higher magnification mode contains micro-lens array (MLA) for additional magnification by the virtual image of MLA. (b) A photograph demonstrating the fully-integrated compact microscope. The dimension of MCM is 13 cm × 11.5 cm × 8 cm. (c) An exploded view of MCM. Optical path diagrams of (d) reflection and transmission mode as well as (e) higher magnification mode.
Applsci 12 07399 g001
Figure 2. Imaging characterization of MCM. The captured (a) negative and (b) positive USAF 1951 resolution target images through the MCM. The central area was magnified with digital zoom. The corresponding normalized intensity profiles of captured (c) negative and (d) positive USAF 1951 target images.
Applsci 12 07399 g002
Figure 3. Imaging performances of MCM. (a) Measured MTF curves according to illumination directions and targets through the slanted-edge method. (b) Thru-focus MTF according to target distances. The MTF was determined at the spatial frequency of 50 line pairs per mm.
Applsci 12 07399 g003
Figure 4. Multi-mode illumination imaging of MCM. (a) Schematic illustrations of multi-mode illumination imaging. The transmission light microscopy mode uses the bottom illumination, and the reflection light microscopy mode comprises the top illumination. The dual illumination mode simultaneously utilizes the bottom and top illuminations. The captured microscopic images of (b) stratified squamous epithelium and (c) cardiac muscle in the transmission light mode. The reflected microscopic images of (d) gold wires on an image sensor and (e) a silicon capacitor packaged on a circuit board. The captured images of leaf in (f) the transmission light mode and (g) the reflection mode. (h) Dual illumination imaging of leaf, which offers a high-contrast leaf hair image. The scale bars are 100 μm.
Applsci 12 07399 g004
Figure 5. Microscopic imaging applications through the MCM. (a) A schematic illustration of dark-field microscopic imaging. The captured dark-field images of (b) yeast and (c) sugar through the MCM with the dark-field stop. The captured bright-field images of (d) yeast and (e) sugar through the MCM to compare with dark-field images. The scale bars are 100 μm.
Applsci 12 07399 g005
Figure 6. High dynamic range (HDR) imaging of MCM. (a) An algorithm flow chart of HDR reconstruction. (b) Sectional images of monocotyledonous plant stem according to exposure times. (c) A reconstructed HDR image by integrating the various contrast images. The scale bar is 100 μm.
Applsci 12 07399 g006
Figure 7. The corresponding histogram measured from images before and after image reconstruction. The area of HDR image histogram is increased by 1.36 times compared with the single exposure image (0.5 ms).
Applsci 12 07399 g007
Figure 8. MLA-assisted higher magnification imaging. (a) A schematic illustration for imaging principle of MLA-based higher magnification imaging. Captured microscopic images from the MLA-assisted MCM (b) without a mask (c) with a mask. (d) The corresponding normalized intensity profiles of captured the image of group 7 on the USAF 1951 target through the MLA-assisted MCM.
Applsci 12 07399 g008
Figure 9. Comparison of magnification between the MCM and the MLA-assisted MCM. (a) Captured images of a scratch target through the MCM. (b) Digitally magnified image of scratch target. (c) Captured image of scratch target through and the MLA-assisted MCM.
Applsci 12 07399 g009
Publisher’s Note: MDPI stays neutral with regard to jurisdictional claims in published maps and institutional affiliations.

