Abstract
Deepfake detection is of fundamental importance to preserve the reliability of multimedia communications. Modern deepfake detection systems are often specialized on one or more types of manipulation but are not able to generalize. On the other hand, when properly designed, ensemble learning and fusion techniques can reduce this issue. In this paper, we exploit the complementarity of different individual classifiers and evaluate which fusion rules are best suited to increase the generalization capacity of modern deepfake detection systems. We also give some insights to designers for selecting the most appropriate approach.
1. Introduction
A deepfake is a video or image containing one or more individuals whose identity or action has been manipulated through deep-learning techniques. Deepfakes can be difficult to detect to the naked eye, especially those of the new generation, as they can often look and sound realistic.
There are many risks associated with deepfake technology since it can be applied for malicious uses [1,2]. Deepfakes can be used to create fake news and spread misinformation [3,4]. Thus, they can have a devastating impact on society, especially concerning the ones that are convincing enough. Moreover, deepfakes can be used to bully or harass by creating false images or videos of people in compromising or embarrassing situations, such as those related to child pornography or revenge porn [2,5].
For this reason, in recent years, multiple technologies, especially those based on deep-learning, have been exploited to detect deepfake videos and images [1]. Although many deepfake detectors have reached high accuracy values, generalization is still an open problem. In particular, deepfake detectors are capable of detecting only the manipulations on which they have been trained; however, often even genuine data has different characteristics from dataset to dataset [6,7]. A possible solution for this issue is the joint use of classifiers that are capable of analyzing videos in different ways [8]. This approach refers to the theory of multiple classifier systems [9] and, in the case of this paper, to the score-level fusion.
In other words, understanding if and how it is possible to exploit the complementarity of different models to make a deepfake detection system more capable of generalizing is the goal of this work. This paper is the follow-up of ref. [10]: in particular, we expanded the experimental investigation to more complex fusion approaches, explored the relationships between outcome and generalization ability and built a set of insights to guide the designer to the most appropriate ensemble-based approach.
This paper is organized into the following sections: Section 2 provides a review of the existing literature on deepfake detection; Section 3 describes the purpose of the experimentation and the proposed fusion methods; Section 4.1 presents the experimental protocol; the experimentation results are reported in Section 4.2; and our conclusions are drawn in Section 5.
2. Related Work
The term “deepfake video” includes a multitude of facial identity manipulations [11]: starting from face swapping that replaces the face of a source video with another identity while maintaining the movements and facial expressions, starting from lip syncing that modifies only the region of the mouth. In conjunction with audio, deepfakes are used to manipulate the speech of the individual, up to the entire synthetic generation of the face or the modification of attributes, such as age, gender and physical characteristics. At the state-of-the-art, there are different techniques for deepfake detection that are based on different assumptions (Figure 1).

Figure 1.
Taxonomy of deepfake-detection approaches.
General network-based/Undirected approaches: generic classifiers are used to analyze the faces present in a frame, exploiting the ability to extract discriminative characteristics of deep neural networks [12]. These approaches can be addressed as two-class classification problems [13] or as anomaly detection problems [14]. Transfer learning techniques are often adopted in the training phase.
Visual artifact-based approaches: detect deepfakes by looking for artifacts [15]. The incorporation of a face in a source frame generates discontinuities and artifacts. The analysis of the edges, quality and other spatial characteristics of the information contained in the frame allows for the detection of these artifacts, often visible even to the naked eye. In particular, the final image can, in some cases, be subdivided into the blending of two images from different sources [16].
Temporal consistency-based approaches: this type of detector looks for temporal, behavioral and synchronization inconsistencies [17,18]. The temporal analysis is applied on a sequence of frames. Thus, these approaches are video-based only and cannot be applied to a single image. When available, the audio can be also analyzed along with the video for coherence verification [19].
Biological signal-based approaches: the monitoring of blood volume, eye blinking patterns and other physiological signals can be exploited to understand if the individual portrayed is consistent with normal human vital functions [20,21].
Camera fingerprint-based approaches: even in the presence of compression and noise, Generative Adversarial Networks, which are often employed to produce manipulations, leave distinct imprints that may be discovered and utilized to categorize the frame [22,23]. For this reason, several authors identified deepfakes by studying the characteristics and patterns left by the deepfake generation mechanism.
Although some detection algorithms are accurate, deepfake detection is a constant “arms-race” between attackers and defenders. Most deepfake detection methods assume a precise strategy and are narrowly focused on identifying a particular artifact and, thus, cannot generalize to new distributions and unknown manipulations. However, due to the nature of these systems’ training, it is possible to argue that their specialization in looking for different artifacts might be exploited by following a multiple classification system approach [8]. In other words, “merging” multiple detection methods could increase the generalization capabilities of the system. To achieve this, we propose and examine new fusion techniques aimed at exploiting the complementarity of different detection methods.
Accordingly, we chose three types of deepfake detectors representative of the state-of-the-art:
- A visual artifact-based detector, consisting of a ResNet50 model fine-tuned on manipulated facial images to simulate resolution inconsistencies [24].
- A general network-based detector, consisting of an XceptionNet model fine-tuned on deepfake data [25].
- Four EfficientNet models that exploit different attention mechanisms and training techniques [26]. In particular: (i) EfficientNetB4, a multi-objective neural network that optimizes accuracy and FLOPS, trained with a classical end-to-end approach; (ii) EfficientNetB4ST, the EfficientNetB4 architecture, trained using the Siamese strategy and based on the concept of triplet loss function; (iii) EfficientNetAutoAttB4, a variant of the standard EfficientNetB4 architecture trained with a classical end-to-end approach with the addition of an attention mechanism that allows the network to concentrate on the most important areas of the feature maps; and (iv) EfficientNetAutoAttB4ST, the same EfficientNetAutoAttB4 architecture trained using a Siamese strategy.
3. Ensemble Methods for Deepfake Detection
Ensemble methods and multi-modal or uni-modal fusion are constantly being exploited in many fields of pattern recognition to improve the ability to generalize and deal with intra-class variations and inter-class similarity. Fusion can be performed at various levels of a classification system, including at the sensor level, feature level, score level and decision level [27,28,29].
Within the context of deepfake detection, Refs. [30,31,32] explored the fusion of features of different nature, i.e., spatial and in the frequency domain or statistical and semantic, exploiting their complementarity. In [8], the authors proposed two different fusion techniques: the feature-level fusion of face patches from different facial regions and score-level fusion of three different classifiers. The simple average was used. In [26], the authors designed an ensemble of different neural networks by averaging the output score from each model. These previous works proposed a fusion approach as part of a more complex system. In this paper, we want to systematically evaluate which score-level fusion methods are best suited for the task.
Thus, our focus is on the fusion rules. In particular, we investigate fusion at the score level, as this allows exploiting the complementarity without increasing the complexity of the system as is usually done in feature-level fusion or relying only on the binary outcome as in decision-level fusion [27,33,34,35,36]. Moreover, we explored various fusion approaches, represented in Figure 2, which can be categorized into non-parametric and parametric methods [27,37]. The proposed parametric methods can be further divided into two categories: methods based on weighted averages and those based on classification models.
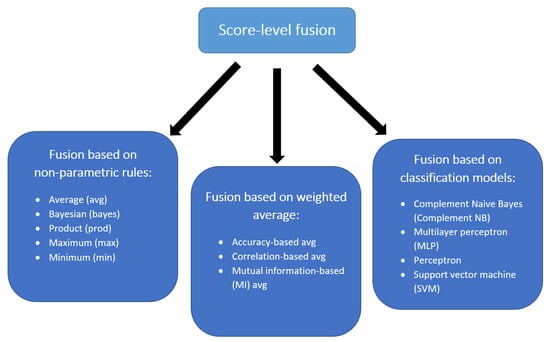
Figure 2.
Taxonomy of the analyzed score-level fusion methods.
3.1. Non-Parametric Fusion Methods
As in our previous study [10], we explored various non-parametric fusion methods by applying a set of rules on the scores (i.e., the probability values of belonging to the fake class) predicted by the single classification models. Hence, the final score obtained from each sample represents a combination of the single predicted scores.
We introduce here a common notation for easing the understanding of such fusion rules. Let us consider the fusion of N classifier scores, where represents the score of the i-th classifier on the same frame x (i.e., the estimated posterior probability that the analyzed frame contains a deepfake). According to this notation, it is possible to compute the fusion scores of the N classifiers with the following formulas:
Therefore, such a set of rules represents, in order, the simple average between the scores obtained from the single detection systems, the Bayesian average between them, the N-th root of their product, the maximum between them and the minimum between them.
3.2. Fusion Methods Based on Weighted Average
To extend the preliminary analysis presented in [10], we evaluated whether fusion methods based on weighted averages could be more effective. In fact, the baselines of deepfake detection methods are often known, and certain methods are more efficient than others. Weighting these more and, thus, assigning them greater relative importance in the fusion process could allow exploiting the complementarity without losing precision on correctly classified samples. In general, fusion methods based on the weighted average use weights assigned to each detector for linearly combining the scores assigned to each sample by such classification systems.
There are various methods of assigning such weights (e.g., [38,39,40,41]). In this study, we assigned the weights according to three different methods, namely accuracy-based, correlation-based and based on mutual information.
In the first approach, we computed the accuracy of the single detector on the training set and then used such values as weights in the implementation of the previous equation. Specifically, the accuracy was computed using a threshold equal to 0.5 on the scores for classifying each sample as deepfake, whether its score was greater or equal to such a threshold, or as real, otherwise.
Similarly, through the correlation-based method, we assigned the weights to the fusion module as the Pearson correlation coefficients resulting from the correlation analysis between the scores predicted by the single detection systems and the actual classes (i.e., the real samples were labeled as 0, and the manipulated ones as 1). Thus, unlike the previous method, the correlation-based method allows assigning the weights according to the reliability of the single deepfake detector estimated at the score level rather than at the decision level.
In particular, the Pearson correlation coefficient (PCC) is a measure of linear correlation between two variables, represented by the scores and the actual classes in this case. Hence, the more the scores obtained from a specific deepfake detector are correlated with the target, the greater the weight it will have in the fusion. Through this method, when a correlation coefficient is obtained, the corresponding weight was considered as 0 (i.e., the detection system was not considered).
The fusion method based on mutual information employs a similar approach by assigning the weights according to the mutual information (MI) computed from the set of scores obtained by the training set and the actual classes. Specifically, the mutual information between two variables is a non-negative value, obtained through an estimation method based on entropy, which measures the dependency between the variables [42,43,44] and between the predicted scores and the actual labels in this case. Thus, unlike the previous method, the MI-based method is able to capture even non-linear dependency between scores and targets, thus, assigning the weights accordingly. Such a value is equal to zero if and only if two random variables are independent, while the higher the values, the higher the dependency between variables.
3.3. Fusion Methods Based on Classification Models
As already proposed in previous studies in the biometric field (e.g., [27]), trained pattern classifiers could be able to effectively fuse the match scores generated by the multiple detection systems in order to determine the class label (e.g., real or fake). Therefore, we investigated the effectiveness of this approach by combining the output of the single systems, which are then employed as input features of various classifiers, previously fitted on the set of scores obtained from the training samples of the single detectors (Figure 3). Specifically, we considered this fusion approach, such as a supervised classification problem, employing the set of scores obtained from the single detection systems as a feature vector, which is used as input of the classification model, which in turn predicts the final probability of belonging to the deepfake class:
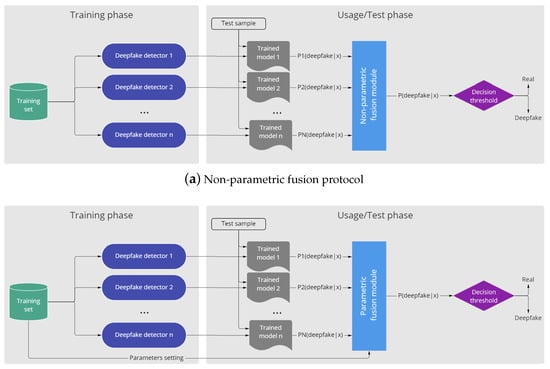
Figure 3.
Visual pipelines of non-parametric (a) and parametric (b) fusion protocols.
We investigated the capability of exploiting the complementarity of the analyzed systems through both linear and non-linear models. In particular, we employed a linear perceptron as a linear model with a support vector machine (SVM) with Radial Basis Function (RBF) kernel and a multilayer perceptron optimizing the log-loss through the adam stochastic gradient-based optimizer (MLP) [45] as non-linear models. Finally, we also examined the complement Naive Bayes (Complement NB) algorithm for dealing with the imbalance of the dataset in terms of samples per class [46].
4. Experimental Results
4.1. Experimental Protocol
The experimental protocol was slightly different between parametric and non-parametric approaches since the latter requires a data set to set the fusion parameters. The protocol is shown in Figure 3. For the parametric methods, the dataset used to set the parameters coincides with the set of scores obtained by the single detectors from the training set, which consists of the FaceForensics++ dataset for all experiments. In particular, we are referring to the way to calculate accuracies, correlations and mutual information in the case of accuracy-based, correlation-based and MI-based weighted fusion methods, respectively, and to the training of classifiers in the case of the fusion methods based on classification models.
The FaceForensics++ [25] is a deepfake dataset consisting of 1000 original videos manipulated with first and second generation techniques. In particular, there are four types of manipulation, two computer-graphics-based approaches (Face2Face and FaceSwap) and two learning-based approaches (DeepFakes and NeuralTextures). In total, the dataset contains 4000 deepfake videos. We adopted the same split proposed for the training in [25], excluding the NeuralTextures approach. Two sets of experiments were performed to evaluate the effectiveness of the fusion methods in deepfake detection in the so-called intra-dataset and cross-dataset scenarios.
The intra-dataset protocol provides for testing methods on the split test of the FaceForensics++ proposed in [25]. This protocol, therefore, evaluates how models behave on known data types.
The cross-dataset protocol requires a different test dataset than the training one. In particular, the Deepfake Detection Challenge (DFDC) [47] dataset was used. It includes a total of 100,000 videos collected from 3426 paid actors and created using a variety of approaches, GAN-based approaches and non-learned approaches. Table 1 summarizes the number of samples used for training and testing.

Table 1.
Number of samples (frames) adopted for the training and testing phase.
After training the single deepfake detectors, we assessed the effectiveness of the analyzed fusion approaches through various performance metrics, as well as the improvement with respect to the single detectors. In particular, we evaluated the reliability of the examined fusion methods at the frame level, thus considering each frame of any video as a single sample, by means of metrics that are commonly employed in the field of biometrics and, in general, in binary classification tasks, as in the case of the analyzed task.
From the values of the scores, we computed the FPR (False Positive Rate; the proportion of real samples classified as deepfake) and the TPR (True Positive Rate; the proportion of deepfakes that have been correctly classified) at various threshold values in order to obtain the ROC (Receiver Operating Characteristic) curve and the related AUC (Area Under the Curve).
We also computed the EER (Equal Error Rate) from these values, representing the error rate for which the FPR and the FNR (False Negative Rate) are equal or as similar as possible. The latter represents the proportion of deepfakes wrongly classified as real samples. Moreover, we also evaluated the FPR@FNR1% (FPR at FNR equal to 1%) and FNR@FPR1% (FNR at FPR equal to 1%) for assessing the performance of the various fusion approaches in scenarios in which it is necessary to strictly limit the number of deepfakes considered as real and vice versa, respectively.
Furthermore, from the distributions of scores of deepfake and real samples, we computed the Cohen’s d [48], an estimation of the effect size used to indicate the standardized difference between the means of the two distributions. In this case, we employed this metric for summarizing the effect size of the difference between the score distributions of the two analyzed classes, where the higher the Cohen’s d, the more relevant the difference between them.
We repeated such evaluation separately in the experimental scenarios, namely intra-dataset and cross-dataset. Finally, we evaluated the fusion methods in terms of computational time due to the increasing importance of real-time detection capability consequent to the potential usage of deepfake in streaming media platforms [1]. In particular, we investigated this aspect by assessing the average inference time per sample on 100 repetitions on the split test of the FaceForensics++ dataset.
4.2. Results
In this section, we report the results obtained through the previously described experimental setup. In particular, we describe the outcome in the intra-dataset scenario (Section 4.2.1). Then, Section 4.2.2 shows the performance obtained in the cross-dataset scenario. The division into these two scenarios allows us to extract some guidelines useful to the deepfake detector designer on the basis of the application context: the intra-dataset scenario simulates a completely controlled application context, where the possible manipulations that the system can recognize are known: in this case, the detection system training can be conducted ad hoc.
The cross-dataset protocol, on the other hand, simulates a more generic application context in which the manipulations to be recognized are unknown. The system should therefore be able to distinguish a real video from a deepfake regardless of the characteristics of the video/image and the type of manipulation contained.
4.2.1. Intra-Dataset Scenario
Table 2 reports the performance values related to the single models and all the fusion techniques. The best values for each metric are highlighted in bold to make it easier to read. We can observe that, in terms of the AUC, the best performing single models are EfficientNetAutoAttB4 and EfficientNetB4ST; however, the last one appears better in terms of the EER and Cohen’s d. Overall, among the non-parametric fusion rules, the best one was the simple Average fusion rule, followed by the Bayesian fusion rule, which also showed a slightly lower False Negative Rate at a False Positive Rate equal to 1%. Regarding the approaches based on the weighted average, we noticed that the three considered methods exhibited similar results. Finally, among the methods based on machine-learning models, the best one was the MLP.
Table 2.
The results on the FF++ in the intra-dataset scenario (the best values related to each performance metric are reported in bold).
In general, the results in the intra-dataset scenario show a performance improvement with respect to the single deepfake detectors through the parametric fusion approaches. This was largely expected by the plethora of papers in other applications (e.g., [49,50]). The exception is the SVM, which showed similar performance to the most performing non-fused models. The non-parametric fusion rules led instead to similar or even worse performance than the single detection systems, except in the case of the ResNet. In particular, the fusion approach that highlighted the best performance in relation to all the explored metrics was the MLP.
In Figure 4, the ROC curves related to the intra-dataset scenario (on the FF++ dataset) are shown for the three adopted fusion typologies (Figure 4a–c) and for the best performing model (in terms of AUC) selected from the single models and the three fusion typologies (Figure 4d). For each of the categories, the results related to the single models are reported to allow a direct comparison.
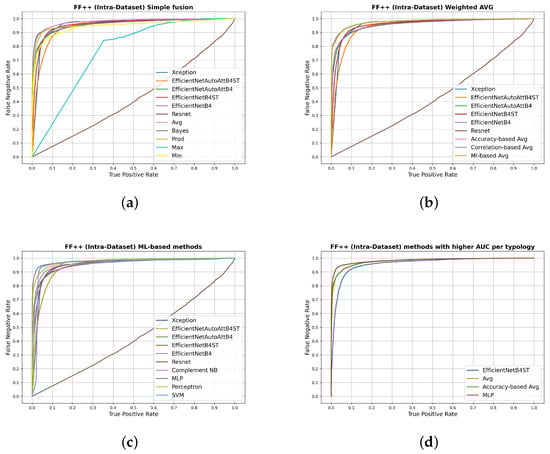
Figure 4.
ROC curves on the FF++ dataset comparing the single deepfake detectors with their fusion through non-parametric approaches (a), the approaches based on weighted averages (b), the ones based on machine-learning models (c) and comparing the most performing methods of each category with respect to the obtained AUC (d).
As we can notice from Figure 4a, the simple average performed better than the best single model. This is not true for all the other non-parametric fusion methods: the max rule, for example, performed noticeably worse than the other methods but still better than the worse single model (ResNet). In the case of the weighted averages (Figure 4b), we can observe that all the three considered fusion methods performed better than the single models, as in the case of the methods based on machine learning (Figure 4c), except for the SVM.
To explain the obtained results, we reported the distribution of scores for both real and fake samples in Figure 5. We can observe that the reasons for the low performance in the cases of the ResNet (Figure 5a,b) and the Max fusion rule (Figure 5c,d) are related to the high tendency toward high scores for both real and fake samples. This is particularly evident in the case of the ResNet, confirming the Cohen’s d reported on the previous table (Table 2). The plots also suggest a less pronounced separation between the distribution of fake samples and the distribution of real ones through the accuracy-based average (Figure 5e,f) and the Complement NB (Figure 5g,h) with respect to the other methods of the respective approaches. However, the separation between the distributions is still visually evident, confirming the values of the previously obtained performance metrics, particularly concerning the Cohen’s d (Table 2).
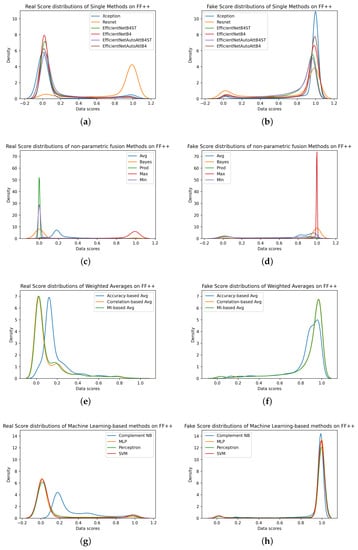
Figure 5.
Real and Fake Score distributions related to the FF++ dataset from single methods (a,b), non-parametric fusion methods (c,d), weighted averages (e,f), and Machine Learning-based methods (g,h).
It is important to underline that ResNet is the only model trained on a different dataset, and this is evident from the distribution of reals completely overlapping that of fakes. This evidence should lead the designer to exclude a model with this behavior. Furthermore, in a controlled application context, it should be easier for a designer to keep the real distribution curve under control, as he/she knows the dpi, size and compression of the images or videos on which the detector works.
The designer should therefore select a fusion rule that keeps the reals distribution mean close to zero, for instance MLP and Perceptron. The choice of the fusion rule should also be correlated with the operational point at which the system must work. For example, the SVM-based fusion rule would seem optimal from the point of view of the distribution mean, resulting in one of the lowest EER of the analyzed rules.
However, using more stringent operational points, such as a threshold at 1% FPR or at 1% FNR, leads to higher error rates than other rules, such as weighted averages. This is due to the second mode of SVM distributions, which, albeit at low density, affects the results. Since different operating points could be required by a particular application context, such as the need to misclassify very few fakes or very few real ones, the designer must analyze all the modes of the distribution, their average, their variability and their density.
An optimal fusion rule should lead to unimodal distributions with low variability and averaging 0 for reals and 1 for fakes. The fusion rules based on Perceptron and MLP are therefore optimal in the analyzed intra-dataset scenario. To investigate how these rules behave in the presence of unknown manipulations, a cross-dataset analysis is required.
4.2.2. Cross-Dataset Scenario
The cross-dataset analysis is of the utmost importance because it allows evaluating whether the fusion of multiple classifiers can increase the ability to generalize over “never seen before” manipulations. Since the detectors are trained on the same dataset, the contribution of the fusion in moderating the individual matching score distributions can be better isolated without referring to complementarity induced by other causes, such as the training data employed.
Similarly to the previous section, we reported the cross-dataset results using the performance metrics of Table 3.
Table 3.
The results on the DFDC in the cross-dataset scenario (the best values related to each performance metric are reported in bold).
As in the intra-dataset scenario, we observe a similar trend in terms of performance of the single models, with the EfficientNetB4ST showing the best values in terms of the AUC, EER and Cohen’s d. However, this is not confirmed for all the decision thresholds since the EfficientNetAutoAttB4 performed better for decision thresholds in which one of either the False Negative Rate or the False Positive Rate was equal to 1%.
Among the non-parametric fusion rules, the best was still the simple Average, highlighting a noticeable difference from the other non-parametric fusion rules, especially in terms of Cohen’s d. However, in this scenario, the simple Average was no better than the best of the detectors, thus, highlighting the limitations of non-parametric methods.
Regarding the approaches based on weighted averages, we notice that the correlation-based average was able to provide the best results (even better than the ones related to the single detectors) followed by the MI-based one, which showed similar performance. In contrast to the intra-dataset scenario, Complement NB was the best of the fusion methods based on machine-learning models.
The results in the cross-dataset scenario show a general improvement with respect to the single models through the parametric fusion methods. In particular, the best fusion methods were the correlation-based average and the Complement NB. Instead, the non-parametric fusion rules were not able to improve the performance compared to the most performing detection models.
In Figure 6, the ROC curves related to the cross-dataset scenario (on the DFDC dataset) are shown for the three adopted fusion typologies, together with the ones related to the single models (Figure 6a–c). The most performing methods of each fusion approach are compared with the single model showing the highest AUC value (Figure 6d). By visual inspection, it is possible to confirm the slight improvement through the parametric approaches with respect to the single model and the deterioration of performance through the non-parametric one.
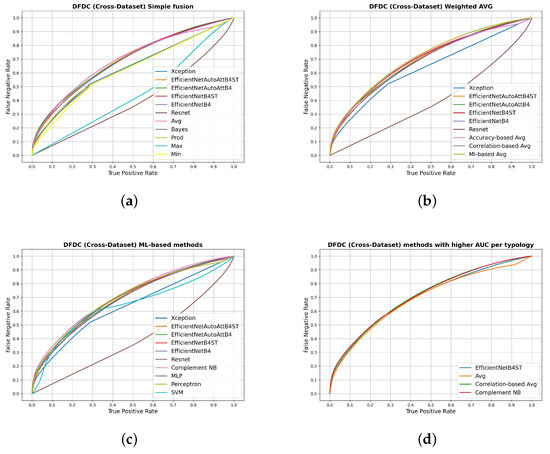
Figure 6.
ROC curves on the DFDC dataset comparing the single deepfake detectors with their fusion through non-parametric approaches (a), the approaches based on weighted averages (b), the ones based on machine-learning models (c) and comparing the most performing methods of each category with respect to the obtained AUC (d).
The analysis of the distributions of scores resulting from the investigation in the cross-dataset scenario (Figure 7) allows us to add some further insights for a designer. In this scenario, the fake distributions of the single methods have two modes, one centered on score 0 and one centered on score 1. The first one with a higher density represents incorrectly classified samples and is the cause of the performance drop in this scenario. An optimal fusion method should therefore leave the distribution of the real scores unchanged, which correctly have a unimodal distribution with an average of 0. It should also reverse the trend of fakes and increase the density of mode with a mean equal to 1. As shown by Figure 7, none of the fusion methods analyzed could achieve these difficult objectives since the real and fake starting distributions are greatly overlapped. However, it is of interest in the design of a deepfake detector to highlight certain clues:
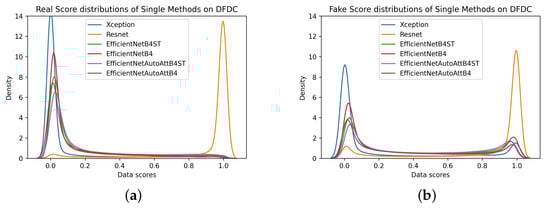
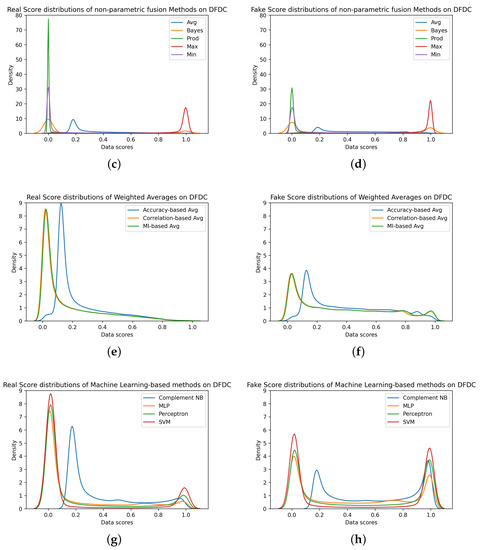
Figure 7.
Score distributions related to the DFDC dataset from single methods (a,b), non-parametric fusion methods (c,d), weighted averages (e,f), and Machine Learning-based methods (g,h).
- Non-parametric fusion rules fail to separate the two distributions. Due to the complete control of the experimentation, it is possible to note that, in contradiction with our earlier findings [10], the Maximum rule does not bring benefit in the detection of never-seen-before deepfake samples. In fact, this function is limited to shifting the mode score towards 1.
- Weighted average-based methods lower both the fake mode densities and the real mode density, thereby, resulting in distributions with high variability. This results in a slight improvement in cross-dataset performance, which is appreciable particularly when the operational point is set at the EER.
- Methods based on classification models increase the density of the fake mode with a mean equal to 1 (resulting in a distribution with a lower variability) but decrease the density of the real mode by increasing its variability. This results in a slight improvement in the cross-dataset performance, which is appreciable particularly when the operational points are stringent from the point of view of the FPR (e.g., the threshold at 1 % FPR).
To sum up, the analysis of the cross-dataset scenario confirms the improvement in the deepfake detection by means of the fusion rules based on the weighted average and classification models while demonstrating the lack of effectiveness of the non-parametric fusion approach. Moreover, the analysis in the cross-dataset scenario confirmed the ability of the fusion methods to improve the overall performance of the deepfake detection systems—also with respect to the variability introduced by the reference scenario. Accordingly, the designer should prefer fusion rules based on the weighted average, especially the Correlation-based Avg, when the threshold is set on the EER, or prefer fusion rules based on classification models, especially on Complement NB, with stringent operational thresholds.
4.3. Fusion Time Analysis
The analysis of the computational time required for performing the fusion of the individual models’ scores of a single frame, reported in Table 4, highlighted that the Complement NB was the fastest approach in the range of individual classifiers, requiring about 0.5 s per sample on a system with an AMD EPYC 7B12 CPU and 12 GB memory.
Table 4.
The average inference time of the fusion methods on a single sample for two to six fused modules (the lowest values for each number of fused models are reported in bold).
The SVM showed the highest computation time, for example, over 50 times the Complement NB in the fusion of six models. However, it is interesting to notice that this tended to decrease as the number of detection models included in the merger increased from two to six (Figure 8).
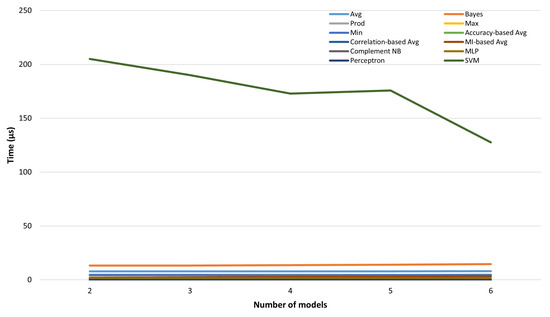
Figure 8.
Inference time of fusion methods for various numbers of fused models.
Hence, with reference to the previous analysis (Table 2 and Table 3), these results show that the best performing model was not necessarily the one with the greatest computational complexity. Therefore, this highlights how the choices between the processing speed of the fusion methods and the performance of the same are not necessarily in opposition.
5. Discussion and Conclusions
In this paper, we investigated the effectiveness of score-level fusion in deepfake detection as an attempt to exploit the complementarity of six different state-of-the-art detectors. In particular, we explored various fusion methods, which can be roughly categorized into non-parametric fusion, fusion based on the weighted average and fusion based on classification models (Figure 2).
Therefore, we compared a battery of fusion methods through a common experimental setup in intra-dataset and cross-dataset scenarios. This allowed us to study different application contexts: the intra-dataset scenario simulated a context in which the designer knows the characteristics of the data (the resolution, size and compression levels) and the possible manipulations in input to the system; the cross-dataset scenario simulated a more unfavorable application context in which the data characteristics and manipulations were unknown.
In general, the obtained results confirmed our initial hypothesis that a suitable fusion method can help in improving the performance, and hence the robustness, with respect to a single deepfake detection classifier. This was possible since all the considered models were trained with the exact same samples from the FF++ dataset (except for ResNet, trained on ad hoc samples), allowing us to highlight the strengths of each fusion model.
The most important considerations are those that help the designer during the system implementation phase. First, the difference in performance between non-parametric and parametric fusion rules suggests that the approaches related to the latter are inherently more robust to the influence of networks that do not perform well on the data on which these fusion methods are fitted, as with ResNet in our case (e.g., Figure 9b and Figure 10a).
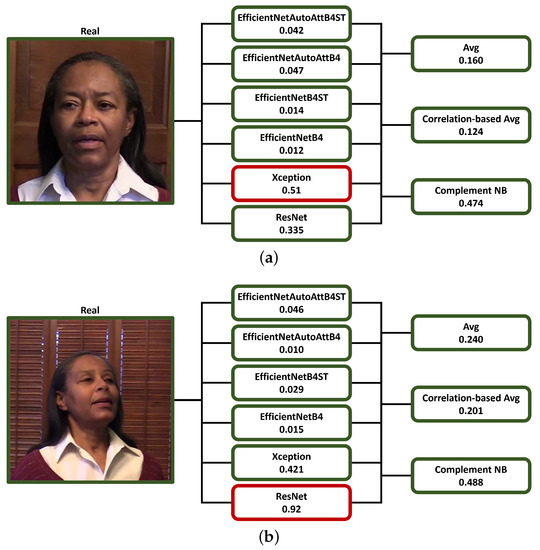
Figure 9.
Example of inferences from real images of the DFDC dataset (22093_5 (a) and 21309_6 (b)) of three of the analyzed score-level fusion methods from the scores of the single classification models (scores greater than or equal to 0.5 are identified by a red border and by a green border otherwise).
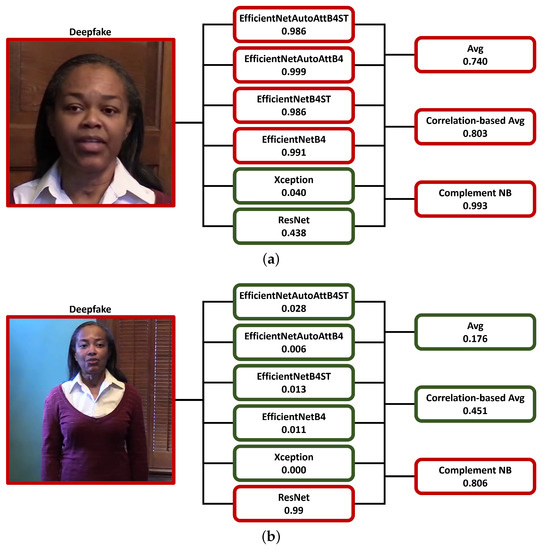
Figure 10.
Example of inferences from fake images of the DFDC dataset (20010_23 (a) and 19970_16 (b)) of three of the analyzed score-level fusion methods from the scores of the single classification models (scores greater than or equal to 0.5 are identified by a red border and by a green border otherwise).
As a result, based on the analyzed sample, a detector might be weighted by parametric techniques more heavily than another, regardless of overall accuracy, as illustrated in Figure 10b, where the ResNet network, while not the best performing, guides the decision of most of the machine-learning models, such as the Complement NB. This evidence is crucial in designing an ensemble of deepfake detectors since we cannot know in advance which types of detectors could be more suitable for a specific type of fake in a real-world scenario. In contrast, the parametric rules appear to be more influenced by the presence of a detection system showing relatively poor performance.
In particular, in contrast with the other models, the ResNet employed a different training technique, which could be the cause of the lowest performance. Thus, the evaluation of this model should always be considered to be related to a cross-dataset scenario.
Furthermore, the following considerations can be extracted from this analysis:
- The designer, on the basis of the application context, should define whether they expect known (controlled tests) or unknown (uncontrolled or partially controlled tests) types of data and manipulations.
- The designer should define at which operational point the detection system will have to work on the basis of the desired weight of first or second type errors.
- The designer should use a validation set to analyze the distributions of the scores and select the fusion rule closest to their needs.
Based on these considerations, it is important to highlight that:
- In an optimal application context given by controlled tests, the designer should select the fusion rule that allows them to have the two distributions of the real and fake scores of the validation set unimodal with a small variability and centered, respectively, on 0 and 1.
- The methods based on the weighted average generate single-model distributions with high variability and are therefore more suitable for applications with a decision threshold set to the system’s EER.
- The methods based on classification models generate bimodal distributions centered in 0 and 1 with a small variability and low density for the mode related to the wrong classifications; they are therefore more suitable for applications with a stringent decision threshold set, for example, at 1% FPR or 1% FNR.
However, it should be noted that, although parametric methods are more suitable for fusion purposes, they require a weight estimation (or training) phase, which is time-consuming and can be influenced by biases present in the data used for such an estimation [49,51]. Since the weight estimation phase is generally performed offline, the related time complexity may be regarded as minor in most application circumstances.
The analysis of the online inference time highlights that it is not necessarily required to search for a trade-off between the computational complexity and performance of the fusion method because these are not always in opposition. Furthermore, in the previous investigation, it is also possible to observe that these would not represent the bottleneck of the deepfake detection system, and therefore the eventually aimed real-time capability will mainly depend on the single classification systems included in the fusion, which generally require a considerably greater inference time (e.g., [52,53,54]). In any case, this applies to the score-level fusion across the analyzed methods, as other, more complex models (e.g., neural networks with multiple layers) could compromise the overall processing time.
In conclusion, the employment of fusion methods appears to be able to exploit the complementarity of state-of-the-art models, thus, making the detection of deepfakes more robust even concerning the bias towards the acquisition sensors and the image features characterizing both deepfakes and the real samples employed in training. Among the explored fusion approaches, the parametric ones revealed greater robustness to the presence of less performing detection systems in the fusion as well as a more noticeable capability of exploiting the complementarity of the single deepfake detector.
Future studies should explore the use of other fusion approaches, such as those based on unsupervised machine-learning models or even deep-learning ones, enriching the analysis through the comparison between score-level and decision-level fusion approaches in improving the generalization capability with respect to the single deepfake detection systems and the effect of the presence of worse-performing detectors on the whole fusion. Furthermore, it should be investigated whether the use of models trained on different types of data and manipulations allows a higher ability to generalize and detect manipulations than what has been seen before.
This study sheds some light on the differences in the effectiveness of various fusion approaches, thereby, paving the way towards the development of a multi-modal deepfake detection system capable of classifying never-seen-before deepfakes to keep up with the evolution of this threat to our society.
Author Contributions
Conceptualization, G.L.M.; methodology, S.C., S.M.L.C., C.C. and G.O.; software, S.C. and S.M.L.C.; validation, S.C., S.M.L.C. and J.G.; formal analysis, S.C., S.M.L.C. and G.O.; investigation, S.C., S.M.L.C. and G.O.; writing—original draft preparation, S.C., S.M.L.C. and G.O.; writing—review and editing, S.C., S.M.L.C., G.O. and G.L.M.; supervision, G.O., X.F., G.L.M. and F.R. All authors have read and agreed to the published version of the manuscript.
Funding
This work was supported by the Italian Ministry of Education, University and Research (MIUR) within the PRIN2017-BullyBuster—A framework for bullying and cyberbullying action detection by computer vision and artificial intelligence methods and algorithms (CUP: F74I19000370001).
Data Availability Statement
The data presented in this study are available on request at https://dfdc.ai/login (DFDC) and https://docs.google.com/forms/d/e/1FAIpQLSdRRR3L5zAv6tQ_CKxmK4W96tAab_pfBu2EKAgQbeDVhmXagg/viewform (FF++) (accessed on 11 July 2022).
Conflicts of Interest
The authors declare no conflict of interest.
Abbreviations
The following abbreviations are used in this manuscript:
| FLOPS | FLoating point Operations Per Second |
| PCC | Pearson Correlation Coefficient |
| RBF | Radial Basis Function |
| MI | Mutual Information |
| MLP | Multilayer Perceptron |
| SVM | Support Vector Machine |
| Complement NB | Complement Naive Bayes |
| FF++ | FaceForensics++ |
| DFDC | Deepfake Detection Challenge |
| GAN | Generative Adversarial Network |
| FPR | False Positive Rate |
| TPR | True Positive Rate |
| FNR | False Negative Rate |
| ROC | Receiver Operating Characteristic |
| AUC | Area Under the Curve |
| EER | Equal Error Rate |
| avg | average fusion rule |
| Bayes | Bayesian fusion rule |
| prod | Product fusion rule |
| max | maximum fusion rule |
| min | minimum fusion rule |
References
- Yu, P.; Xia, Z.; Fei, J.; Lu, Y. A survey on deepfake video detection. IET Biom. 2021, 10, 607–624. [Google Scholar] [CrossRef]
- Yadav, D.; Salmani, S. Deepfake: A survey on facial forgery technique using generative adversarial network. In Proceedings of the 2019 International Conference on Intelligent Computing and Control Systems (ICCS), Madurai, India, 15–17 May 2019; pp. 852–857. [Google Scholar]
- Chesney, B.; Citron, D. Deep fakes: A looming challenge for privacy, democracy, and national security. Calif. L. Rev. 2019, 107, 1753. [Google Scholar] [CrossRef] [Green Version]
- Feldstein, S. How artificial intelligence systems could threaten democracy. Conversation 2019. [Google Scholar]
- Delfino, R.A. Pornographic deepfakes: The case for federal criminalization of revenge porn’s next tragic act. Actual Probs. Econ. L. 2020, 105. [Google Scholar] [CrossRef]
- Zi, B.; Chang, M.; Chen, J.; Ma, X.; Jiang, Y.G. WildDeepfake: A Challenging Real-World Dataset for Deepfake Detection. In Proceedings of the 28th ACM International Conference on Multimedia, Virtual, Seattle, WA, USA,, 12–16 October 2020; pp. 2382–2390. [Google Scholar] [CrossRef]
- Zhang, T. Deepfake generation and detection, a survey. Multimed. Tools Appl. 2022, 81, 6259–6276. [Google Scholar] [CrossRef]
- Tolosana, R.; Romero-Tapiador, S.; Vera-Rodriguez, R.; Gonzalez-Sosa, E.; Fierrez, J. DeepFakes detection across generations: Analysis of facial regions, fusion, and performance evaluation. Eng. Appl. Artif. Intell. 2022, 110, 104673. [Google Scholar] [CrossRef]
- Rana, M.S.; Sung, A.H. DeepfakeStack: A Deep Ensemble-based Learning Technique for Deepfake Detection. In Proceedings of the 2020 seventh IEEE CSCloud/2020 Sixth IEEE EdgeCom, New York, NY, USA, 1–3 August 2020; pp. 70–75. [Google Scholar] [CrossRef]
- Concas, S.; Gao, J.; Cuccu, C.; Orrù, G.; Feng, X.; Marcialis, G.L.; Puglisi, G.; Roli, F. Experimental Results on Multi-modal Deepfake Detection. In Proceedings of the Image Analysis and Processing—ICIAP 2022; Sclaroff, S., Distante, C., Leo, M., Farinella, G.M., Tombari, F., Eds.; Springer: Cham, Switzerland, 2022; pp. 164–175. [Google Scholar]
- Tolosana, R.; Vera-Rodriguez, R.; Fierrez, J.; Morales, A.; Ortega-Garcia, J. Deepfakes and beyond: A Survey of face manipulation and fake detection. Inf. Fusion 2020, 64, 131–148. [Google Scholar] [CrossRef]
- Afchar, D.; Nozick, V.; Yamagishi, J.; Echizen, I. MesoNet: A Compact Facial Video Forgery Detection Network. In Proceedings of the 2018 IEEE International Workshop on Information Forensics and Security (WIFS), Hong Kong, China, 11–13 December 2018; pp. 1–7. [Google Scholar] [CrossRef] [Green Version]
- Marra, F.; Gragnaniello, D.; Cozzolino, D.; Verdoliva, L. Detection of GAN-Generated Fake Images over Social Networks. In Proceedings of the 2018 IEEE Conference on Multimedia Information Processing and Retrieval (MIPR), Miami, FL, USA, 12 April 2018; pp. 384–389. [Google Scholar] [CrossRef]
- Khalid, H.; Woo, S.S. OC-FakeDect: Classifying Deepfakes Using One-class Variational Autoencoder. In Proceedings of the 2020 IEEE/CVF Conference on Computer Vision and Pattern Recognition Workshops (CVPRW), Seattle, WA, USA, 14–19 June 2020; pp. 2794–2803. [Google Scholar] [CrossRef]
- Li, Y.; Lyu, S. Exposing DeepFake Videos By Detecting Face Warping Artifacts. In Proceedings of the IEEE Conference on Computer Vision and Pattern Recognition Workshops (CVPRW), Long Beach, CA, USA, 16–17 June 2019. [Google Scholar]
- Li, L.; Bao, J.; Zhang, T.; Yang, H.; Chen, D.; Wen, F.; Guo, B. Face X-Ray for More General Face Forgery Detection. In Proceedings of the IEEE/CVF Conference on Computer Vision and Pattern Recognition, Seattle, WA, USA, 13–19 June 2020; pp. 5000–5009. [Google Scholar] [CrossRef]
- Korshunov, P.; Marcel, S. Speaker Inconsistency Detection in Tampered Video. In Proceedings of the 2018 26th European Signal Processing Conference (EUSIPCO), Roma, Italy, 3–7 September 2018; pp. 2375–2379. [Google Scholar] [CrossRef] [Green Version]
- Agarwal, S.; Farid, H.; Gu, Y.; He, M.; Nagano, K.; Li, H. Protecting World Leaders Against Deep Fakes. In Proceedings of the CVPR Workshops, Long Beach, CA, USA, 16–20 June 2019. [Google Scholar]
- Mittal, T.; Bhattacharya, U.; Chandra, R.; Bera, A.; Manocha, D. Emotions Do not Lie: An Audio-Visual Deepfake Detection Method Using Affective Cues. In Proceedings of the 28th ACM International Conference on Multimedia, Seattle, WA, USA, 12–16 October 2020; Association for Computing Machinery: New York, NY, USA, 2020; pp. 2823–2832. [Google Scholar]
- Conotter, V.; Bodnari, E.; Boato, G.; Farid, H. Physiologically-based detection of computer generated faces in video. In Proceedings of the 2014 IEEE International Conference on Image Processing (ICIP), Paris, France, 27–30 October 2014; pp. 248–252. [Google Scholar] [CrossRef] [Green Version]
- Hernandez-Ortega, J.; Tolosana, R.; Fierrez, J.; Morales, A. DeepFakes Detection Based on Heart Rate Estimation: Single- and Multi-frame. In Handbook of Digital Face Manipulation and Detection: From DeepFakes to Morphing Attacks; Rathgeb, C., Tolosana, R., Vera-Rodriguez, R., Busch, C., Eds.; Springer: Cham, Switzerland, 2022; pp. 255–273. [Google Scholar] [CrossRef]
- Yu, N.; Davis, L.; Fritz, M. Attributing Fake Images to GANs: Learning and Analyzing GAN Fingerprints. In Proceedings of the 2019 IEEE/CVF International Conference on Computer Vision (ICCV), Seoul, Korea, 27 October–2 November 2019; pp. 7555–7565. [Google Scholar]
- Marra, F.; Gragnaniello, D.; Verdoliva, L.; Poggi, G. Do GANs Leave Artificial Fingerprints? In Proceedings of the 2019 IEEE Conference on Multimedia Information Processing and Retrieval (MIPR), San Jose, CA, USA, 28–30 March 2019; pp. 506–511. [Google Scholar]
- He, K.; Zhang, X.; Ren, S.; Sun, J. Deep Residual Learning for Image Recognition. In Proceedings of the 2016 IEEE Conference on Computer Vision and Pattern Recognition (CVPR), Las Vegas, NV, USA, 27–30 June 2016; pp. 770–778. [Google Scholar] [CrossRef] [Green Version]
- Rössler, A.; Cozzolino, D.; Verdoliva, L.; Riess, C.; Thies, J.; Niessner, M. FaceForensics++: Learning to Detect Manipulated Facial Images. In Proceedings of the ICCV 2019, Seoul, Korea, 27 October–2 November 2019; pp. 1–11. [Google Scholar] [CrossRef] [Green Version]
- Bonettini, N.; Cannas, E.D.; Mandelli, S.; Bondi, L.; Bestagini, P.; Tubaro, S. Video Face Manipulation Detection Through Ensemble of CNNs. In Proceedings of the 2020 25th International Conference on Pattern Recognition (ICPR), Milan, Italy, 10–15 January 2021; pp. 5012–5019. [Google Scholar] [CrossRef]
- Ross, A.; Nandakumar, K. Fusion, Score-Level. In Encyclopedia of Biometrics; Li, S.Z., Jain, A., Eds.; Springer: Boston, MA, USA, 2009; pp. 611–616. [Google Scholar] [CrossRef]
- Noore, A.; Singh, R.; Vasta, M. Fusion, Sensor-Level. In Encyclopedia of Biometrics; Li, S.Z., Jain, A., Eds.; Springer: Boston, MA, USA, 2009; pp. 616–621. [Google Scholar] [CrossRef]
- Osadciw, L.; Veeramachaneni, K. Fusion, Decision-Level. In Encyclopedia of Biometrics; Li, S.Z., Jain, A., Eds.; Springer: Boston, MA, USA, 2009; pp. 593–597. [Google Scholar] [CrossRef]
- Sun, F.; Zhang, N.; Xu, P.; Song, Z. Deepfake Detection Method Based on Cross-Domain Fusion. Secur. Commun. Netw. 2021, 2021, 2482942. [Google Scholar] [CrossRef]
- Zhao, L.; Zhang, M.; Ding, H.; Cui, X. MFF-Net: Deepfake Detection Network Based on Multi-Feature Fusion. Entropy 2021, 23, 1692. [Google Scholar] [CrossRef]
- Zhao, Z.; Wang, P.; Lu, W. Multi-Layer Fusion Neural Network for Deepfake Detection. Int. J. Digit. Crime Forensics 2021, 13, 26–39. [Google Scholar] [CrossRef]
- Tao, Q. Face Verification for Mobile Personal Devices; University of Twente: Enschede, The Netherlands, 2009. [Google Scholar]
- Sim, H.M.; Asmuni, H.; Hassan, R.; Othman, R.M. Multimodal biometrics: Weighted score level fusion based on non-ideal iris and face images. Expert Syst. Appl. 2014, 41, 5390–5404. [Google Scholar] [CrossRef]
- Peng, J.; Abd El-Latif, A.A.; Li, Q.; Niu, X. Multimodal biometric authentication based on score level fusion of finger biometrics. Optik 2014, 125, 6891–6897. [Google Scholar] [CrossRef]
- Dass, S.C.; Nandakumar, K.; Jain, A.K. A principled approach to score level fusion in multimodal biometric systems. In Proceedings of the International Conference on Audio-and Video-Based Biometric Person Authentication, Hilton Rye Town, NY, USA, 20–22 July 2005; Springer: Berlin/Heidelberg, Germany, 2005; pp. 1049–1058. [Google Scholar]
- Duda, R.O.; Hart, P.E.; Stork, D.G. Pattern Classification; John Wiley & Sons: Hoboken, NJ, USA, 2006. [Google Scholar]
- Kabir, W.; Ahmad, M.O.; Swamy, M. Score reliability based weighting technique for score-level fusion in multi-biometric systems. In Proceedings of the 2016 IEEE Winter Conference on Applications of Computer Vision (WACV), Lake Placid, NY, USA, 7–10 March 2016; pp. 1–7. [Google Scholar]
- Snelick, R.; Uludag, U.; Mink, A.; Indovina, M.; Jain, A. Large-scale evaluation of multimodal biometric authentication using state-of-the-art systems. IEEE Trans. Pattern Anal. Mach. Intell. 2005, 27, 450–455. [Google Scholar] [CrossRef]
- Chia, C.; Sherkat, N.; Nolle, L. Towards a best linear combination for multimodal biometric fusion. In Proceedings of the 2010 20th International Conference on Pattern Recognition, Istanbul, Turkey, 23–26 August 2010; pp. 1176–1179. [Google Scholar]
- Poh, N.; Bengio, S. A Study of the Effects of Score Normalisation Prior to Fusion in Biometric Authentication Tasks. Technical Report, IDIAP. 2004. Available online: https://infoscience.epfl.ch/record/83130 (accessed on 18 June 2022).
- Kraskov, A.; Stögbauer, H.; Grassberger, P. Estimating mutual information. Phys. Rev. E 2004, 69, 066138. [Google Scholar] [CrossRef] [Green Version]
- Ross, B.C. Mutual information between discrete and continuous data sets. PLoS ONE 2014, 9, e87357. [Google Scholar] [CrossRef] [PubMed]
- Kozachenko, L.F.; Leonenko, N.N. Sample estimate of the entropy of a random vector. Probl. Peredachi Informatsii 1987, 23, 9–16. [Google Scholar]
- Kingma, D.P.; Ba, J. Adam: A method for stochastic optimization. arXiv 2014, arXiv:1412.6980. [Google Scholar]
- Rennie, J.D.; Shih, L.; Teevan, J.; Karger, D.R. Tackling the poor assumptions of naive bayes text classifiers. In Proceedings of the 20th International Conference on Machine Learning (ICML-03), Washington, DC, USA, 21–24 August 2003; pp. 616–623. [Google Scholar]
- Dolhansky, B.; Bitton, J.; Pflaum, B.; Lu, J.; Howes, R.; Wang, M.; Ferrer, C.C. The DeepFake Detection Challenge Dataset. arXiv 2020, arXiv:2006.07397. [Google Scholar]
- Cohen, J. Statistical Power Analysis for the Behavioral Sciences, 2nd ed.; Routledge: New York, New York, 1988. [Google Scholar]
- He, M.; Horng, S.J.; Fan, P.; Run, R.S.; Chen, R.J.; Lai, J.L.; Khan, M.K.; Sentosa, K.O. Performance evaluation of score level fusion in multimodal biometric systems. Pattern Recognit. 2010, 43, 1789–1800. [Google Scholar] [CrossRef]
- Horng, S.J.; Chen, Y.H.; Run, R.S.; Chen, R.J.; Lai, J.L.; Sentosal, K.O. An improved score level fusion in multimodal biometric systems. In Proceedings of the 2009 International Conference on Parallel and Distributed Computing, Applications and Technologies, Higashihiroshima, Japan, 8–11 December 2009; pp. 239–246. [Google Scholar]
- Abderrahmane, H.; Noubeil, G.; Lahcene, Z.; Akhtar, Z.; Dasgupta, D. Weighted quasi-arithmetic mean based score level fusion for multi-biometric systems. IET Biom. 2020, 9, 91–99. [Google Scholar] [CrossRef]
- Bianco, S.; Cadene, R.; Celona, L.; Napoletano, P. Benchmark analysis of representative deep neural network architectures. IEEE Access 2018, 6, 64270–64277. [Google Scholar] [CrossRef]
- Afzaal, H.; Farooque, A.A.; Schumann, A.W.; Hussain, N.; McKenzie-Gopsill, A.; Esau, T.; Abbas, F.; Acharya, B. Detection of a potato disease (early blight) using artificial intelligence. Remote Sens. 2021, 13, 411. [Google Scholar] [CrossRef]
- Yakkati, R.R.; Yeduri, S.R.; Cenkeramaddi, L.R. Hand Gesture Classification Using Grayscale Thermal Images and Convolutional Neural Network. In Proceedings of the 2021 IEEE International Symposium on Smart Electronic Systems (iSES) (Formerly iNiS), Jaipur, India, 18–22 December 2021; pp. 111–116. [Google Scholar]
Publisher’s Note: MDPI stays neutral with regard to jurisdictional claims in published maps and institutional affiliations. |
© 2022 by the authors. Licensee MDPI, Basel, Switzerland. This article is an open access article distributed under the terms and conditions of the Creative Commons Attribution (CC BY) license (https://creativecommons.org/licenses/by/4.0/).