Article

Pavement Surface Defect Detection Using Mask Region-Based Convolutional Neural Networks and Transfer Learning

1
School of Civil and Transportation Engineering, Guangdong University of Technology, Guangzhou 510006, China
2
Guangzhou Municipal Engineering Testing Co., Ltd., Guangzhou 510520, China
3
Institute of High Performance Computing, A*STAR (Agency for Science, Technology and Research), Singapore 138632, Singapore
*
Author to whom correspondence should be addressed.
Appl. Sci. 2022, 12(15), 7364; https://doi.org/10.3390/app12157364
Submission received: 26 May 2022 / Revised: 15 July 2022 / Accepted: 19 July 2022 / Published: 22 July 2022

Abstract

:
Pavement defect detection is critical for pavement maintenance and management. Meanwhile, the accurate and timely detection of pavement defects in complex backgrounds is a huge challenge for maintenance work. Therefore, this paper used a mask region-based convolutional neural network (Mask R-CNN) and transfer learning to detect pavement defects in complex backgrounds. Twelve hundred pavement images were collected, and a dataset containing corresponding instance labels of the defects was established. Based on this dataset, the performance of the Mask R-CNN was compared with faster region-based convolutional neural networks (Faster R-CNNs) under the transfer of six well-known backbone networks. The results confirmed that the classification accuracy of the two algorithms (Mask R-CNN and Faster R-CNN) was consistent and reached 100%; however, the average precision (AP) of the Mask R-CNN was higher than that of Faster R-CNNs. Meanwhile, the testing time of the models using a feature pyramid network (FPN) was lower than that of other models, which reached 0.21 s per frame (SPF). On this basis, the segmentation performance of the Mask R-CNN was further analyzed at three learning rates (LRs). The Mask R-CNN performed best with ResNet101 plus FPN as its backbone structure, and its AP reached 92.1%. The error rate of defect quantification was between 4% and 16%. It has an ideal detection effect on multi-object and multi-class defects on pavement surfaces, and the quantitative results of the defects can provide a reference for pavement maintenance personnel.

1. Introduction

The timely and accurate detection of pavement surface defects is an important and hot topic in pavement maintenance. Recently, due to the long-term exposure to traffic loads and the natural environment, pavement defects are impossible to avoid. In order to avoid the loss caused by the vicious development of defects, the timely detection and maintenance of pavements is a key task [1]. Cracks and potholes are common pavement defects, and image processing techniques [2,3,4,5,6] are used to detect pavement cracks in relevant early studies, e.g., edge detection, area growth, wavelet transformation, and other techniques [7,8,9,10,11,12,13,14,15]. Jahanshahi et al. [16] segmented the edges of the cracks by morphological operations to obtain the actual size of the cracks. Chen et al. [17] proposed a novel crack detection method based on local binary patterns and SVM to realize tiny crack detection. Jahanshahi et al. [18] detect cracks in 3D scenes through depth perception. These methods can obtain detailed information on cracks and then extract features through prior knowledge. Due to the complex backgrounds and serious noise, these methods have some disadvantages, such as poor adaptability and robustness for crack detection. With the rapid development of deep learning, there are more and more algorithms with strong adaptability and robustness [19,20]. For example, deep learning algorithms for image classification, object detection, and semantic segmentation have been applied to crack detection [21,22,23,24,25,26,27,28]. Wang et al. [29] proposed an algorithm for the automatic classification of pavement cracks based on a convolutional neural network (CNN). Cha et al. [30] proposed a vision-based approach that used a CNN to detect concrete cracks. Insufficient datasets will lead to low accuracy of the model. Wu et al. [31] proposed a method for surface crack detection based on image stitching and transfer learning [32], which solved the problem of insufficient datasets. However, the above study shows that the image classification algorithm of the cracks can only determine whether there are defects in an image but not detect the location of the defects in the image.
With the development of excellent algorithms for object detection, such as R-CNN (region-based convolutional neural network), Fast R-CNN, YOLO [33,34], and Faster R-CNN, the problem of detecting the location of defects in the image is solved. Uijlings et al. [35] introduced a selective search method and solved the problem of generating possible object locations in object detection. In the process of generating a target box of the defect, it is critical to accurately extract the feature map of the defect. Teng et al. [36] compared the performance of 11 feature extractors on a YOLO_V2 in bridge crack detection to obtain an optimal crack location detection model. Wang et al. [37] proposed a novel area-based R-CNN crack detector, which overcame the problem of insufficient crack detection outside the plane. Due to the problems of the inefficiency and large memory occupied by the R-CNN, Girshick et al. [38] proposed an object detection algorithm based on the Fast R-CNN to improve its speed [39]. The detection speed also deserves attention. Ren et al. [40] introduced the region proposal network (RPN) into the Fast R-CNN to build a Faster R-CNN model, which improved both the detection accuracy and speed. Xue et al. [39] proposed a classification and detection method based on the Faster R-CNN for tunnel lining defects. In order to achieve real-time detection of multiple classes of defects, Cha et al. [41] proposed a visual detection method based on the Faster R-CNN, which was applied to five kinds of defect detection (concrete cracks and steel rusts). With the refined development of maintenance work, only the location detection of defects cannot meet the actual engineering demands.
Pixel information on the pavement defects provides a guiding effect on the implementation of maintenance work [42]. Therefore, more and more researchers are turning to semantic segmentation methods [43,44,45] to achieve the pixel analysis of pavement defects, marking each pixel with a predictive label to quantify the defects. Shelhamer et al. [46] proposed a fully convolutional network (FCN) that combines the semantic information from the deep layers with detailed appearance information from shallow layers to make segmented predictions for each pixel. Yang et al. [47] applied the FCN to crack the detection, which can detect cracks at the pixel level. Dung et al. [48] used the FCN to detect 40,000 concrete crack images, which can accurately evaluate the density of the cracks. Considering the needs of practical engineering, the detection of multiple defects is necessary. Li et al. [49] studied a multi-defect detection method for concrete structures based on transfer learning and FCN, which can detect multiple concrete defects at the pixel level in real-world situations. However, although the above segmentation algorithms can accurately segment the pixel information of the defects, they do not have the function of defect localization. For this deficiency, He et al. [50] proposed an instance segmentation model, that is, the Mask R-CNN, which integrates the advantages of object detection and semantic segmentation and realizes the functions of the classification, positioning, and segmentation simultaneously. Huang et al. [51] introduced the Mask R-CNN into crack detection in shield tunnels. Wu et al. [52] used the Mask R-CNN to detect and quantify cracks on a water tank.
However, in the field of pavement engineering, the application of instance segmentation to pavement defects is rare, especially in complex backgrounds for multi-object, multi-class pavement defect detection, and there are currently no public standard datasets on pavement defects. Therefore, in order to solve the problem of pavement defect detection in complex backgrounds, we trained an excellent model to provide a reference for pavement maintenance personnel. The contributions of this paper are as follows: (1) This paper applied the Mask R-CNN and transfer learning to pavement defect detection. (2) Using transfer learning, different backbone structures of Faster R-CNN and Mask R-CNN were compared, and the optimal model for pavement defect detection was obtained. (3) The defect data obtained by using the optimal model to quantify pavement defects can provide reference for pavement maintenance personnel.
The structure of this paper is as follows: In Section 2, the information of the pavement defect dataset is described, the network structure of the Faster R-CNN and Mask R-CNN are introduced, and the concept of transfer learning is expounded. In Section 3, these two algorithms are used to train the dataset, transfer learning is used to compare the performance of each model, and the best model is used to quantify pavement defects. In Section 4, the work is concluded, and the limitations and future research are stated.

2. Experiment and Methods

2.1. Experimental Setup and Performance Evaluation

The dataset consisted of 1200 RGB images of pavement defects (size: 600 × 600), 960 images of which were used for training, and 240 images were used to test the performance of the network. The defects were divided into four categories, namely transverse cracks (H_crack), longitudinal cracks (P_crack), grid cracks (N_crack), and potholes (P_groove), and the detailed data are shown in Table 1. Figure 1d shows the labelling process of polygonally categorizing a pothole with the labelling tool “Labelme,” and each defect of the dataset was manually annotated at the pixel level.
During training, a multitasking loss (L) was defined, which included classification loss ( L cls ), bounding-box regression ( L box ), and mask loss ( L mask ); the multitasking loss was calculated as Equation (1):
L = L cls + L box + L mask
The multitasking loss was an important metric that determined whether the training process of the Mask R-CNN model was complete. When the loss converged, the training process was considered completed. The accuracy and AP were important metrics for evaluating instance segmentation models [53]. Precision represented the classification effect of the classifier, which was the ratio of true positive instances to the total positive instances (Equation (2)). The recall was the ratio of true positive instances to the sum of true positives and false negatives in the detection (Equation (3)). AP was a combined outcome of the precision and recall metrics (Equation (4)). The same was true for F1 (Equation (5)). Meanwhile, the testing time also needed to be taken into account:
Precision = T P T P + F P × 100 %
Recall = T P T P + F N × 100 %
AP = 0 1 Precision ( Recall )   d ( Recall )
F 1 = 2   ×   Recall × Precision Recall   +   Precision
where TP was the number of positive instances that were correctly predicted, FP was the number of negative instances that were predicted to be positive instances, and FN was the number of positive instances that were predicted to be negative instances. The experiment was conducted on Windows 10 with Pytorch 1.10.0, and the model was trained and tested on an i5-9400F processor and NVIDIA GTX1660 graphics card.

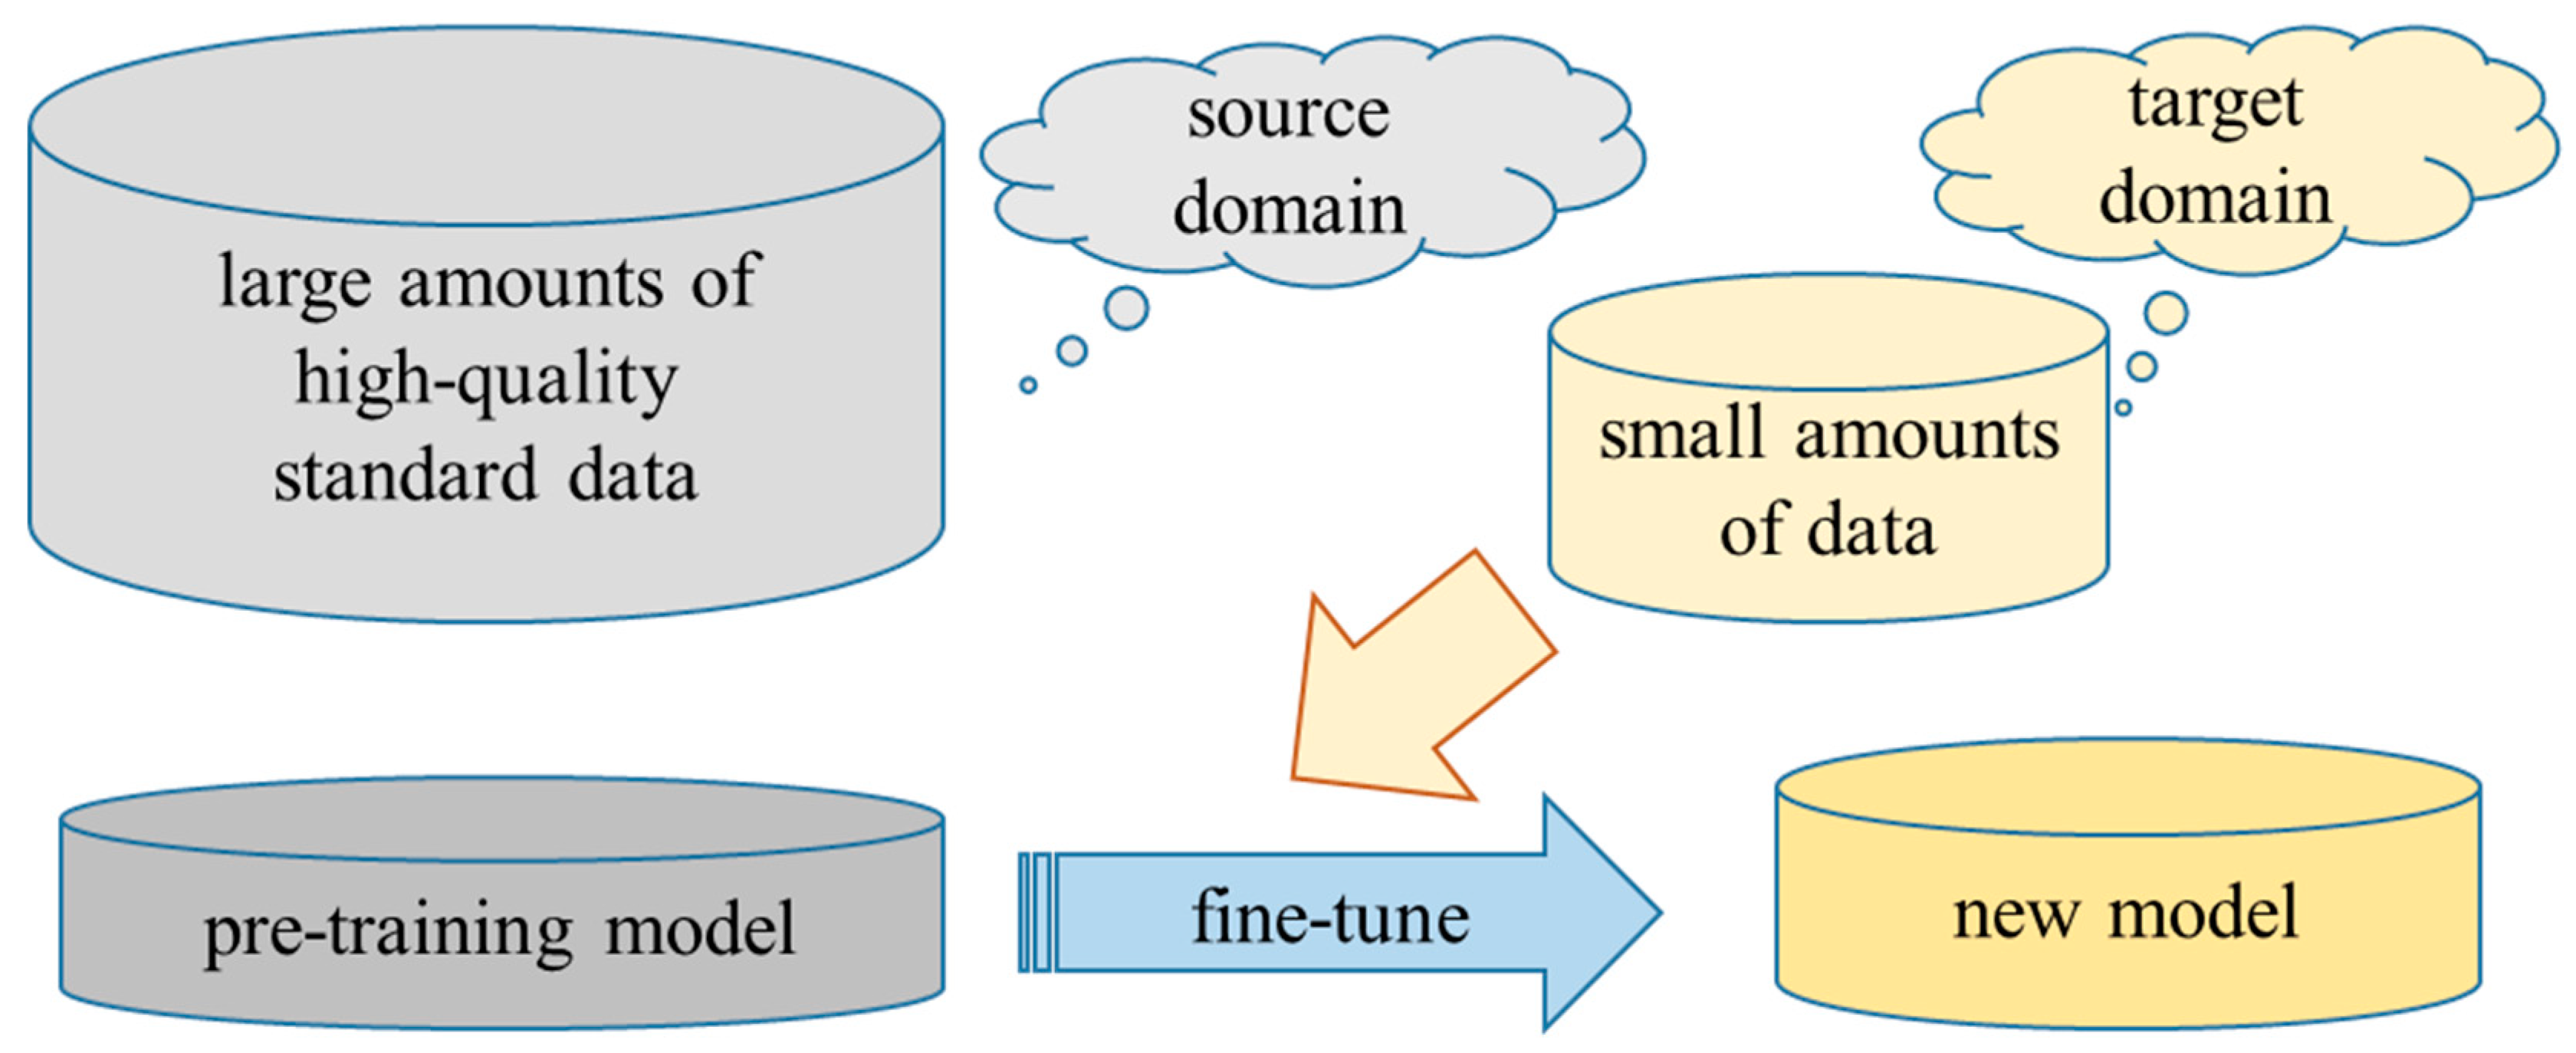
2.2. Transfer Learning

Due to the relatively small number of samples in the target domain, the overfitting problem of the model was prone to occur in the calculation process of the deep convolution neural network. In this study, the pre-training model of the source domain (COCO dataset with a large number of high-quality standard data [54]) was selected, the pre-trained model was employed as the initial weight of a new model and then was fine-tuned in the target domain. After fine-tuning, a new model was generated, as shown in Figure 2.

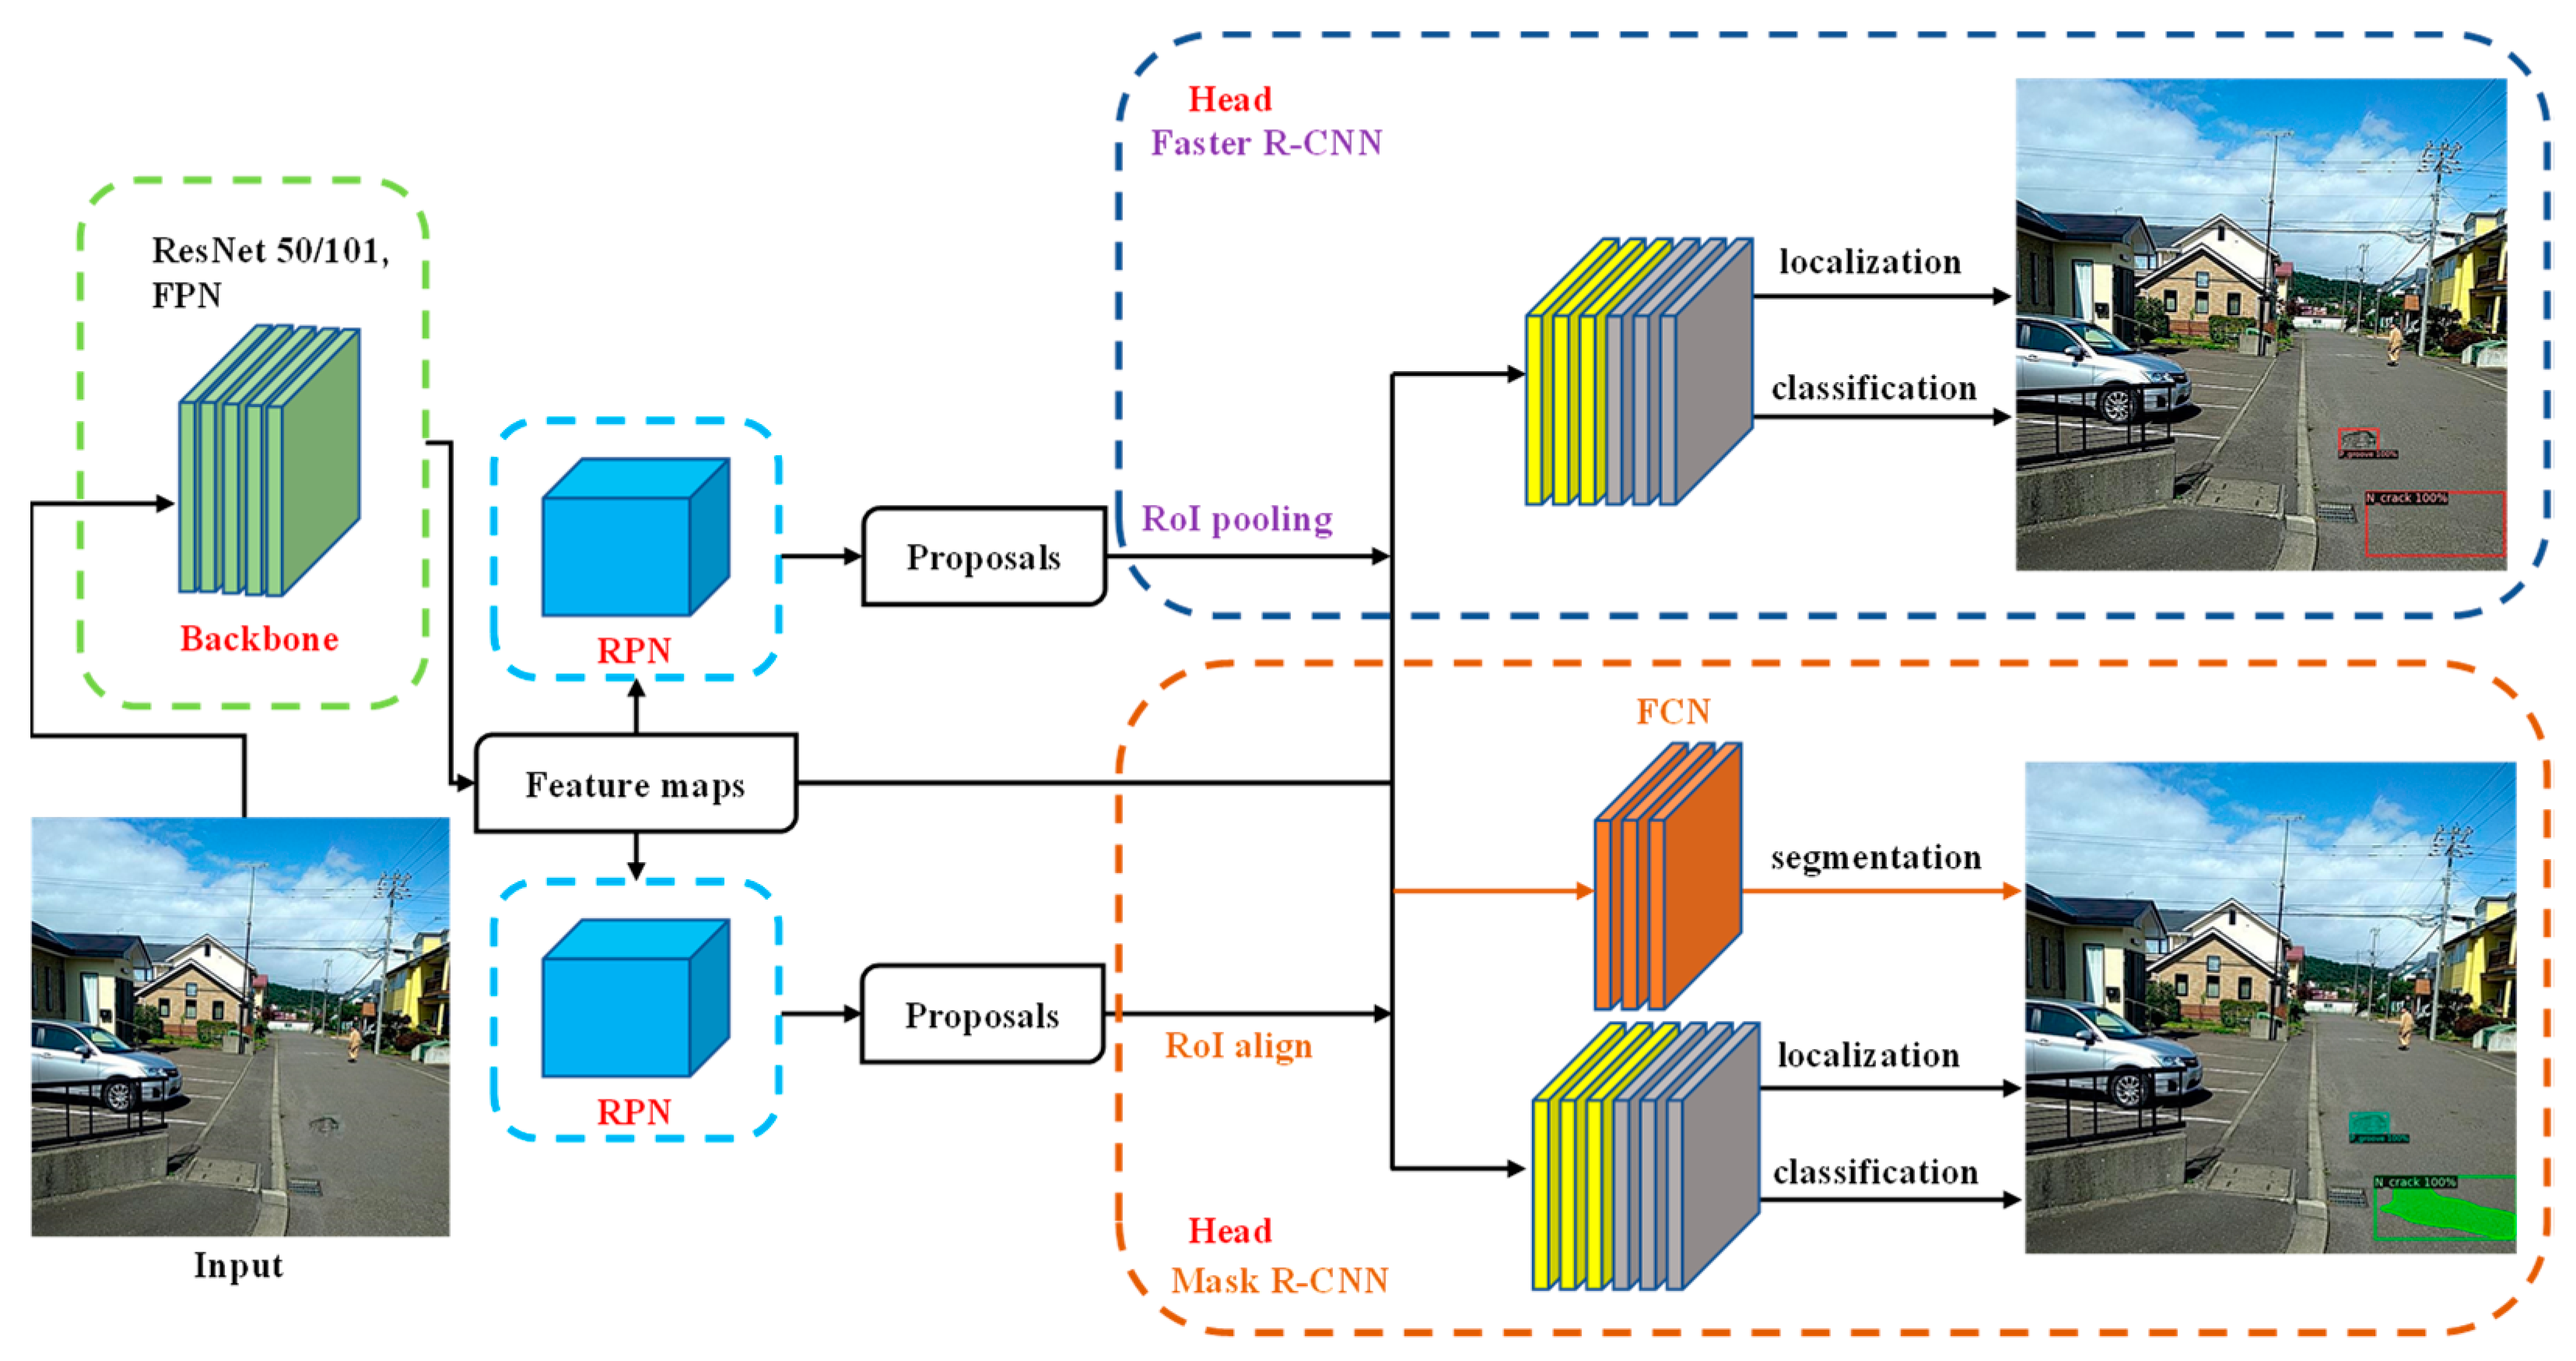
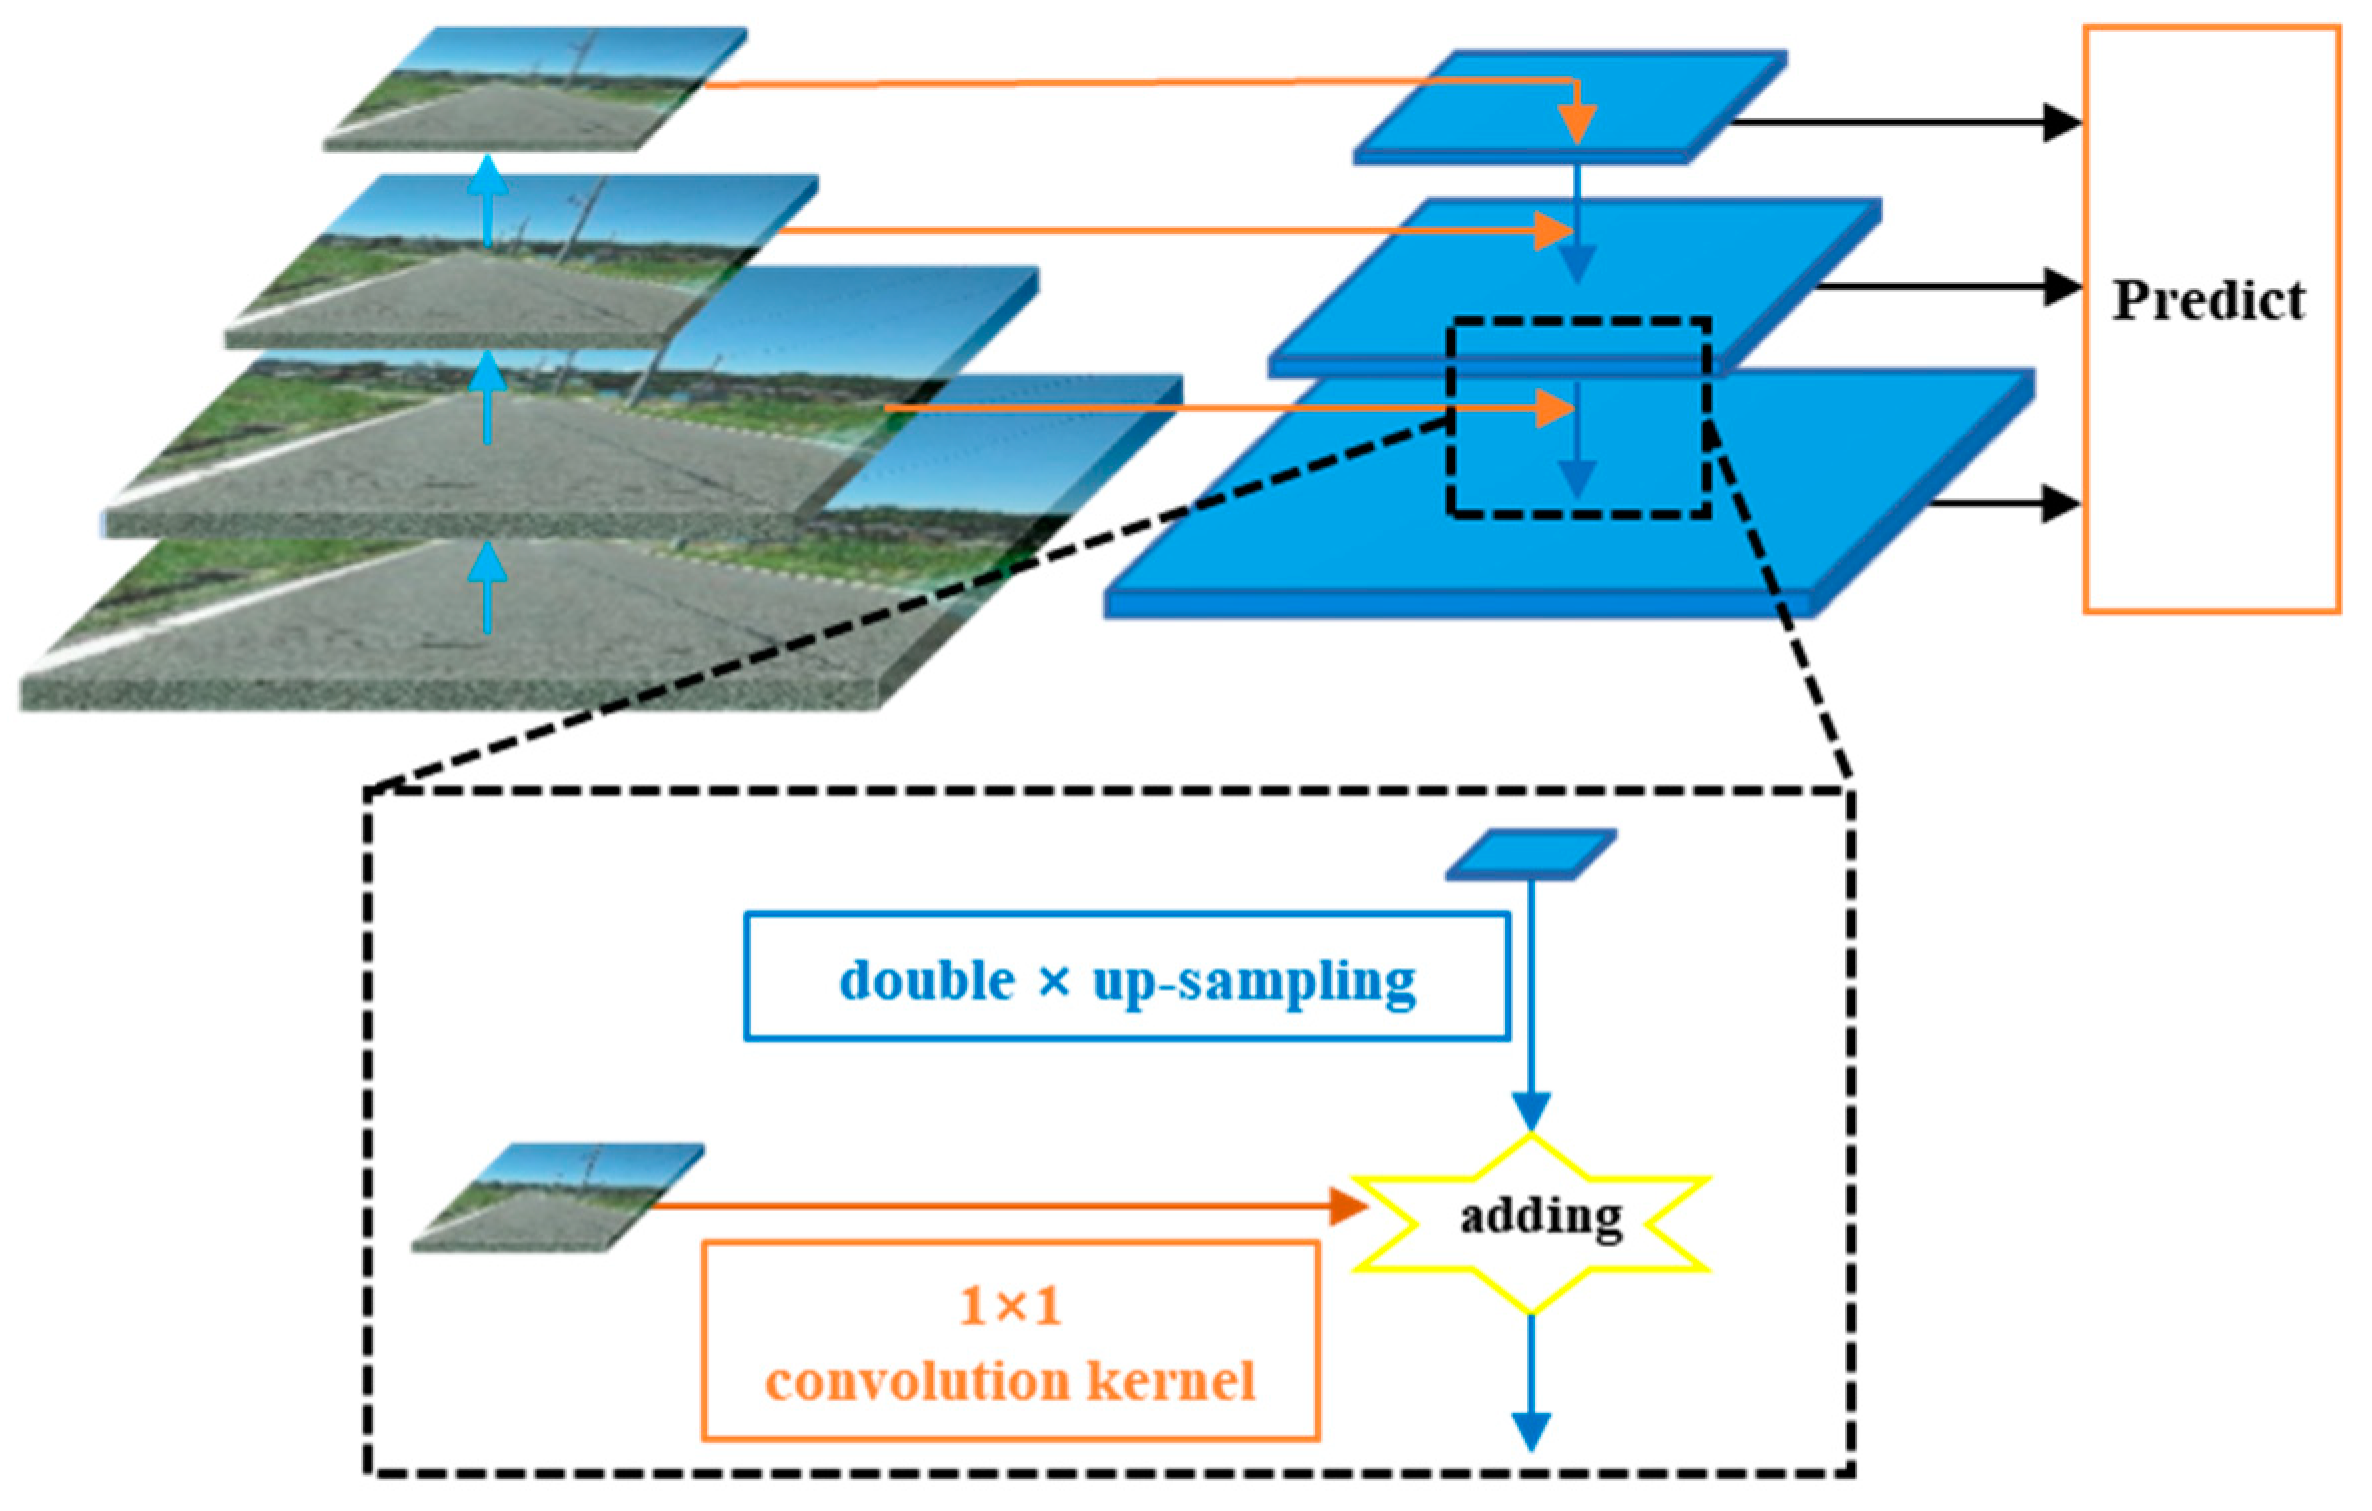
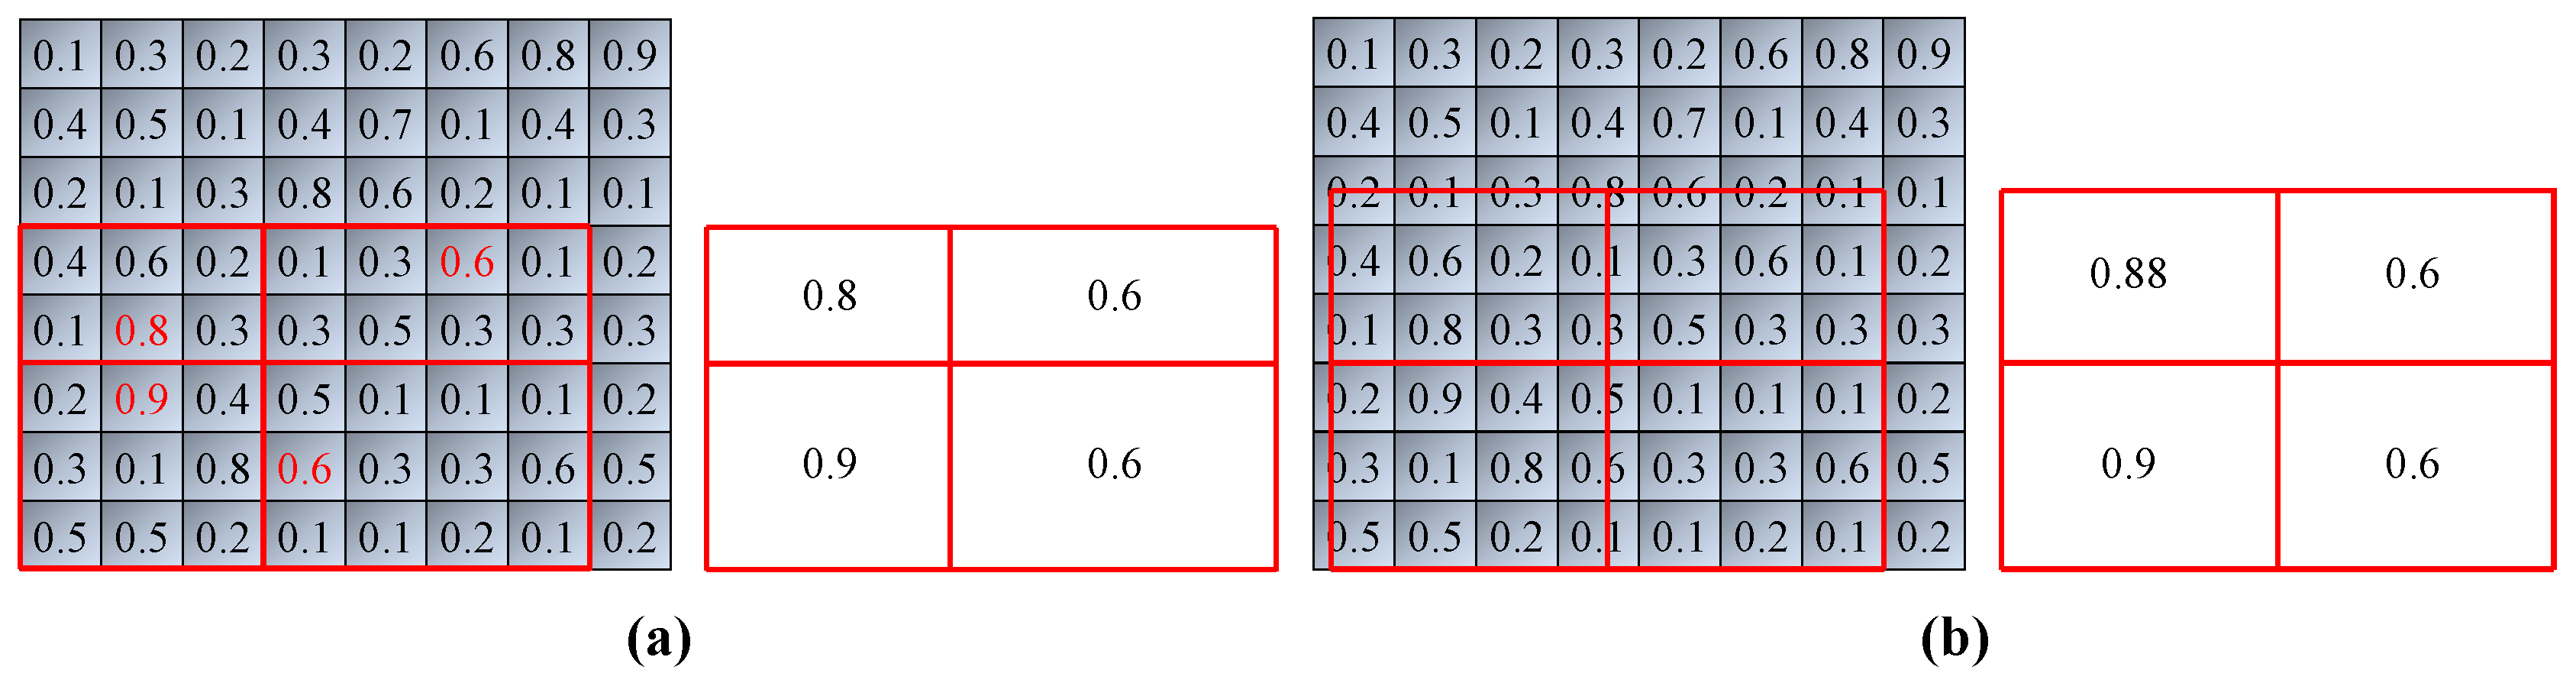
2.3. Structure of Faster R-CNN and Mask R-CNN

The network structure of the Faster R-CNN and Mask R-CNN used in this paper was divided into three parts: backbone structure, RPN, and head structure (Figure 3).
For the pavement defect images, the ResNet and FPN (Figure 4) were used as the backbone network for the Faster R-CNN and Mask R-CNN, which act as a feature extractor and take the generated feature maps into the RPN. A relevant study [55] has shown that the ResNet50 or ResNet101 could solve the problem of gradient disappearance during network training. As defects were usually small relative to the whole image, it was necessary to extract the data information as much as possible in the CNN for the classification, localization, and pixel segmentation of pavement defect detection.
The FPN was divided into three parts: bottom-up, top-down, and lateral connections (Figure 4). The bottom-up connection represented the forward propagation process of the neural network. The characteristic graph usually becomes smaller and smaller after convolution kernel calculation. The top-down process was to up-sample the more abstract and semantic high-level feature map, while the lateral connection was to merge the up-sampling results with the feature map of the same size generated from the bottom-up. The two layers of the features connected horizontally have the same space size, and the lateral connections can make use of the bottom positioning details. The fused feature map was finally used to predict their class and anchor box. The enlarged area in Figure 4 was the lateral connection. The main function of the 1 × 1 convolution kernel here was to reduce the number of feature maps without changing their size. Up-sampling was implemented on the low-resolution feature map by double times. Then, by adding element to element, the up-sampling map was combined with the corresponding bottom-up map. Figure 4 shows that the FPN was used to extract the features of the defects at various levels of dimension, as well as to construct multi-scale feature maps to improve the model performance.
The RPN generated the region proposal boxes on the feature maps. As the input size of the fully connected layer needed to be consistent, the Fast R-CNN used the region of interest (RoI) pooling to transform the feature maps of unequal size into equal-size feature maps after the RPN operation and input them into the fully connected layer for classification. The RoI pooling also sped up the training and testing process and improved the detection accuracy. However, the RoI pooling (Figure 5a) had a shortcoming in segmentation; it would round up the pooling box if the maximum pooling was used(The red numbers are the maximum value in the area), which would cause an error in feature extraction. The RoI align (Figure 5b) was used by the Mask R-CNN to skip the pooling process, and more accurately, floating-point pixel values were obtained by the bilinear interpolation method. The defects would be classified, located, and segmented through an FCN eventually.

3. Results and Discussions

Experiments would validate the superiority of the model by comparing the following aspects: (1) The Faster R-CNN and Mask R-CNN were transferred to detection of pavement defects, and their performance was compared. (2) The performance of the best model in (1) was compared at different LRs. (3) The quantitative results of pavement defects of the optimal model in (2) were analyzed.

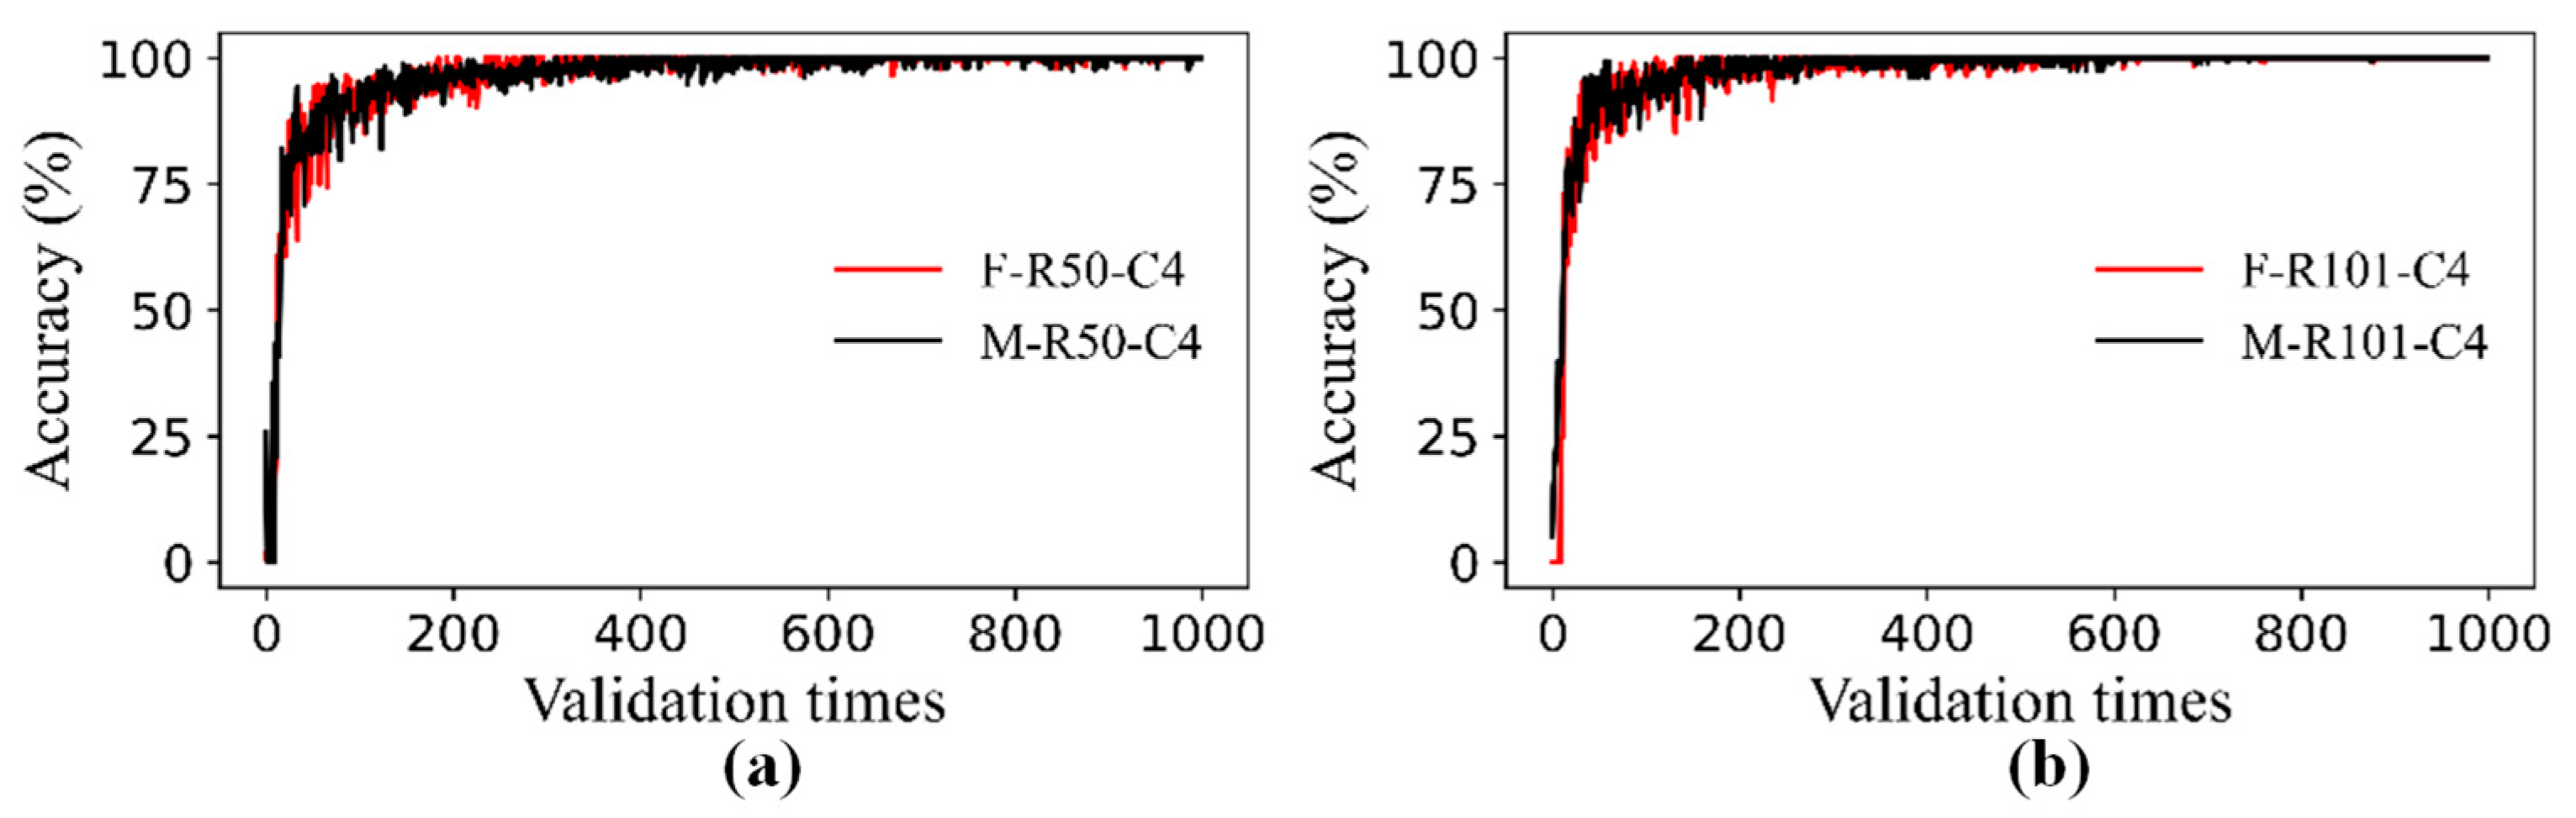
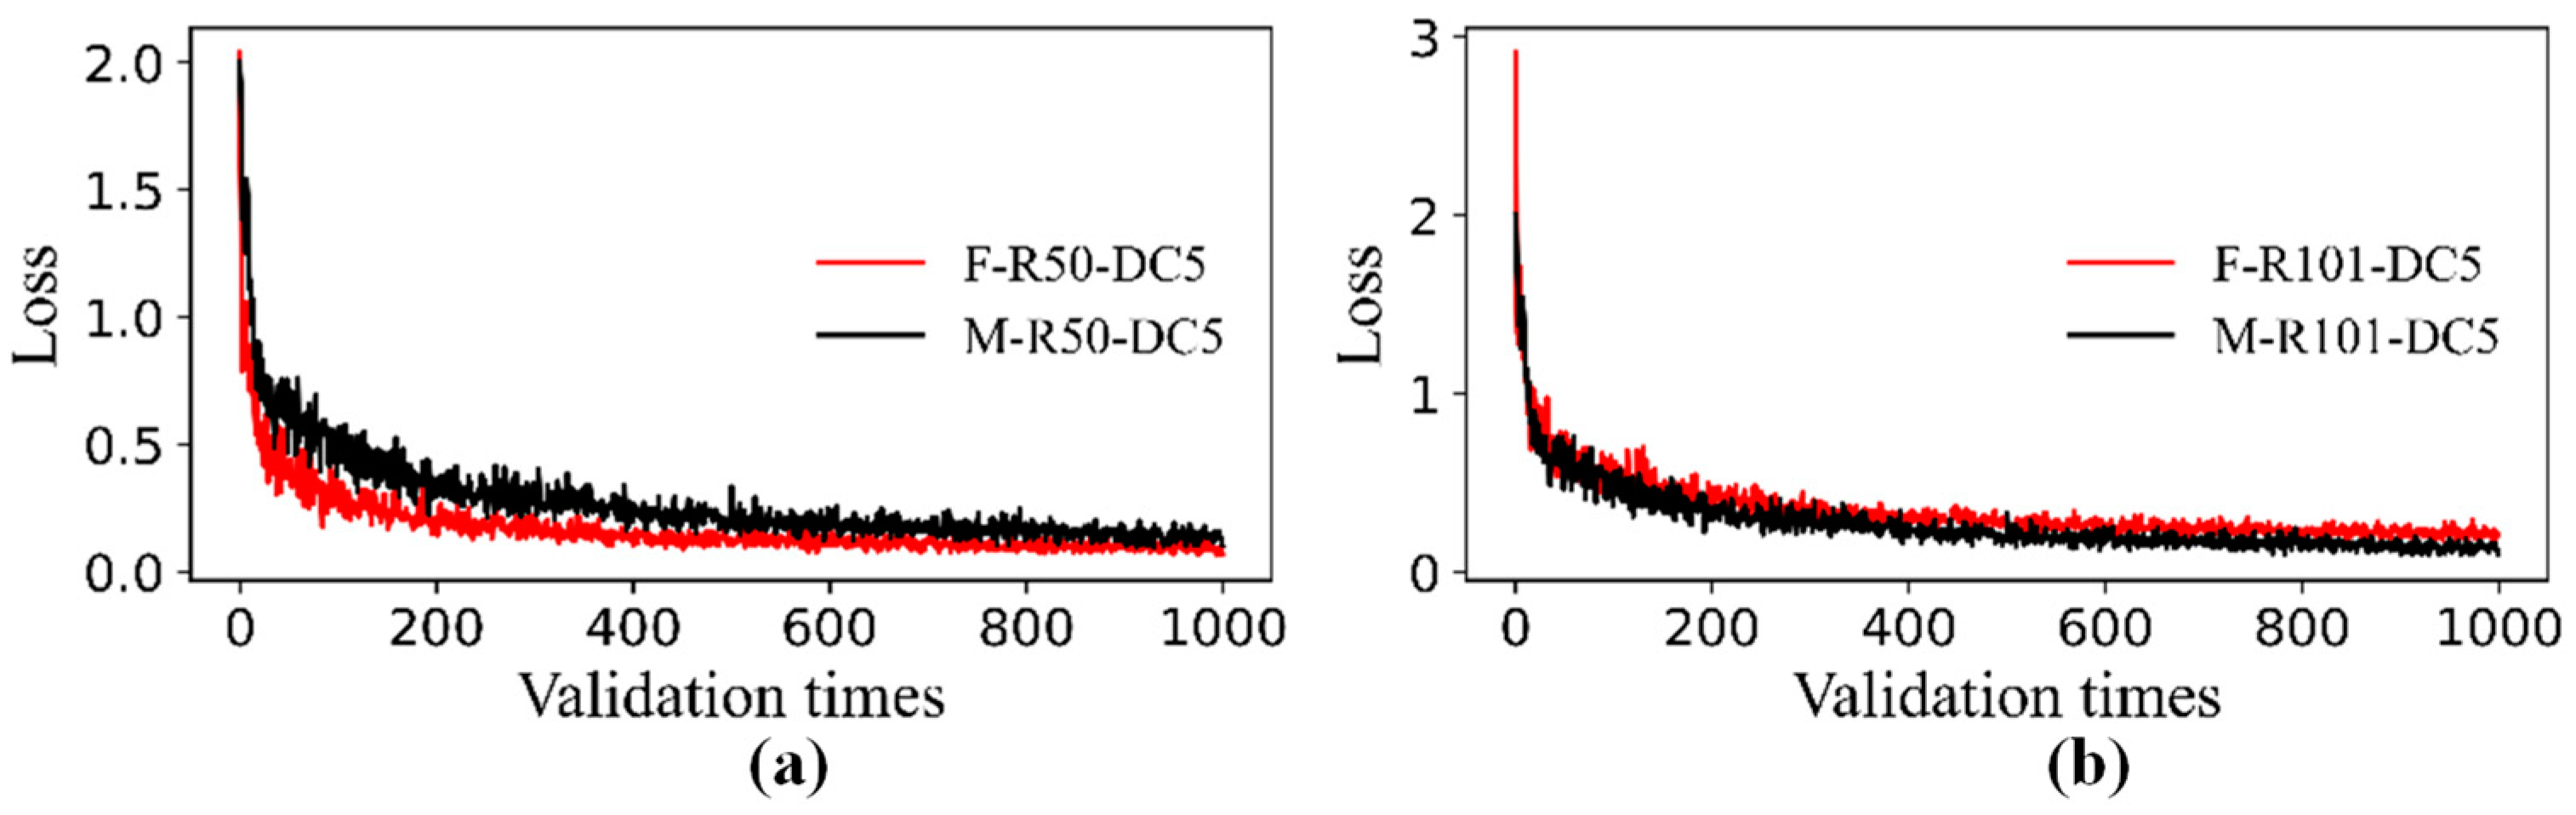
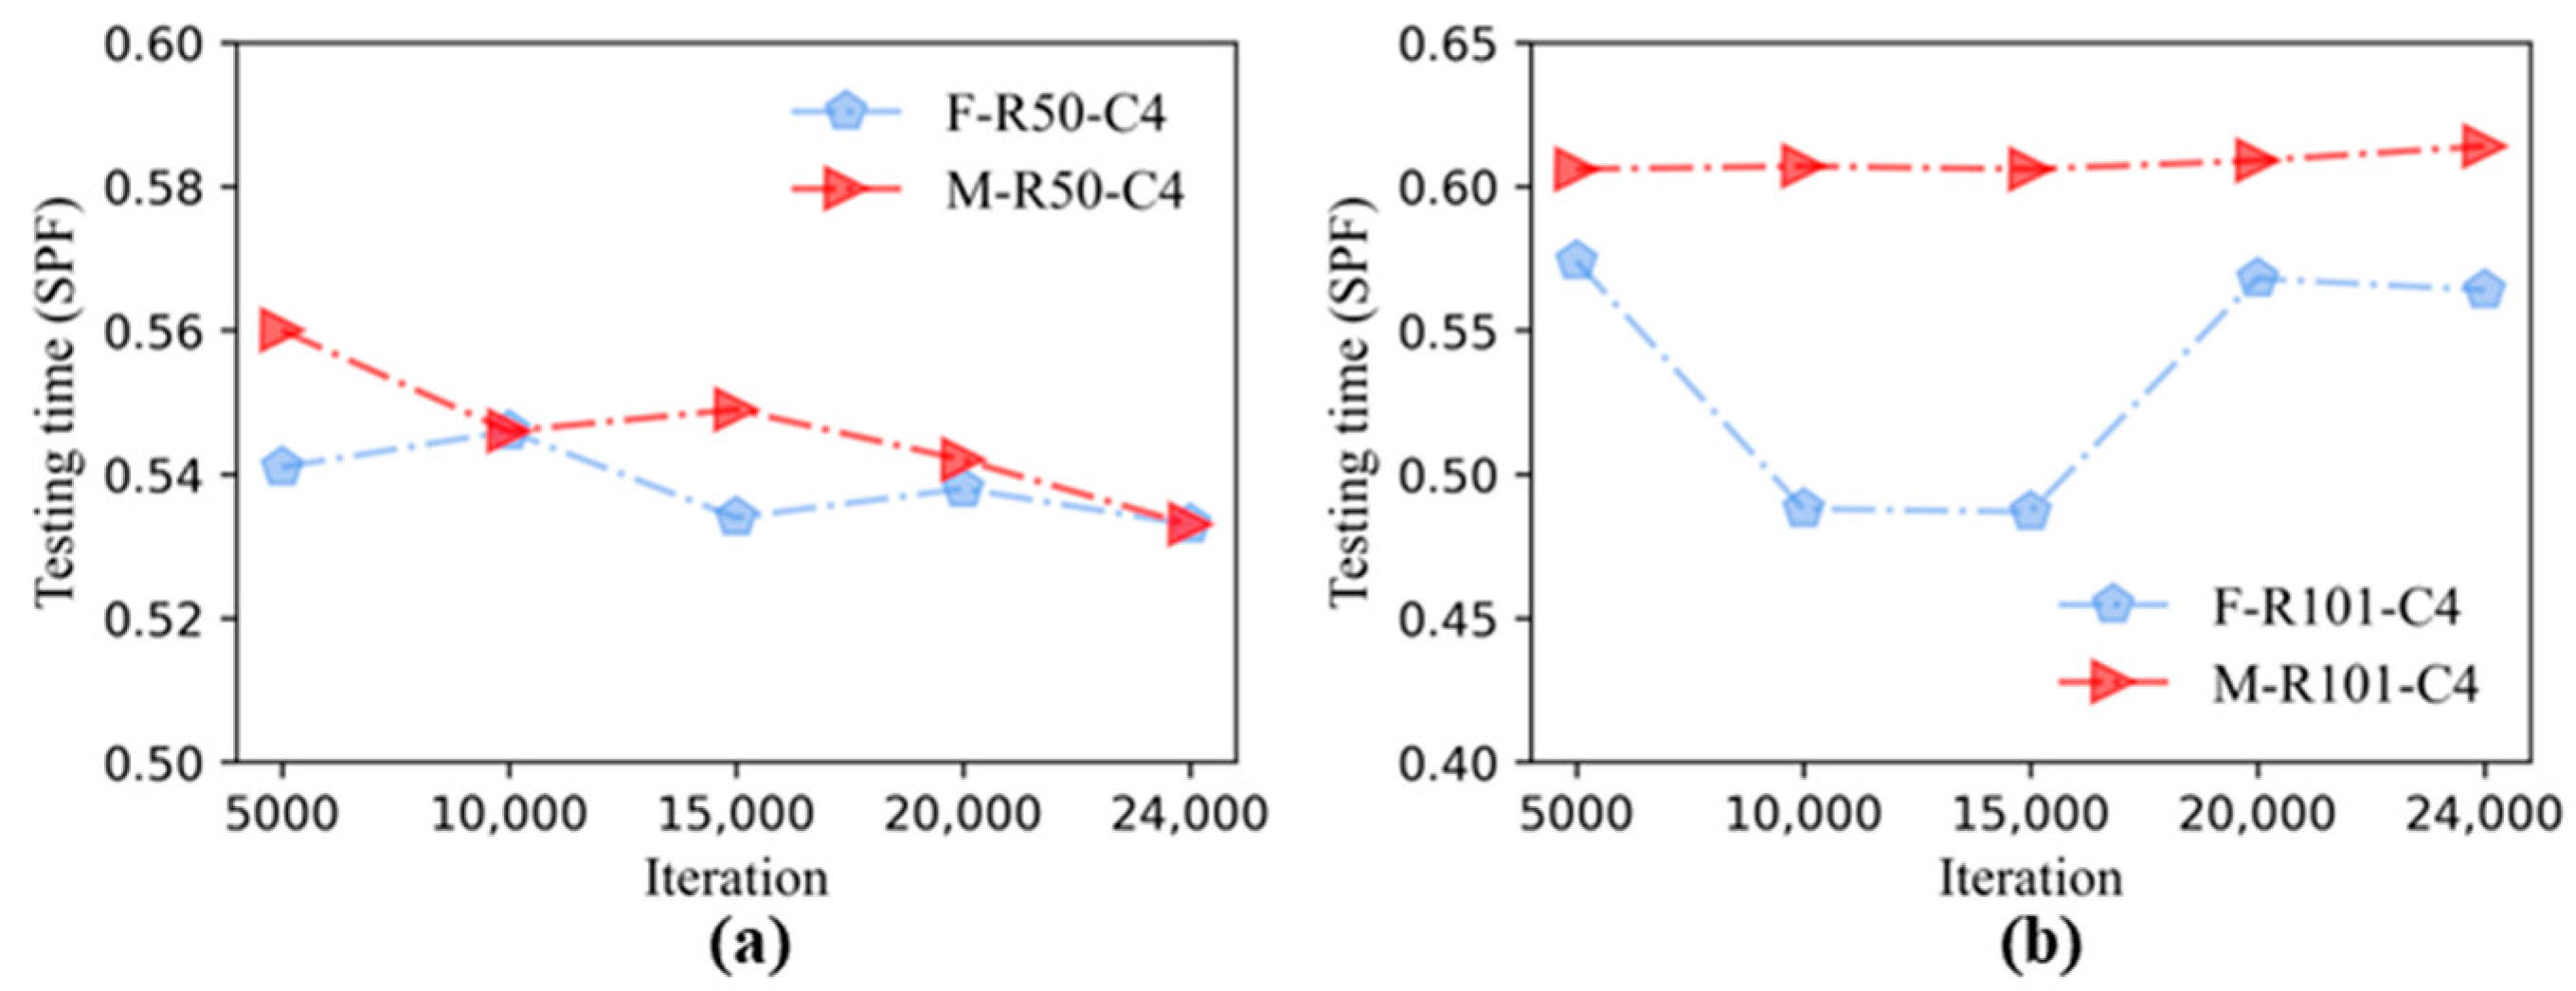
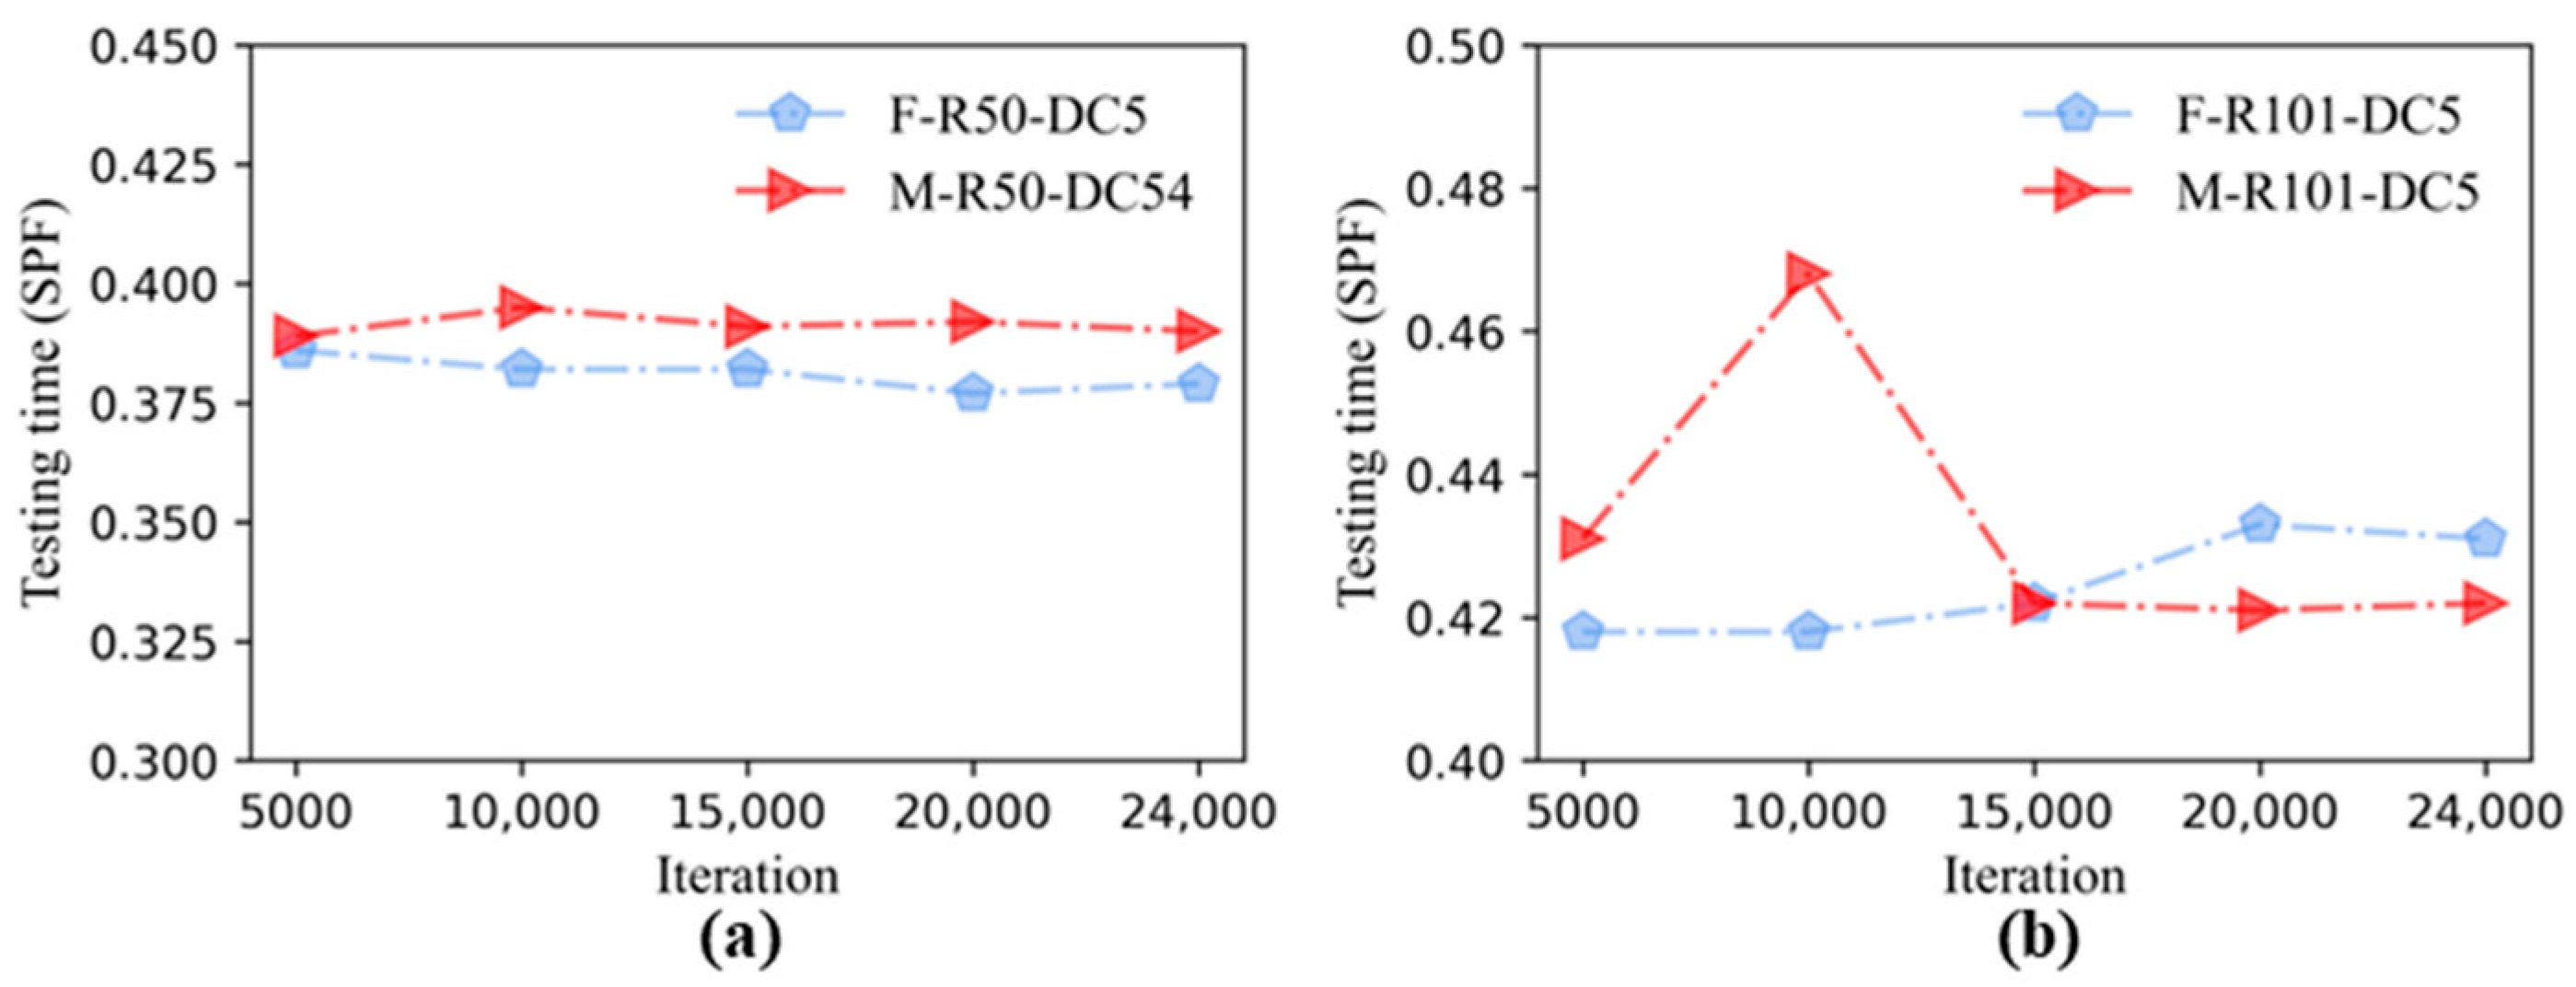
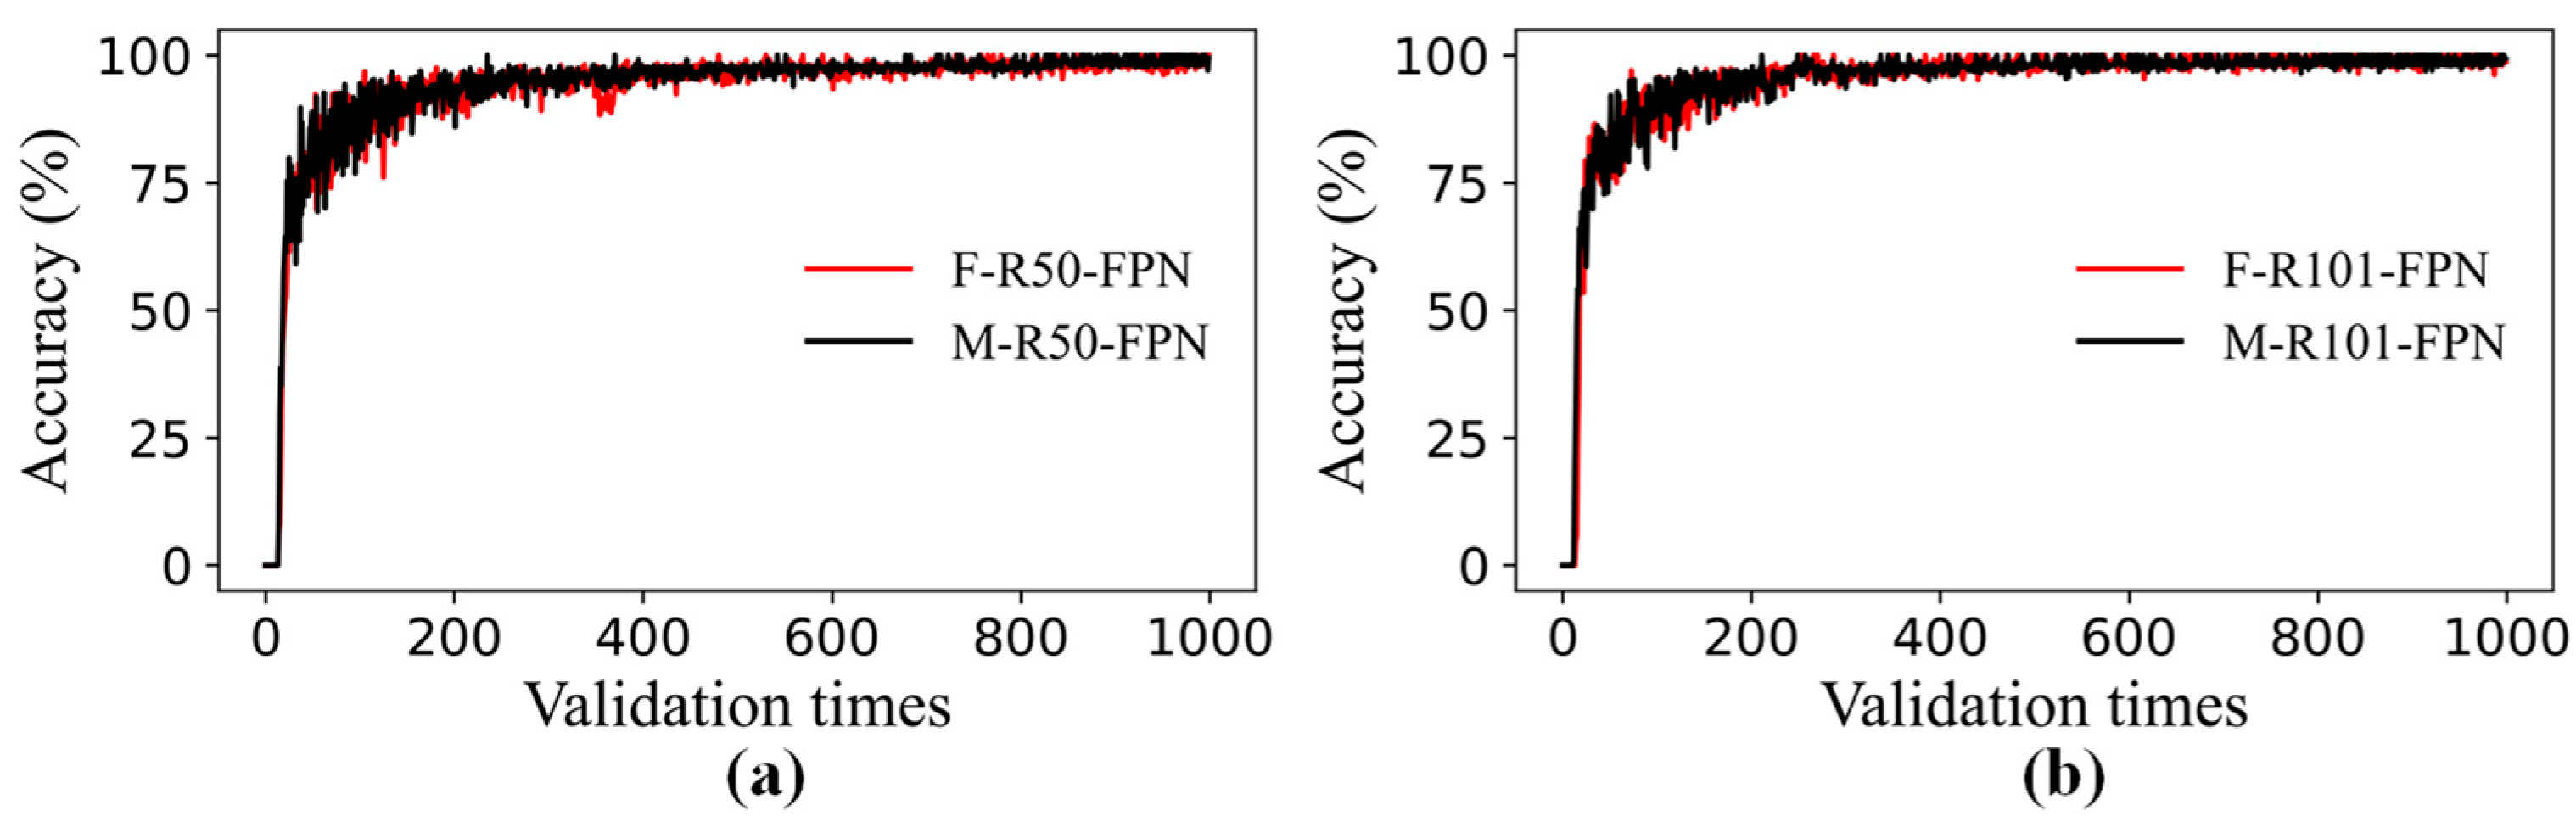
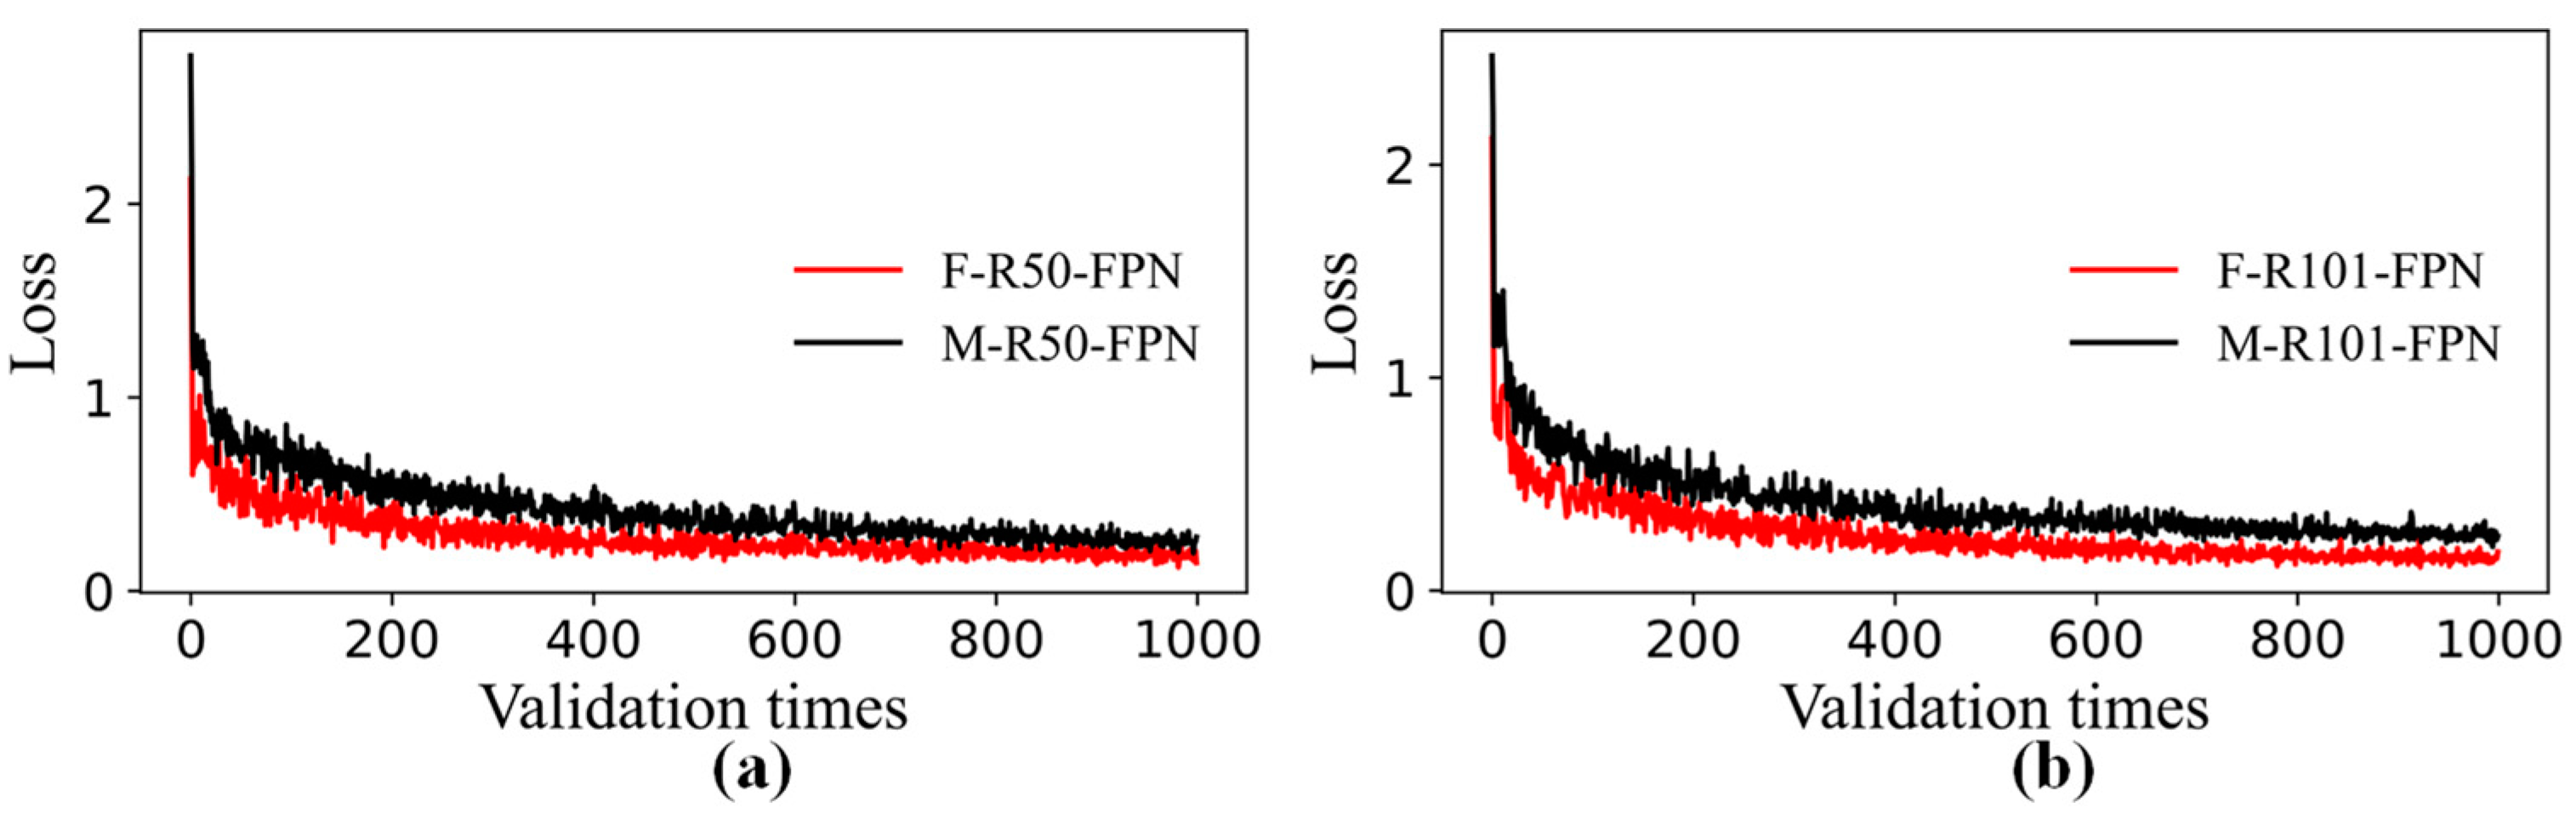
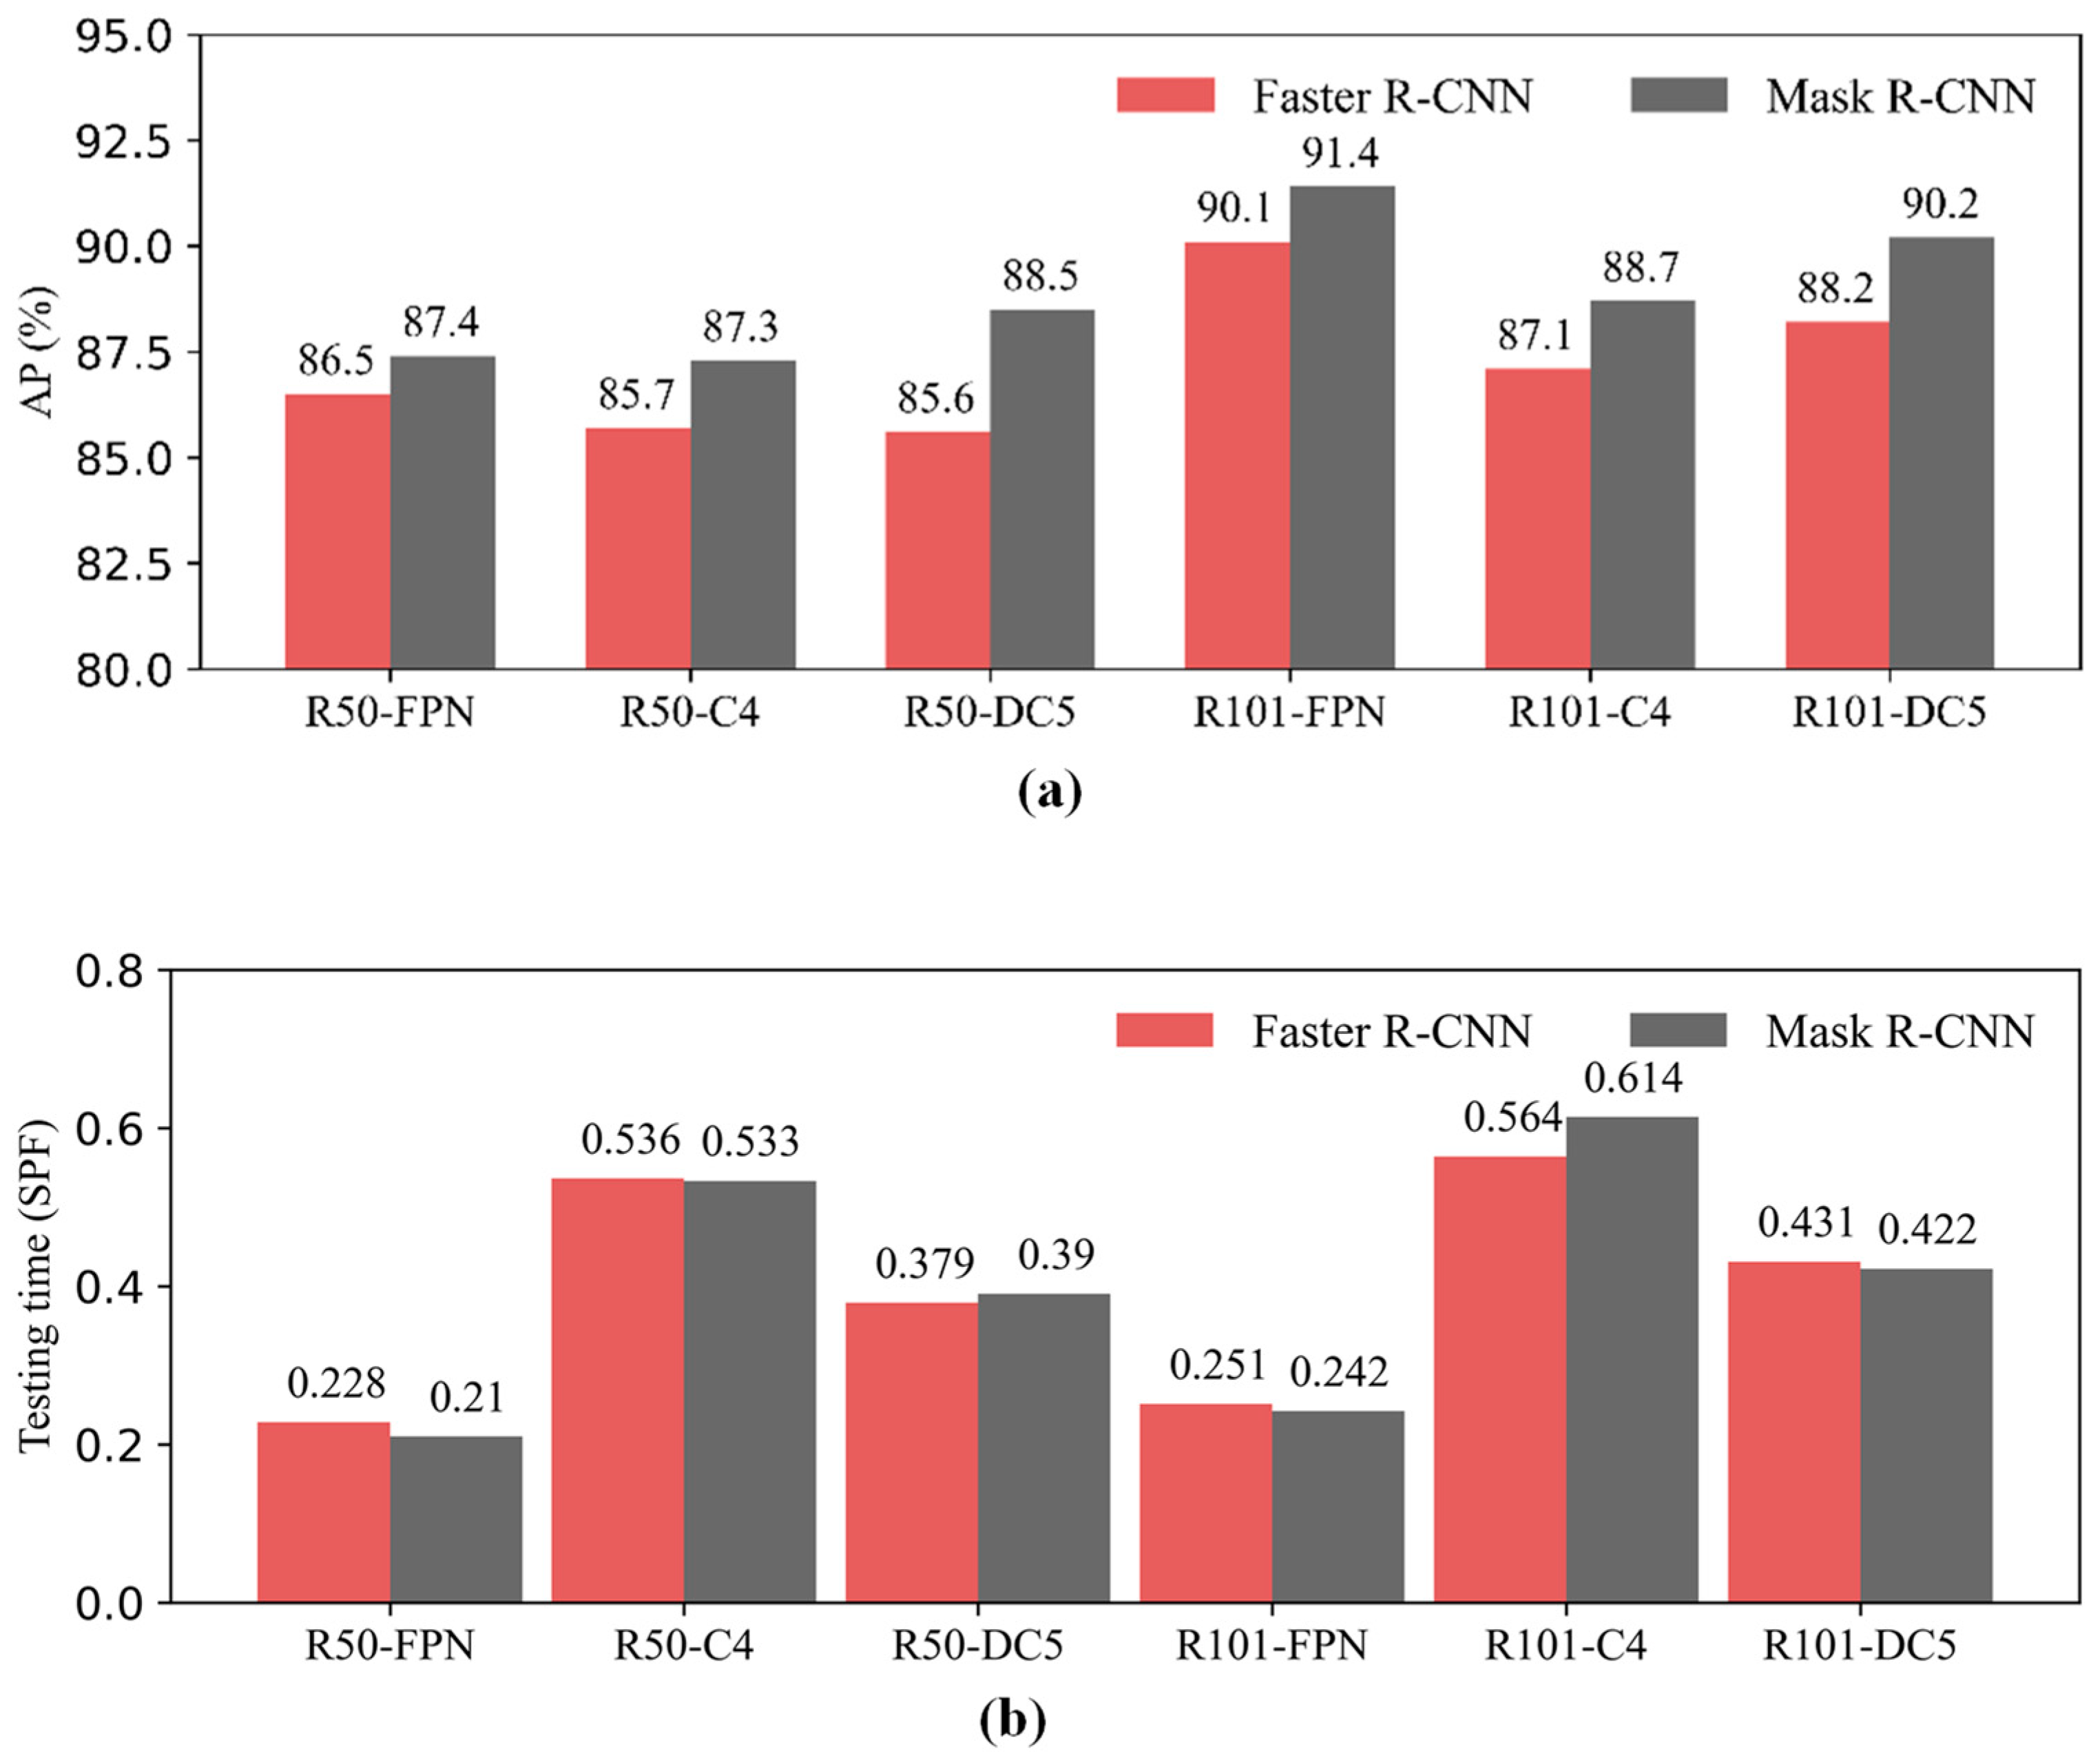
3.1. Performance Comparisons of Faster R-CNN and Mask R-CNN

In the experiments, six network structures (Table 2) were transferred as the backbone structures of the Faster R-CNN and Mask R-CNN and formed 12 models with the corresponding weights being pre-trained on the COCO dataset, and then the models were fine-tuned. The pavement dataset was input into these 12 models to get the corresponding results eventually. (C4: used a ResNet conv4 backbone with a conv5 head [40]. DC5: used a ResNet conv5 backbone with dilations in conv5 and standard conv and FC heads [56]).
When the LR was 0.001, the classification accuracy of each model after 24,000 iterations was shown in Table 3. The result showed that the classification accuracy of the six Faster R-CNN models was very close, with a minimum of 98.7% under F-R101-FPN and 100% under others; the lowest classification accuracy of the six Mask R-CNN models was M-R50-FPN and M-R101-FPN, with an accuracy of 99.3%, and the others were 100%. It could be seen that the accuracy of the models containing the FPN structure was lower than other models, and the accuracy of the Faster R-CNN and Mask R-CNN algorithms was almost the same.
The models were validated 1000 times in 24,000 iterations, and 1000 validation accuracy values were generated. Figure 6a showed the validation accuracy curves of F-R50-FN and M-R50-FPN, which tended to be flat after 400 validations and eventually converged; Figure 6b showed the validation accuracy curves for F-R101-FPN and M-R101-FPN, and both of them converged at the end of the iteration. The validation accuracy curves of the other eight models are shown in the appendix, and the validation curves of the models converged.
The training loss curves of F-R50-FPN and M-R50-FPN are shown in Figure 7a, which declined rapidly in 0 to 200 validations, tended to be flat in the range of 200 to 600 validations, and eventually converged. Since the Mask R-CNN had one L m a s k more than the Faster R-CNN, the final loss of M-R101-FPN in Figure 7b was slightly higher than F-R101-FPN. However, the final loss values shown in Figure 7a were close, which also validated the superiority of the Mask R-CNN to the Faster R-CNN model in pavement defect detection. The training loss curves A2 and A4 of the other eight models are shown in the appendix, and the loss curves of the models converged at the end of the iteration.
The AP was an important indicator of evaluating the model; meanwhile, the testing speed of the model should be ensured with a satisfactory AP. Therefore, this paper compared the AP of the Faster R-CNN and Mask R-CNN with the average testing time of each image. Figure 8a shows the comparison of the AP between the Faster R-CNN and Mask R-CNN models under different backbone structures. The AP of all the Mask R-CNN models was higher than the Faster R-CNN models, and the largest difference in the AP was 2.9% when the backbone structure was R50-DC5.
The testing time of the Faster R-CNN and Mask R-CNN combined with different backbone structures are shown in Figure 8b; when the backbone structures contained FPN, the testing time was lower than the models that contained C4 or DC5. Although the Mask R-CNN had one more segmentation step than the Faster R-CNN when testing the image, most of the Mask R-CNN models were lower than the Faster R-CNN in terms of testing time, and the testing time was lowest when the backbone structure was R50-FPN; the testing time of F-R50-FPN and M-R50-FPN was 0.228 SPF and 0.210 SPF, respectively. Table 4 shows the performance data of all models.
The testing images were input into the F-R50-FPN and M-R50-FPN models with the shortest testing time. Figure 9 shows only part of the testing results, which covered 5 groups of images. The original images, the detection results under the F-R50-FPN model, and the detection results under the M-R50-FPN model are shown in Figure 9a–c, respectively. The single defect shown in Group 1a was a P_crack, and the confidence of Groups 1b and 1c was 100%; it was classified and positioned correctly, and the pixel segmentation effect was ideal. Group 2a presents a large area of N_Cracks and a P_groove located in the N_Cracks. Due to the area of most N_cracks as too large, in which the tiny cracks were intricate, the training dataset of the N_cracks were marked with a large area of polygon annotation, and the testing results of the N_cracks are shown in Group 2b. Group 2c showed the effects of segmentation.
Group 3a showed two H_cracks, but three H_cracks were detected by F-R50-FPN in Group 3b, and Group 3c described that two H_cracks were segmented. Group 4a showed two P_cracks, and the testing results demonstrated that two P_cracks were positioned and segmented correctly in F-R50-FPN and M-R50-FPN. The results indicated that the effects were ideal in few object defect detection. To validate the performance of F-R50-FPN and M-R50-FPN in multiple-object detection, Group 5a was tested. Group 5b showed that six H_cracks, two N_cracks, and one P_crack were detected, while the result of Group 5c showed that there was one more H_crack in the upper left corner of the image than Group 5b. In Figure 9, both F-R50-FPN and M-R50-FPN achieved satisfactory effects.
Figure 10a showed the approximate trend of the AP in F-R50-FPN and M-R50-FPN during iteration. Their AP was rising overall, which were close finally. In the iterative process of the F-R101-FPN, the general trend of the AP was to increase, and the maximum value of the AP was 90.5% when the iteration was 20,000, as shown in Figure 10b. The general trend of the AP in M-R1010-FPN was rising. Figure 11 shows the approximate trend of the image testing time of the model corresponding to Figure 11. As shown in Figure 11a, the testing time of F-R50-FPN increased with the number of iterations, while the M-R50-FPN tended to be flat and finally stable at 0.21 SPF. The testing time of F-R100-FPN and M-R101-FPN tended to be flat in Figure 11b. The AP and testing time (Figure A5, Figure A6 and Figure A7) of other models are shown in the appendix.

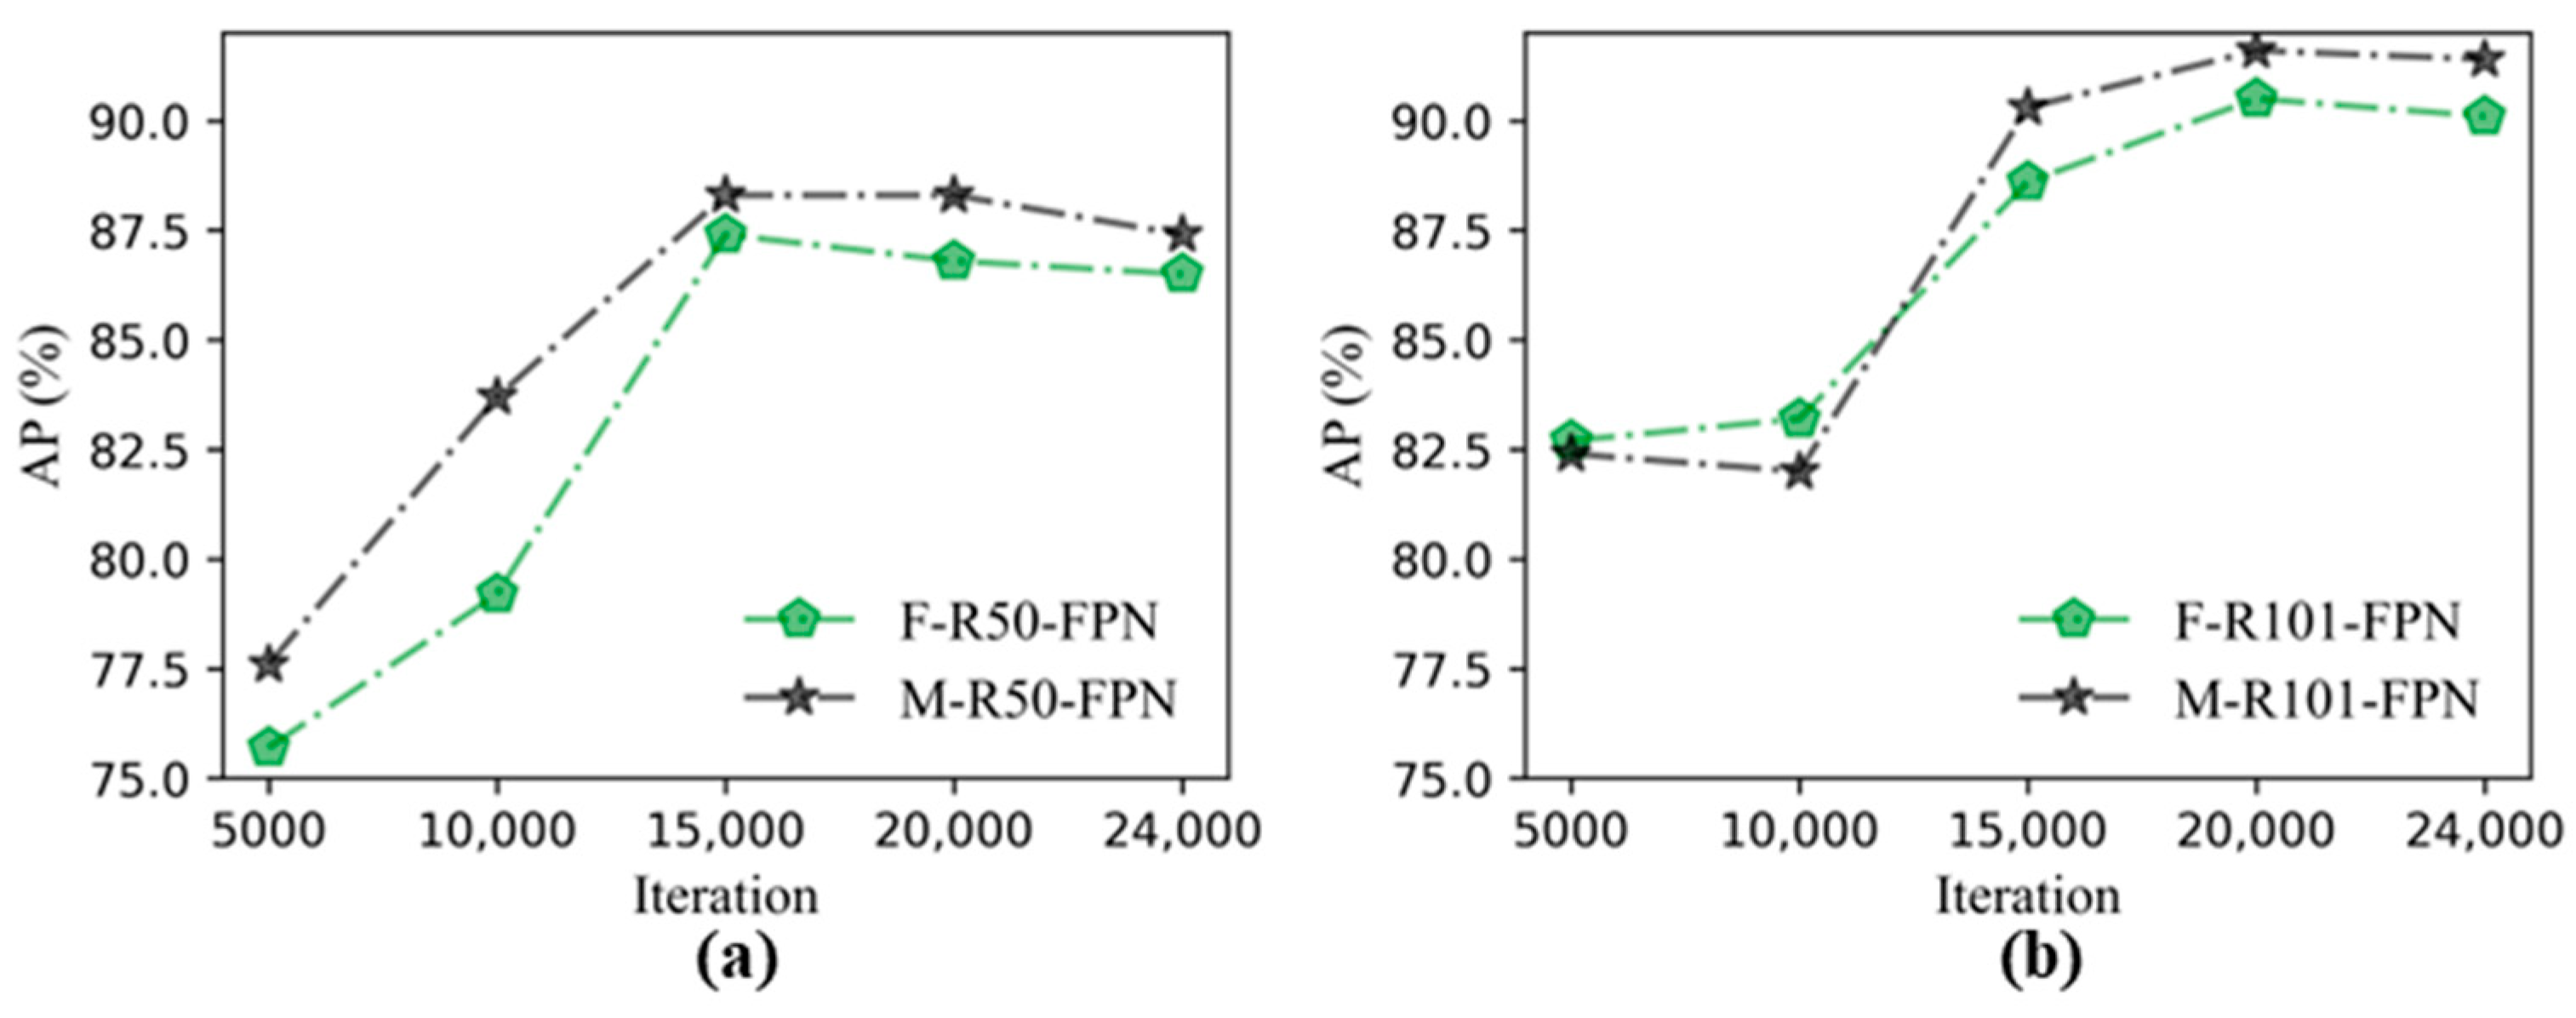
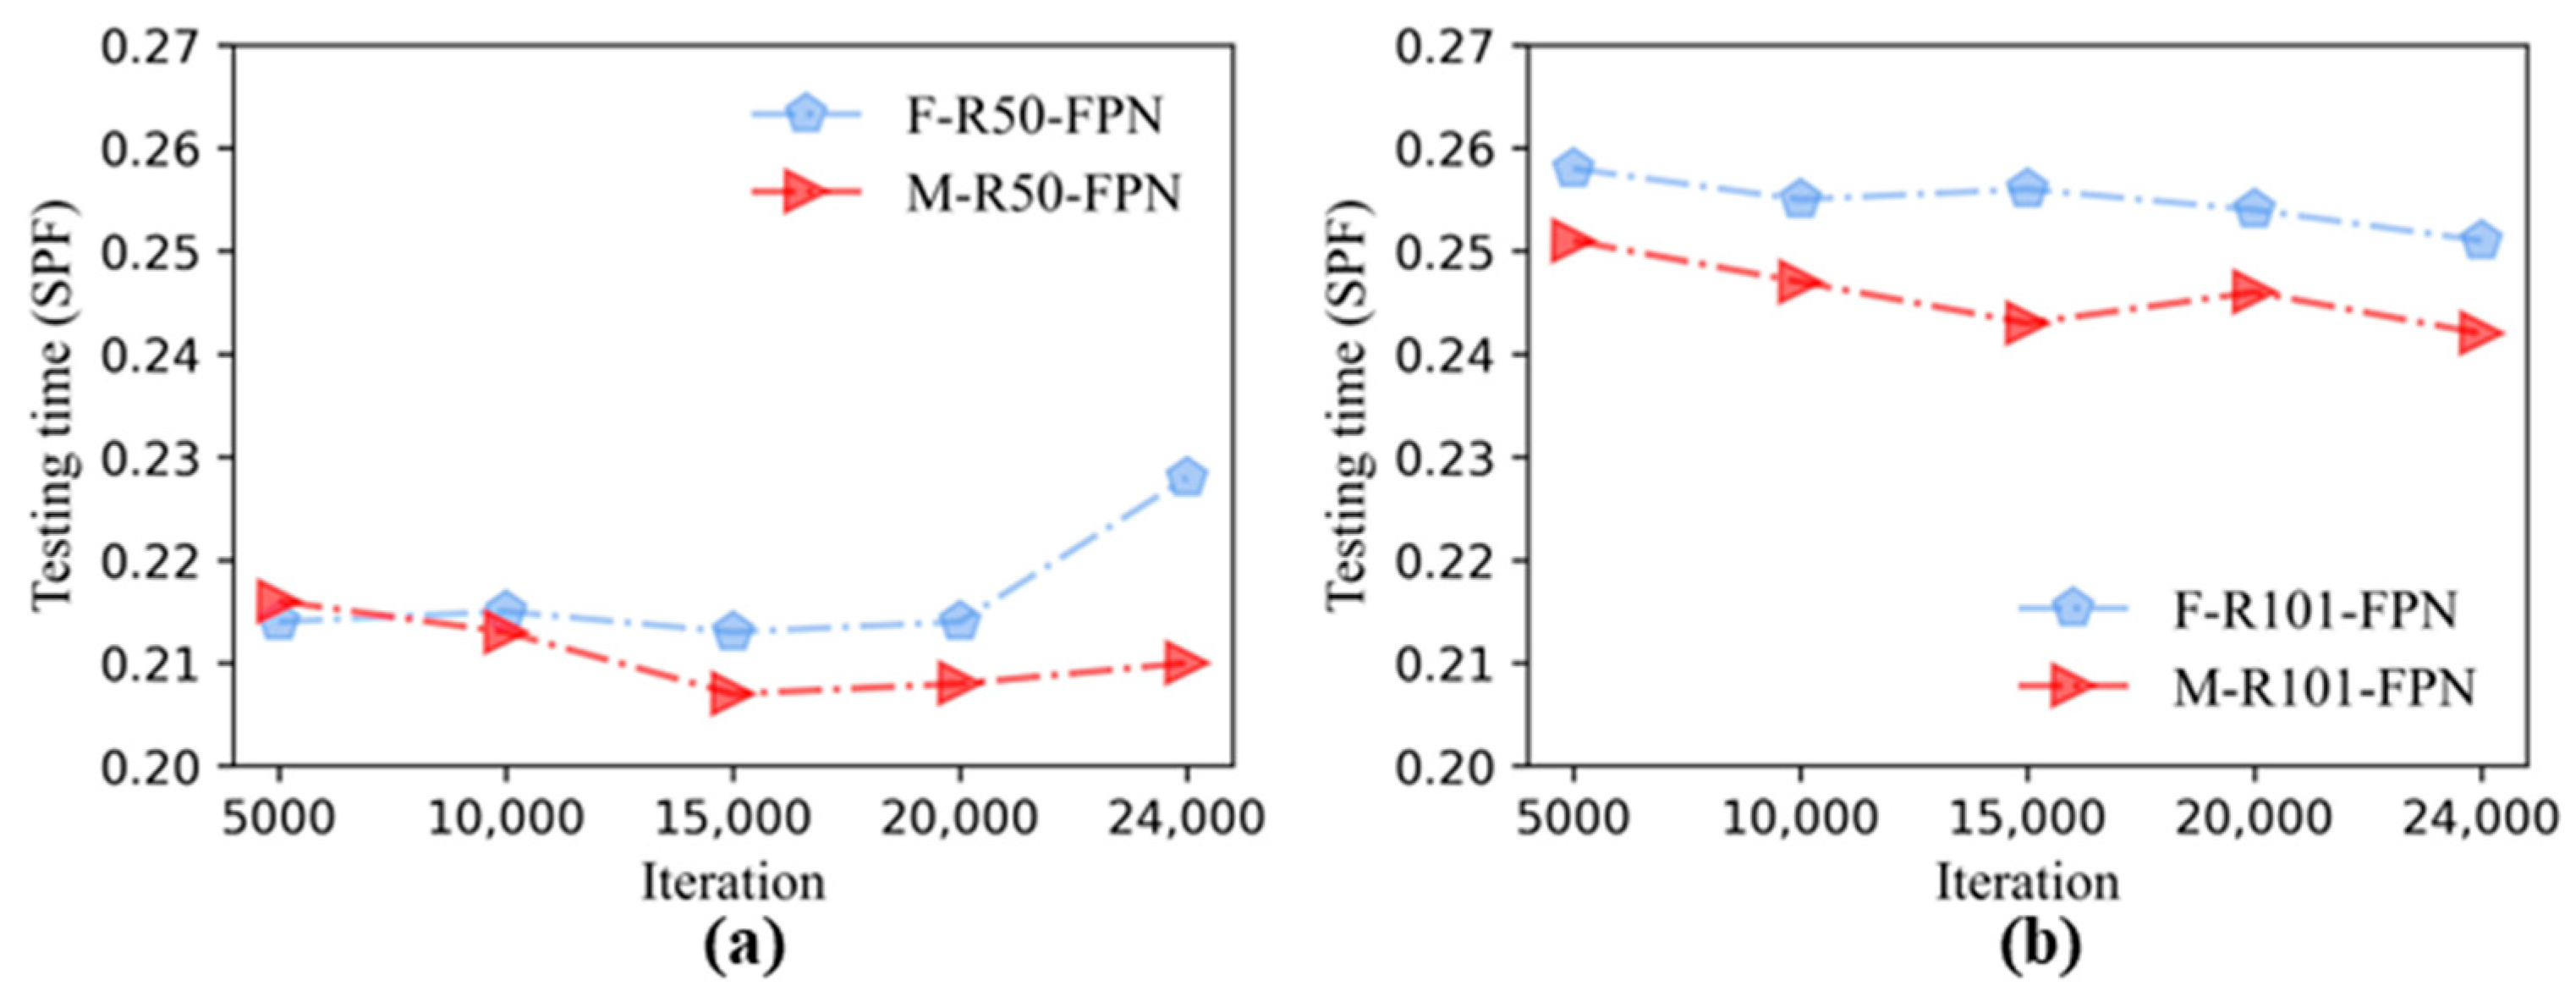
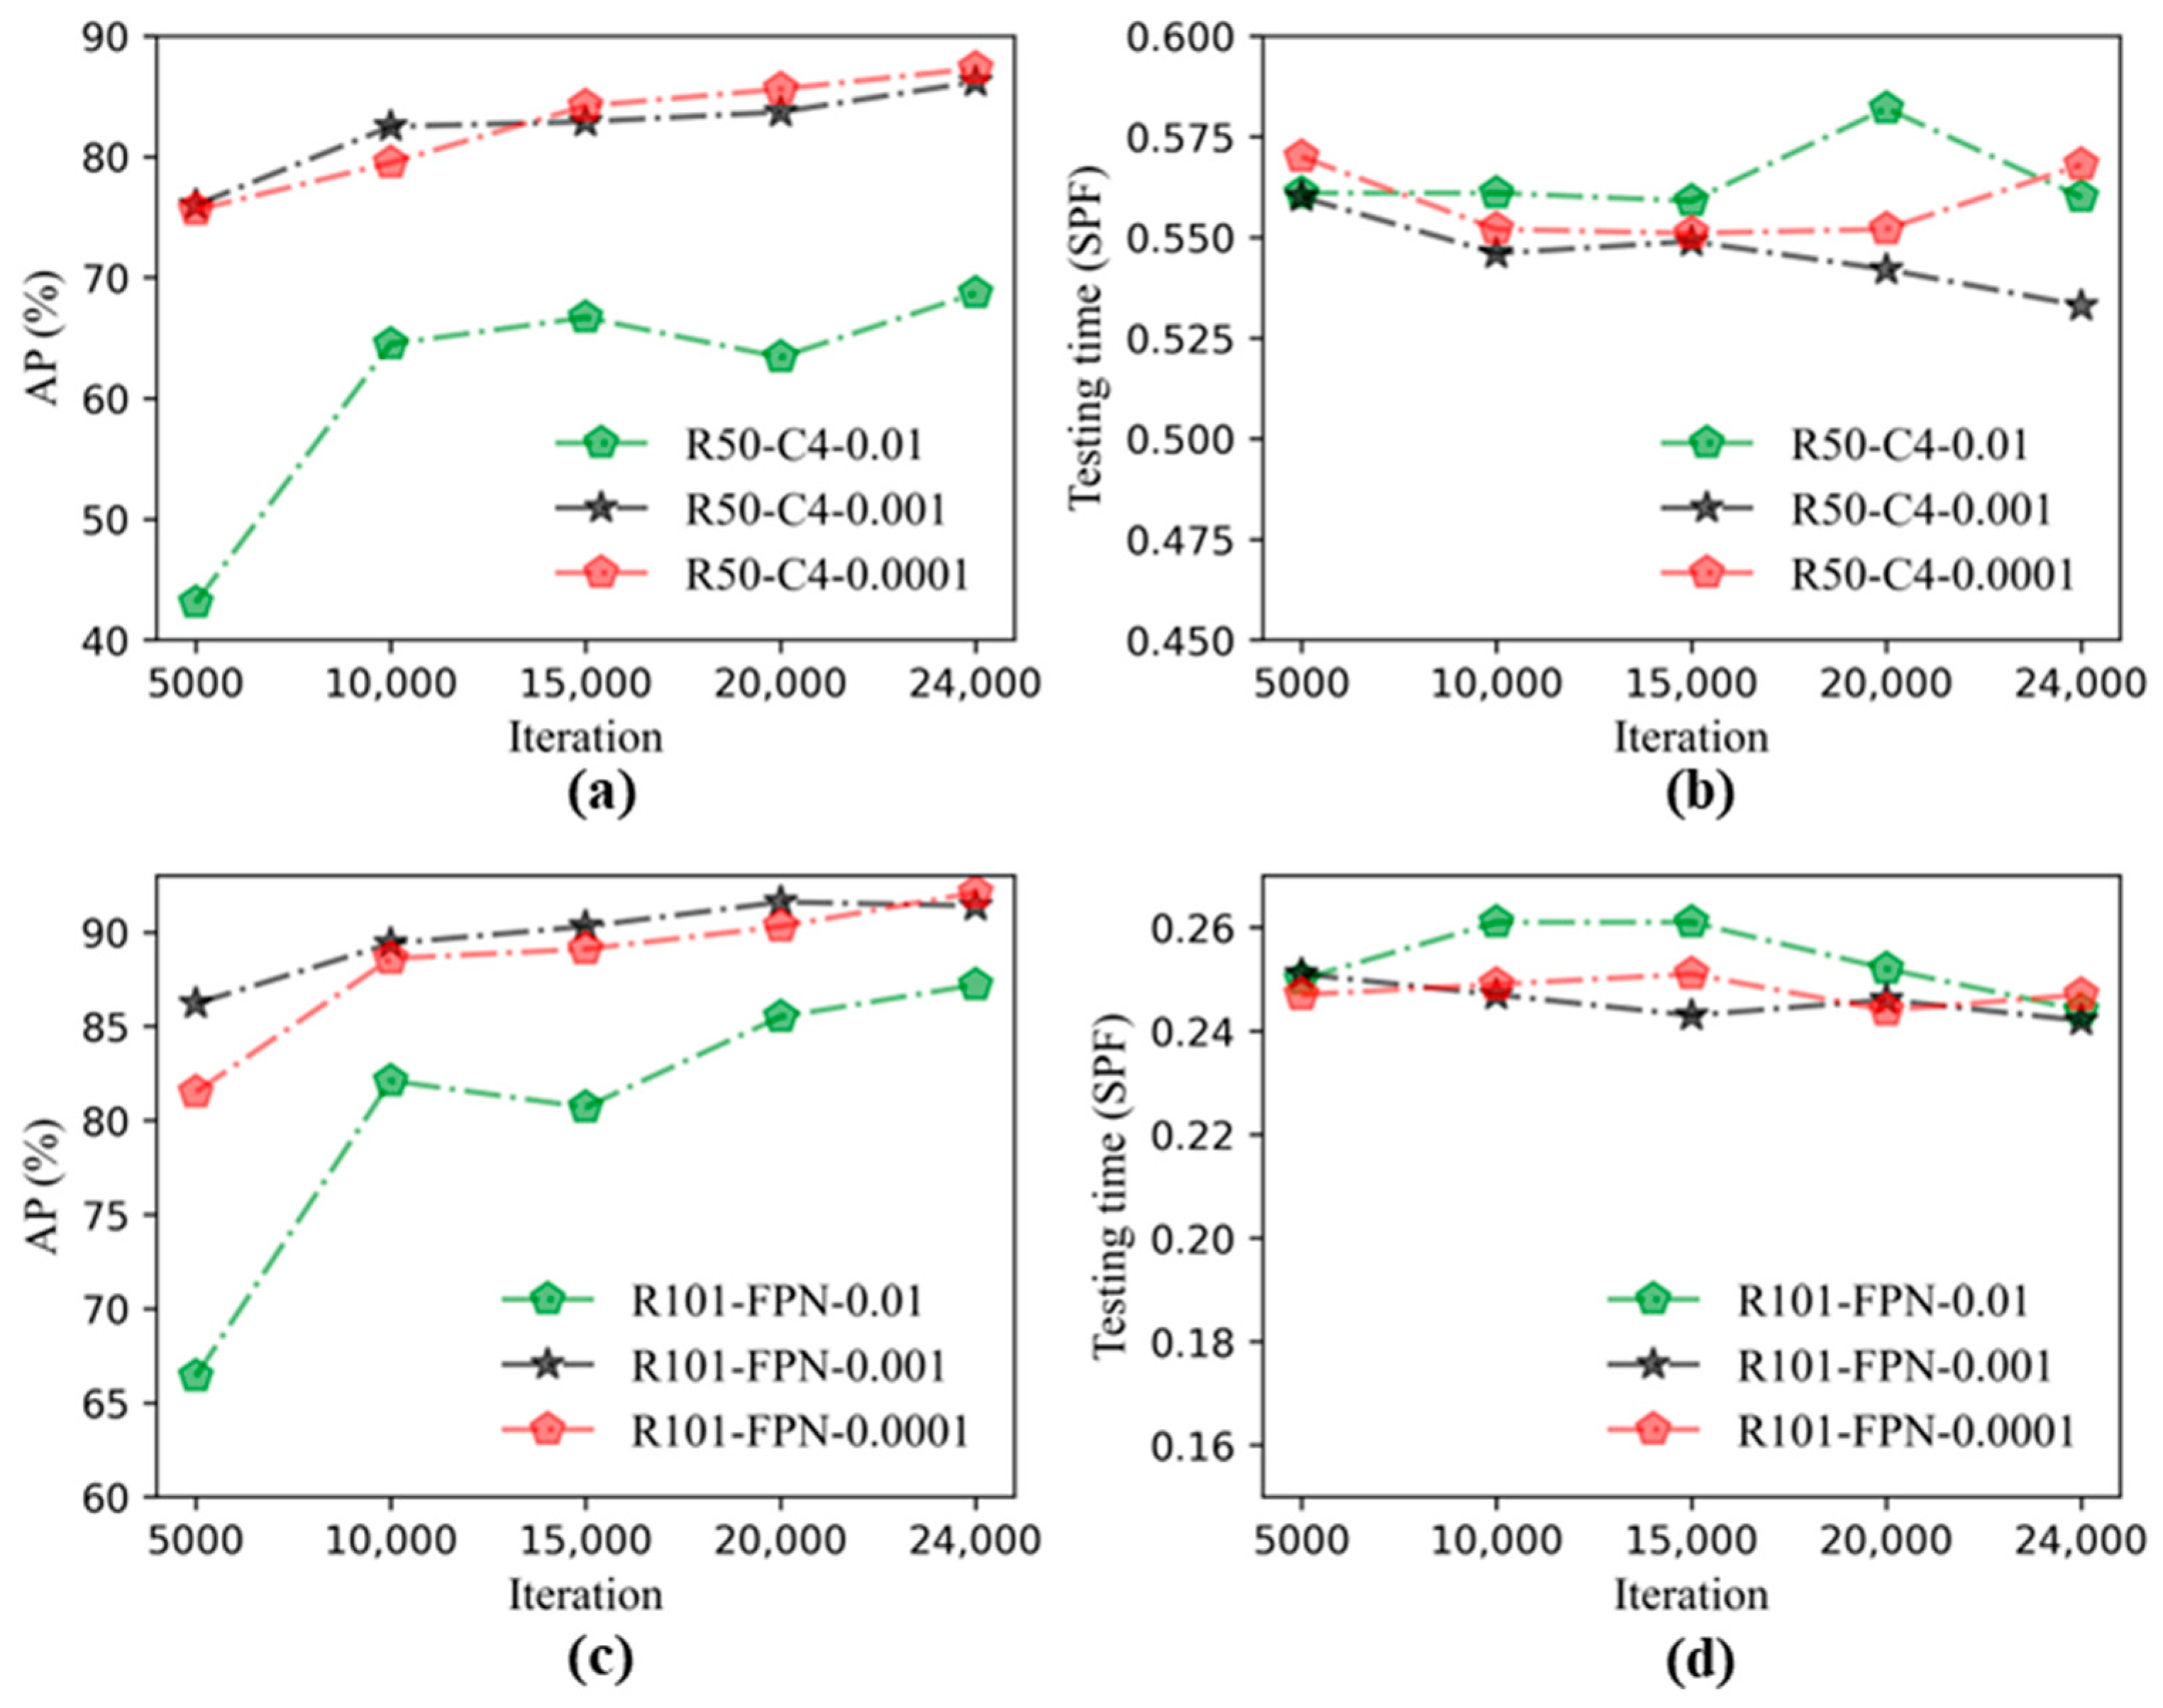
3.2. Performance Comparisons of Mask R-CNN at Different Learning Rates

Section 3.1 confirmed that the overall performance of the Mask R-CNN in pavement defect detection was superior to that of the Faster R-CNN. Therefore, the following study of the hyper-parameter LR of the Mask R-CNN was carried out. The model performance of the Mask R-CNN at three LRs of 0.01, 0.001, and 0.0001 was compared to obtain relatively optimal model in pavement defect detection, respectively. Figure 12a showed the AP trend of M-R50-C4 at three LRs, with an overall upward trend during iteration. The AP of M-R50-C4 that were highest at the LR was 0.0001, with the AP reaching 87.3 at the end of the iterations. Figure 12b shows the trend of the testing time of M-R50-C4 at the three LRs, and the average testing time of the image was between 0.525–0.575 SPF, and the testing time was shortest when the LR was 0.001.
Figure 12c shows the trend of the AP of M-R101-FPN at the three LRs, and the overall trend rose with the number of iterations. The AP reached 92.1 when the LR was 0.0001. Figure 12d was the trend of the testing time corresponding to Figure 12c; the three trends of the testing time were close and stable at about 0.245 SPF, and the testing time was as low as 0.242 SPF when the LR was 0.001. Meanwhile, the fastest testing speed in Figure 12d was 56% faster than that in Figure 12b. Table 5 shows the performance data of different backbone structures of the Mask R-CNN when the LR was 0.0001. The corresponding result (Table A1) of when the LR was 0.01 is shown in the Appendix A.
The testing images of M-R50-C4 under different LRs are shown in Figure 13. Figure 13a shows the original image, which contained an N_crack and a P_groove. Figure 13b shows the testing results of the M-R50-C4 model when the LR was 0.01, which detected a large number of defects with large errors. Figure 13c showed that four defects were detected when the LR was 0.001. Figure 13d shows the detection effect of the model at the LR of 0.0001, and the model output six defects. The results showed that the M-R50-C4 model could detect the defects in the image but that the detection effect was quite different at different LRs, and the number of defects in the image could not be predicted correctly. The testing effect of the M-R101-FPN at three LRs is shown in Figure 14. Figure 14b shows the testing results of the model at the LR of 0.01, and the model detected three defects, and the error defect was a P_crack. The defects in the image could be accurately detected when the LR was 0.001 (Figure 14c), and the LR was 0.0001 (Figure 14d).

3.3. Quantified Results of Relative Optimal Model

Based on the above discussion results, the AP of the optimal model M-R101-FPN was 92.1%, and the pavement surface defect was quantified by this model. Figure 15 shows four groups of testing images; Figure 15a shows the testing image results. Through modifying the testing code so that the model only outputs pixel segmented images, the pixel images were clustered and processed binarily to obtain Figure 15b; and then the pixel area of the defects in Figure 15b was extracted to compare with that label, and the results are shown in Figure 15c.
From the detection results, it can be seen that in the N_crack detection of Group 1, the predicted pixel area of the defect was 11,636, while the actual labeled area was 12,377, and the error rate was 5.9%; the error rate of the pixel area predicted by the three P_grooves in Group 4 was 10.6%, 5.2%, and 4%, respectively. Group 2 showed two P_cracks, and Group 3 showed two H_cracks; their error rate ranges from 10% to 16%, but this error rate was relatively low compared with that of the pixel area of the defect to the total image area. The actual labeled area of the P_cracks in Group 2 was 0.513% of the total image area, while the prediction result accounted for 0.586% of the total area, with an error rate of 0.073%. Overall, the relative quantification results of the model were excellent.

4. Conclusions

In this paper, the pavement defects were detected by using the Mask R-CNN and transfer learning, and during the experiment, the performance of the Mask R-CNN and Faster R-CNN in pavement defect detection were compared. The following points could be concluded:
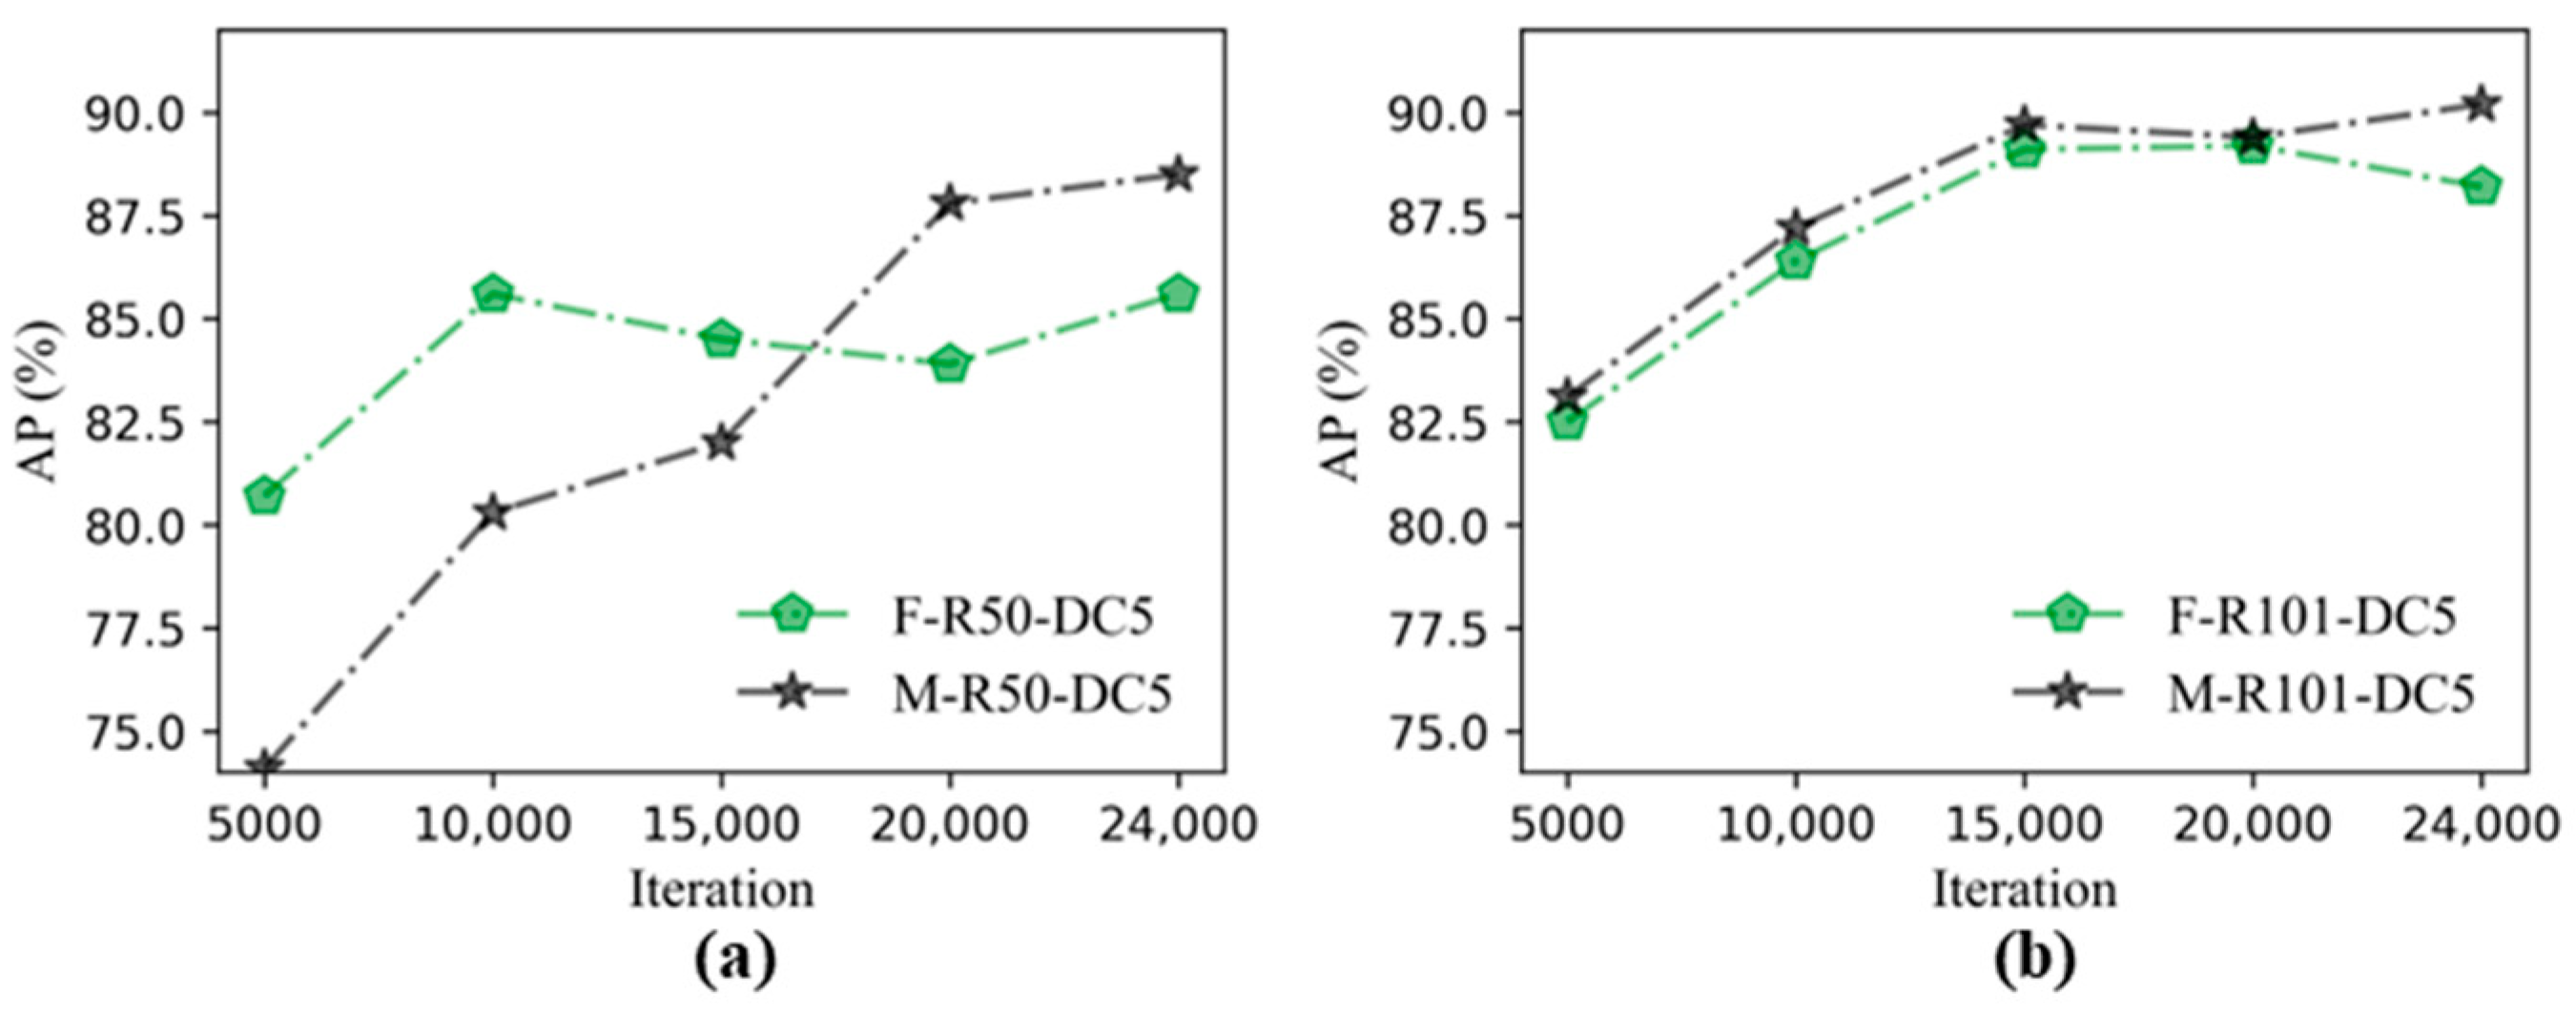
  • By using transfer learning, the performance results of the Faster R-CNN and Mask R-CNN combined with six backbone structures, it could be seen that the detection accuracy of the two algorithms was close, and the AP under each backbone structure of the Mask R-CNN was higher than that of the corresponding Faster R-CNN. The models containing FPN were faster than others in testing time.
  • Through comparing the performance of the Mask R-CNN under three different LRs, the result could be obtained that the M-R101-FPN was the relatively optimal model when the learning rate was 0.0001, and the AP could reach 92.1%, and the detection effect was best.
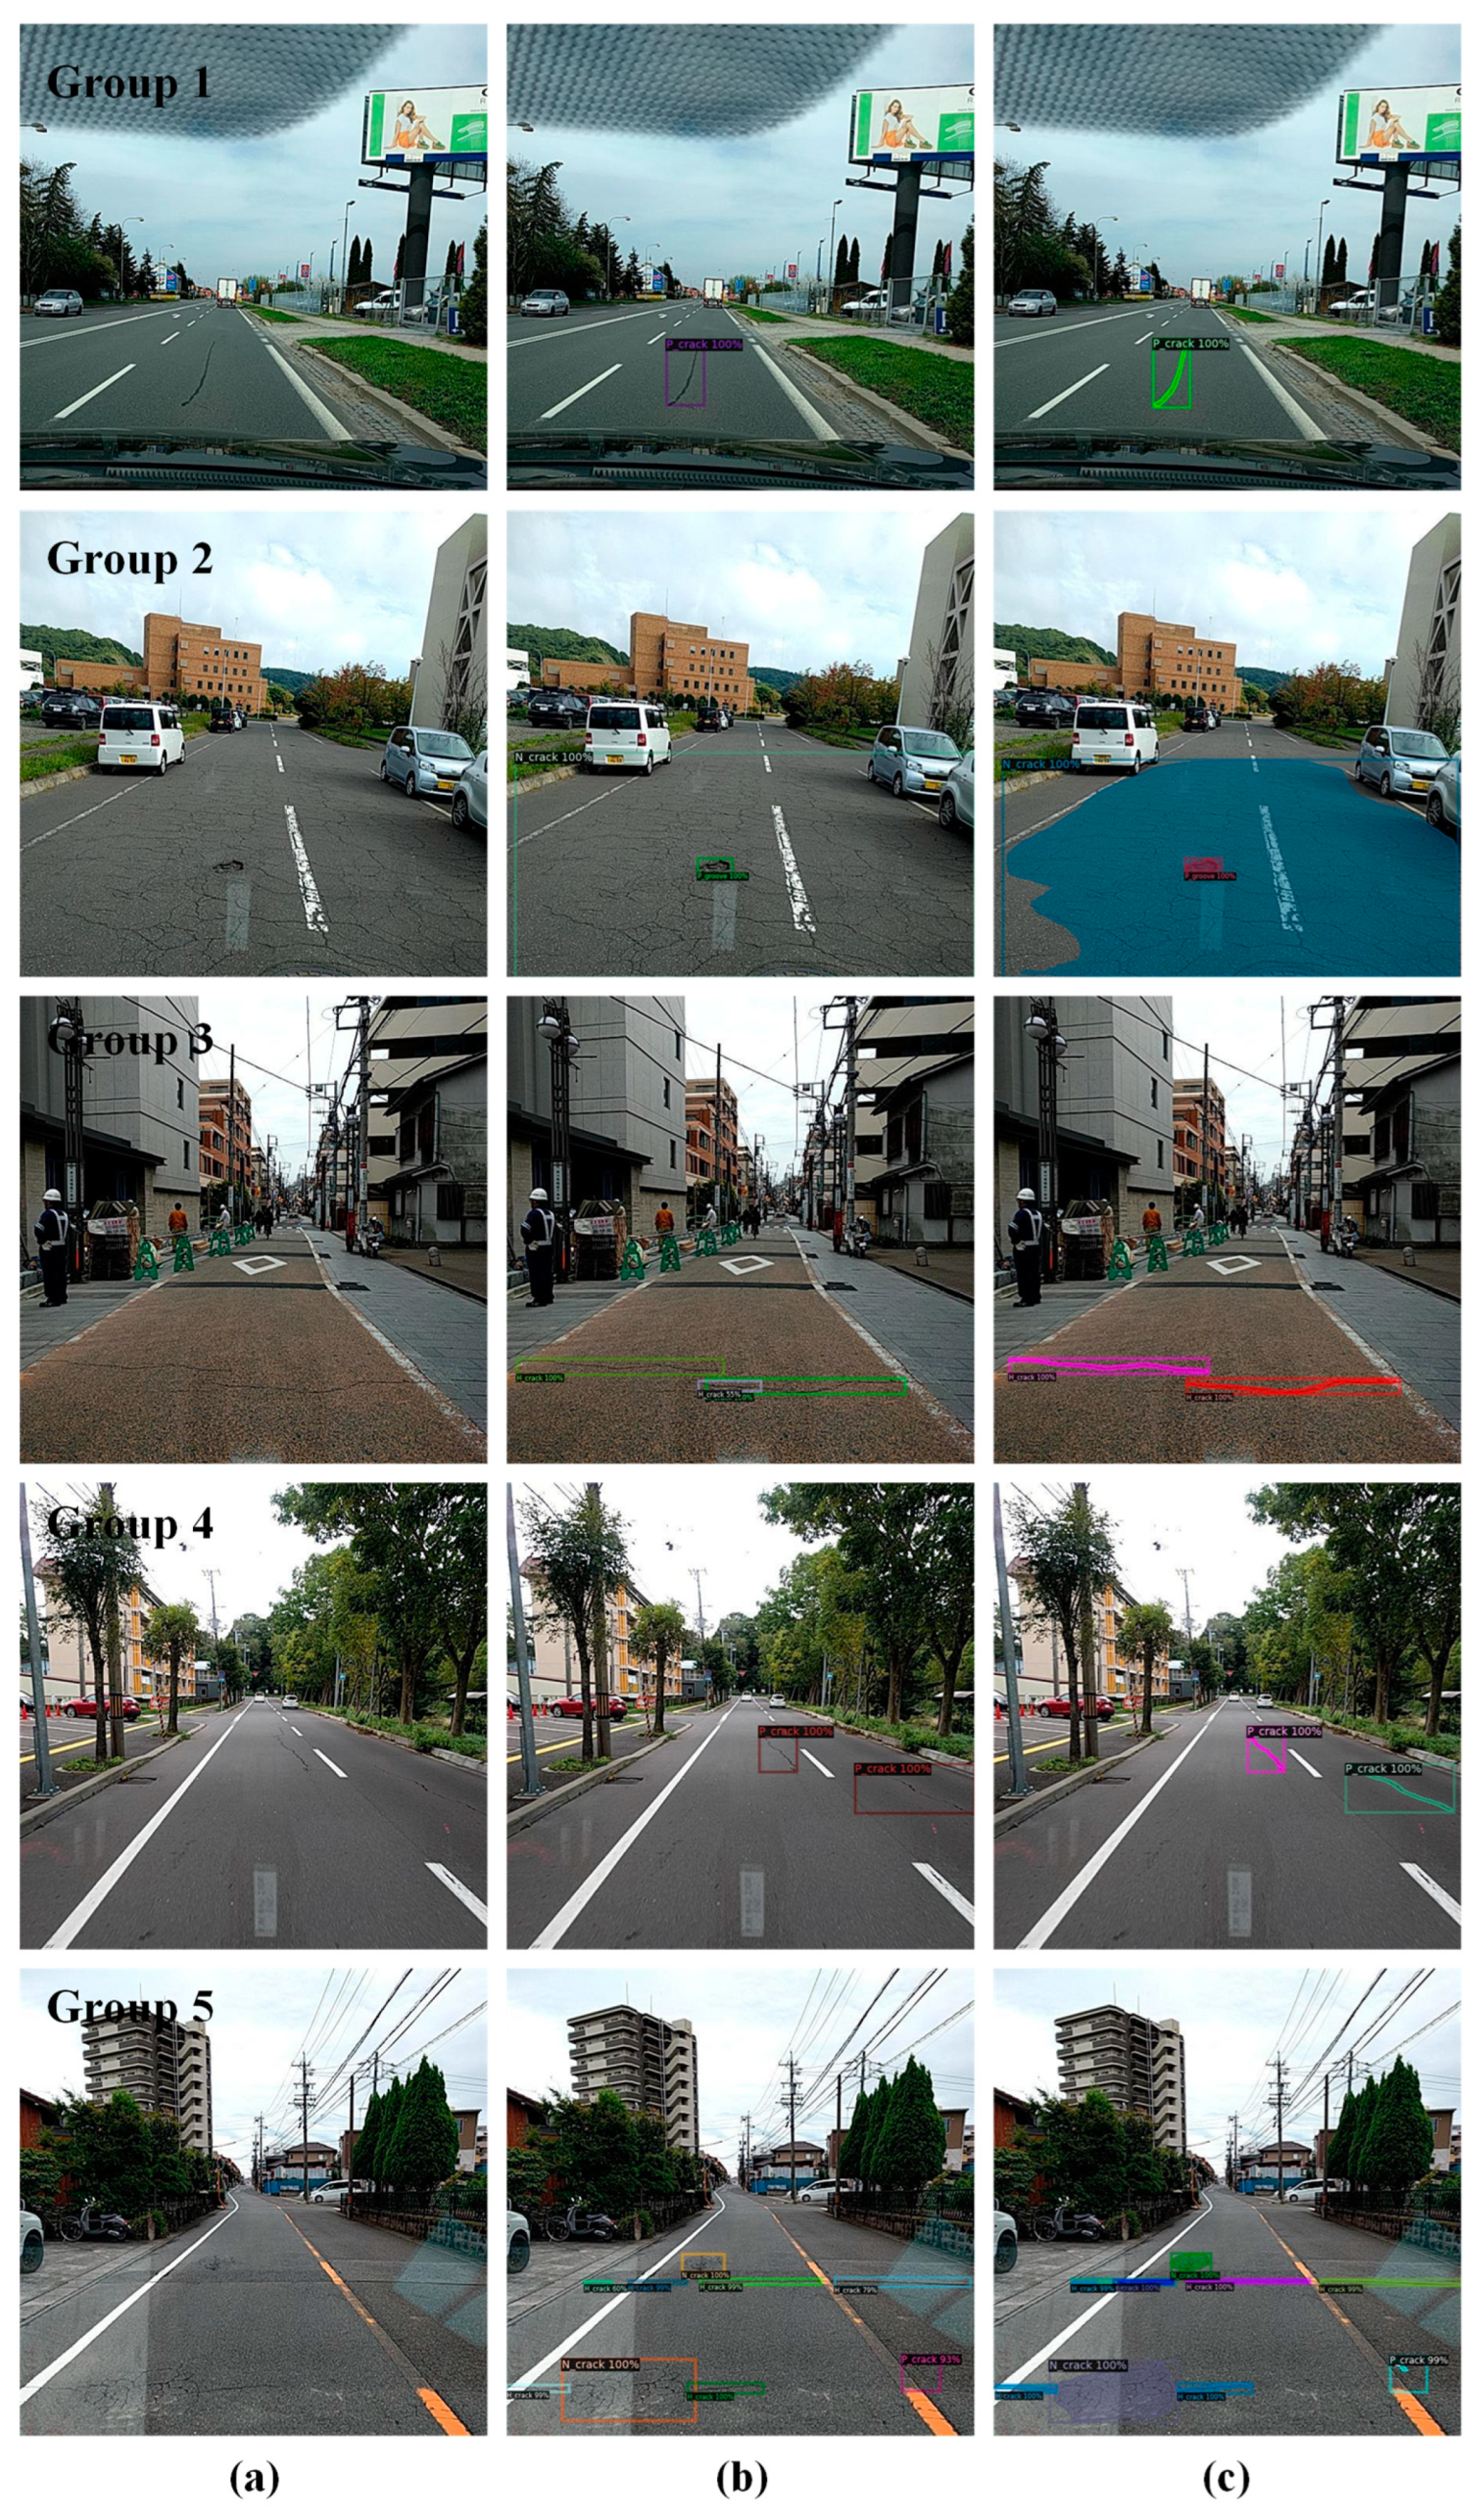
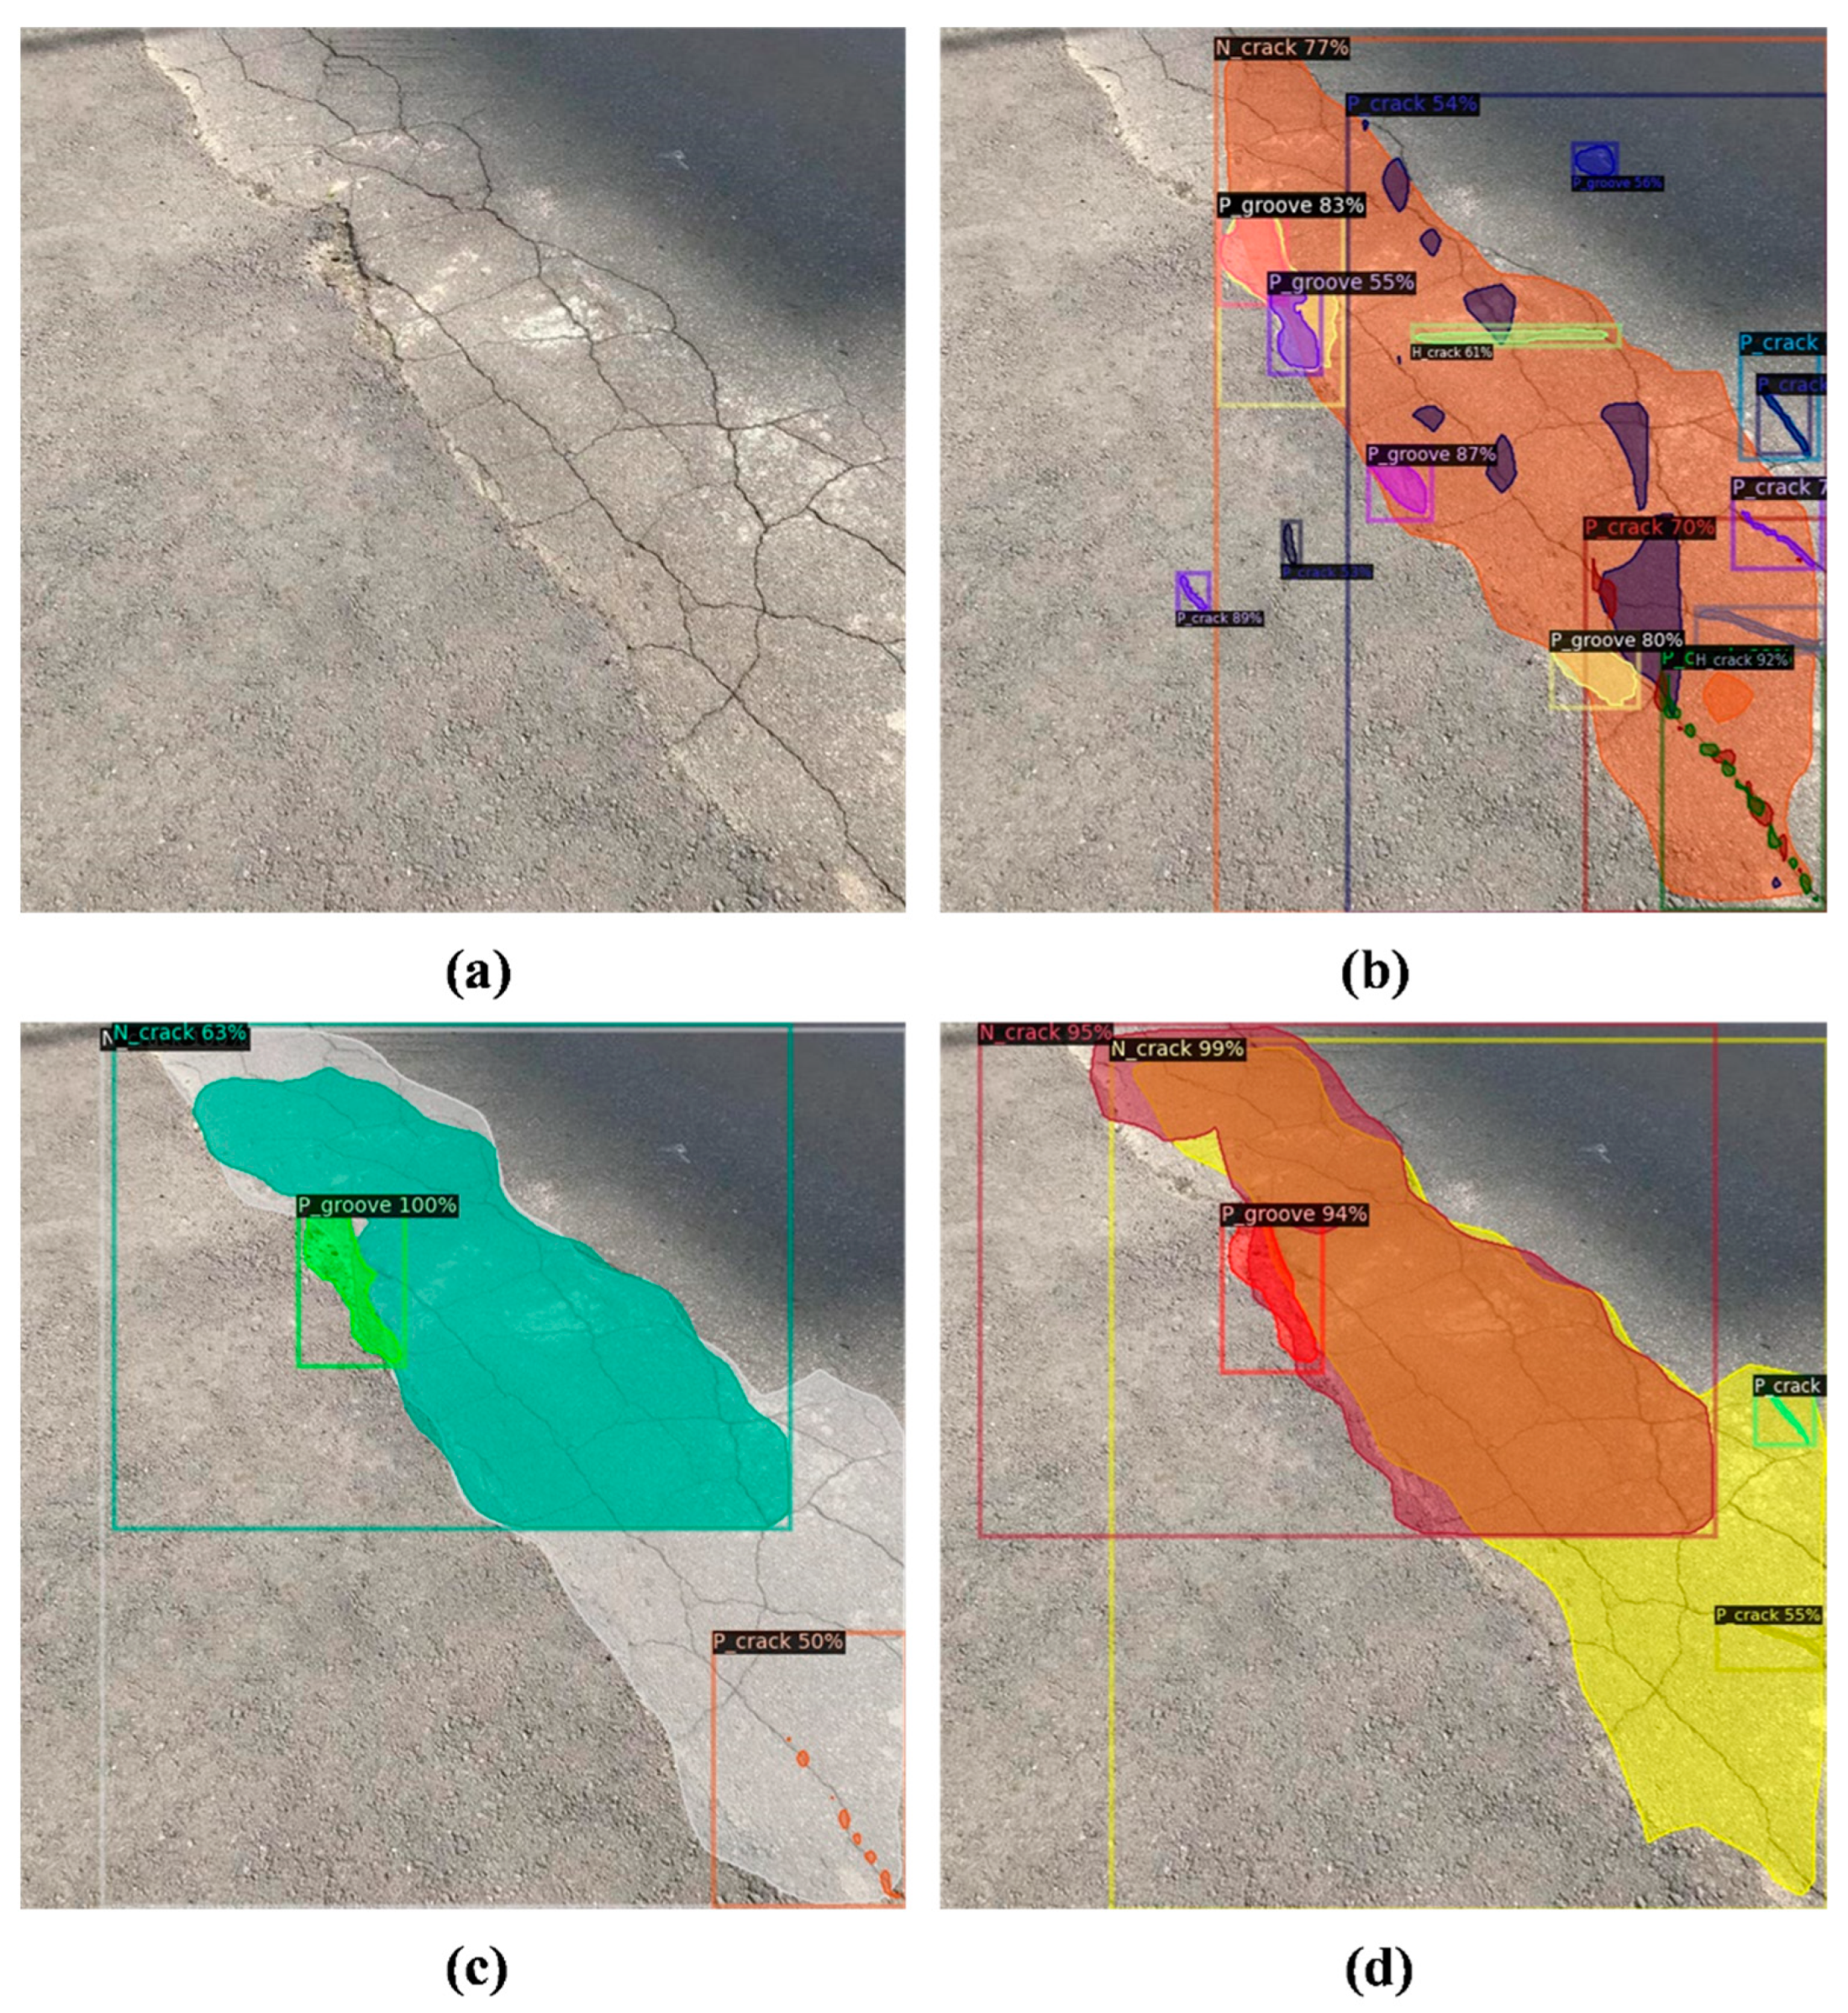
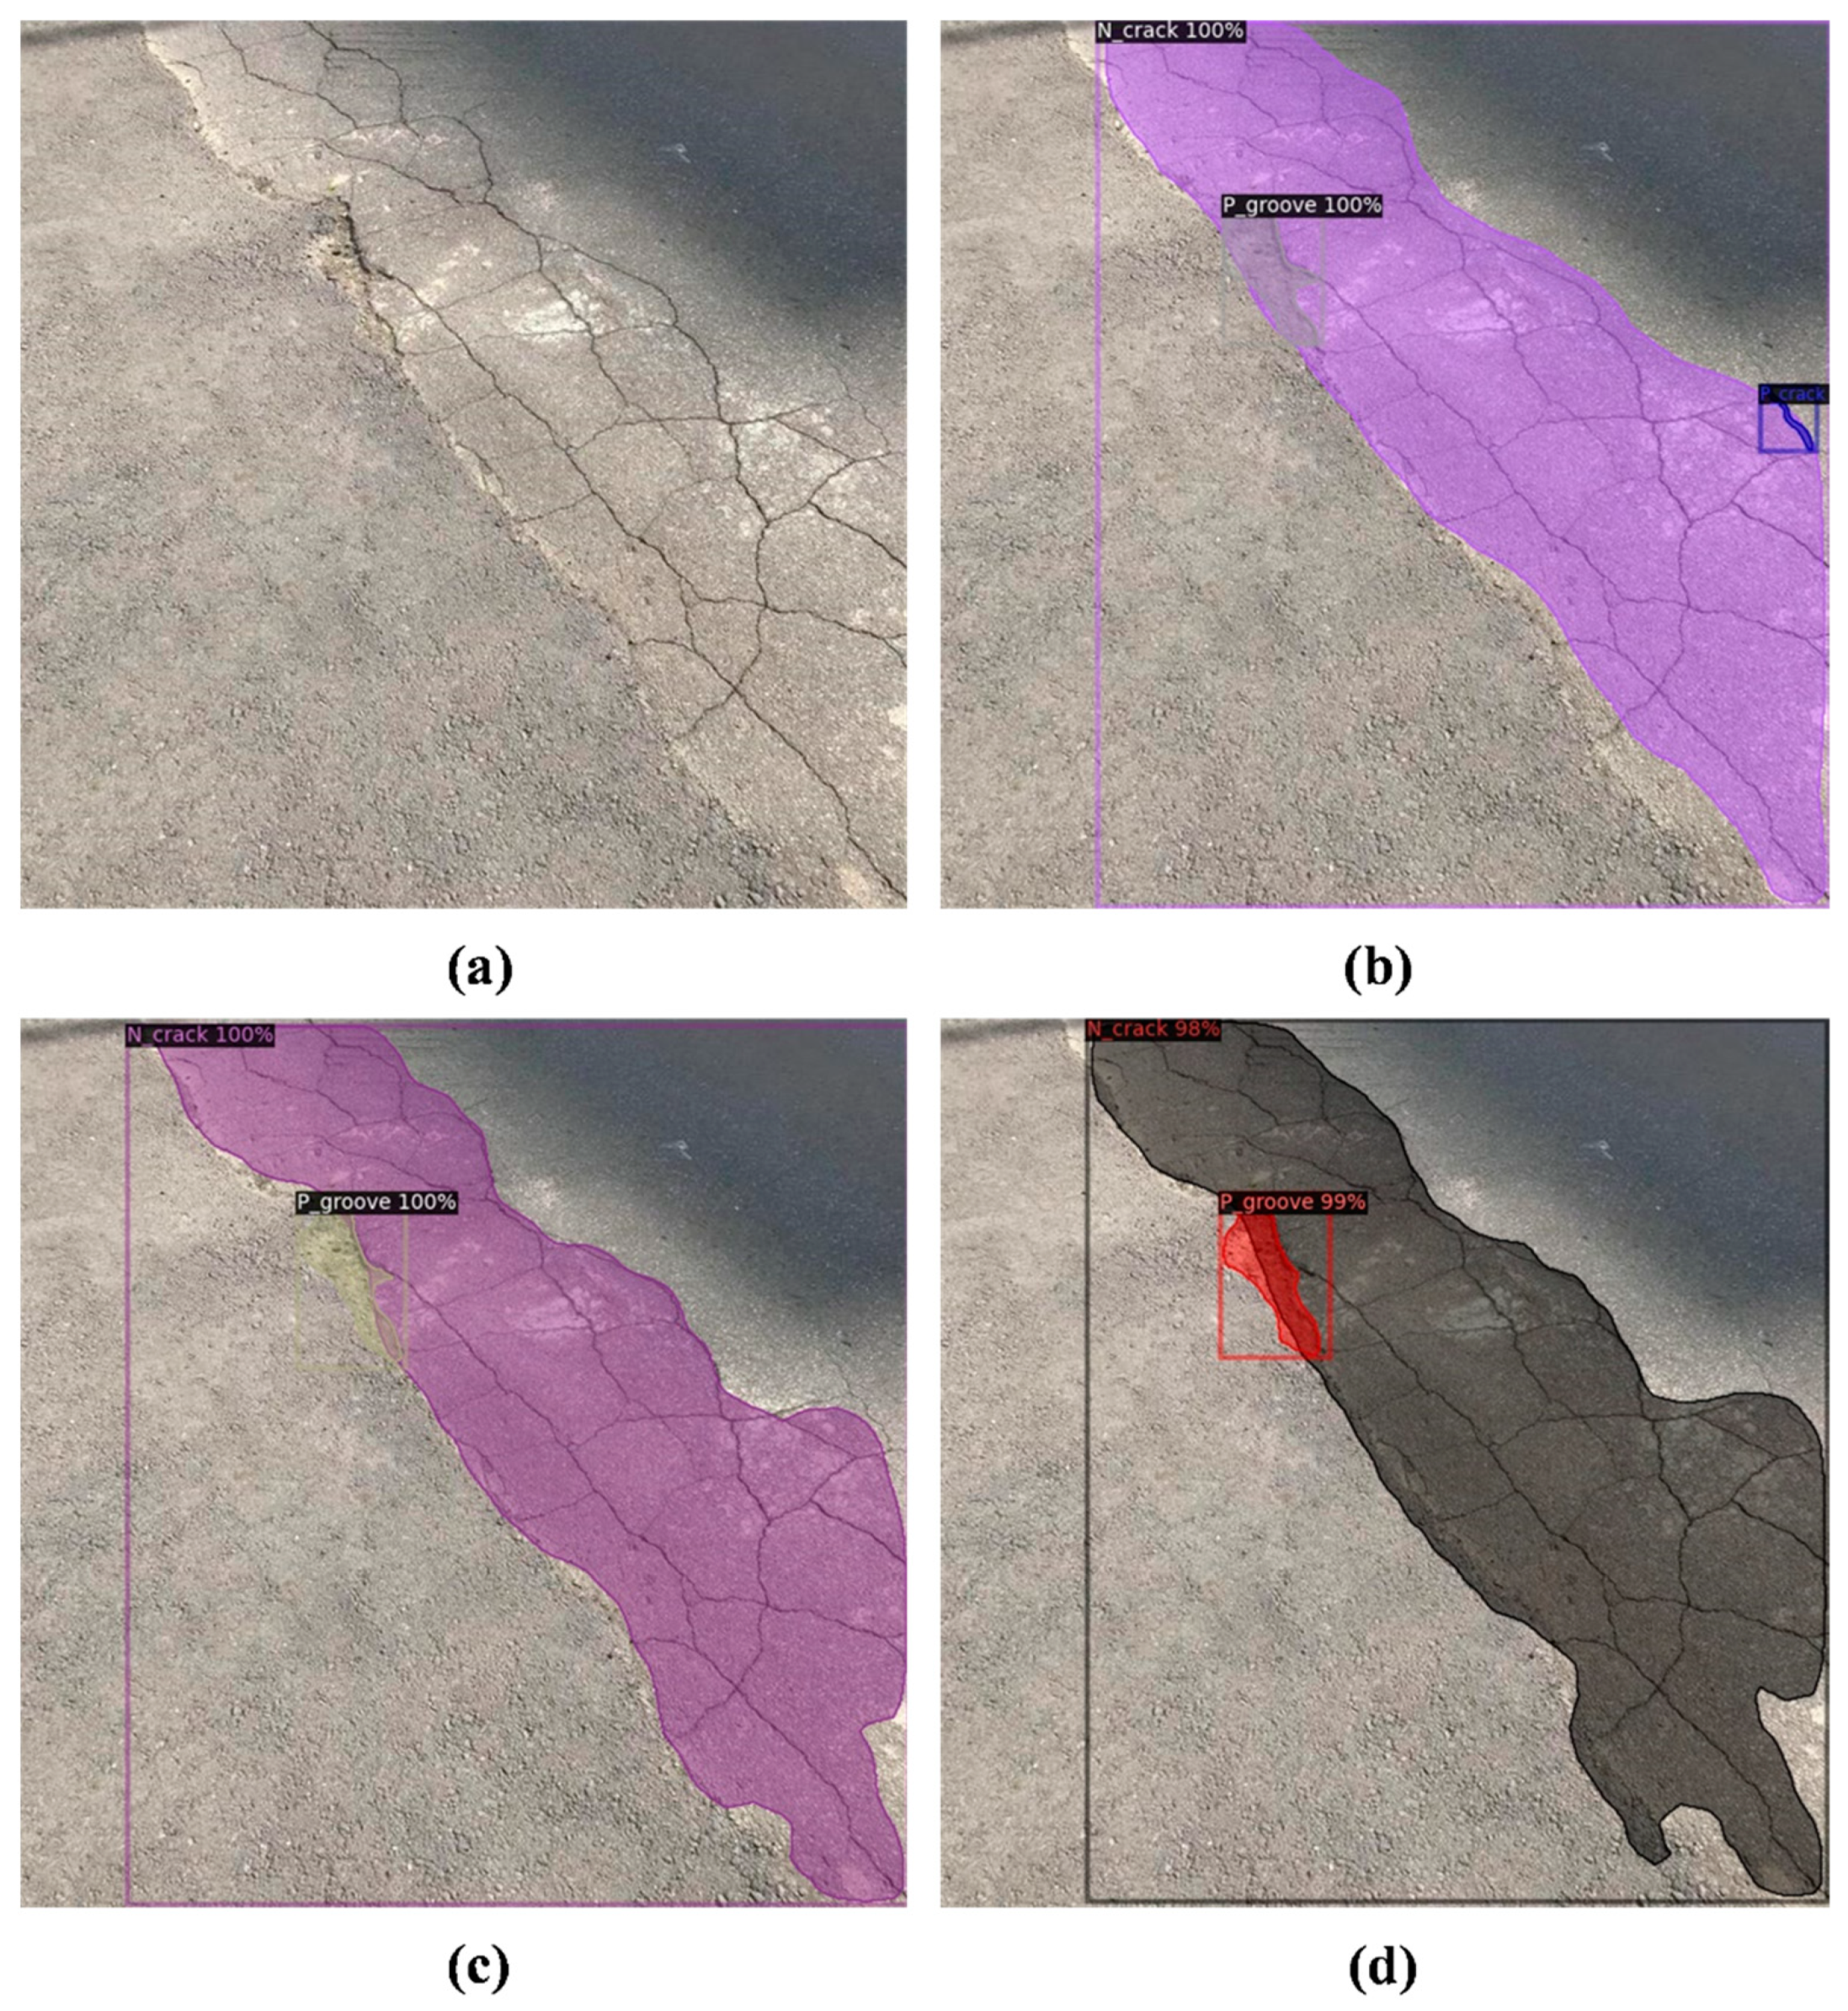
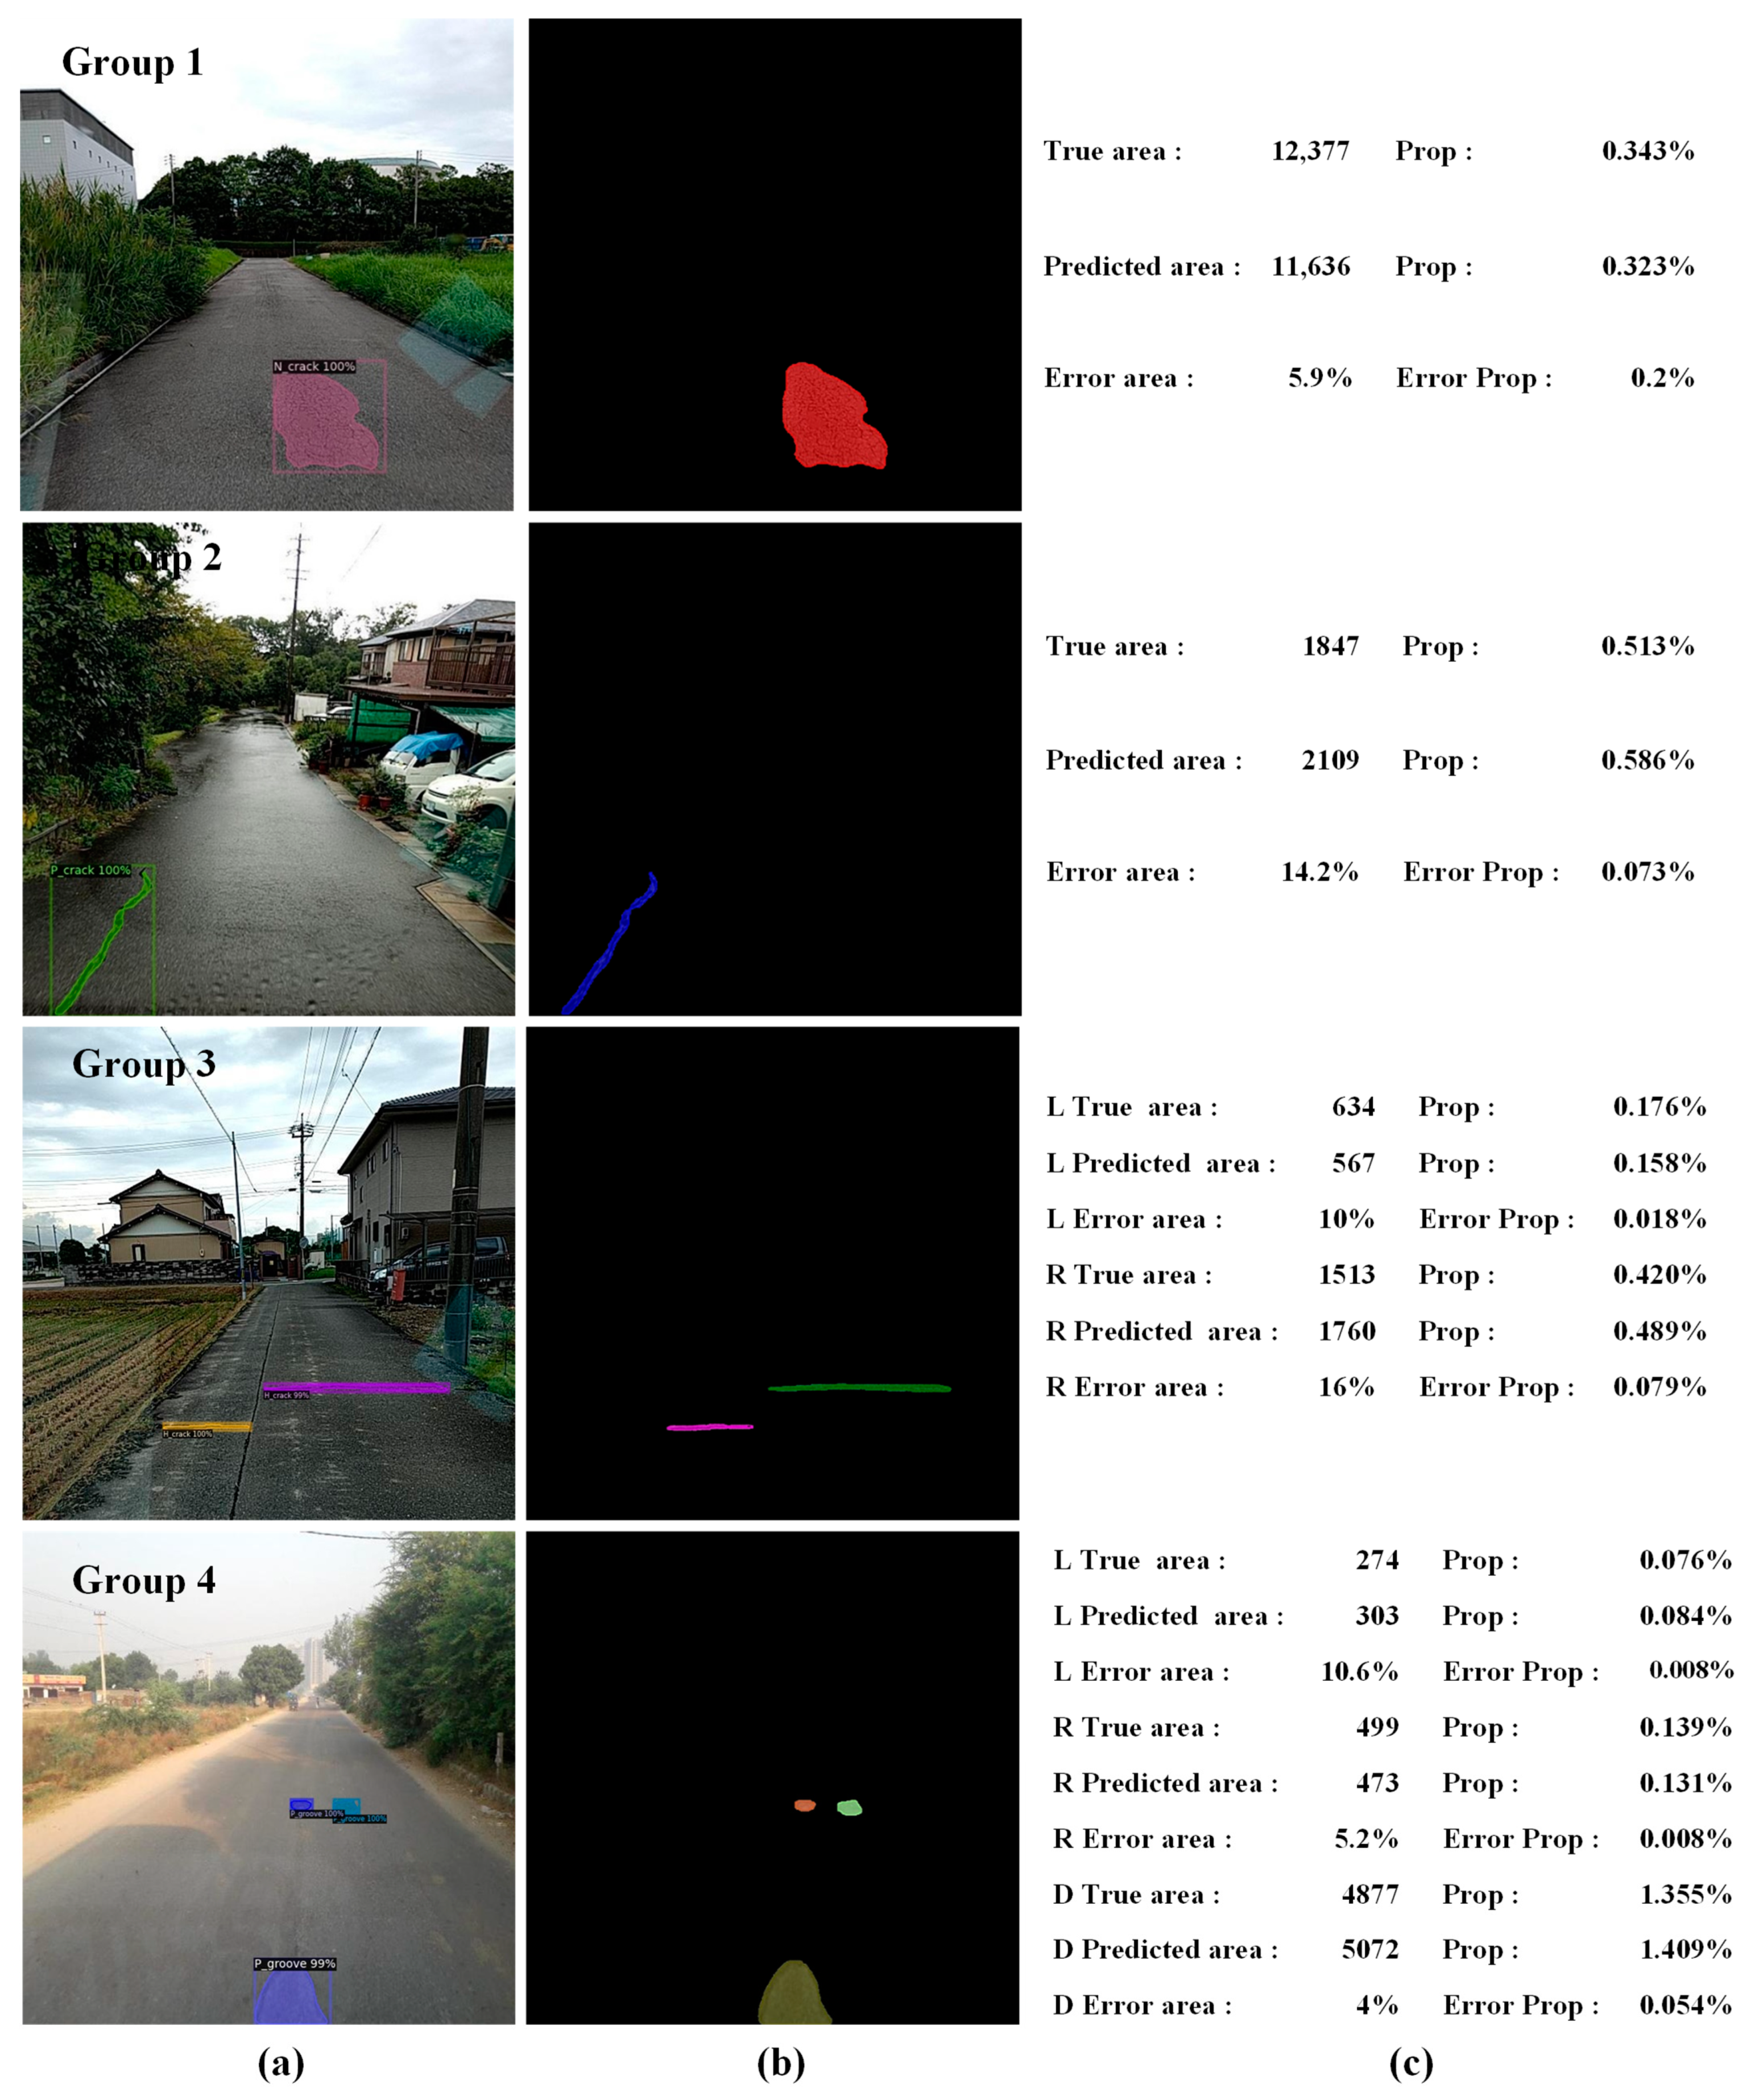
  • The testing results of M-R101-FPN showed that the model had certain capabilities in the detection of multiple defects of complex pavements, and the quantification error was within a certain acceptable range.
The conclusions show that the optimal model in this paper can solve the problem of pavement defect detection under complex backgrounds, and the quantitative results of the defects can provide a reference for pavement maintenance personnel. This paper established a dataset of 1200 pavement images, which was still insufficient compared with other types of well-known datasets, which also leads to an ideal AP. On the other hand, the dataset in this paper was collected by the driving recorder, which also made it impossible to predict the quantification of the real size and area of the defect. Therefore, future work needs to be carried out from three aspects: image acquisition perspective, augmenting the datasets, and trying more algorithms to further improve the detection effect of pavement defects.

Author Contributions

Project administration, J.Z. and S.T.; Writing—original draft, Y.H. and Z.J.; Writing—review & editing, J.Z., S.T., G.C., X.S. and F.C. All authors have read and agreed to the published version of the manuscript.

Funding

This research is supported by the Project of Guangdong Province High Level University Construction for Guangdong University of Technology (Grant No. 262519003).

Institutional Review Board Statement

Not applicable.

Informed Consent Statement

Not applicable.

Data Availability Statement

Some or all data, models, or code generated or used during the study are available from the corresponding author by request.

Conflicts of Interest

The authors declare no conflict of interest.

Appendix A

Figure A1. Classification accuracy curves of the training process: (a) F-R50-C4 and M-R50-C4, (b) F-R101-C4 and M-R101-C4.
Applsci 12 07364 g0a1
Figure A2. Loss curves of the training process: (a) F-R50-C4 and M-R50-C4, (b) F-R101-C4 and M-R101-C4.
Applsci 12 07364 g0a2
Figure A3. Classification accuracy curves of the training process: (a) F-R50-DC5 and M-R50-DC5, (b) F-R101-DC5 and M-R101-DC5.
Applsci 12 07364 g0a3
Figure A4. Loss curves of the training process: (a) F-R50-DC5 and M-R50-DC5, (b) F-R101-DC5 and M-R101-DC5.
Applsci 12 07364 g0a4
Figure A5. The AP under different iterations: (a) F-R50-C4 and M-R50-C4, (b) F-R101-C4 and M-R101-C4.
Applsci 12 07364 g0a5
Figure A6. The testing time under different iterations: (a) F-R50-C4 and M-R50-C4, (b) F-R101-C4 and M-R101-C4.
Applsci 12 07364 g0a6
Figure A7. The AP under different iterations: (a) F-R50-DC5 and M-R50-DC5, (b) F-R101-DC5 and M-R101-DC5.
Applsci 12 07364 g0a7
Figure A8. The testing time under different iterations: (a) F-R50-DC5 and M-R50-DC5, (b) F-R101-DC5 and M-R101-DC5.
Applsci 12 07364 g0a8
Table A1. The performance data of different models of the Mask R-CNN under LR = 0.01.
Backbone StructuresPrecision (%)Recall (%)F1 (%)AP (%)Time (SPF)
Mask R-CNN FPN89.184.385.283.60.206
ResNet50C473.580.176.768.70.560
DC587.689.488.585.10.382
FPN90.291.590.987.20.244
ResNet101C470.178.774.266.40.623
DC590.389.589.988.60.244

References

  1. Cao, W.M.; Liu, Q.F.; He, Z.Q. Review of Pavement Defect Detection Methods. IEEE Access 2020, 8, 14531–14544. [Google Scholar] [CrossRef]
  2. Zou, Q.; Cao, Y.; Li, Q.Q.; Mao, Q.Z.; Wang, S. Crack Tree: Automatic crack detection from pavement images. Pattern Recognit. Lett. 2012, 33, 227–238. [Google Scholar] [CrossRef]
  3. Hamrat, M.; Boulekbache, B.; Chemrouk, M.; Amziane, S. Flexural cracking behavior of normal strength, high strength and high strength fiber concrete beams, using Digital Image Correlation technique. Constr. Build. Mater. 2016, 106, 678–692. [Google Scholar] [CrossRef]
  4. Rimkus, A.; Podviezko, A.; Gribniak, V. Processing digital images for crack localization in reinforced concrete members. Procedia Eng. 2015, 122, 239–243. [Google Scholar] [CrossRef]
  5. Li, L.; Wang, Q.; Zhang, G.; Shi, L.; Dong, J.; Jia, P. A method of detecting the cracks of concrete undergo high-temperature. Constr. Build. Mater. 2018, 162, 345–358. [Google Scholar] [CrossRef]
  6. Kim, H.; Ahn, E.; Cho, S.; Shin, M.; Sim, S.H. Comparative analysis of image binarization methods for crack identification in concrete structures. Cem. Concr. Res. 2017, 99, 53–61. [Google Scholar] [CrossRef]
  7. Abdel-Qader, L.; Abudayyeh, O.; Kelly, M.E. Analysis of edge-detection techniques for crack identification in bridges. J. Comput. Civil. Eng. 2003, 17, 255–263. [Google Scholar] [CrossRef]
  8. Dollar, P.; Zitnick, C.L. Fast Edge Detection Using Structured Forests. IEEE Trans. Pattern Anal. Mach. Intell. 2015, 37, 1558–1570. [Google Scholar] [CrossRef] [Green Version]
  9. Dorafshan, S.; Thomas, R.J.; Maguire, M. Comparison of deep convolutional neural networks and edge detectors for image-based crack detection in concrete. Constr. Build. Mater. 2018, 186, 1031–1045. [Google Scholar] [CrossRef]
  10. Wang, K.C.P.; Li, Q.; Gong, W.G. Wavelet-based pavement distress image edge detection with a trous algorithm. Transp. Res. Record 2007, 2024, 73–81. [Google Scholar] [CrossRef]
  11. Ying, L.; Salari, E. Beamlet Transform-Based Technique for Pavement Crack Detection and Classification. Comput.-Aided Civil Infrastruct. Eng. 2010, 25, 572–580. [Google Scholar] [CrossRef]
  12. Ebrahimkhanlou, A.; Farhidzadeh, A.; Salamone, S. Multifractal analysis of crack patterns in reinforced concrete shear walls. Struct. Health Monit. 2016, 15, 81–92. [Google Scholar] [CrossRef]
  13. Oh, J.K.; Jang, G.; Oh, S.; Lee, J.H.; Yi, B.J.; Moon, Y.S.; Lee, J.S.; Choi, Y. Bridge inspection robot system with machine vision. Autom. Constr. 2009, 18, 929–941. [Google Scholar] [CrossRef]
  14. Lim, R.S.; La, H.M.; Sheng, W.H. A Robotic Crack Inspection and Mapping System for Bridge Deck Maintenance. IEEE Trans. Autom. Sci. Eng. 2014, 11, 367–378. [Google Scholar] [CrossRef]
  15. Talab, A.M.A.; Huang, Z.C.; Xi, F.; Liu, H.M. Detection crack in image using Otsu method and multiple filtering in image processing techniques. Optik 2016, 127, 1030–1033. [Google Scholar] [CrossRef]
  16. Jahanshahi, M.R.; Masri, S.F. Adaptive vision-based crack detection using 3D scene reconstruction for condition assessment of structures. Autom. Constr. 2012, 22, 567–576. [Google Scholar] [CrossRef]
  17. Chen, F.C.; Jahanshahi, M.R.; Wu, R.T.; Joffe, C. A texture-Based Video Processing Methodology Using Bayesian Data Fusion for Autonomous Crack Detection on Metallic Surfaces. Comput.-Aided Civil Infrastruct. Eng. 2017, 32, 271–287. [Google Scholar] [CrossRef]
  18. Jahanshahi, M.R.; Masri, S.F.; Padgett, C.W.; Sukhatme, G.S. An innovative methodology for detection and quantification of cracks through incorporation of depth perception. Mach. Vis. Appl. 2013, 24, 227–241. [Google Scholar] [CrossRef]
  19. Zhang, J.Q.; Zhang, J.W.; Teng, S.; Chen, G.F.; Teng, Z.Q. Structural Damage Detection Based on Vibration Signal Fusion and Deep Learning. J. Vib. Eng. Technol. 2022, 10, 1205–1220. [Google Scholar] [CrossRef]
  20. Zihan, J.; Shuai, T.; Jiqiao, Z.; Gongfa, C. Structural Damage Recognition Based on Filtered Feature Selection and Convolutional Neural Network. Int. J. Struct. Stab. Dyn. 2022, 2250134. [Google Scholar] [CrossRef]
  21. Mohan, A.; Poobal, S. Crack detection using image processing: A critical review and analysis. Alex. Eng. J. 2018, 57, 787–798. [Google Scholar] [CrossRef]
  22. Zakeri, H.; Moghadas Nejad, F.; Fahimifar, A. Image Based Techniques for Crack Detection, Classification and Quantification in Asphalt Pavement: A Review. Arch. Comput. Method Eng. 2017, 24, 935–977. [Google Scholar] [CrossRef]
  23. Chaiyasarn, K.; Buatik, A.; Mohamad, H.; Zhou, M.L.; Kongsilp, S.; Poovarodom, N. Integrated pixel-level CNN-FCN crack detection via photogrammetric 3D texture mapping of concrete structures. Autom. Constr. 2022, 140, 17. [Google Scholar] [CrossRef]
  24. Yu, B.; Meng, X.; Yu, Q. Automated Pixel-Wise Pavement Crack Detection by Classification-Segmentation Networks. J. Transp. Eng. Part B-Pavements 2021, 147, 04021005. [Google Scholar] [CrossRef]
  25. Liu, F.; Liu, J.; Wang, L. Deep learning and infrared thermography for asphalt pavement crack severity classification. Autom. Constr. 2022, 140, 104383. [Google Scholar] [CrossRef]
  26. Wang, G.; Xiang, J. Railway sleeper crack recognition based on edge detection and CNN. Smart Struct. Syst. 2021, 28, 779–789. [Google Scholar] [CrossRef]
  27. Tong, Z.; Gao, J.; Zhang, H. Recognition, location, measurement, and 3D reconstruction of concealed cracks using convolutional neural networks. Constr. Build. Mater. 2017, 146, 775–787. [Google Scholar] [CrossRef]
  28. Ali, R.; Chuah, J.H.; Abu Talip, M.S.; Mokhtar, N.; Shoaib, M.A. Structural crack detection using deep convolutional neural networks. Autom. Constr. 2022, 133, 103989. [Google Scholar] [CrossRef]
  29. Wang, K.C.P.; Zhang, A.; Li, J.Q.; Fei, Y.; Chen, C.; Li, B.X. Deep Learning for Asphalt Pavement Cracking Recognition Using Convolutional Neural Network. In Airfield and Highway Pavements; American Society of Civil Engineers: Reston, VA, USA, 2017; pp. 166–177. [Google Scholar]
  30. Cha, Y.J.; Choi, W.; Buyukozturk, O. Deep Learning-Based Crack Damage Detection Using Convolutional Neural Networks. Comput.-Aided Civil Infrastruct. Eng. 2017, 32, 361–378. [Google Scholar] [CrossRef]
  31. Wu, L.J.; Lin, X.; Chen, Z.C.; Lin, P.J.; Cheng, S.Y. Surface crack detection based on image stitching and transfer learning with pretrained convolutional neural network. Struct. Control. Health Monit. 2021, 28, e2766. [Google Scholar] [CrossRef]
  32. Zhuang, F.Z.; Qi, Z.Y.; Duan, K.Y.; Xi, D.B.; Zhu, Y.C.; Zhu, H.S.; Xiong, H.; He, Q. A Comprehensive Survey on Transfer Learning. Proc. IEEE 2021, 109, 43–76. [Google Scholar] [CrossRef]
  33. Du, Y.C.; Pan, N.; Xu, Z.H.; Deng, F.W.; Shen, Y.; Kang, H. Pavement distress detection and classification based on YOLO network. Int. J. Pavement Eng. 2021, 22, 1659–1672. [Google Scholar] [CrossRef]
  34. Majidifard, H.; Adu-Gyamfi, Y.; Buttlar, W.G. Deep machine learning approach to develop a new asphalt pavement condition index. Constr. Build. Mater. 2020, 247, 118513. [Google Scholar] [CrossRef]
  35. Uijlings, J.R.R.; van de Sande, K.E.A.; Gevers, T.; Smeulders, A.W.M. Selective Search for Object Recognition. Int. J. Comput. Vis. 2013, 104, 154–171. [Google Scholar] [CrossRef] [Green Version]
  36. Teng, S.; Liu, Z.C.; Chen, G.F.; Cheng, L. Concrete Crack Detection Based on Well-Known Feature Extractor Model and the YOLO_v2 Network. Appl. Sci. 2021, 11, 813. [Google Scholar] [CrossRef]
  37. Deng, L.; Chu, H.H.; Shi, P.; Wang, W.; Kong, X. Region-Based CNN Method with Deformable Modules for Visually Classifying Concrete Cracks. Appl. Sci. 2020, 10, 2528. [Google Scholar] [CrossRef] [Green Version]
  38. Girshick, R. Fast R-CNN. In Proceedings of the IEEE International Conference on Computer Vision, Santiago, Chile, 7–13 December 2015; pp. 1440–1448. [Google Scholar] [CrossRef]
  39. He, K.M.; Zhang, X.Y.; Ren, S.Q.; Sun, J. Spatial Pyramid Pooling in Deep Convolutional Networks for Visual Recognition. IEEE Trans. Pattern Anal. Mach. Intell. 2015, 37, 1904–1916. [Google Scholar] [CrossRef] [Green Version]
  40. Ren, S.Q.; He, K.M.; Girshick, R.; Sun, J. Faster R-CNN: Towards Real-Time Object Detection with Region Proposal Networks. IEEE Trans. Pattern Anal. Mach. Intell. 2017, 39, 1137–1149. [Google Scholar] [CrossRef] [Green Version]
  41. Cha, Y.J.; Choi, W.; Suh, G.; Mahmoudkhani, S.; Buyukozturk, O. Autonomous Structural Visual Inspection Using Region-Based Deep Learning for Detecting Multiple Damage Types. Comput.-Aided Civil Infrastruct. Eng. 2018, 33, 731–747. [Google Scholar] [CrossRef]
  42. Ju, H.Y.; Li, W.; Tighe, S.S.; Xu, Z.C.; Zhai, J.Z. CrackU-net: A novel deep convolutional neural network for pixelwise pavement crack detection. Struct. Control. Health Monit. 2020, 27, 19. [Google Scholar] [CrossRef]
  43. Zhang, Z.X.; Liu, Q.J.; Wang, Y.H. Road Extraction by Deep Residual U-Net. IEEE Geosci. Remote Sens. Lett. 2018, 15, 749–753. [Google Scholar] [CrossRef] [Green Version]
  44. Badrinarayanan, V.; Kendall, A.; Cipolla, R. SegNet: A Deep Convolutional Encoder-Decoder Architecture for Image Segmentation. IEEE Trans. Pattern Anal. Mach. Intell. 2017, 39, 2481–2495. [Google Scholar] [CrossRef] [PubMed]
  45. Huang, H.W.; Li, Q.T.; Zhang, D.M. Deep learning based image recognition for crack and leakage defects of metro shield tunnel. Tunn. Undergr. Space Technol. 2018, 77, 166–176. [Google Scholar] [CrossRef]
  46. Shelhamer, E.; Long, J.; Darrell, T. Fully Convolutional Networks for Semantic Segmentation. IEEE Trans. Pattern Anal. Mach. Intell. 2017, 39, 640–651. [Google Scholar] [CrossRef] [PubMed]
  47. Yang, F.; Zhang, L.; Yu, S.J.; Prokhorov, D.; Mei, X.; Ling, H.B. Feature Pyramid and Hierarchical Boosting Network for Pavement Crack Detection. IEEE Trans. Intell. Transp. Syst. 2020, 21, 1525–1535. [Google Scholar] [CrossRef] [Green Version]
  48. Dung, C.V.; Anh, L.D. Autonomous concrete crack detection using deep fully convolutional neural network. Autom. Constr. 2019, 99, 52–58. [Google Scholar] [CrossRef]
  49. Li, S.Y.; Zhao, X.F.; Zhou, G.Y. Automatic pixel-level multiple damage detection of concrete structure using fully convolutional network. Comput.-Aided Civil Infrastruct. Eng. 2019, 34, 616–634. [Google Scholar] [CrossRef]
  50. He, K.M.; Gkioxari, G.; Dollar, P.; Girshick, R. Mask R-CNN. IEEE Trans. Pattern Anal. Mach. Intell. 2020, 42, 386–397. [Google Scholar] [CrossRef]
  51. Huang, H.W.; Zhao, S.; Zhang, D.M.; Chen, J.Y. Deep learning-based instance segmentation of cracks from shield tunnel lining images. Struct. Infrastruct. Eng. 2022, 18, 183–196. [Google Scholar] [CrossRef]
  52. Wu, Z.Y.; Kalfarisi, R.; Kouyoumdjian, F.; Taelman, C. Applying deep convolutional neural network with 3D reality mesh model for water tank crack detection and evaluation. Urban Water J. 2020, 17, 682–695. [Google Scholar] [CrossRef]
  53. Taghanaki, S.A.; Abhishek, K.; Cohen, J.P.; Cohen-Adad, J.; Hamarneh, G. Deep semantic segmentation of natural and medical images: A review. Artif. Intell. Rev. 2021, 54, 137–178. [Google Scholar] [CrossRef]
  54. Wen, S.P.; Liu, W.W.; Yang, Y.; Zhou, P.; Guo, Z.Y.; Yan, Z.; Chen, Y.R.; Huang, T.W. Multilabel Image Classification via Feature/Label Co-Projection. IEEE Trans. Syst. Man Cybern.-Syst. 2021, 51, 7250–7259. [Google Scholar] [CrossRef]
  55. He, K.; Zhang, X.; Ren, S.; Sun, J. Deep Residual Learning for Image Recognition. In Proceedings of the IEEE Conference on Computer Vision and Pattern Recognition (CVPR), Las Vegas, NV, USA, 27–30 June 2016; pp. 770–778. [Google Scholar]
  56. Chen, Q.; Wang, Y.M.; Yang, T.; Zhang, X.Y.; Cheng, J.; Sun, J.; Ieee Comp, S.O.C. You Only Look One-level Feature. In Proceedings of the IEEE/CVF Conference on Computer Vision and Pattern Recognition (CVPR), Electr Network, 19–25 June 2021; pp. 13034–13043. [Google Scholar] [CrossRef]
Figure 1. Defects labelled by Labelme: (a) H_crack, (b) P_crack, (c) N_crack, (d) P_groove.
Applsci 12 07364 g001
Figure 2. The process of transfer learning.
Applsci 12 07364 g002
Figure 3. Network structure of Faster R-CNN and Mask R-CNN.
Applsci 12 07364 g003
Figure 4. Feature pyramid network.
Applsci 12 07364 g004
Figure 5. Visualization diagram of RoI operation: (a) pooling, (b) align.
Applsci 12 07364 g005
Figure 6. Classification accuracy curves of the training process: (a) F-R50-FPN and M-R50-FPN, (b) F-R101-FPN and M-R101-FPN.
Applsci 12 07364 g006
Figure 7. Loss curves of the training process: (a) F-R50-FPN and M-R50-FPN, (b) F-R101-FPN and M-R101-FPN.
Applsci 12 07364 g007
Figure 8. Comparisons of the AP and testing time of the Faster R-CNN and Mask R-CNN with six backbone structures: (a) AP, (b) testing time.
Applsci 12 07364 g008
Figure 9. Testing results: (a) original image, (b) F-R50-FPN, (c) M-R50-FPN.
Applsci 12 07364 g009
Figure 10. The AP under different iterations: (a) F-R50-FPN and M-R50-FPN, (b) F-R101-FPN and M-R101-FPN.
Applsci 12 07364 g010
Figure 11. The testing time under different iterations: (a) F-R50-FPN and M-R50-FPN, (b) F-R101-FPN and M-R101-FPN.
Applsci 12 07364 g011
Figure 12. The AP and testing time of different models under different iterations and learning rates. (a) The AP of M-R50-C4, (b) The testing time of M-R50-C4, (c) The AP of M-R101-FPN, (d) The testing time of M-R101-FPN.
Applsci 12 07364 g012
Figure 13. Testing result of M-R50-C4: (a) original image, (b) LR = 0.01, (c) LR = 0.001, (d) LR = 0.0001.
Applsci 12 07364 g013
Figure 14. Testing result of M-R101-FPN: (a) original image, (b) LR = 0.01, (c) LR = 0.001, (d) LR = 0.0001.
Applsci 12 07364 g014
Figure 15. Testing result: (a) M-R101-FPN, (b) clustering and mask banalizations, (c) quantitative results. Notes: L: Left, R: Right, D: Down, Prop: Proportion of defect pixel area in the pixel area of the whole image.
Applsci 12 07364 g015
Table 1. Instance segmentation dataset of the defects.
ClassH_crackP_crackN_crackP_groove
Numbers497518541487
Table 2. Backbone structures of the Faster R-CNN and Mask R-CNN.
Backbone Structures
ResNet-50ResNet-101
Faster R-CNN
Mask R-CNN
FPNF-R50-FPNM-R50-FPNF-R101-FPNM-R101-FPN
C4F-R50-C4M-R50-C4F-R101-C4M-R101-C4
DC5F-R50-DC5M-R50-DC5F-R101-DC5M-R101-DC5
Table 3. The detection accuracy with different backbone structures.
Backbone Structures
ResNet-50ResNet-101
FPNC4DC5FPNC4DC5
Faster R-CNN100%100%100%98.7%100%100%
Mask R-CNN99.4%100%100%99.3%100%100%
Table 4. The performance data with different backbone structures.
Backbone StructuresPrecision (%)Recall (%)F1 (%)AP (%)Time (SPF)
Faster R-CNN FPN90.692.491.586.50.228
ResNet50C487.190.688.885.70.536
DC588.190.289.185.60.379
FPN84.590.487.490.10.251
ResNet101C488.784.586.587.10.564
DC589.190.489.788.20.431
Mask R-CNN FPN92.493.692.987.40.210
ResNet50C491.792.592.187.30.533
DC590.389.790.088.50.390
FPN92.793.192.991.40.242
ResNet101C491.392.491.888.70.614
DC590.690.190.390.20.422
Table 5. The performance data of different models of the Mask R-CNN under LR = 0.0001.
Backbone StructuresPrecision (%)Recall (%)F1 (%)AP (%)Time (SPF)
Mask R-CNN FPN91.393.692.488.40.210
ResNet50C488.592.190.386.20.568
DC585.790.490.085.80.391
FPN94.895.395.092.10.247
ResNet101C492.393.592.988.50.595
DC590.691.290.989.70.426
Publisher’s Note: MDPI stays neutral with regard to jurisdictional claims in published maps and institutional affiliations.

