
Salt-Fog Corrosion Behavior of GCr15 Steels Treated by Ultrasonic Strengthening Grinding Process


 ,
,
Abstract
:1. Introduction
2. Materials and Methods
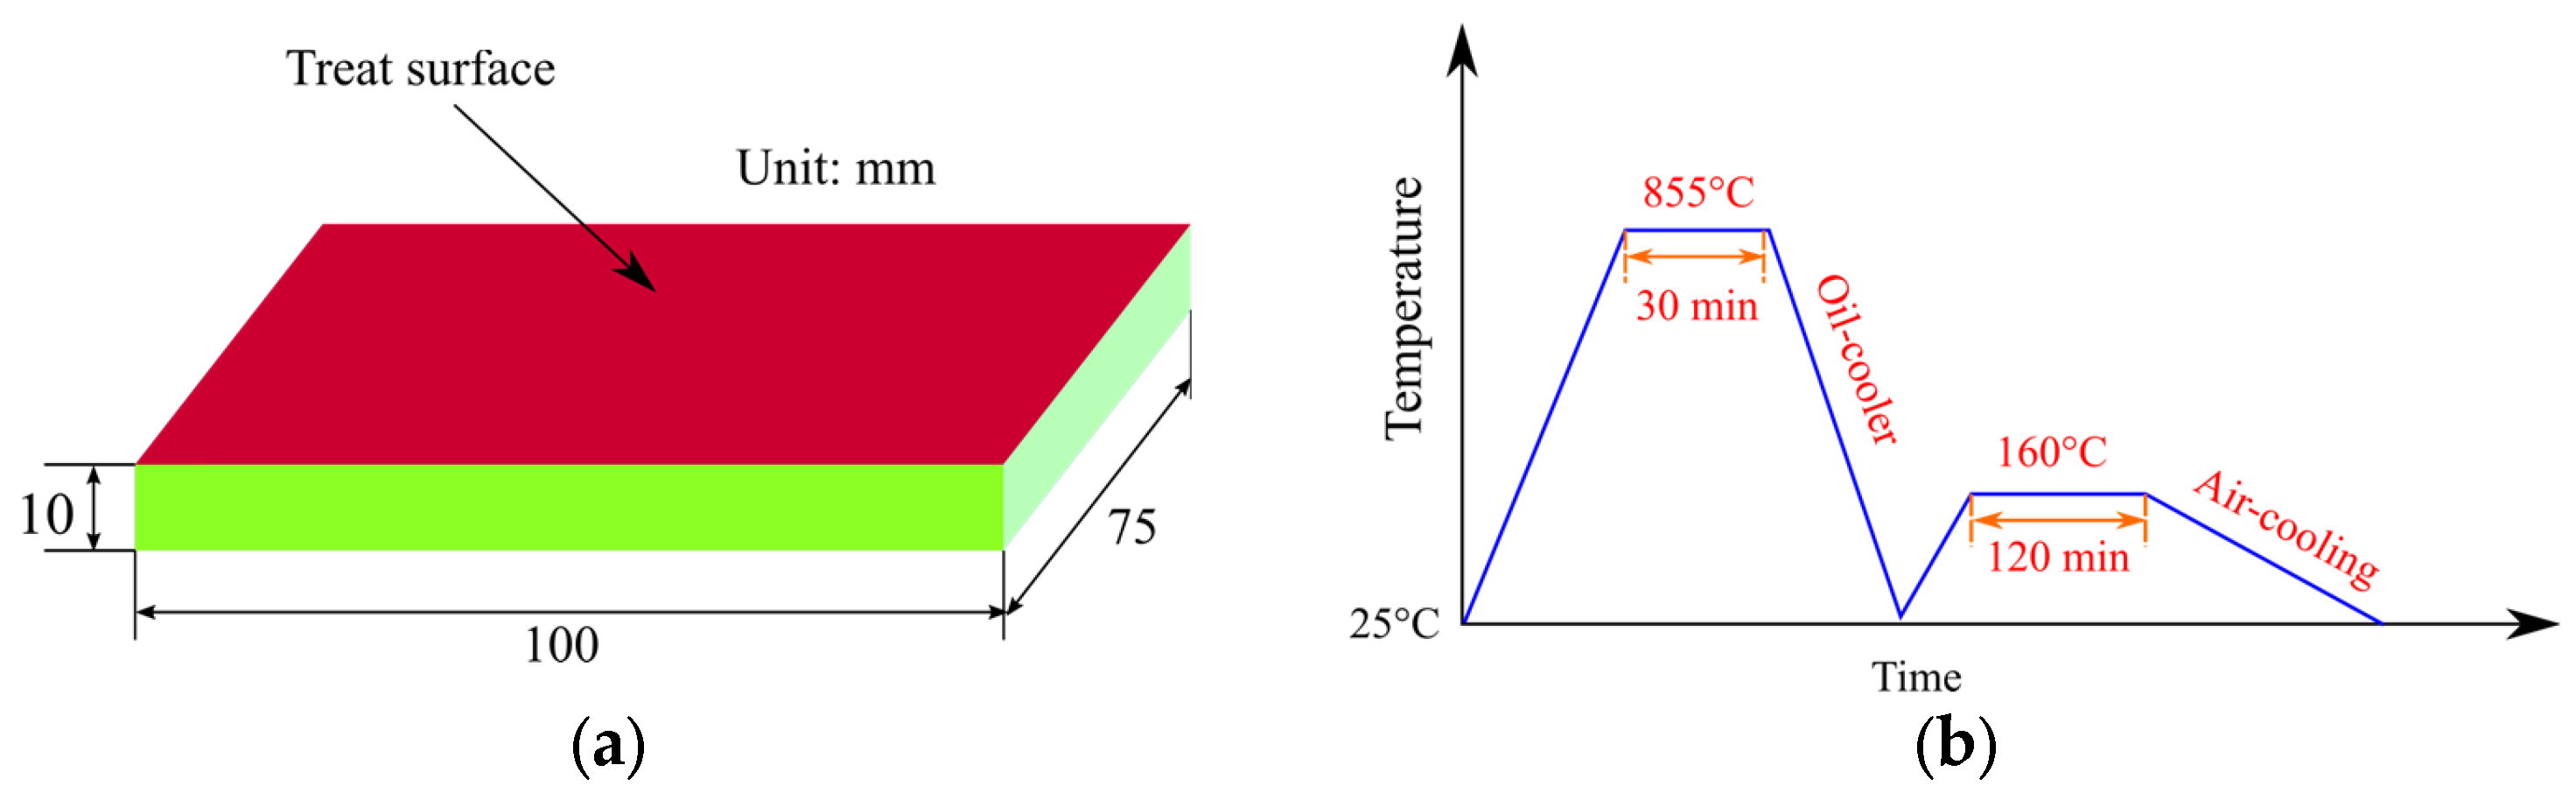
2.1. Samples Preparation
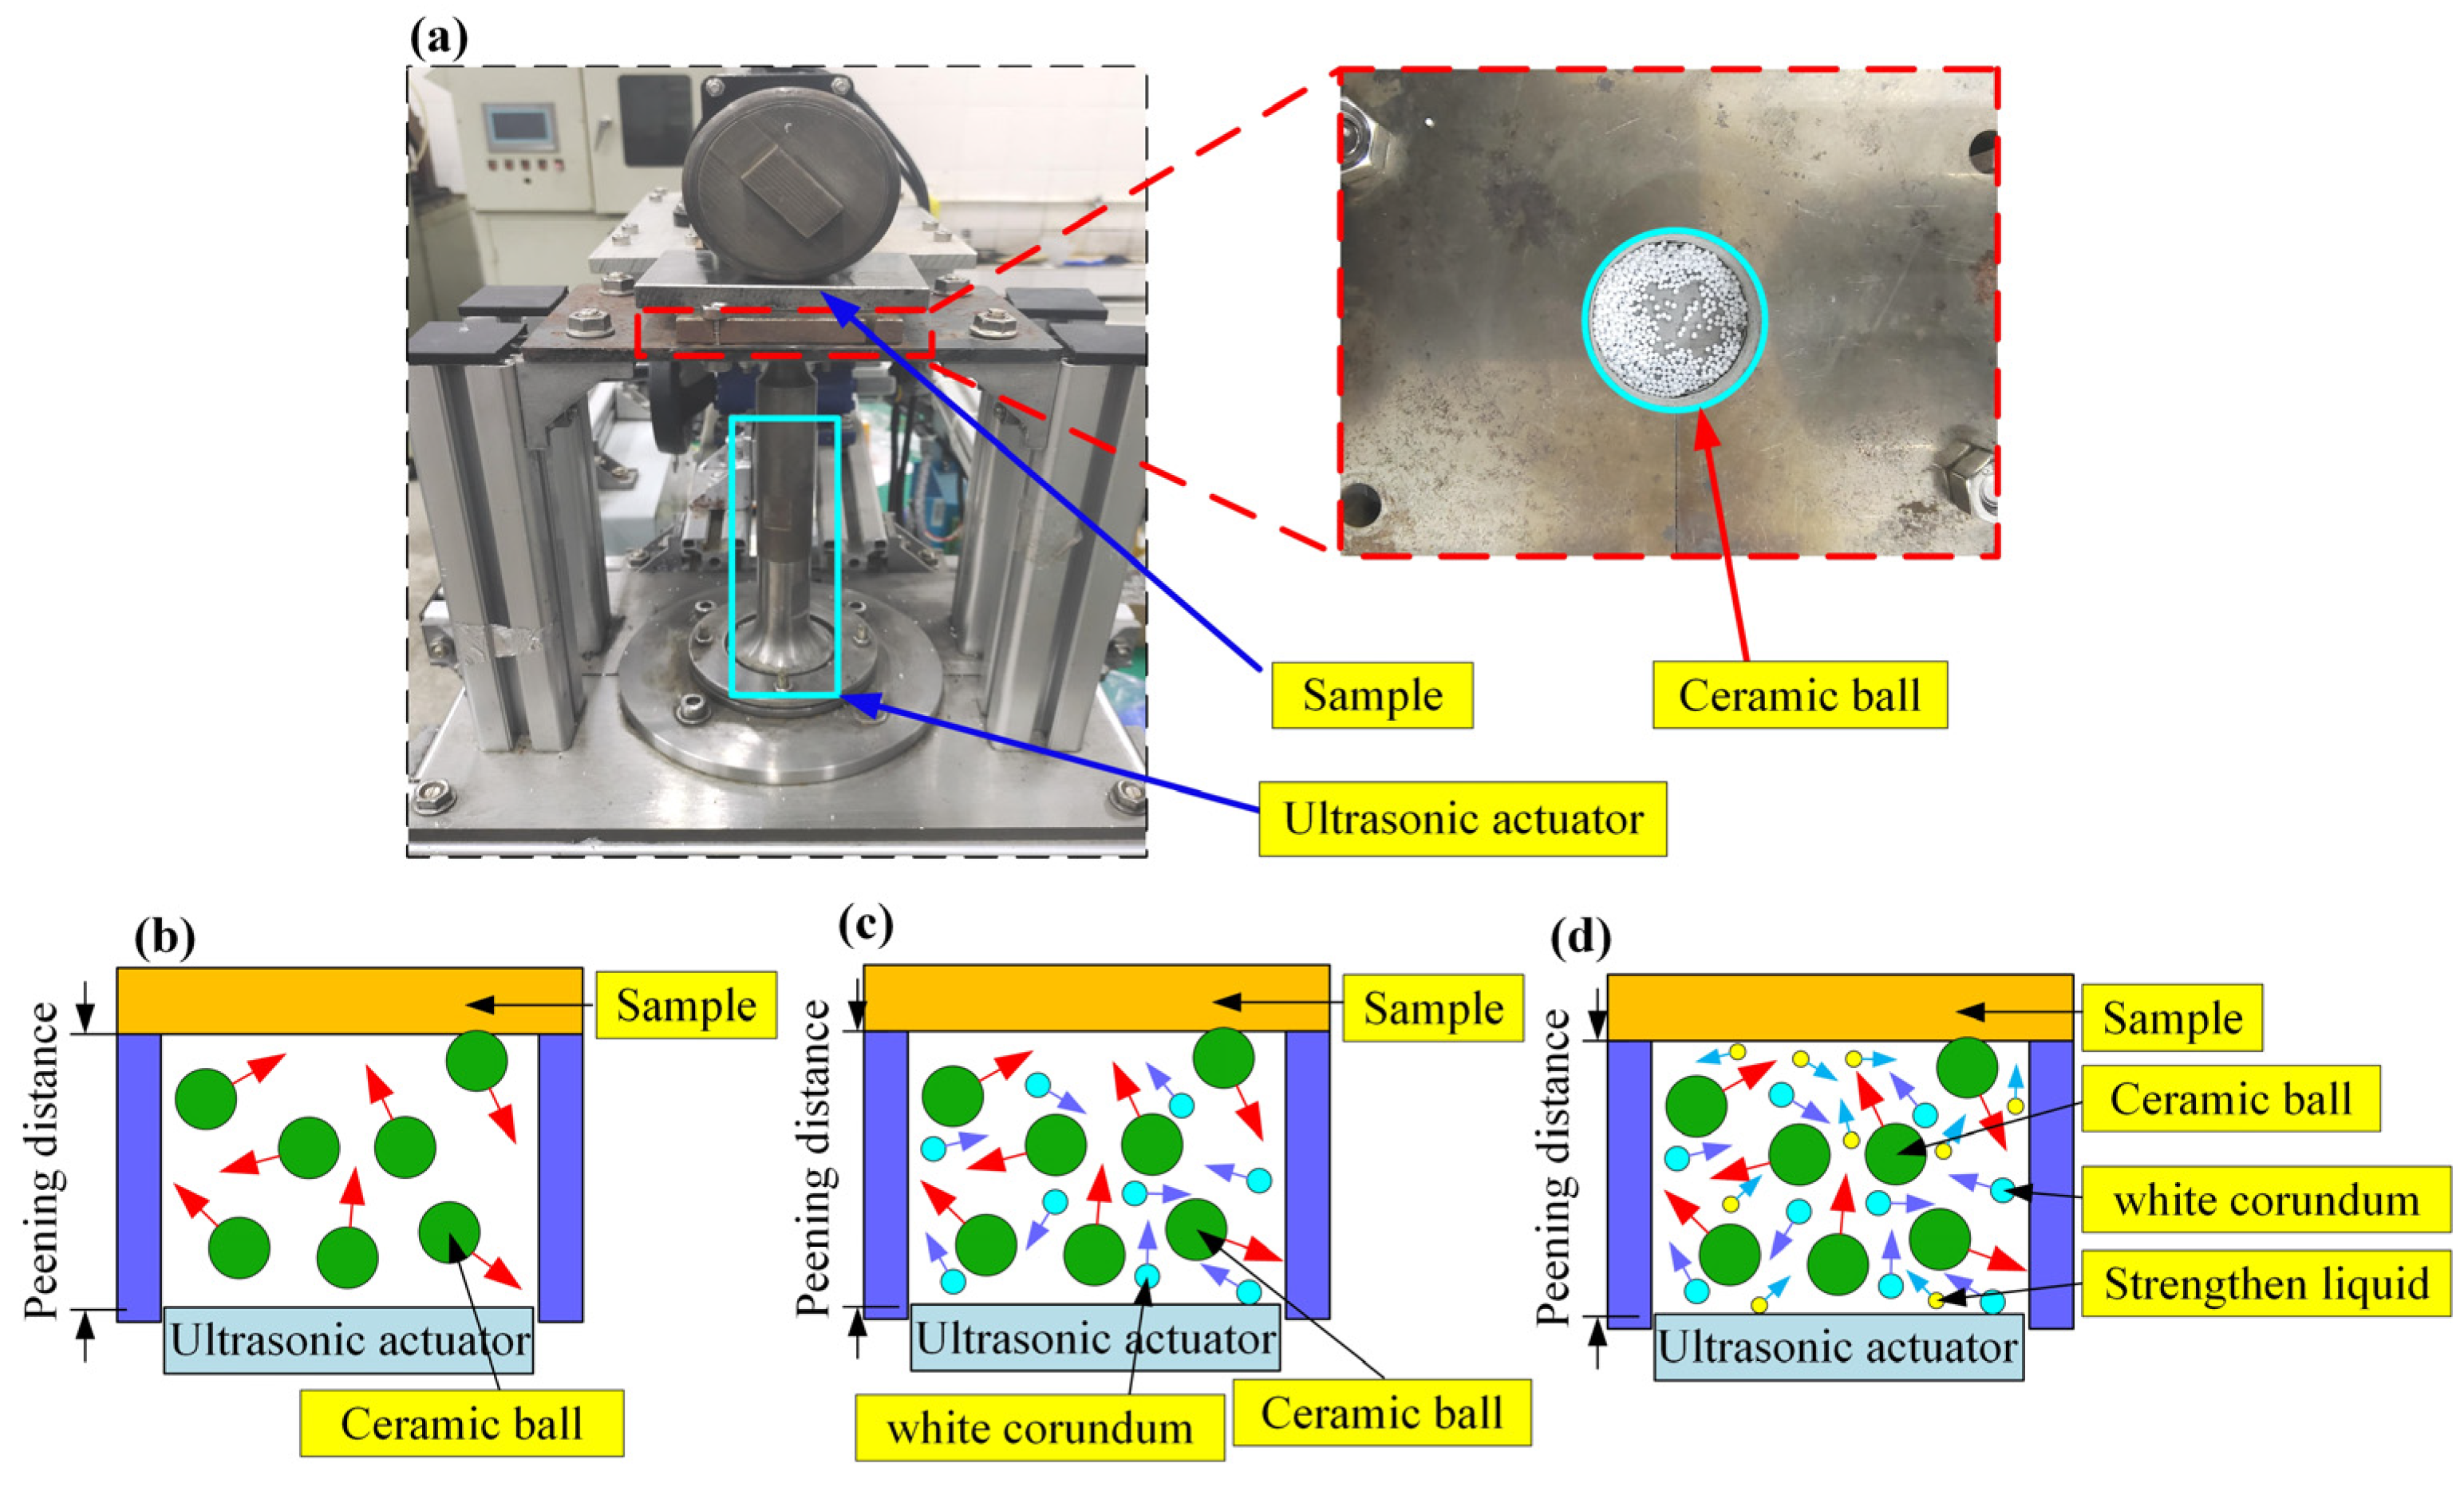
2.2. Surface Treatment of the Samples
2.3. Salt Spray Process of the Samples
2.4. Characterization
3. Results and Discussion
4. Conclusions
Author Contributions
Funding
Institutional Review Board Statement
Informed Consent Statement
Data Availability Statement
Acknowledgments
Conflicts of Interest
References
- Bhadeshia, H. Steels for bearings. Prog. Mater. Sci. 2012, 57, 268–435. [Google Scholar] [CrossRef]
- Li, K.; Chen, Z.X.; Liu, P.P.; Li, G.L.; Ding, M.R.; Li, Z.X. Characterization and performance analysis of 3D reconstruction of oil-lubricated Si3N4-GCr15/GCr15-GCr15 friction and wear surface. J. Therm. Anal. Calorim. 2021, 144, 2127–2143. [Google Scholar] [CrossRef]
- Cao, Y.J.; Sun, J.Q.; Ma, F.; Chen, Y.Y.; Cheng, X.Z.; Gao, X.; Xie, K. Effect of the microstructure and residual stress on tribological behavior of induction hardened GCr15 steel. Tribol. Int. 2017, 115, 108–115. [Google Scholar] [CrossRef]
- Li, C.N.; Yan, Y.; Gai, Y.H.; Li, B.M.; Du, W.; Li, M.S. Failure Analysis of GCr15 Steel Balls in Ball Screw Pair. Trans Tech Publ. 2014, 24, 651–652. [Google Scholar] [CrossRef]
- Xue, Y.; Shi, X.; Zhou, H.; Lu, G.; Zhang, J. Effects of groove-textured surface combined with Sn–Ag–Cu lubricant on friction-induced vibration and noise of GCr15 bearing steel. Tribol. Int. 2020, 148, 106316. [Google Scholar] [CrossRef]
- Ma, Y.; Li, Y.; Wang, F. The atmospheric corrosion kinetics of low carbon steel in a tropical marine environment. Corros. Sci. 2010, 52, 1796–1800. [Google Scholar] [CrossRef]
- McNeill, L.S.; Edwards, M. The importance of temperature in assessing iron pipe corrosion in water distribution systems. Environ. Monit. Assess. 2002, 77, 229–242. [Google Scholar] [CrossRef]
- Yan, L.C.; Diao, Y.P.; Lang, Z.Y.; Gao, K.W. Corrosion rate prediction and influencing factors evaluation of low-alloy steels in marine atmosphere using machine learning approach. Sci. Technol. Adv. Mater. 2020, 21, 359–370. [Google Scholar] [CrossRef] [Green Version]
- Li, Y.; Liu, Z.Y.; Wu, W.; Li, X.G.; Zhao, J.B. Crack growth behaviour of E690 steel in artificial seawater with various pH values. Corros. Sci. 2020, 164, 11. [Google Scholar] [CrossRef]
- Buchheit, R.G.; Birbilis, N. Electrochemical microscopy an approach for understanding localized corrosion in microstructurally complex metallic alloys. Electrochim. Acta 2010, 55, 7853–7859. [Google Scholar] [CrossRef]
- Mansfeld, F.; Liu, G.; Xiao, H.; Tsai, C.H.; Little, B.J. The corrosion behavior of copper alloys, stainless steels and titanium in seawater. Corrosion Sci. 1994, 36, 2063–2095. [Google Scholar] [CrossRef]
- Zhao, Z.; Tang, J.; ul Haq Tariq, N.; Wang, J.; Cui, X.; Xiong, T. Microstructure and corrosion behavior of cold-sprayed Zn-Al composite coating. Coatings 2020, 10, 931. [Google Scholar] [CrossRef]
- Wu, Y.; Lin, J.; Wang, P.-C.; Zheng, R.; Wu, Q. Effect of long-term neutral salt spray exposure on durability of adhesive-bonded Zr–Ti coated aluminum joint. Int. J. Adhes. Adhes. 2016, 64, 97–108. [Google Scholar] [CrossRef]
- Bai, Y.; Li, X.; Xing, L.; Li, Y. Effect of salt spray corrosion on tribological properties of HVOF sprayed NiCr-Cr3C2 coating with intermediate layer. J. Wuhan Univ. Technol.-Mat. Sci. Edit. 2017, 32, 292–298. [Google Scholar] [CrossRef]
- Matthews, S.; James, B.; Hyland, M. The role of microstructure in the mechanism of high velocity erosion of Cr3C2–NiCr thermal spray coatings: Part 1—As-sprayed coatings. Surf. Coat. Technol. 2009, 203, 1086–1093. [Google Scholar] [CrossRef]
- Li, X.; Jiang, Y.; Jiang, Z.; Li, Y.; Wen, C.; Zhang, D.; Lian, J.; Zhang, Z. Improvement of corrosion resistance of H59 brass through fabricating superhydrophobic surface using laser ablation and heating treatment. Corros. Sci. 2021, 180, 109186. [Google Scholar] [CrossRef]
- Li, L.; Chen, Y.; Lu, Y.; Qin, S.; Huang, G.; Huang, T.; Lin, J. Effect of heat treatment on the corrosion resistance of selective laser melted Ti6Al4V3Cu alloy. J. Mater. Res. Technol.-JMRT 2021, 12, 904–915. [Google Scholar] [CrossRef]
- Cao, F.-Y.; Zhang, J.; Li, K.-K.; Song, G.-L. Influence of heat treatment on corrosion behavior of hot rolled Mg5Gd alloys. Trans. Nonferrous Met. Soc. China 2021, 31, 939–951. [Google Scholar] [CrossRef]
- Niu, L.; Chang, S.-H.; Su, Y.; Han, D.; Li, G. A aluminum coating with chromium-free passivating film formed on AZ91D magnesium alloy. J. Alloys Compd. 2015, 635, 11–15. [Google Scholar] [CrossRef]
- Feliu, S., Jr.; Bartolomé, M.J.; González, J.A.; López, V.; Feliu, S. Passivating oxide film and growing characteristics of anodic coatings on aluminium alloys. Appl. Surf. Sci. 2008, 254, 2755–2762. [Google Scholar] [CrossRef] [Green Version]
- Jafarzadeh, S.; Chen, Z.; Zhao, J.; Bobaru, F. Pitting, lacy covers, and pit merger in stainless steel: 3D peridynamic models. Corros. Sci. 2019, 150, 17–31. [Google Scholar] [CrossRef]
- Zhu, H.Q.; Liu, F.K.; Long, K.L. Corrosion behavior of 1Cr18Ni9Ti-1Cr11Ni2W2MoV galvanic couples in a simulated marine environment. AIP Adv. 2022, 12, 7. [Google Scholar] [CrossRef]
- Baoxu, Y.; Haixiang, C.; Dejun, K. Effects of laser remelting on salt spray corrosion behaviors of arc-sprayed Al coatings in 3.5% NaCl sea environment. Trans. Indian Inst. Met. 2018, 71, 617–625. [Google Scholar] [CrossRef]
- Schuerz, S.; Fleischanderl, M.; Luckeneder, G.H.; Preis, K.; Haunschmied, T.; Mori, G.; Kneissl, A.C. Corrosion behaviour of Zn–Al–Mg coated steel sheet in sodium chloride-containing environment. Corros. Sci. 2009, 51, 2355–2363. [Google Scholar] [CrossRef]
- Rechner, R.; Jansen, I.; Beyer, E. Influence on the strength and aging resistance of aluminium joints by laser pre-treatment and surface modification. Int. J. Adhes. Adhes. 2010, 30, 595–601. [Google Scholar] [CrossRef]
- Hashemi, B.; Yazdi, M.R.; Azar, V. The wear and corrosion resistance of shot peened–nitrided 316L austenitic stainless steel. Mater. Des. 2011, 32, 3287–3292. [Google Scholar] [CrossRef]
- Costa, M.Y.P.; Voorwald, H.J.C.; Pigatin, W.L.; Guimarães, V.A.; Cioffi, M.O.H. Evaluation of shot peening on the fatigue strength of anodized Ti-6Al-4V alloy. Mater. Res.-Ibero-Am. J. Mater. 2006, 9, 107–109. [Google Scholar] [CrossRef] [Green Version]
- Nascimento, M.P.; Torres, M.A.S.; Souza, R.C.; Voorwald, H.J.C. Effect of a shot peening pre treatment on the fatigue behaviour of hard chromium on electroless nickel interlayer coated AISI 4340 aeronautical steel. Mater. Res.-Ibero-Am. J. Mater. 2002, 5, 95–100. [Google Scholar] [CrossRef]
- Pandey, V.; Singh, J.K.; Chattopadhyay, K.; Srinivas, N.C.S.; Singh, V. Influence of ultrasonic shot peening on corrosion behavior of 7075 aluminum alloy. J. Alloys Compd. 2017, 723, 826–840. [Google Scholar] [CrossRef]
- Wang, T.; Yu, J.; Dong, B. Surface nanocrystallization induced by shot peening and its effect on corrosion resistance of 1Cr18Ni9Ti stainless steel. Surf. Coat. Technol. 2006, 200, 4777–4781. [Google Scholar] [CrossRef]
- Fu, J. Microstructure and corrosion behavior of hot-rolled GCr15 bearing steel. Appl. Phys. A-Mater. Sci. Process. 2016, 122, 416. [Google Scholar] [CrossRef]
- Cao, F.; Shi, Z.; Song, G.-L.; Liu, M.; Dargusch, M.S.; Atrens, A. Influence of hot rolling on the corrosion behavior of several Mg–X alloys. Corros. Sci. 2015, 90, 176–191. [Google Scholar] [CrossRef]
- Liu, H.; Dong, H.; Tang, J.; Ding, H.; Shao, W.; Zhao, J.; Jiang, T. Numerical modeling and experimental verification of surface roughness of 12Cr2Ni4A alloy steel generated by shot peening. Surf. Coat. Technol. 2021, 422, 127538. [Google Scholar] [CrossRef]
- Chen, X.; Zhang, J.; Xia, D.; Huang, G.; Liu, K.; Jiang, B.; Tang, A.; Pan, F. Microstructure and mechanical properties of 1060/7050 laminated composite produced via cross accumulative extrusion bonding and subsequent aging. J. Alloys Compd. 2020, 826, 154094. [Google Scholar] [CrossRef]
- Xiao, J.; Zhao, Z.; Xie, X.; Liang, Z.; Liu, Z.; Liu, X.; Tang, R. Micromorphology, Microstructure, and Wear Behavior of AISI 1045 Steels Irregular Texture Fabricated by Ultrasonic Strengthening Grinding Process. Metals 2022, 12, 1027. [Google Scholar] [CrossRef]
- Rybalka, K.V.; Beketaeva, L.A.; Davydov, A.D. Estimation of corrosion current by the analysis of polarization curves: Electrochemical kinetics mode. Russ. J. Electrochem. 2014, 50, 108–113. [Google Scholar] [CrossRef]
- Kril, C.E.; Birringer, R. Estimating grain-size distributions in nanocrystalline materials from X-ray diffraction profile analysis. Philos. Mag. A 1998, 77, 621–640. [Google Scholar] [CrossRef]
- Gollapudi, S. Grain size distribution effects on the corrosion behaviour of materials. Corros. Sci. 2012, 62, 90–94. [Google Scholar] [CrossRef]
- Cheng, Q.L.; Tao, B.; Song, L.Y.; Zhang, W.H.; Liu, X.Y.; Li, W.H.; Hou, B.R.; Liu, Q.Z. Corrosion behaviour of Q23513 carbon steel in sediment water from crude oil. Corros. Sci. 2016, 111, 61–71. [Google Scholar] [CrossRef]
- Morcillo, M.; de la Fuente, D.; Diaz, I.; Cano, H. Atmospheric corrosion of mild steel. Rev. Metal. 2011, 47, 426–444. [Google Scholar] [CrossRef] [Green Version]
- Murkute, P.; Kumar, R.; Choudhary, S.; Maharana, H.; Ramkumar, J.; Mondal, K. Comparative atmospheric corrosion behavior of a mild steel and an interstitial free steel. J. Mater. Eng. Perform. 2018, 27, 4497–4506. [Google Scholar] [CrossRef]


| Chemical Element | C | Si | Mn | Cr | P | S | Ni | Cu |
|---|---|---|---|---|---|---|---|---|
| ≤ | ||||||||
| Content (wt%) | 0.95~1.05 | 0.15~0.35 | 0.20~0.40 | 1.30~1.60 | 0.027 | 0.02 | 0.30 | 0.25 |
| Parameters | Value |
|---|---|
| Vibration frequency (kHz) | 20 |
| Peening distance (mm) | 30 |
| Processing time (min) | 3 |
| Diameter of ceramic balls (mm) | 1 |
| Grain size of brown corundum (μm) | 15 |
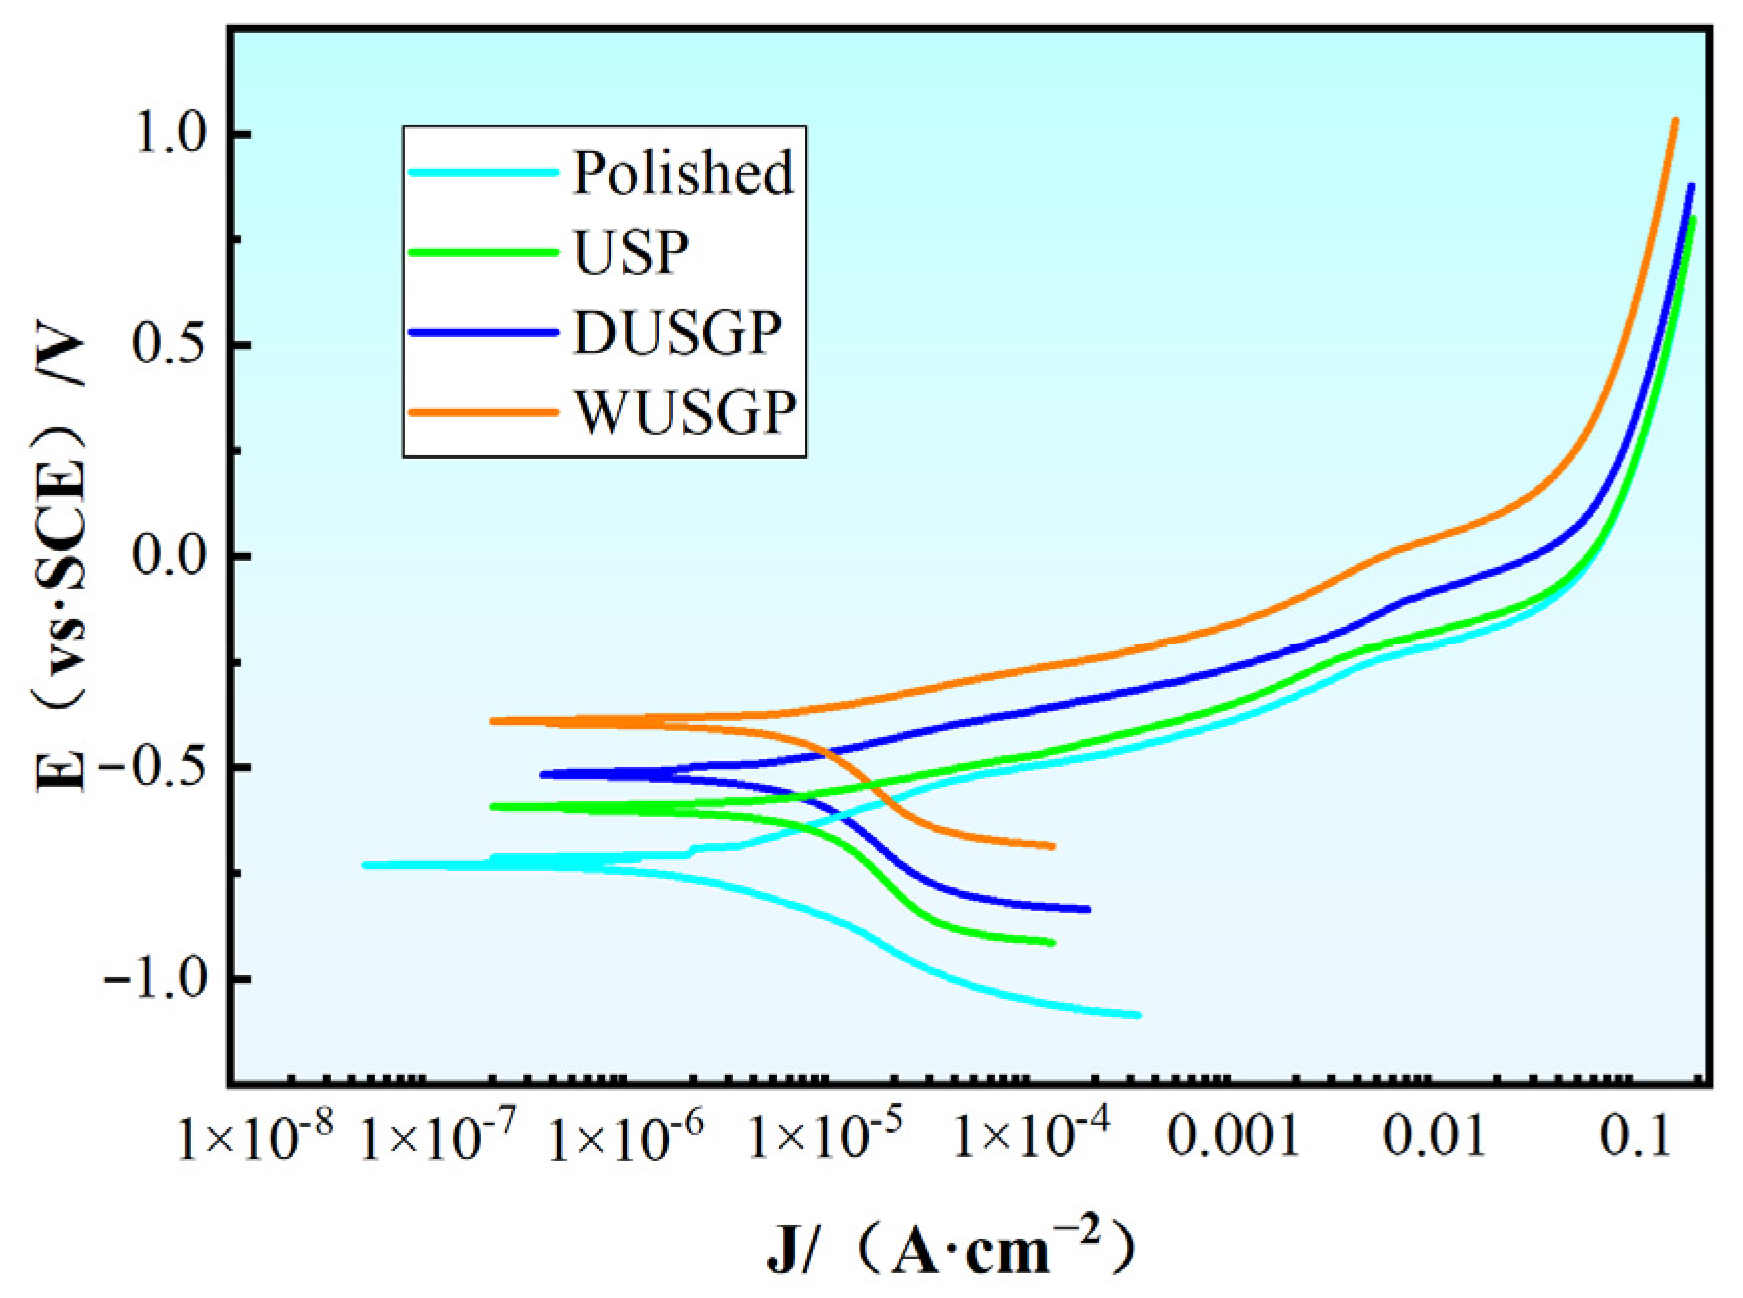
| Serial Number | Ecorr/V | Icorr/(mA·cm−2) |
|---|---|---|
| Polished | −0.7309 | 18.15 |
| USP | −0.5926 | 15.28 |
| DUSGP | −0.5122 | 12.79 |
| WUSGP | −0.3999 | 9.435 |
| Experimental Group | Element/wt% | |||||
|---|---|---|---|---|---|---|
| C | O | Fe | Cr | Cl | Ca | |
| Polished | 12.60 | 22.11 | 63.92 | 0.80 | 0.57 | - |
| USP | 13.93 | 25.23 | 58.40 | 0.92 | 1.52 | - |
| DUSGP | 12.71 | 32.62 | 51.37 | 0.58 | 1.78 | 0.94 |
| WUSGP | 12.87 | 32.50 | 48.25 | 1.03 | 4.57 | 0.78 |
Publisher’s Note: MDPI stays neutral with regard to jurisdictional claims in published maps and institutional affiliations. |
© 2022 by the authors. Licensee MDPI, Basel, Switzerland. This article is an open access article distributed under the terms and conditions of the Creative Commons Attribution (CC BY) license (https://creativecommons.org/licenses/by/4.0/).
Share and Cite
Xie, X.; Guo, Z.; Zhao, Z.; Liang, Z.; Wu, J.; Liu, X.; Xiao, J. Salt-Fog Corrosion Behavior of GCr15 Steels Treated by Ultrasonic Strengthening Grinding Process. Appl. Sci. 2022, 12, 7360. https://doi.org/10.3390/app12157360
Xie X, Guo Z, Zhao Z, Liang Z, Wu J, Liu X, Xiao J. Salt-Fog Corrosion Behavior of GCr15 Steels Treated by Ultrasonic Strengthening Grinding Process. Applied Sciences. 2022; 12(15):7360. https://doi.org/10.3390/app12157360
Chicago/Turabian StyleXie, Xincheng, Zhongning Guo, Zhuan Zhao, Zhongwei Liang, Jun Wu, Xiaochu Liu, and Jinrui Xiao. 2022. "Salt-Fog Corrosion Behavior of GCr15 Steels Treated by Ultrasonic Strengthening Grinding Process" Applied Sciences 12, no. 15: 7360. https://doi.org/10.3390/app12157360
APA StyleXie, X., Guo, Z., Zhao, Z., Liang, Z., Wu, J., Liu, X., & Xiao, J. (2022). Salt-Fog Corrosion Behavior of GCr15 Steels Treated by Ultrasonic Strengthening Grinding Process. Applied Sciences, 12(15), 7360. https://doi.org/10.3390/app12157360