Article

ECC: Passenger Counting in the Elevator Using Commodity WiFi

School of Computer Science and Technology, Xi’an Jiaotong University, Xi’an 710049, China
*
Author to whom correspondence should be addressed.
Appl. Sci. 2022, 12(14), 7321; https://doi.org/10.3390/app12147321
Submission received: 16 June 2022 / Revised: 9 July 2022 / Accepted: 19 July 2022 / Published: 21 July 2022
(This article belongs to the Special Issue SMART Development of Household Wireless Sensors)

Abstract

:
Elevators have become a kind of indispensable facility for everyday life, which bring people both convenience and safety hazards. Specifically in the household environment, an elevator’s lifespan is expected to be more than 20 years. An appropriate and regularly maintained counterweight is conducive to extending elevator life. This paper proposes a passenger counting approach in the elevator for regular counterweight adjustment based on commodity WiFi called ECC. Since the running time of the elevator between two adjacent floors is short, the major challenge of ECC is how to count passengers from the limited captured data. This paper first theoretically analyzes the relationship between the number of passengers and the variation of channel state information (CSI). Then ECC constructs a multi-dimensional feature by extracting the average of amplitude (AOA), time-varying spectrum (TVS), and percentage of non-zero elements (PEM) features from the limited data. Finally, the random forest (RF) classifier is used for passenger counting and the local optimization problem is solved by expanding the feature dataset through data segmentation. ECC is implemented by using off-the-shelf IEEE 802.11n devices, and its performance is evaluated via extensive experiments in typical real-world scenes. The estimated precision of ECC can reach more than 95%, and more than 97% of estimation errors are less than 2 persons, which demonstrates the superior effectiveness and generalizability of ECC.

1. Introduction

With the development of cities, the number of elevators has surged, and elevators have become an indispensable smart device for the household, which not only brings great convenience to people’s lives but also provides more space for city construction. However, the emergence of elevators also introduces new safety problems. For instance, the unbalance of the elevator’s counterweight is one of the vital factors affecting elevator safety [1]. Traditional elevators only care about whether the overall load is overweight, not the mass of the actual load. Therefore, they employ a rated counterweight based on their maximum load capacity instead of the elevator’s actual load. The principle of elevator operation is achieved by the movement of a directional pulley. One side of the pulley is connected to the elevator, and the other side is connected to the counterweight. When the elevator is running, it produces friction between the rope and the pulley to control the movement of the elevator. If there are few or many passengers in the elevator, the overall weight of the passengers will be seriously imbalanced to the counterweight. The imbalanced weight on both sides of the rope requires the drive motor to output more power to ensure the elevator keeps running at an even speed. Continuous operation increases the wear of the rope and multiple components, which may cause accidents and increase energy overhead. Hence, regular maintenance of the elevator is very important [2,3].
According to the statistics, more than 10% of accidents are caused by components or protection devices malfunctioning due to the elevator counterweight problem. Therefore, many studies [4] have improved the counterweight system of the elevator to reduce the safety risk. For instance, Tzou and Schiff [5] propose a passive vibration control device that can effectively reduce the risk due to the imbalanced counterweight by constraining the motions of two rails through intermediate ties to reduce the contact load. However, it requires improving the elevator hardware, which is difficult to implement in actuality. If the number of passengers in the elevator can be accurately estimated, the rule of the passenger flow at different periods can be grasped, and then the actual load range of the elevator can be inferred. In this way, the counterweight can be regularly maintained and adjusted based on the actual utilization rate of the elevator, thereby enhancing the elevator’s safety and saving energy overhead. In addition, excessive passengers may cause the elevator to be overcrowded and introduce other safety issues for the passengers.
Traditional sensors-based crowd counting approaches, such as the infrared sensor, camera, mobile devices, etc., either require the deployment of extra infrastructure or the cooperation of occupants to carry dedicated devices, which are intrusive and inconvenient for pervasive implementation. With the development of WiFi, signals have covered whole buildings, so the passive sensing approaches based on WiFi sensors have received more attention. These approaches can effectively overcome the drawbacks of the above methods and solve the privacy issue. Moreover, WiFi can solve the problem of weak mobile phone signals in elevators and enable people to keep in touch with the outside world in emergencies. In summary, the current sensors-based crowd counting approaches can be classified into vision-based and non-vision-based approaches.
Vision-based approaches [6,7,8,9,10] mostly use image recognition for crowd counting. However, since the European Union implemented the general data protection regulation (GDPR) [11] on 25 May 2018, which aims to protect users’ privacy and data security, the monitoring data captured by cameras in public venues cannot be made public arbitrarily. In this context, most product and system developments prioritize privacy and establish a sensing and detection platform for people and biological monitors that do not rely on captured video or identification data. Therefore, non-vision-based approaches have received extensive attention in recent years.
Non-vision-based approaches mainly include: device-based and device-free approaches. The device-based approaches (e.g., mobile phones [12,13], RFID tags [14,15], Bluetooth [16,17], etc.) rely on people to carry at least one specific device. They are more suitable for object localization than crowd counting. In many practical scenarios, it is impossible to ask people to take the same devices with them. Device-free approaches (e.g., infrared sensors [18], UWB radar sensors [19,20], PIR sensors [21]) do not require people to carry any devices but only rely on the interaction with the wireless signals or induction in a certain area. However, these approaches require deploying specific sensors in the interest region that cannot be blocked. General WiFi sensors-based [22,23,24,25] methods can overcome the above drawbacks, but they need people to keep moving. Therefore, they cannot detect static crowds, for instance, passengers in the elevator.
Hence, the traditional approaches can not be used in the elevator environment. If the passenger number can be counted by using commercial WiFi in the elevator; it can not only solve the occlusion problem of the people but also does not require the addition of additional devices. This paper proposes a passenger counting approach in the elevator based on channel state information (CSI) measurements using commodity WiFi. The rationale behind ECC is that the passenger number can be accurately inferred from the variation of the CSI. The contributions of this work are summarized as follows.
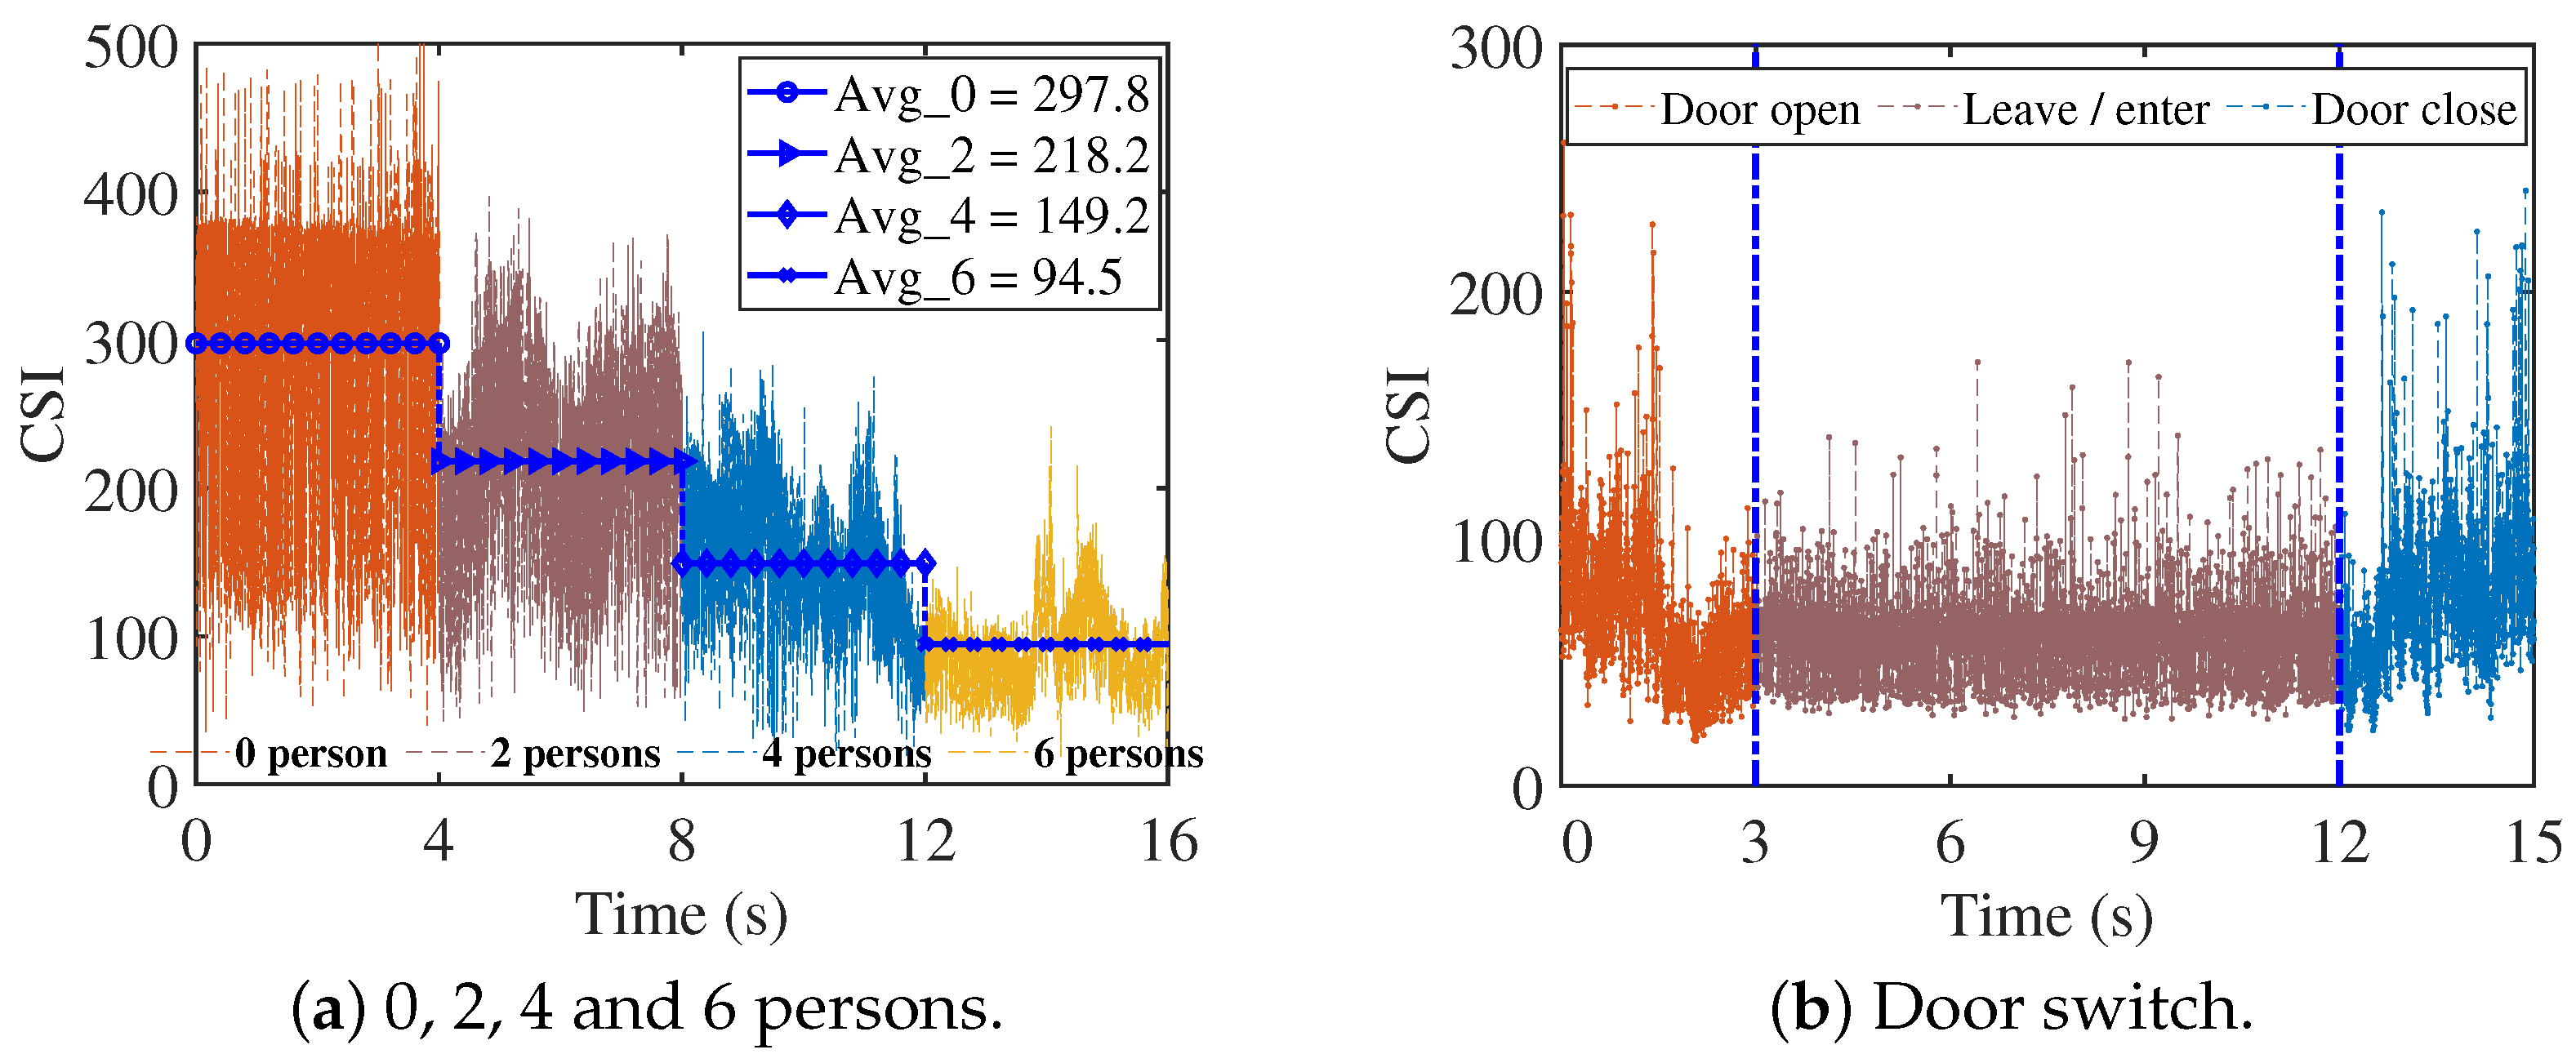
  • First, this paper theoretically analyzes and verifies the monotonic relationship between the variation of CSI and the passenger number. The analysis results suggest that the variation of CSI is sensitive to crowd influences, which can be used for passenger counting.
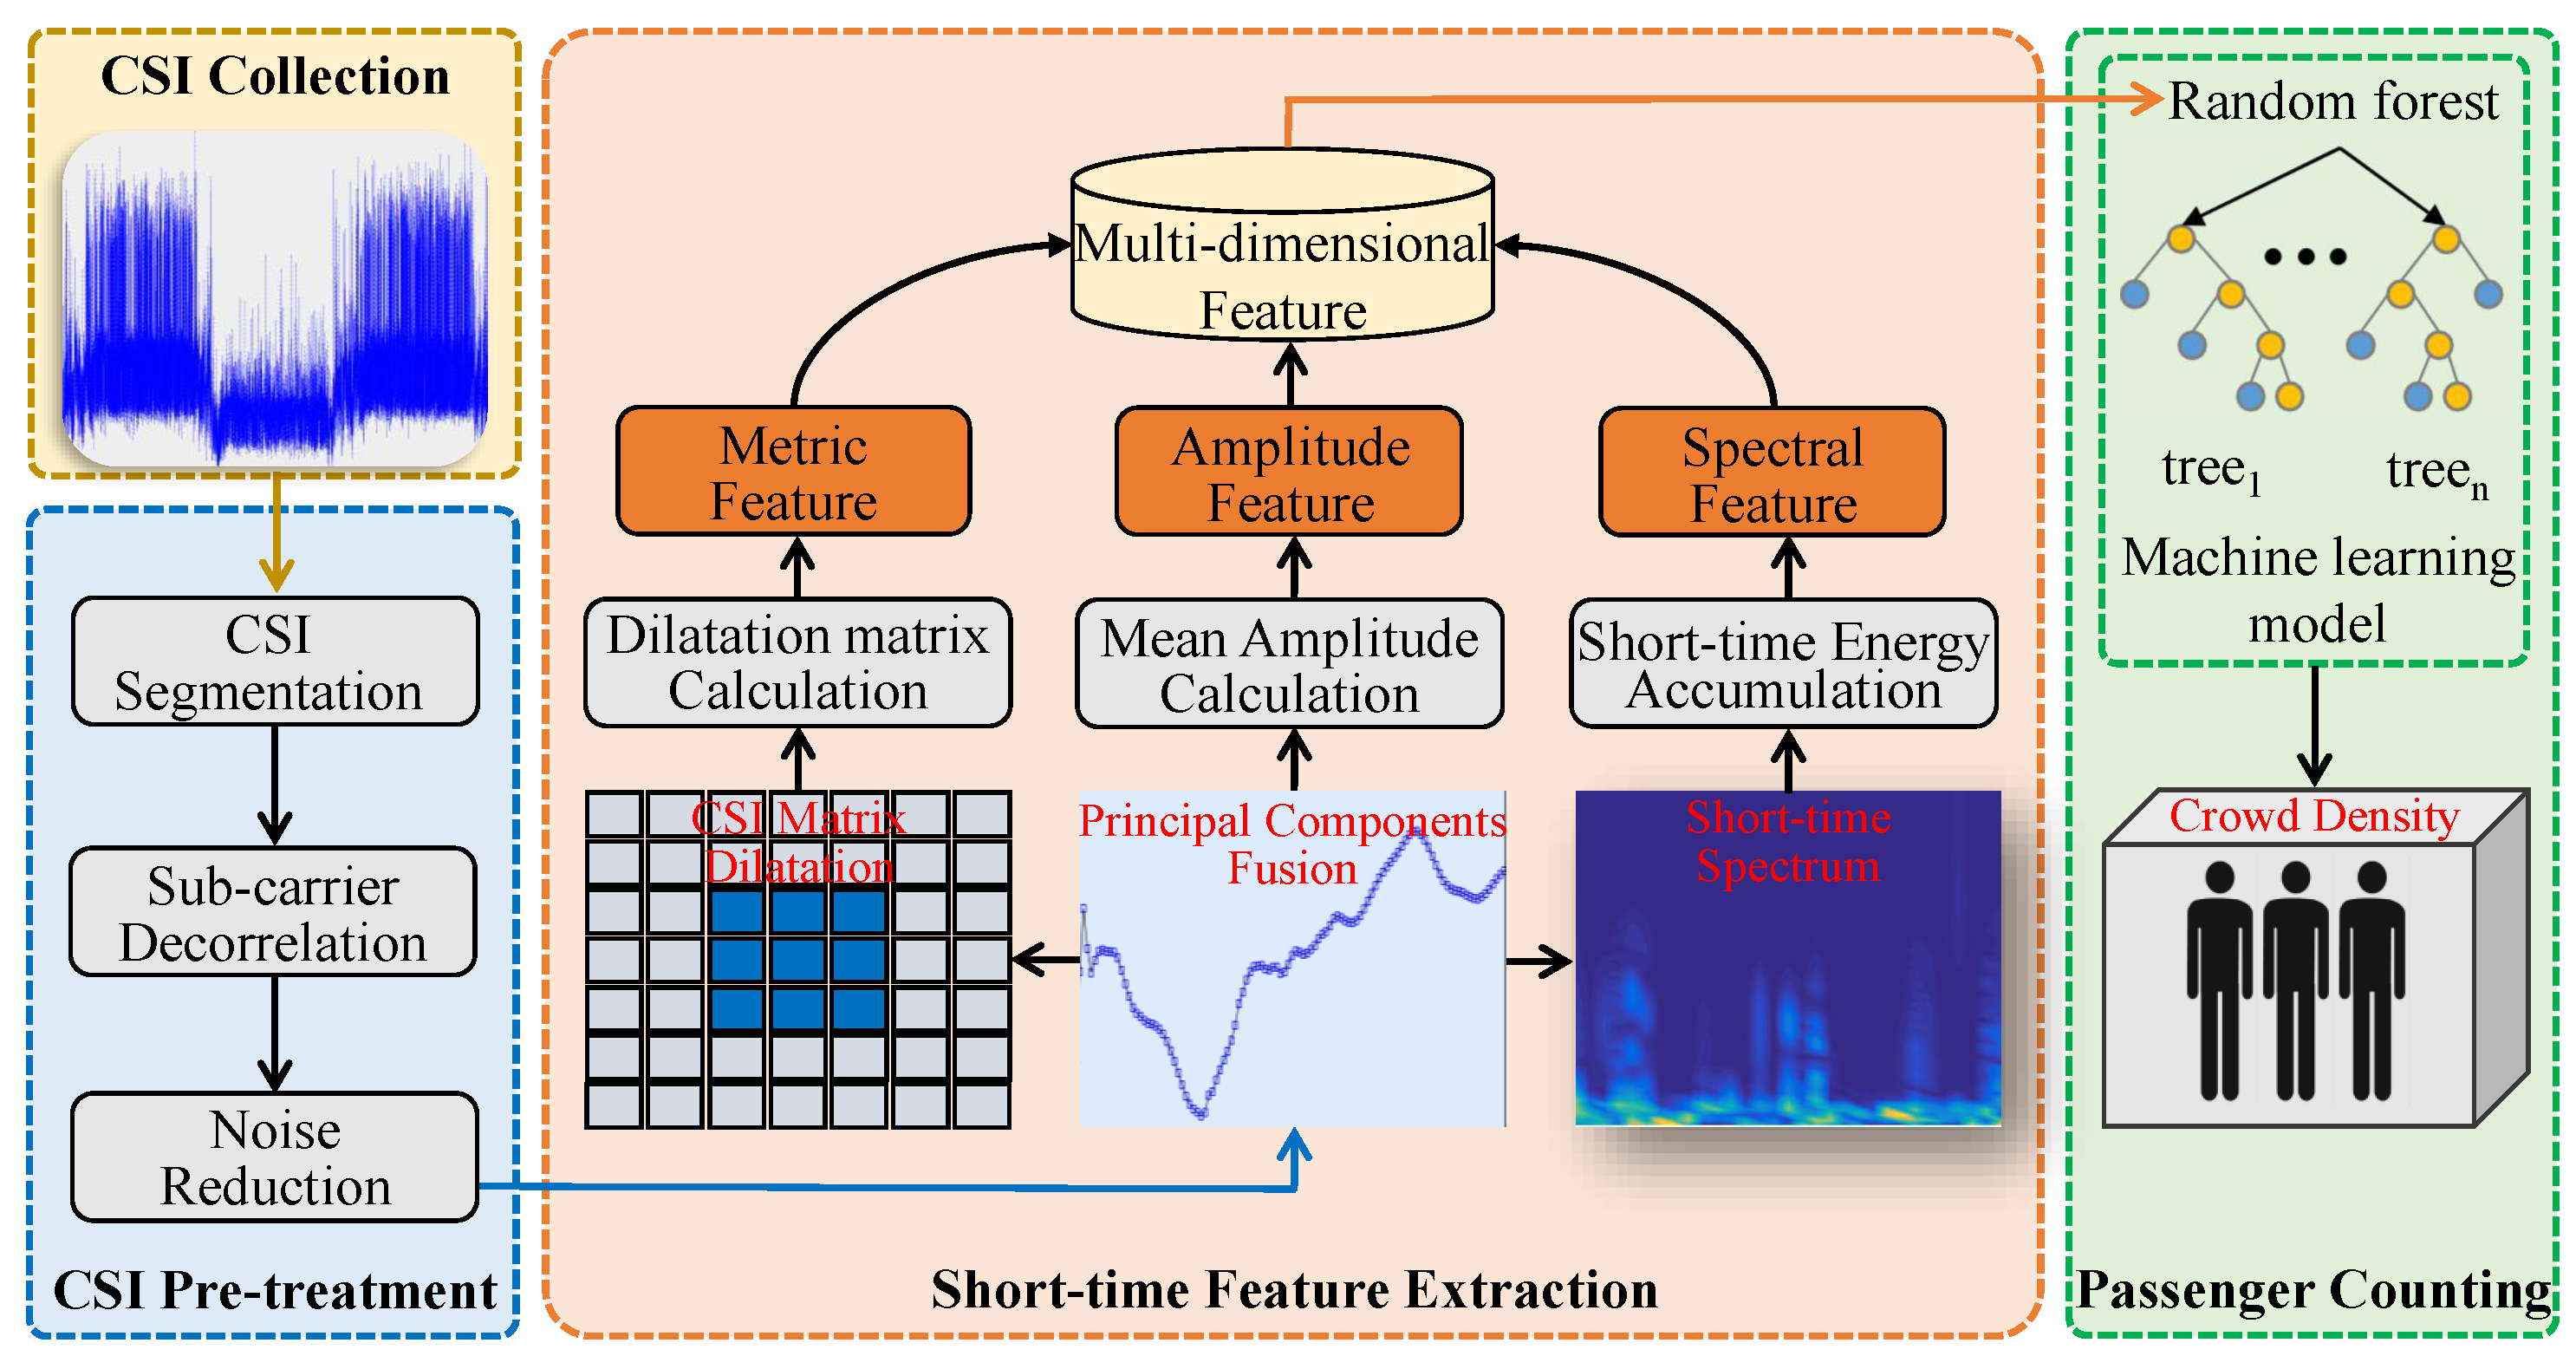
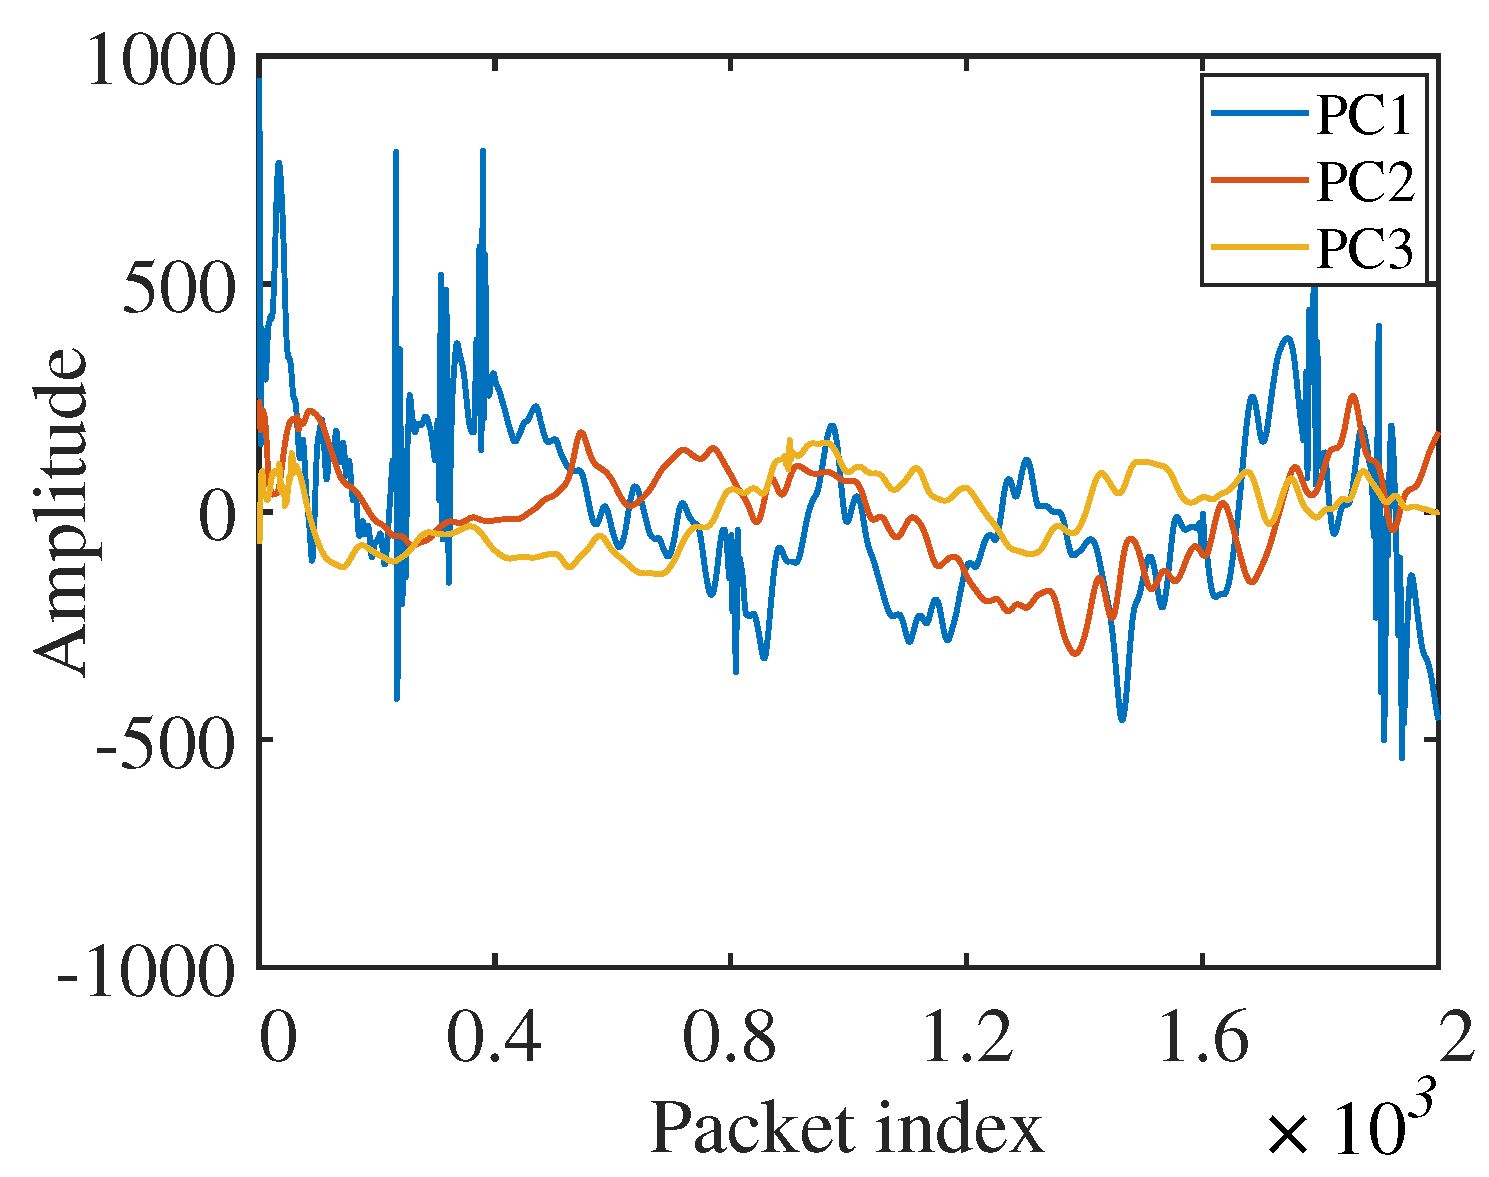
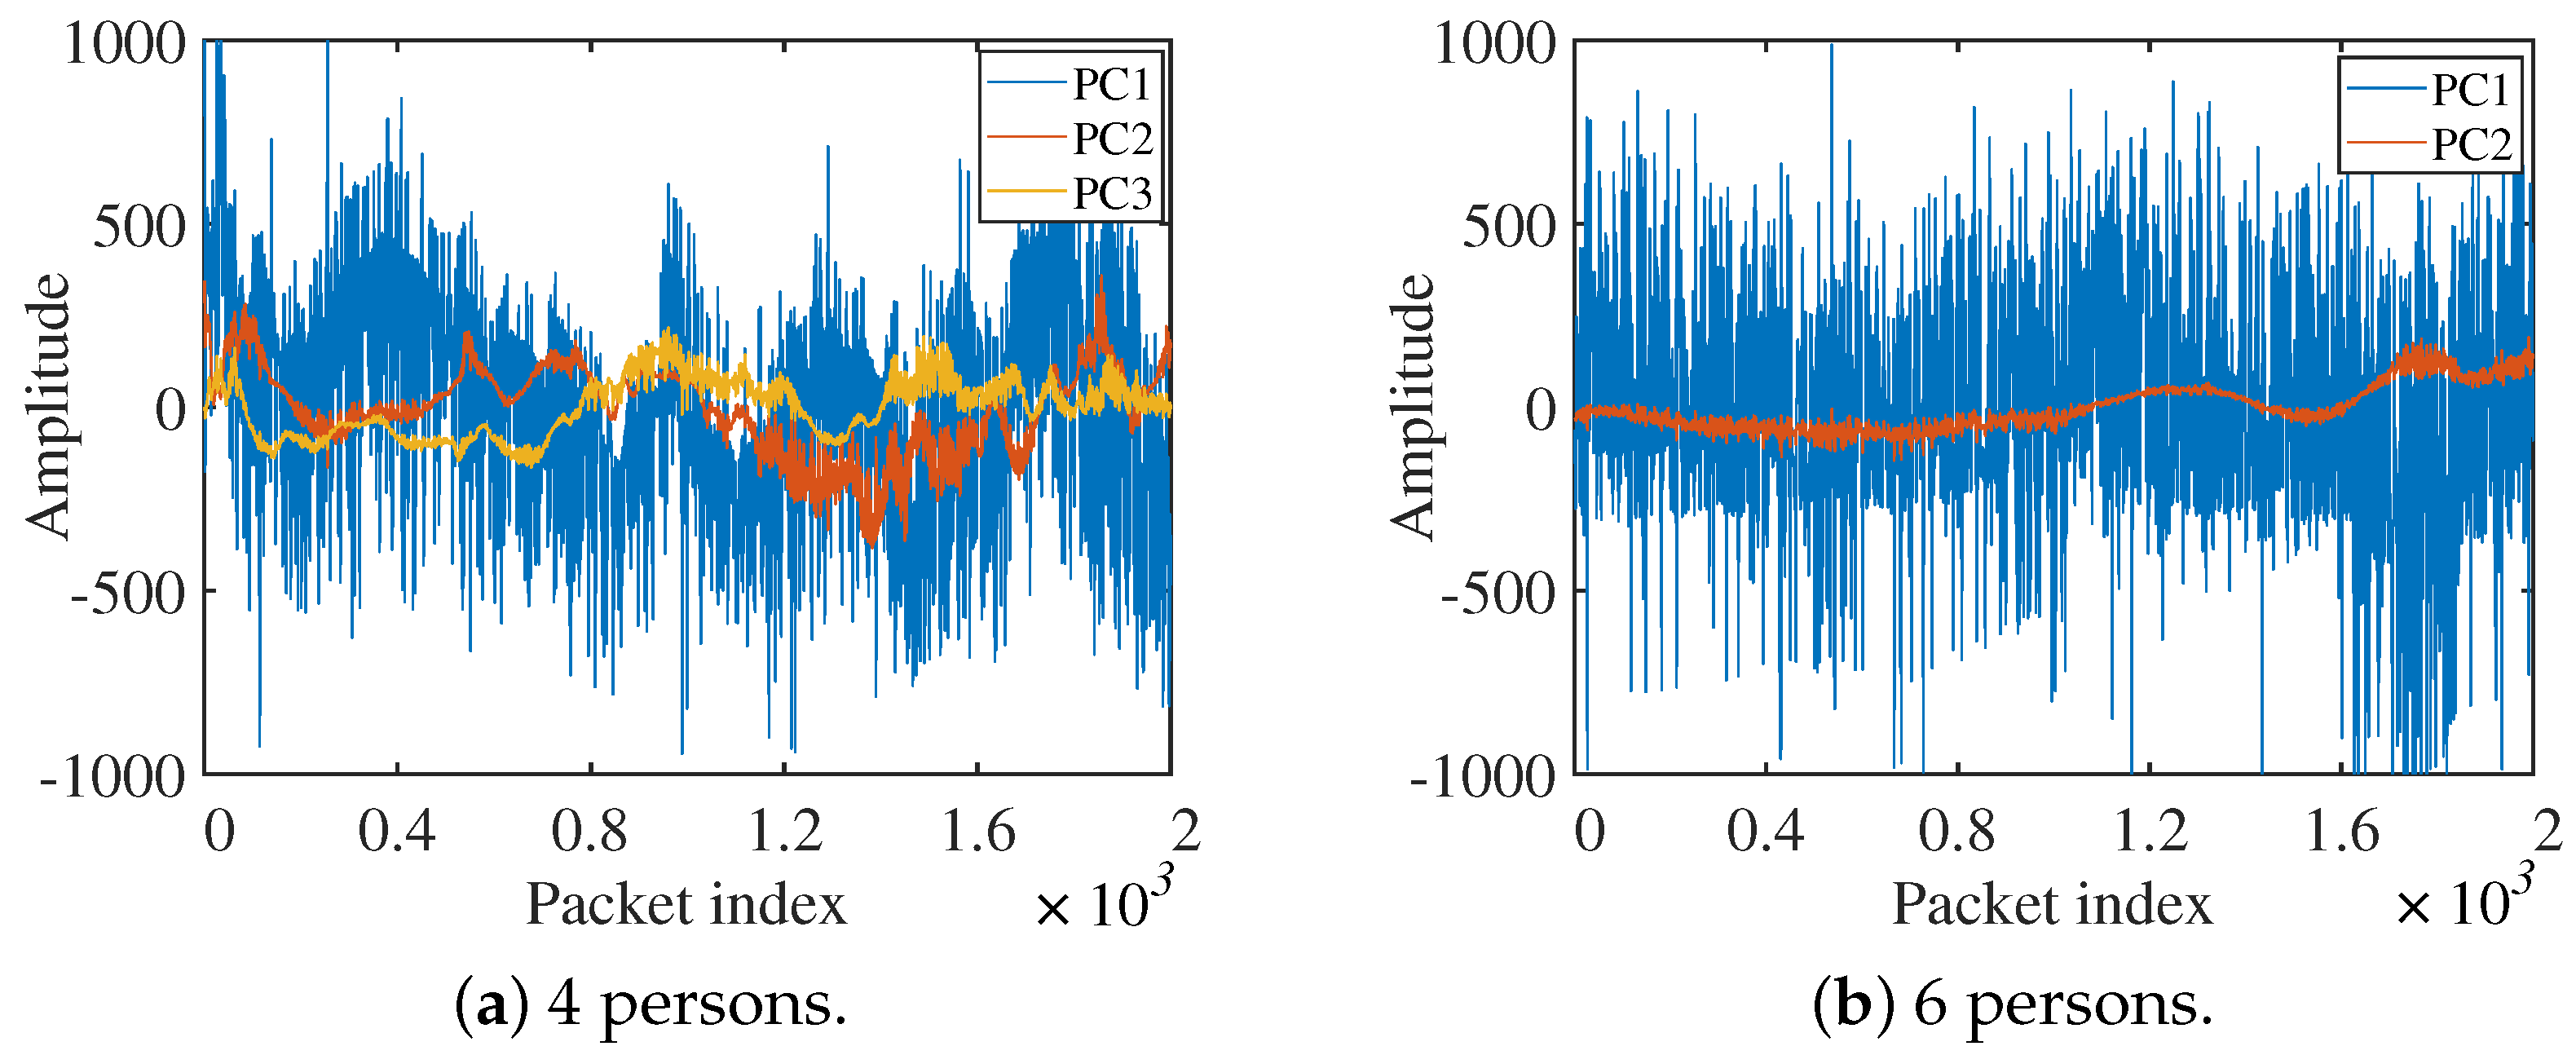
  • Secondly, this paper implements the signal pre-treatment process by CSI segmentation, sub-carrier decorrelation, and noise reduction. In particular, this paper proposes a short-time local detection principal component analysis (SLD-PCA) algorithm to decorrelate the CSI streams quickly. SLD-PCA can effectively extract the principal components from all the CSI sub-carriers while maintaining the CSI’s local structure.
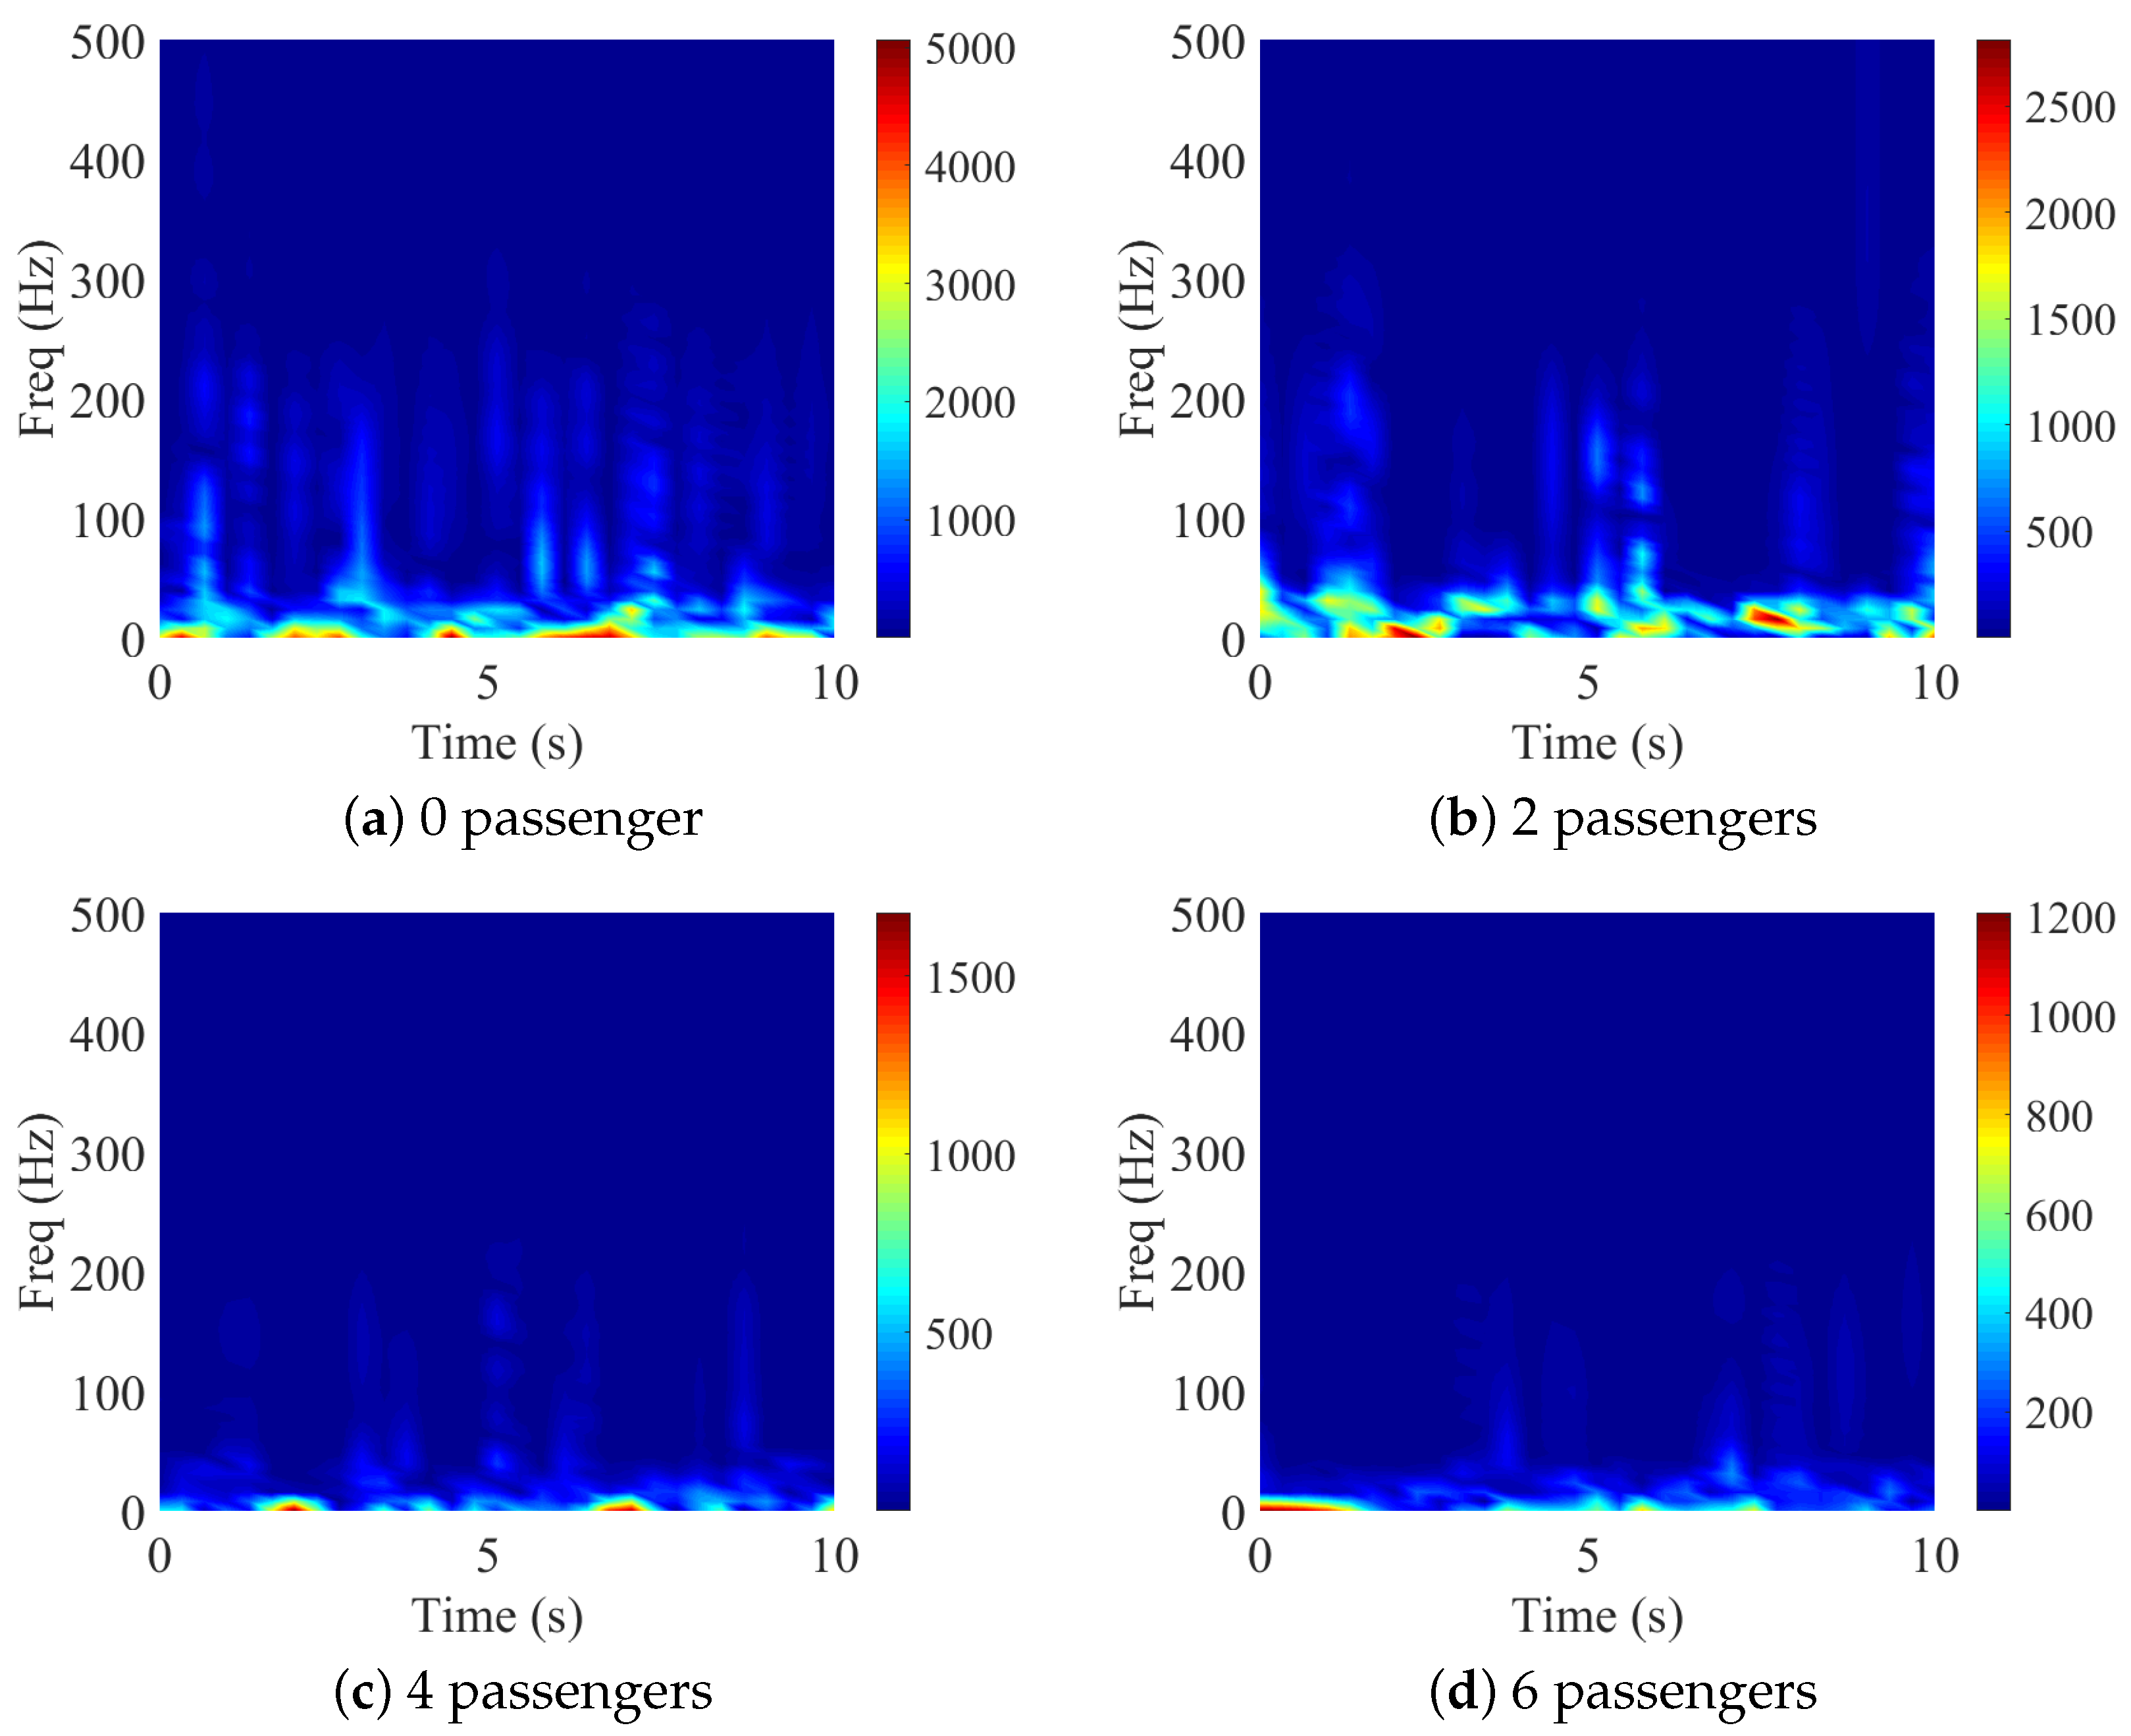
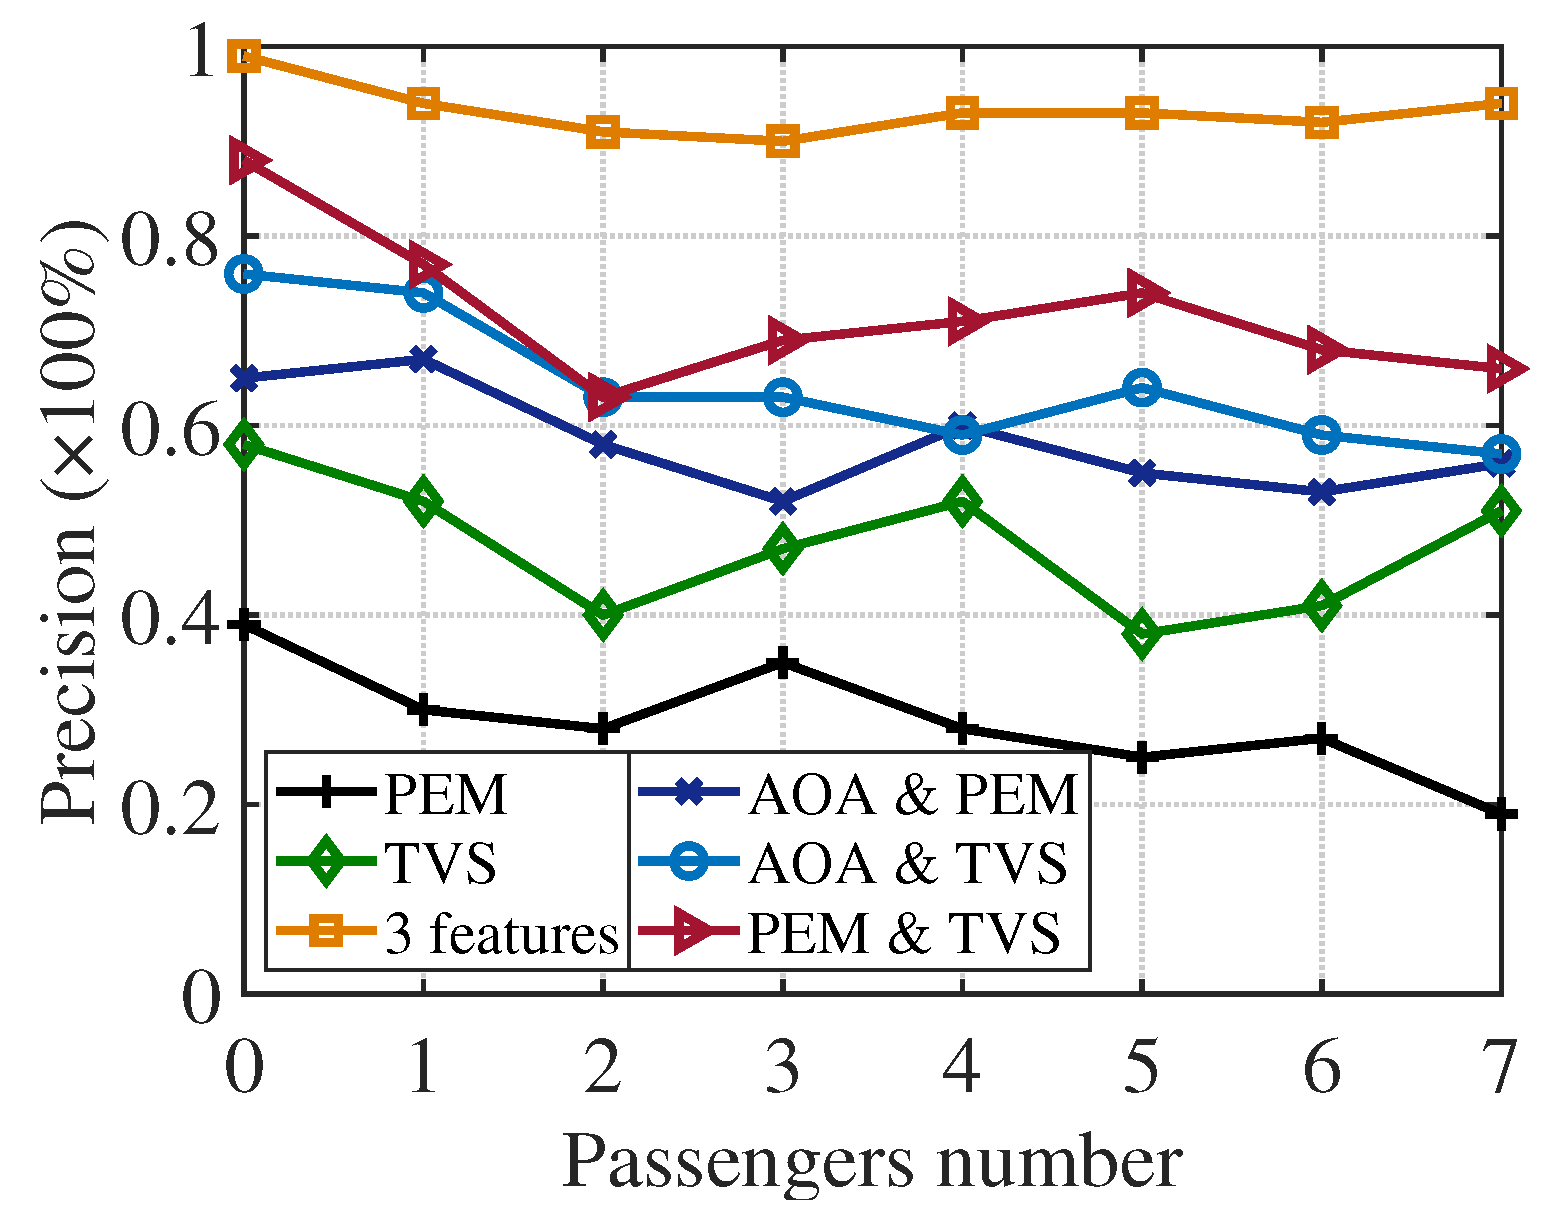
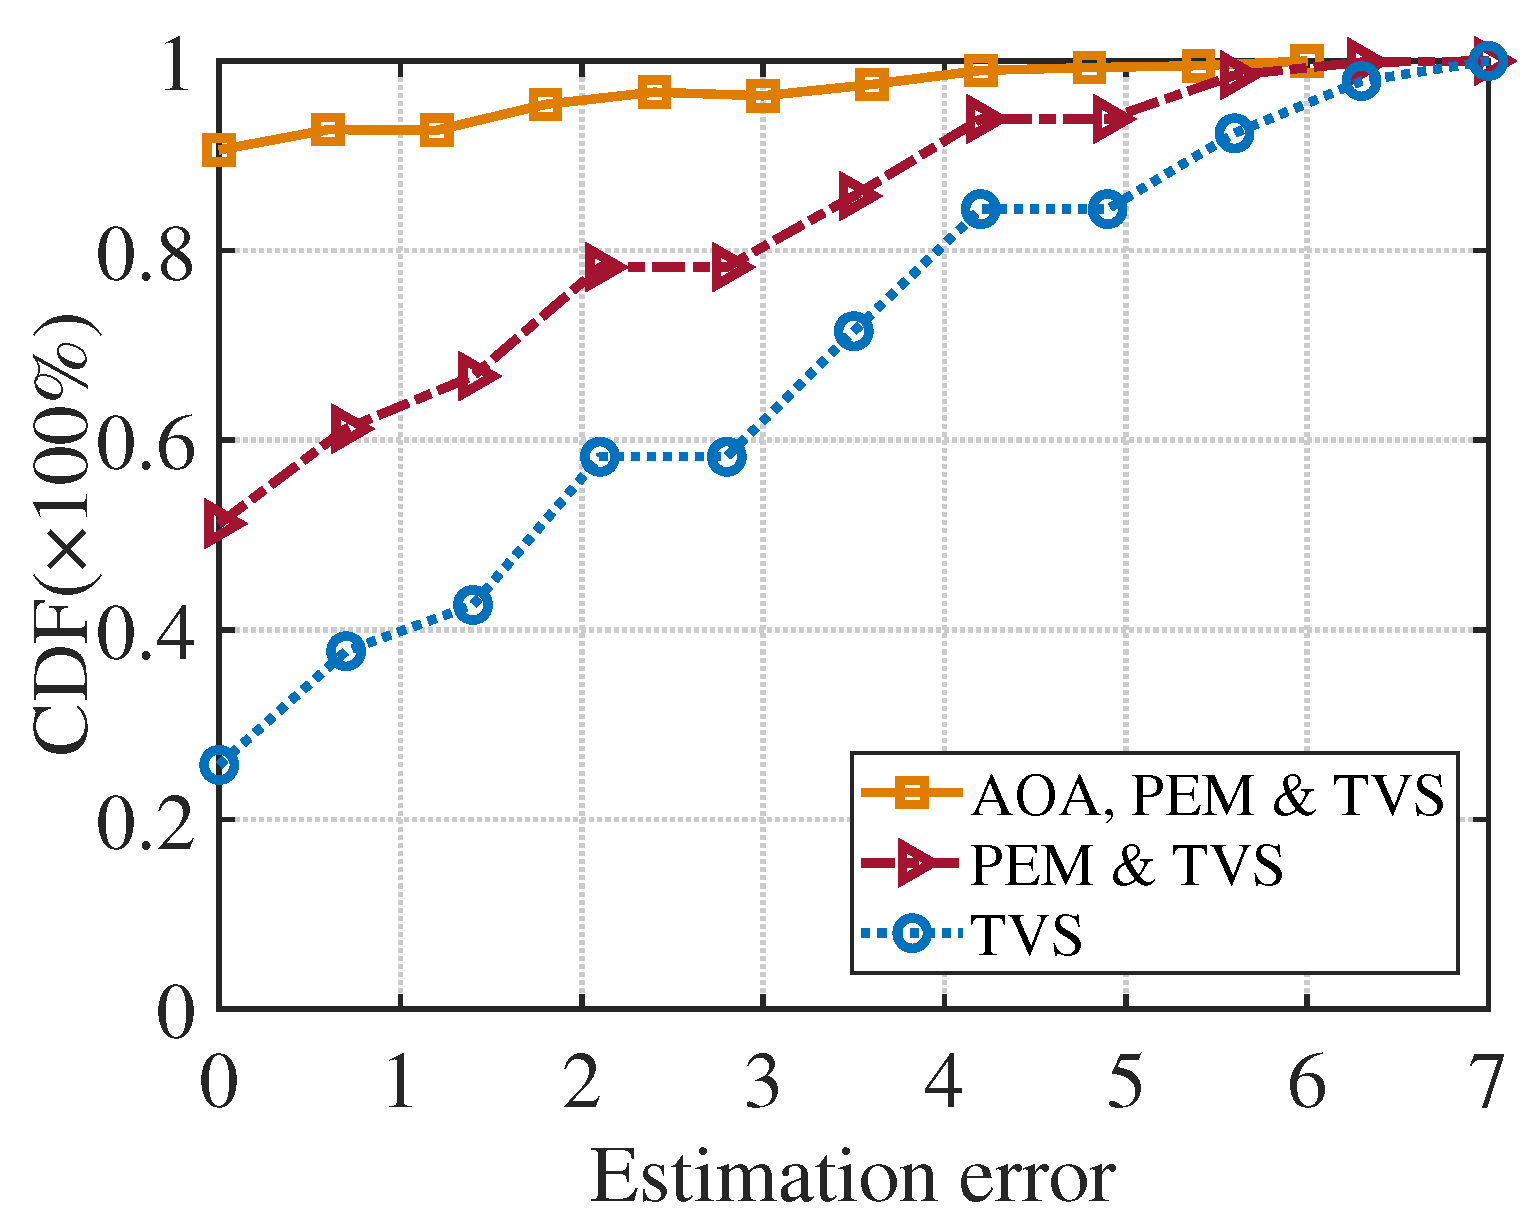
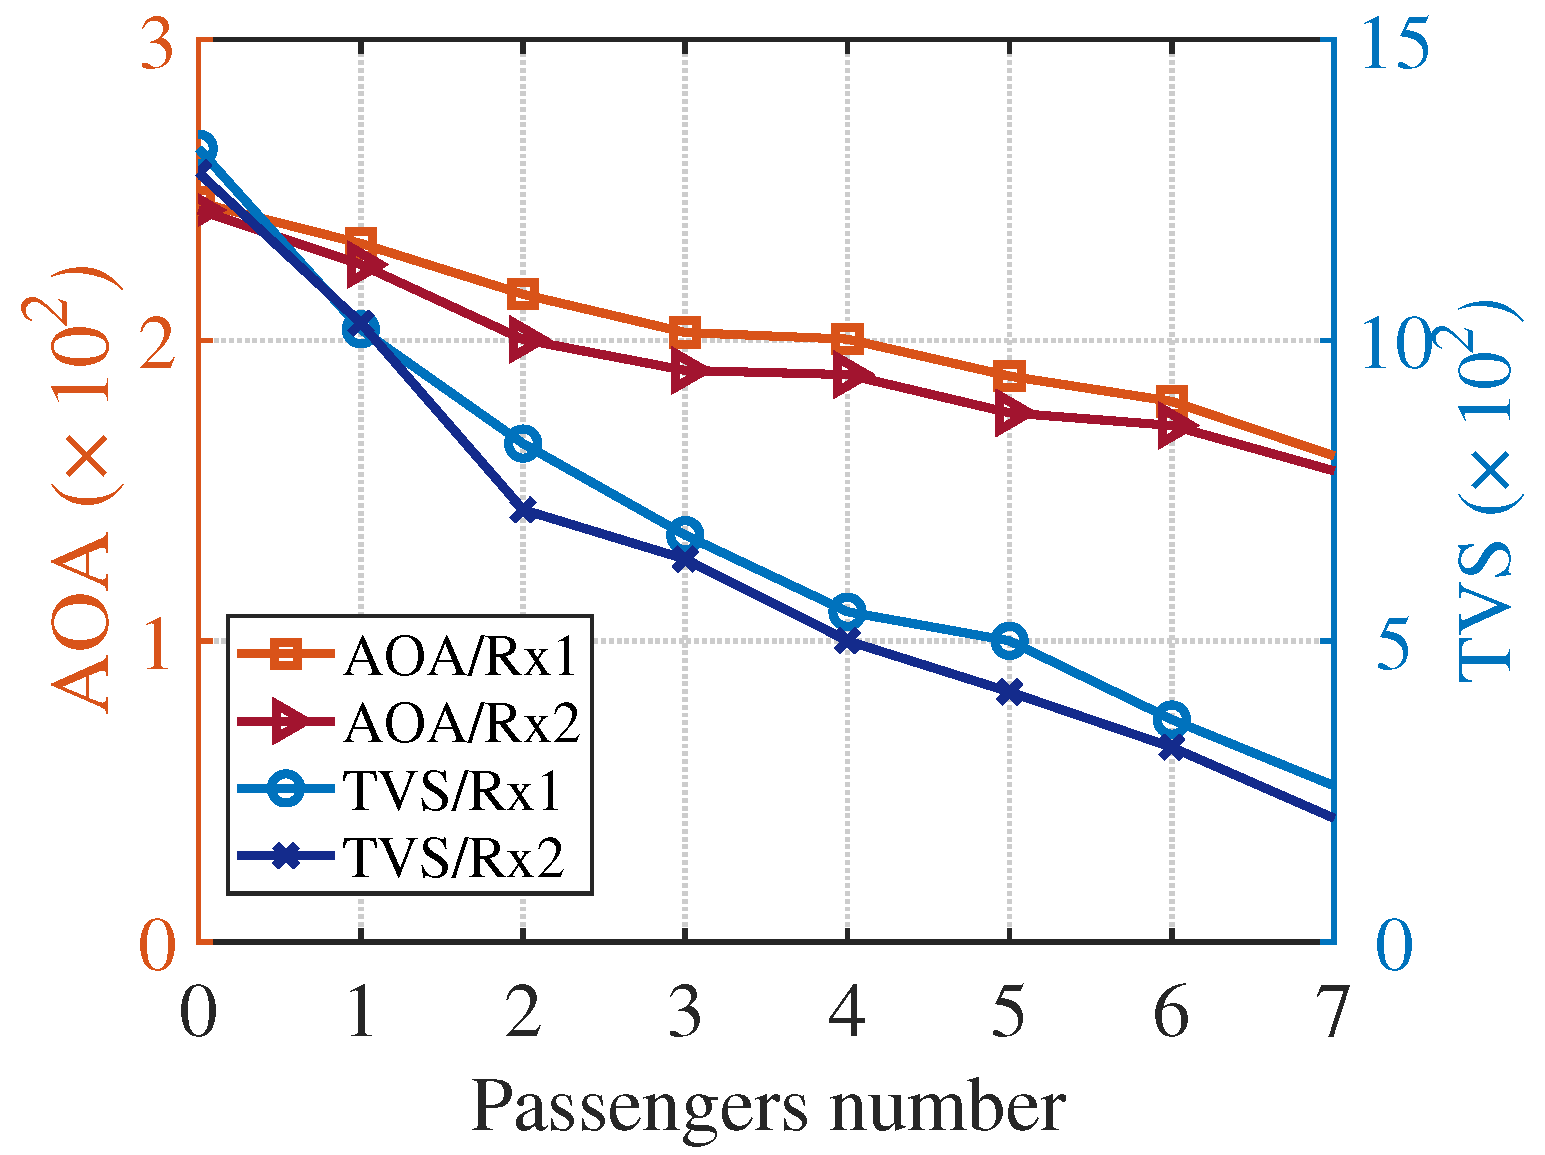
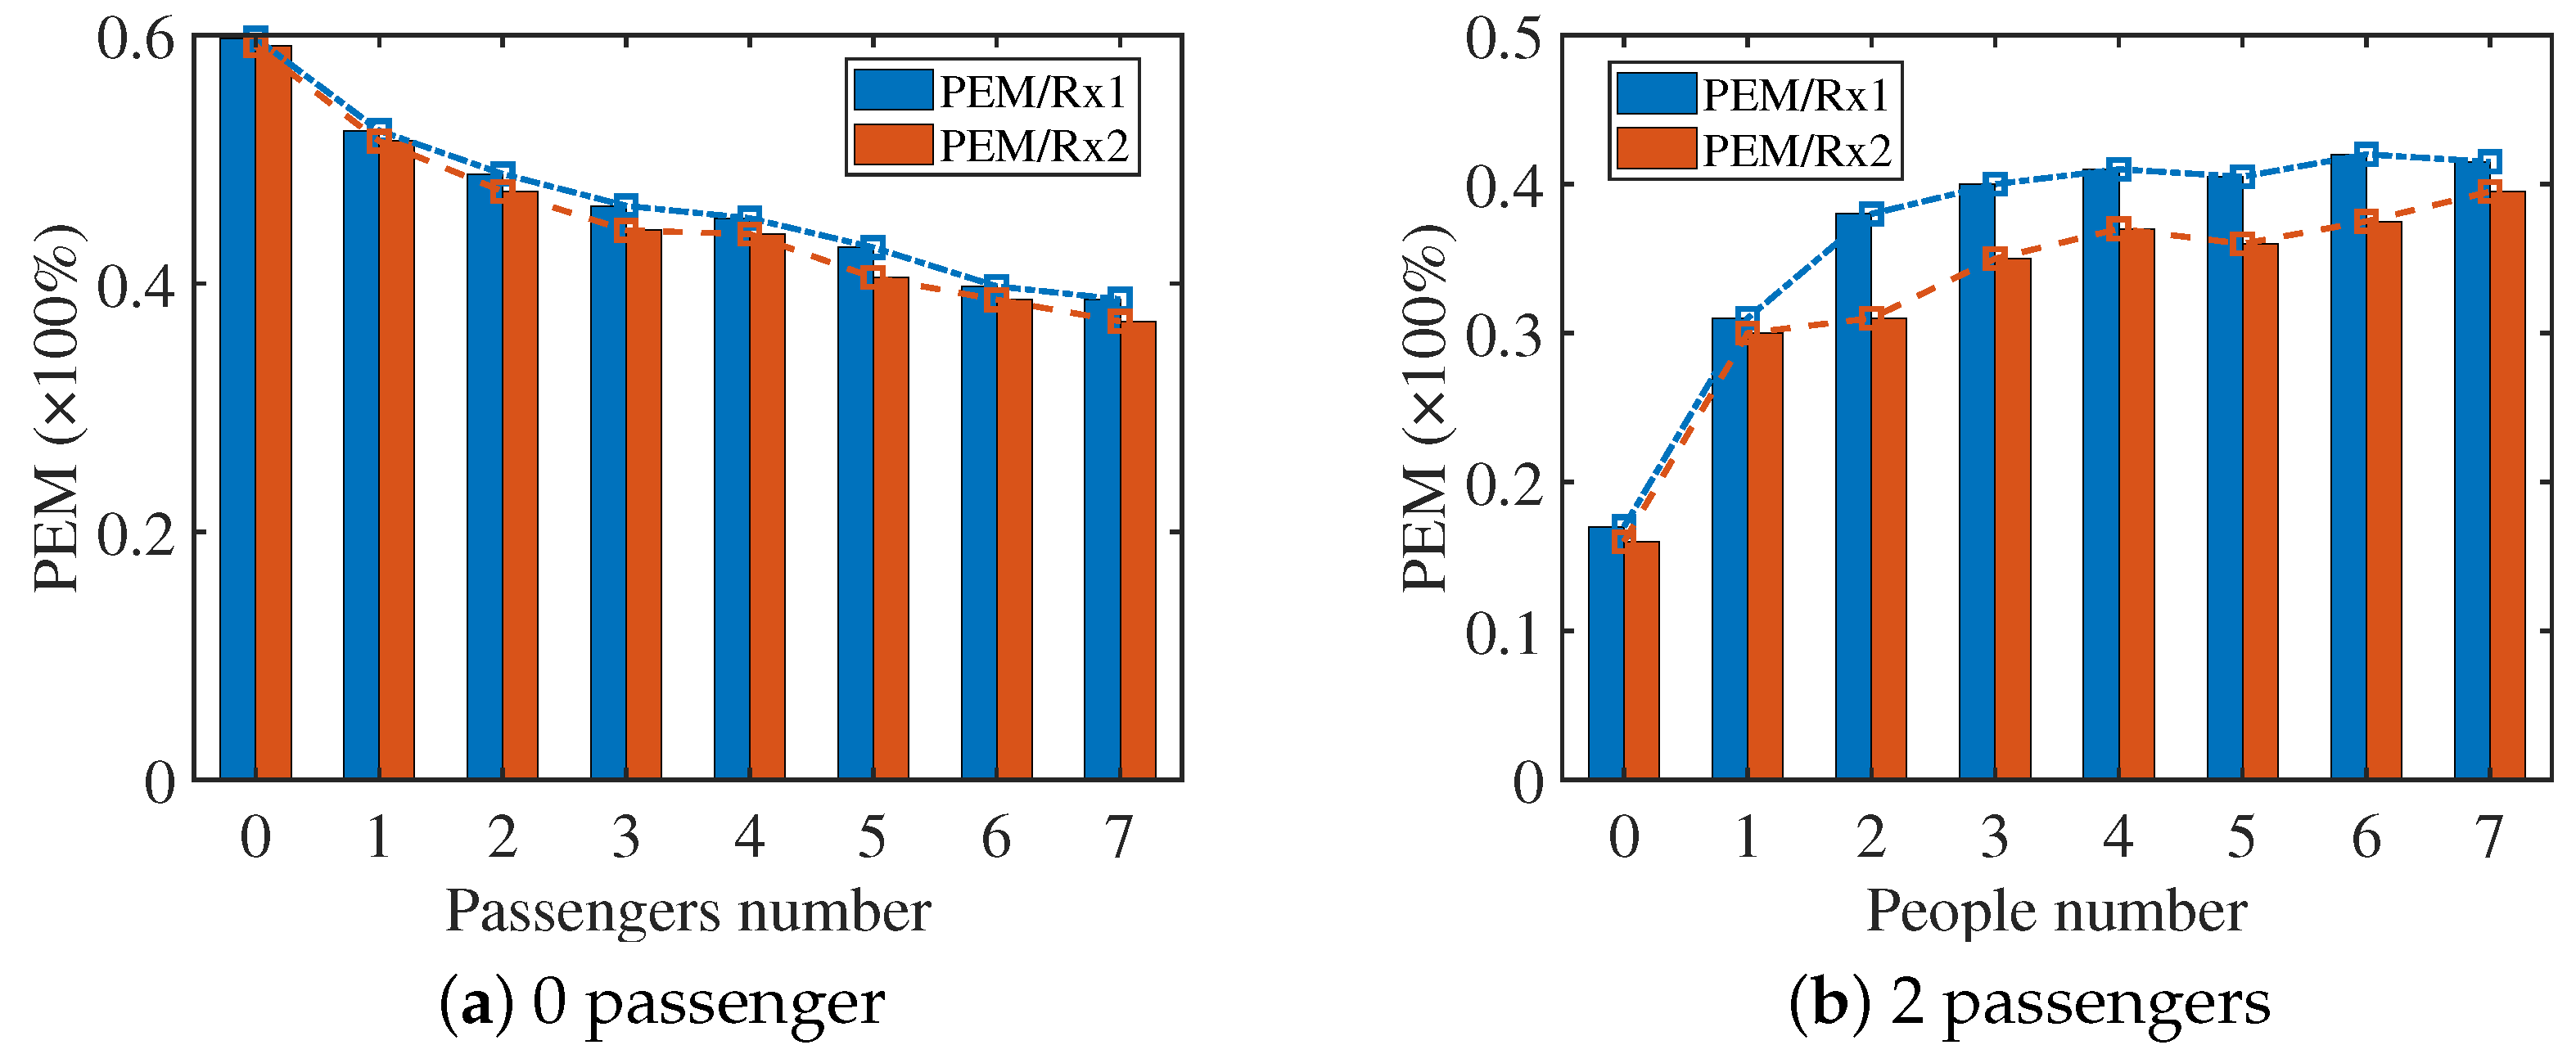
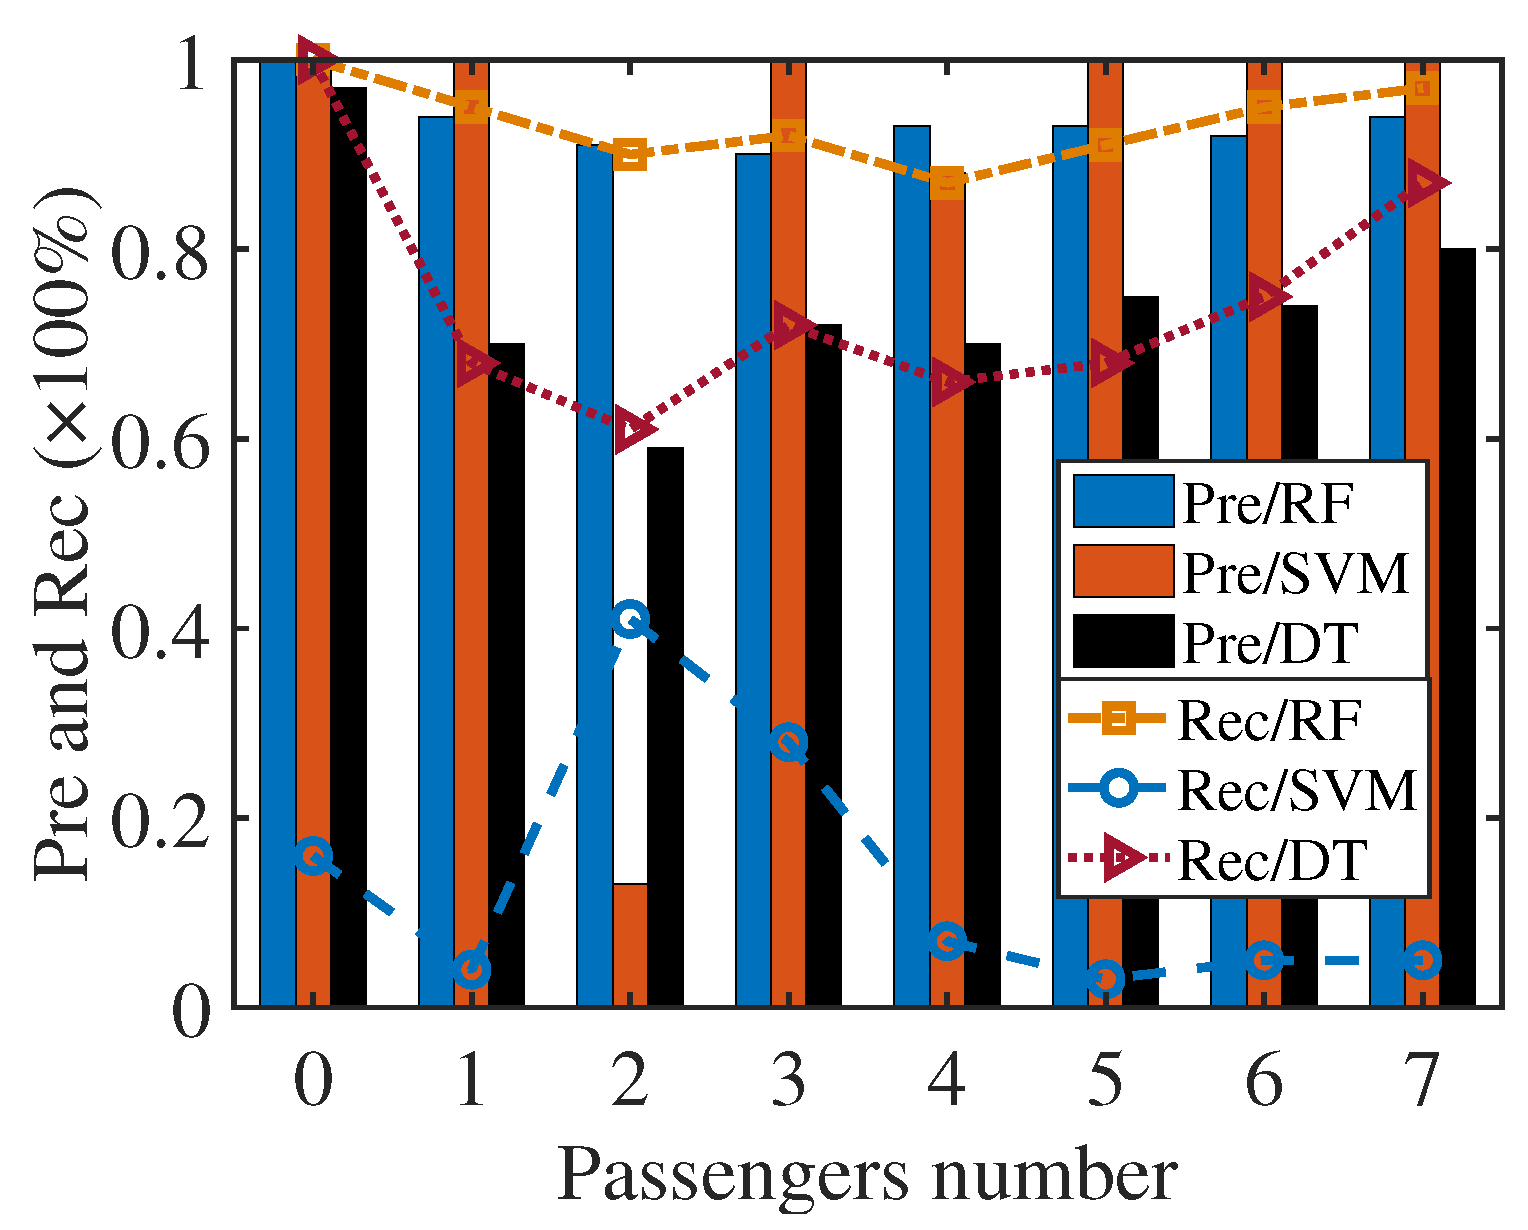
  • Thirdly, this paper proposes the time-varying spectrum (TVS) feature that adopts radar detection schemes, which can maximally reveal the relationship between the passenger number and variation of CSI by calculating the energy variation of CSI attenuation in a short time. To improve the estimation accuracy, ECC also extracts the average of amplitude (AOA), and percentage of non-zero elements (PEM) features to construct a multi-dimensional feature as an indicator of relationship variation. Then, the passenger counting is implemented by the Random Forest (RF) classifier, for the local optimization problem introduced by the small dataset has been solved by expanding the dataset through data segmentation.
  • Finally, the ECC scheme is implemented with commercial off-the-shelf (COTS) 802.11n devices (Atheros 9300 NICs), then it is evaluated with real-world experiments. Extensive results prove that ECC can effectively estimate the passenger number in the elevator, which can be applied to guide the adjustment of the elevator counterweight.
The rest of this paper is organized as follows. Section 2 presents the theoretical analysis and real-world observations of the relationship between the passenger number and the variation of the CSI. The materials and system design are elaborated in Section 3, followed by performance evaluation in Section 4. Section 5 discusses the limitations and solution schemes of ECC systems. Finally, the conclusion is given in Section 6. The list of main abbreviations is shown in Abbreviations part.

2. Theoretical Analysis

2.1. The Variation of CSI with the Passenger Number

The CSI of one sub-carrier can be expressed as [26,27]:
H = i = 1 p | A i | · e j ϕ i
where, p is the number of propagation paths. | A i | and ϕ i denote the amplitude and phase values, respectively. Since the center frequency of each sub-carrier is different, for m sub-carriers, the channel CSI matrix is denoted as H r = [ H 1 , H 2 , , H m ] . People affect the link in two major ways: Line of Sight (LoS) path and multi-path. Each person may reflect or block the signal and cause the receive vector to be strengthened or weakened. The receive matrix of one antenna is denoted as Y i . Thus, if there have p propagation paths from a transmit antenna ( Tx ) to one receive antenna ( Rx ), the receive matrix can be expressed as:
Y = Y 1 + Y 2 + Y 3 + + Y p = i = 1 p Y i
hence, the orthogonal frequency division multiplexing (OFDM) system in the frequency domain is modeled as Y = H r X + N v . X and N v are the transmit vectors and the noise vectors, respectively. Hence, the estimated value of H r can be expressed as:
H ^ r = Y X = 1 X i = 1 p Y i
In radio communications, the OFDM systems are widely used to divide the wireless network spectrum into orthogonal sub-carriers. However, the emitted WiFi signals often do not reach the receive antenna directly due to obstacle blocking and multi-path effects of signal propagation [23]. A portion of the signals passes through the medium, while other signals are reflected or absorbed by the medium. Hence, the signal has different degrees of attenuation during transmission and different reflection coefficients on the various mediums, which are calculated as follows [28]:
Γ = E E 2 1 2 w ε 0 σ 2 + 1 1 + 2 w ε 0 σ 2 + 1 1 2 2 w ε 0 σ
where E and E are the energy of the reflected signal and the incident signal. w, ε 0 , and σ are the frequency constant, dielectric constant, and the conductivity of the medium, respectively. As Γ is close to 1, as σ , the signal strength reflected by the medium is becoming stronger. The reflection coefficient of walls and furniture is about 65–78% which is close to 70% of people. Hence, many approaches require people to keep moving to reflect the variation of signals for separating people from objects. If people are in a static state, the performance of these methods will become weakened.
Unlike indoors, the elevator is mainly composed of metal materials with no occlusion inside. Hence, the reflection coefficient inside the elevator can reach more than 90%. The intensity of signal propagation is stronger than the indoor environment, and different crowd numbers will produce a drastic variation of signal. The relationship between the variation of CSI and the passenger number can be revealed. The probability of signal reflection inside the elevator can be calculated as follows:
S f ( n ) 0.7 · S b ( n ) + 0.9 · 1 S b ( n ) = 1 0.2 · S b ( n )
where n is the passenger number, S b ( n ) is the probability of signal occlusion, and S b ( n ) satisfies S b ( n + 1 ) S b ( n ) S b ( n ) > n , which illustrates that the probability of signal occlusion will increase as the passenger number grows [29]. Hence, the following inequality can be inferred:
S f ( n + 1 ) S f ( n ) < n · S f ( n ) 1 < 0
Equation (6) shows that the probability of signal reflection reduces as the passenger number increase, which also proves the signal propagation path number reduces. Based on this, the Fast Fourier Transform (FFT) operator is applied to the two sides of (3):
S ( H ^ r ) = 1 X i = 1 p S ( Y i )
S ( H ^ r ) decreases with the growing number of people, which also proves that the CSI attenuation strengthens as the passenger number increases. Figure 1a shows the variation of the CSI amplitude for one sub-carrier when the elevator runs between adjacent floors under a different passenger number. There is a monotonous relationship between the variation of CSI average amplitude and the passenger number, which could effectively validate the above analysis, as shown by the blue line.

2.2. Major Challenge

Figure 1a also shows that the running time is T r = P n × τ = 4 s when the elevator only moves between adjacent floors, which is the shortest running time for the elevator. P n is the number of packets, τ is the interval time between sending packets, and τ = 1 ms. Hence, only about 4000 packets can be captured, which means the relationship between the variation of CSI and the crowd number can not be effectively reflected. In addition, the CSI is easily affected by environmental changes (e.g., people distribution), and it will become weaker as the passenger number continued to expand. Hence, the primary challenge of ECC is how to extract more properly quantifiable indexes from the limited data in the short running time of the elevator that can characterize the relationship between the number of static passengers and the variation of CSI. Secondly, how to solve the issue of small datasets for multi-dimensional features and to find a suitable classification algorithm to estimate the crowd number and perform passenger flow calculations are the other problems.
In addition, when the door of the elevator opens, people may enter and exit, which also affects the CSI. Figure 1b shows the variation of the CSI when the elevator door opens. In this experiment, there are 4 persons in the elevator, and when the elevator door opens, 3 persons leave, and 4 other persons enter. The door opening is about 3 s long, and the door is open for 9 s , while this time is different due to manual intervention. When the door opens or closes, the CSI amplitude rapidly drops or rises until the door fully opens or closes. The amplitude of CSI is at the valley value when the door fully opens and vice versa. Moreover, the people number keeps changing when the door opens. Hence, these fragments should be cut out.

3. Materials and Methods

3.1. System Design

In this section, the details of our ECC system are given. Figure 2 gives an overview of the system architecture. The system works in three phases: (1) CSI pre-treatment: The system adaptively selects the principal components (PCs) from the 30 sub-carriers and performs signal de-noising. The largest difference of all sub-carriers can be reflected in the PCs, and the external interference is removed. (2) Multi-dimensional feature extraction: The system composes a multi-dimensional feature by calculating the AOA, TVS, and PEM. They are used to indicate the relationship between the change of CSI and the passenger number. (3) Passenger counting: The system divides the data into multiple groups to expand the datasets, which expands the range of samples selected for the classifier and reduces the impact of the local optimization problem. In the basic ECC system, Atheros 9300 NICs are used for data acquisition, two antennas continue to broadcast beacon messages, and the other two antennas work to measure the CSI values of the channel. In the next six subsections, the design of ECC is elaborated.

3.2. CSI Segmentation

People keep in a relatively static state in the elevator with small activity. As the passenger number changes due to some people entering or exiting, the passenger number cannot be predicted correctly during this time. Hence, the CSI signal requires to be split and the running segments of the elevator are extracted. Figure 3a shows that CSI amplitude gradually decreases to the valley due to the number of signal propagation paths reducing when the door opens or closes. However, the raw CSI signal is too rough for us to split. Therefore, the wavelet transform (WT) is introduced to perform time-frequency analysis that not only keeps the integrity of the information but also can locally detect the singularity of the signal, which is suitable for mutation signals.
Figure 3b shows the Low-Frequency (LF) and High-Frequency (HF) information of the CSI sequence after WT. HF information can reflect the mutation of the signal more clearly. The result also illustrates that the running time is different every time. CSI segmentation is mainly divided into 3 steps: (1) Get HF wavelet coefficients after WT. The mutate points of signal in the WT domain often correspond to the modulus maxima values of the HF wavelet coefficient. (2) Find all extreme modulus points. All the modulus maxima points of the HF wavelet coefficients need to be extracted. (3) Extract running fragments. The running parts are the signals between the two adjacent modulus maxima of HF wavelet coefficients. However, they cannot contain modulus minima points between adjacent modulus maxima points of the HF wavelet coefficient.

3.3. Sub-Carrier Decorrelation by SLD-PCA

A single antenna pair provides 30 streams of CSI from 30 sub-carriers, and they are mostly correlated. However, for time-frequency analysis, as few streams as possible are required to reduce the computational overhead in constructing the spectrogram for feature extraction [30]. Traditional principal component analysis (PCA) [31] uses the same method to deal with adjacent data and non-adjacent data, which makes it impossible to discover the local structure of the data in a short time. Hence, this paper proposes an SLD-PCA algorithm to decorrelate the CSI streams.
SLD-PCA combines the local preservation idea of the locality preserving projection (LPP) method and adopts different processing methods for the adjacent and non-adjacent data in the data. It separates the non-adjacent data as much as possible in the projection space while keeping the original adjacent relationship for the data. If the initial data matrix is x = ( x 1 , x 2 , , x N ) , and the matrix after projection is y = ( y 1 , y 2 , , y N ) . Then, the following constraint conditions are added to the original optimization function:
max i , j = 1 N | | y i y j | | G i j , s · t · i , j = 1 N | | y i y j 2 G i j = 1
where N is the length of CSI, the weight G i j = 1 if the data x i and x j are non-adjacent points; otherwise G i j = 0 . The weight G i j = e x i x j 2 / ξ , and ξ is an adjustable parameter. G i j = 0 represents x i and x j are non-adjacent points. The smaller the distance between adjacent points x i and x j in the high-dimensional space, the larger the value of G i j . According to the equality constraint, the distance between their corresponding low-dimensional space projections y i and y j is smaller. The equality constraints mean that when the closer points in the high-dimensional space are projected into the low-dimensional space, they keep a relatively close distance, so the local structure of data is preserved.
After SLD-PCA, the data are converted from the original coordinate system to the new coordinate system, and the PCs are extracted. However, most of the variances are in the first few coordinates in the order, while the other few are almost zeros in the subsequent coordinates [32]. Its meaning is to retain only the feature dimensions that contain most of the variances while ignoring the dimensions where the variances are almost zero to reduce the dimensionality of the feature data. Hence, the number of PCs is selected by calculating the capture variance (CAV):
CAV = CUM of selected PCs CUM of all 30 sub - carriers 95 %
where CUM is the cumulative variance. Figure 4 shows the results of PC’s selection for 4 and 6 persons. The results prove that the main variation of the CSI concentrates on the first 3 and 2 PCs. Moreover, the number of PCs is not the same under the different cases, and there is no monotonous relationship between the number of people and the number of PCs. It is because the human factor will cause the different reflection of CSI. The results also show that the noise level begins to increase as the number of PCs increases. Hence, the signal de-noising on each PC is required.

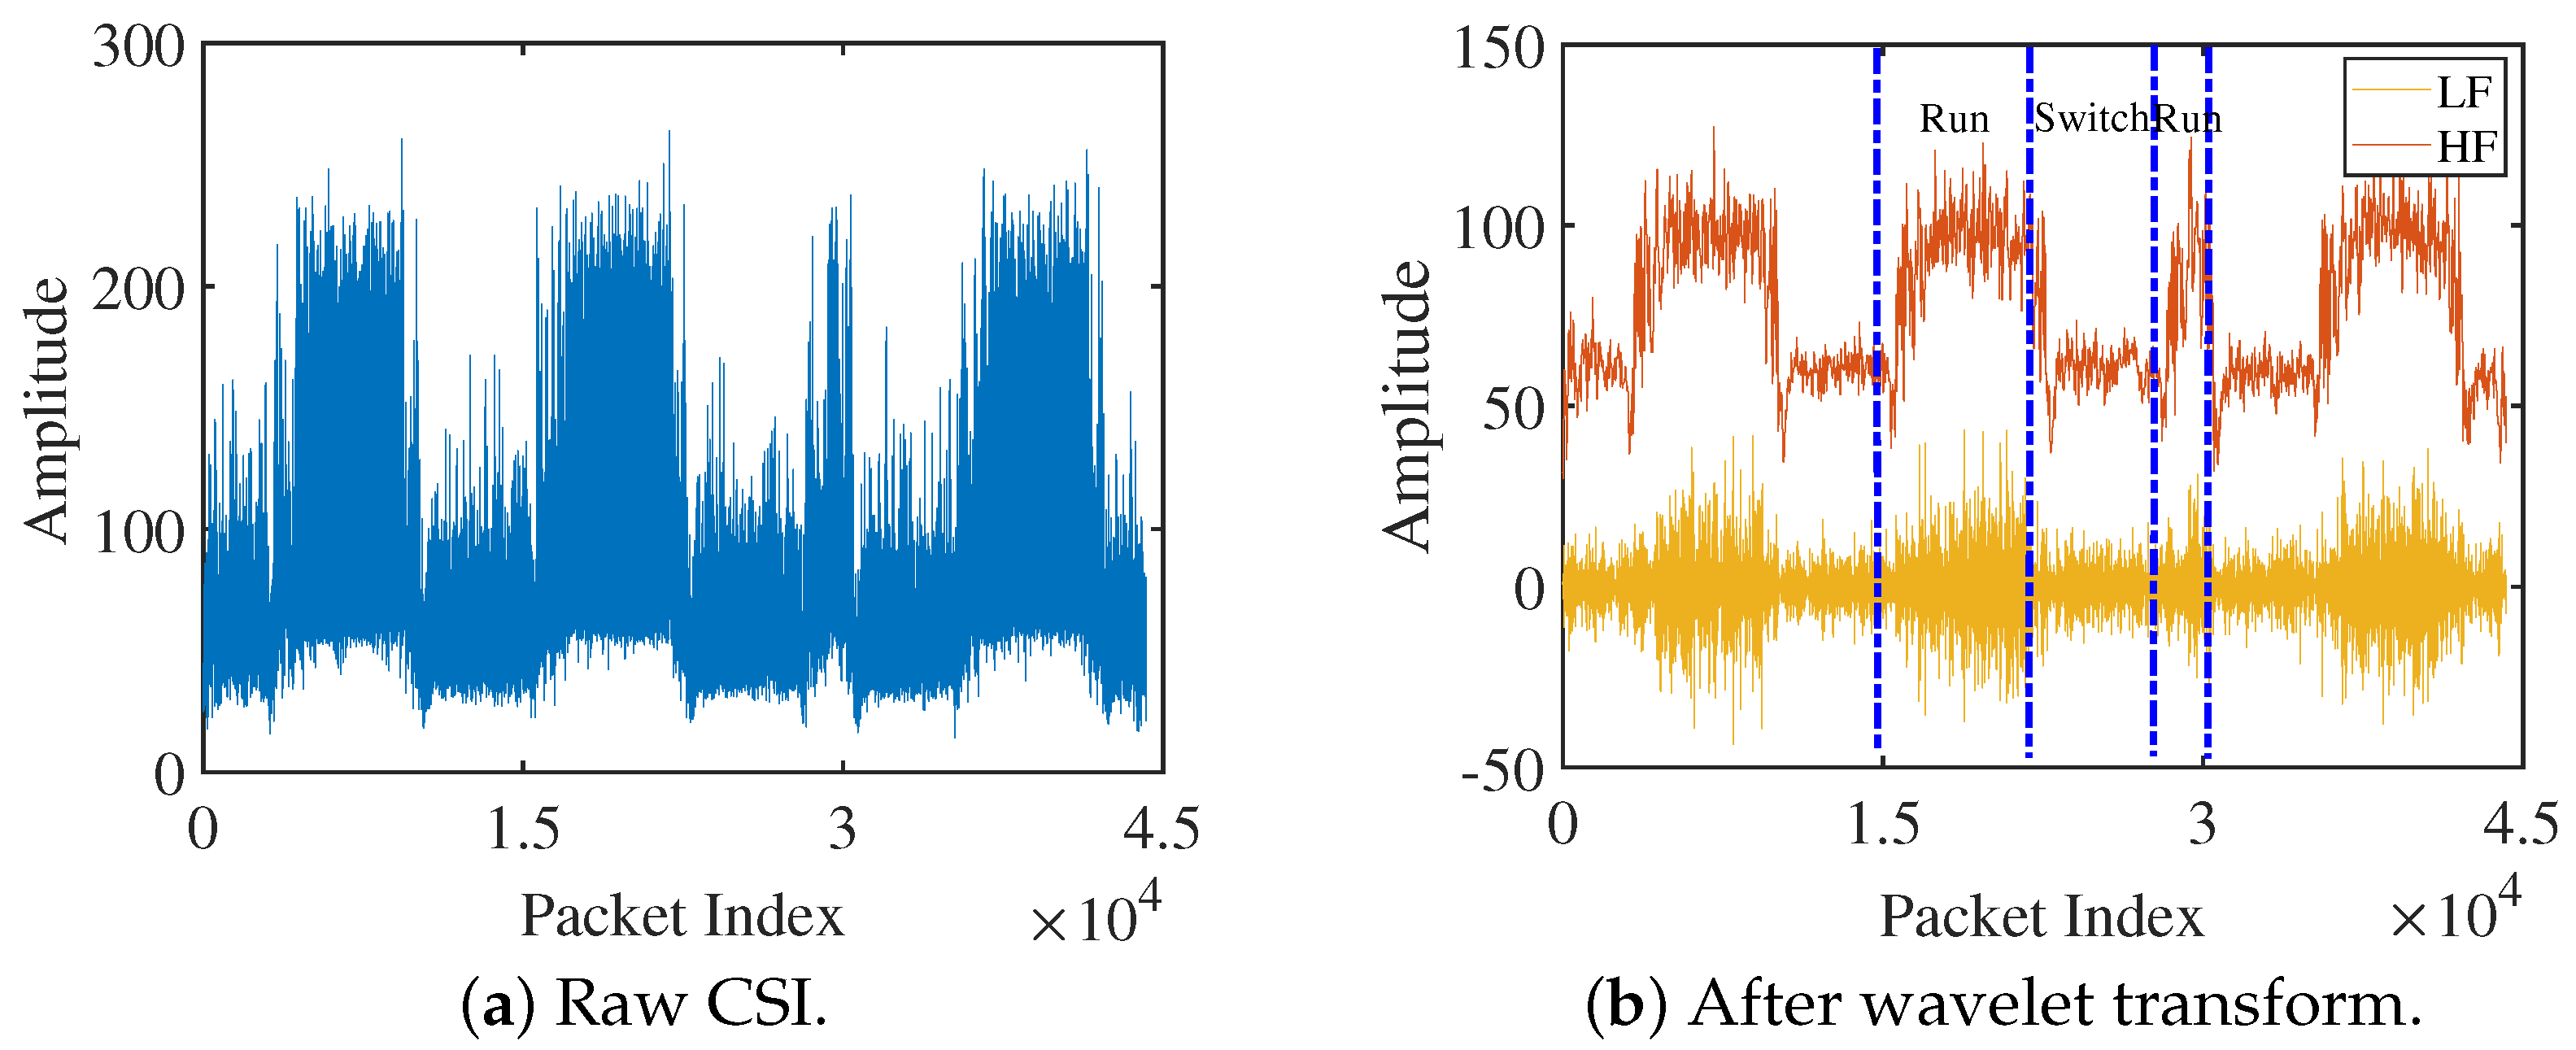
3.4. Noise Reduction

CSI subcarriers obtained from the wireless network cards are accompanied by additive white Gaussian noise and encounter various interference during propagation [33]. Time domain methods may cause vital high-frequency information to be lost for unstable signals. Frequency domain methods have a long transition zone, which is easy to cause distortion and loses vital signal components. Hence, the wavelet coefficient correlation de-noising algorithm (WCCDA) based on discrete wavelet transform (DWT) is adopted; it is a time-frequency analysis method in all bands. In WCCDA, by transforming the signal into the wavelet domain, the signal is divided into multiple frequency levels, called wavelet levels. The high-frequency wavelet coefficients of the signals between the adjacent levels have a strong correlation, but the noise has no such correlation [34]. Based on this, the noise mixed in the CSI can be effectively eliminated. The wavelet correlation coefficient and normalization coefficient can be calculated as:
C W j , k = W j , k W j + 1 , k
W ˜ j , k = C W j , k P W j P C W j
where W j , k is the high-frequency wavelet coefficient, C W j , k is the correlation coefficient at point k of level j, W ˜ j , k is the normalized correlation coefficient, P W j = k W j , k 2 represents the energy of high-frequency wavelet coefficients, and P C W j = k C W j , k 2 represents the correlation coefficient’s energy.
Then, compare W ˜ j , k and W j , k on each level: If W ˜ j , k W j , k , it is the true signal, take W ˜ j , k = W j , k , and set W j , k = 0 . If W ˜ j , k < W j , k , it is controlled by noise, leave W j , k , and set W ˜ j , k = 0 . Finally, the signal points are retained in W ˜ j , k and the noise points are retained in W j , k . Figure 5 denoises the first three PCs in Figure 4a. WCCDA can effectively eliminate the noise in each principal component and reflect the variation of the signal. The results also showed that the CSI amplitude attenuation gradually strengthens, as the highest amplitude is present in the first PC, the next highest amplitude is present in the second PC, and so on.

3.5. Multi-Dimensional Feature Extraction

As mentioned above, the multi-path effect is stronger in elevators than that in indoor environments, and the CSI is more sensitive to such change. Based on this, a multi-dimensional feature is proposed that includes the AOA, TVS, and PEM to reflect the variation of CSI.

3.5.1. Amplitude Feature

Though the number of signal propagation paths in the elevator gradually reduces as the passenger number increases and the received vector becomes weaker, the variation range of CSI becomes narrow. Hence, the CSI amplitude can not directly be used to characterize the relationship between the people number and the variation of CSI. The AOA is defined to denote the received amplitude of CSI, which is the average value of all PCs after noise filtering. By averaging the PCs, the amount of frequency information of CSI can be obtained as the PCs are orthogonal to each other, and each of them consists of unique frequency components [30]. Moreover, this method can reduce human interference, and the relationship between the variation of CSI and the crowd number can effectively be reflected. The AOA is expressed as:
A O A = 1 M N j = 1 M i = 1 N A i j
where A i j is the CSI amplitude, N is the length of CSI, and M is the number of PCs. The average AOA values of two Rxs with 10 experiments under each passenger number are shown in Figure 6. The AOA value gradually decreases as the passenger number increases. However, the variation of AOA becomes weak as the passenger number grows. Hence, more proper quantifiable indexes are required to verify the relationship between the people and the variation of CSI in a short time.

3.5.2. Spectral Feature

As shown in (7), the energy of CSI attenuation is gradually becoming stronger with the growing number of people. Hence, a new feature of CSI called TVS is proposed, which can be calculated through the following steps:
(1) Frequency feature extraction: For the challenge of few data brought by the short running time of the elevator, the short-time Fourier transform (STFT) method [30,35] is used to transform the signal into the time-frequency domain. STFT adds a sliding time window to the signal and obtains the time-varying frequency spectrum in a few fragments of the signal. The major challenge here is that the frequency resolution is inversely proportional to the time resolution, which requires us to find an optimal window size to obtain satisfying time and frequency resolutions. This paper opts for an FFT window size of 256 samples at a sample rate of 1000 pkts/s and chooses the overlap size of two windows to be 128 samples for two reasons: (a) Excessive window size results in poor time resolution. (b) Higher value increases the computational efforts as it introduces high interpolation. We calculate the frequency resolution of the s a m p l e r a t e F F T s i z e 5 Hz and a time resolution of w i n d o w o v e r l a p s a m p l e r a t e 0.1 s. The spectrograms obtained through this process are illustrated in Figure 7. The results show that the high-frequency information gradually reduces, and the CSI attenuation strengthens as the crowd number grows. It illustrates that the frequency/energy variation of CSI attenuation can characterize the variation of CSI.
(2) Energy statistics of CSI attenuation: The power burst curve (PBC) is adopted to calculate the energy information, adapted from Doppler radar fall detection techniques [30,36]. Doppler radar associates the negative frequencies because it needs to consider the motion direction. Unlike Doppler radar, our spectrum U ( g , f ) does not consider the motion direction, this enables us to define the PBC only for positive frequencies, so our TVS feature can be expressed as:
T V S = g = 1 N P B C ( g ) = g = 1 N f = f l f u | U ( g , f ) |
where f is the frequency range, f l is the lower frequency bound, and f u is the upper frequency bound. We perform this operation on AOA and sum the CSI spectral in the whole frequency range. The average TVS values of each Rx with 10 experiments are also shown in Figure 6. The TVS curve can effectively reflect the monotonous relationship between the energy variation of CSI attenuation and the crowd number.

3.5.3. Metric Feature

The variance operator is applied to both sides of (3), then we obtain D ( H ^ r ) . D ( H ^ r ) increases with a growing number of moving people in the room due to more reflection paths and strong signal fluctuations being introduced [29]. However, the people are in a static state in the elevator, and the block of the signal propagation path is more serious as the number of people grows, which causes the number of receive paths p to reduce. This variation is opposed to the indoor environment of moving people. Based on this, the value of the PEM can be calculated as follows: (a) Transform CSI matrix: Transform the CSI amplitude values in the matrix composed of all PCs into a two-dimensional matrix; the CSI amplitude data are converted into integers I n t , which is expressed as:
I n t = B [ i ] [ j ] B min B max B min · R 1 + 1
where B [ i ] [ j ] is the CSI amplitude value after noise filtering, B max and B min are the maximum and minimum values, and R is the number of rows of the CSI matrix. The elements in row I n t and column j in the matrix are set to “1”. There is a “1” in each column, and the rest are “0”s, and a new CSI matrix C is formed. (b) Dilate CSI matrix: The dilate matrix C 0 is calculated by setting the elements around “1” to “1”s with the dilatation coefficient d. The experiments prove that when d = 15 , PEM can implement the best effect in ECC. (c) Calculate PEM value: Calculate the percentage of the non-zero elements in C 0 , which is the PEM value. (d) Integrating CSI fingerprint: Gather the CSI fingerprint to find the relationship between PEM and the people.
Figure 8 shows the variation of the PEM value in the elevator and the room. The values of PEM have a monotone decreasing relationship with the growing people number in the elevator, while the change in the room is the opposite. However, the performance of PEM is poor when people keep relatively static in the room due to weak signal fluctuations.

3.6. Passenger Counting

Through the above steps, three kinds of feature information are extracted from each R x , and they are put into a matrix to form a multi-dimensional feature matrix. Then, a suitable classification method is required to train the multi-dimensional feature with small computation and high accuracy. In this part, the RF classifier is adopted that does not require any domain knowledge and special parameter settings and is particularly suitable for probing knowledge discovery. However, RF classification algorithms have local optimization problems due to the RF classifier selecting part of the data to construct the decision tree, especially when the amount of data is small.
To solve this problem, this paper divides the captured data into L groups and extracts the features for each group through the above steps, which increases the total number of features L times. This way can expand the range of samples selected for the classifier, which reduces the impact of the local optimization problem. After classification, four prediction results can be obtained: True Positive ( T P ), False Negative ( F N ), False Positive ( F P ), and True Negative ( T N ). Therefore, the estimate accuracy is calculated as A c c u r a c y = ( T P + T N ) / ( T P + T N + F P + F N ) . However, this research only focuses on the positive part of the predicted value. In other words, we care about TP but not TN. Therefore, the estimated precision represents our classification effect, which can be expressed as P r e c i s i o n = T P / ( T P + F P ) .

3.7. Passenger Flow Rate Statistics

Finally, the passenger number is obtained for each running fragment, so the average flow rate of passengers can be estimated in a certain period. The calculation process is:
F ^ r = j = 1 N s i = 1 N r K i j · V i j l = 1 N r L l · ρ
where N r is the number of running fragments in a certain period, and N s is the frequency of crowd counting in the elevator running fragment. K i j is the estimated value of the crowd number each time, V i j is the time for each calculation, and L l is the frequency for crowd counting in running fragments. ρ is the group control coefficient, which is a constant with a value range from 0.5∼1.0 and is determined by the number of group control elevators.

4. Results

4.1. Experiments Setup

This section illustrates the implementation and conducts real-world experiments to show the performance and robustness of ECC in the elevator environment. For the hardware, two Thinkpad X201 laptops equipped with Atheros 9300 NICs are used as the testbed of the proposed method. Each Atheros 9300 NIC is equipped with 2 antennas. The antennas are placed diagonally in the corners of the elevator by using coaxial antenna signal cables to form a 2 × 2 multiple-input multiple-output (MIMO) communication system. The signal frequency of NIC is 5.2 GHz, and the bandwidth is 20 MHz.
For the software, PicoScenes is adopted as the software platform. PicoScenes [37] is a versatile and powerful middleware for CSI-based WiFi sensing with support for up to 27 models of COTS NICs. PicoScenes provides flexibility for transmission parameter selection and a user-friendly approach for CSI data collection. Moreover, PicoScenes provides multiple easy-to-use APIs for plugin development, providing not only CSI data but also other helpful information such as timestamps, RSSI, SNR, etc. In the experiments, 40 groups of real-time data under each passenger number (0∼18 passengers) are captured in real elevator scenes, of which 30 sets of data are used to construct the training dataset while the other 10 sets are used to form the testing dataset. The data are captured based on the shortest running time of the elevator (4 s) and set the packet sending interval of 1 ms. Hence, the length of each group of data is 4000.

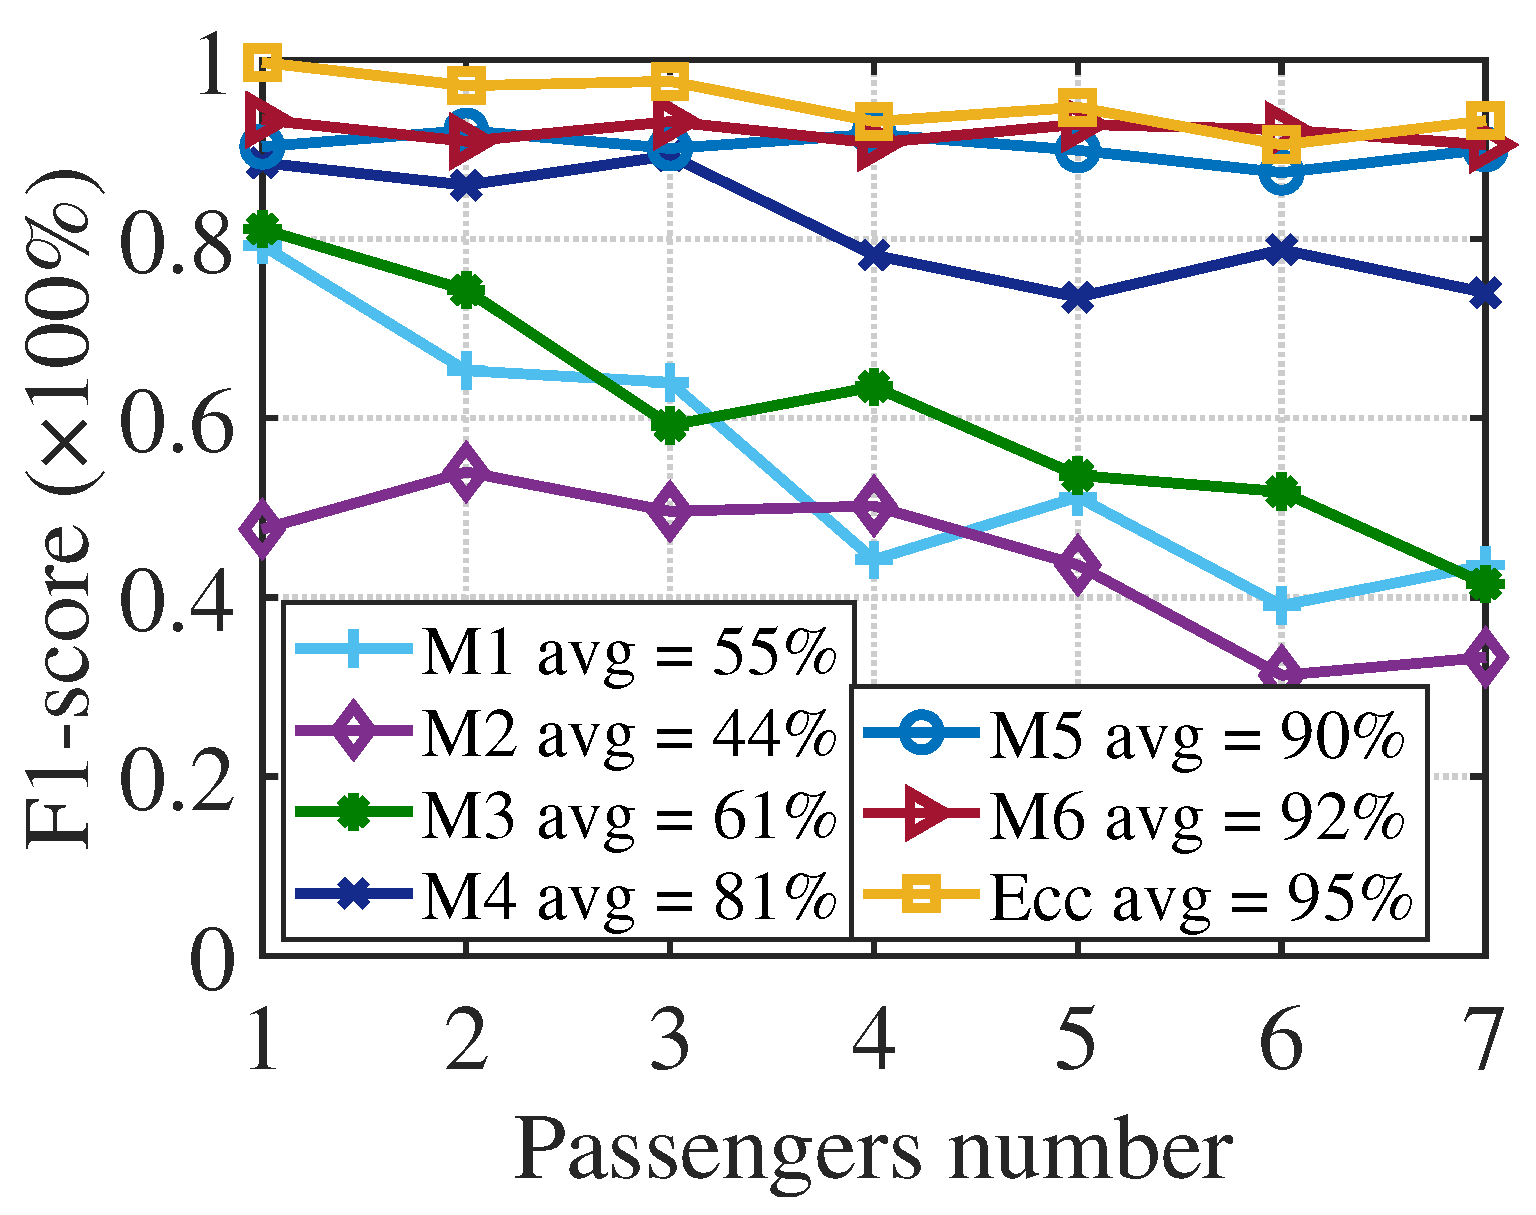
4.2. Performance Comparison of Different Classifiers

Besides the RF classifier, many other classifiers are also suitable for small sample datasets, for example, the decision tree (DT) and support vector machine (SVM) classifiers. Hence, the impact of different classifiers should be considered. A set of experiments are carried out to evaluate the performance of each classifier. Figure 9 shows the average classification results of each classifier under different passenger numbers after 10 experiments, where Pre and Rec represent classification precision and recall rate, respectively. All the test results of each classifier under different passenger numbers are accumulated and averaged. DT can achieve an average Pre of 75%, but when the number of people is 1, 2, and 4, its Rec is low, which shows that the recognition ability of DT is poor. The Pre of SVM can reach 88% on average, but the Rec is very low in all cases. It indicates that only a small part of the positive examples in all the samples is predicted correctly, especially when the crowd number is 2; it is completely unrecognizable. It also illustrates that the performance of SVM is unstable. Both the Pre and Rec of the RF can reach more than 94%, and the Rec is very stable in all cases that demonstrate the stability and robustness of RF are the best among the three classifiers, and RF is the most suitable for the proposed system.

4.3. Impact of Different Feature Dimensions

Since the multi-dimensional feature is used, the impact of different feature dimensions should be evaluated. Figure 10 shows the classification precision when using various features under different passenger numbers. When a single feature is used, the overall average prediction precision can reach about only 30% and 47%, while the precision can effectively improve when 2 features are used simultaneously. The estimated results are 58% (AOA and PEM), 64% (AOA and TVs), and 72% (PEM and TVS), respectively. These results also prove that the precision is greatly improved when the TVS feature is joined, but the effect is still not ideal.
When 3 features are used, the precision improves to more than 94%. To sum up, there is a monotonically increasing relationship between prediction precision and the number of features. Moreover, the highest prediction precision group from each feature combination is selected, and the cumulative distribution function (CDF) of crowd counting errors is calculated, as shown in Figure 11. More than 97% of estimation errors are less than 2 persons when using 3 features, while the CDF value can only reach 60∼75% in other cases. It is because the CSI is susceptible to external factors when the features are few, resulting in poor prediction. In addition, the small estimation error for the crowd number can improve the estimation accuracy of the actual load range and lay a good foundation for the counterweight adjustment of the elevator.

4.4. Impact of Different Scenes

To verify the practicability of ECC, comparative experiments are implemented in two real elevators with a maximum load capacity of 1 ton (scene 1) and 1.35 tons (scene 2), while the data are captured when the elevators move between adjacent floors. Since the TVS and AOA have the same changing trend with the variation of passenger numbers, only the variation of AOA and PEM in the two scenes needs to be tested. Figure 12 shows the average variation of feature values for two Rxs in each scene. Since the space of scene 2 is larger than that of scene 1, the number of propagation paths of the CSI in scene 2 is more than in scene 1 when few people are inside. Hence, most feature values in scene 2 are slightly higher than that in scene 1 under the same cases. When the passengers reach saturation, the feature values are substantially equal, and the average precision of both scenes is above 95%. It also proves that CSI is sensitive to scene changes but not to the scene itself. In a word, ECC has good environmental adaptability and applicability that can provide a better reference standard for counterweight adjustment in various elevator environments.

4.5. Impact of Human Factors

Since the height, weight, and body shape are different for each person, and the people distribution in the elevator is random, these factors may affect our system performance. Hence, the impact of human factors should be evaluated. With the crowd expansion, the internal space of the elevator gradually reduces, and the human factor is not obvious when the passenger reaches saturation. The largest variation rates of all features are when the crowd size is between 2 and 7, as shown in Figure 12. Hence, this experiment chooses this crowd range to evaluate, whereas the tester’s height is 140∼180 cm with a weight of 35∼90 kg. The volunteers are randomly selected to test in two distribution patterns: concentrated (P1) and scattered (P2). Figure 13 shows the average precision and estimation errors of two distribution patterns. The precision of P1 can reach 93%, and the estimation error is about 7%, while the precision of P2 reaches 95%, and the difference between the two estimation errors is 1.4%. Though the performance of ECC in the P2 pattern is slightly better than the P1, ECC still has good stability. The result also proves that ECC can adapt to the passenger characteristics and the diversity of distribution well in the elevator; thereby it can accurately infer the actual load range of the elevator.

4.6. The Resolution of Passenger Counting

Figure 14 shows the maximum resolution of passenger counting and the average estimation errors when the passenger number is 0∼18. All the features gradually stabilize when the passenger number is greater than 15. Moreover, for two scenarios, the errors are tiny when the people number is less than 12, and they increase to 9–10% when the number of passengers grows to 15. The estimation error of both scenes increases to about 14% when the number of people reaches 18. The results also show that the elevator gradually reaches saturation as the number of people increases from 15 to 18, and the estimation errors vary around 12–14%. It also shows that the number of CSI propagation paths gradually becomes stable. The performance of the maximum extent estimate for the passenger number makes a wide adjustable range of the elevator’s counterweight, which can meet the daily work requirements of most elevators.

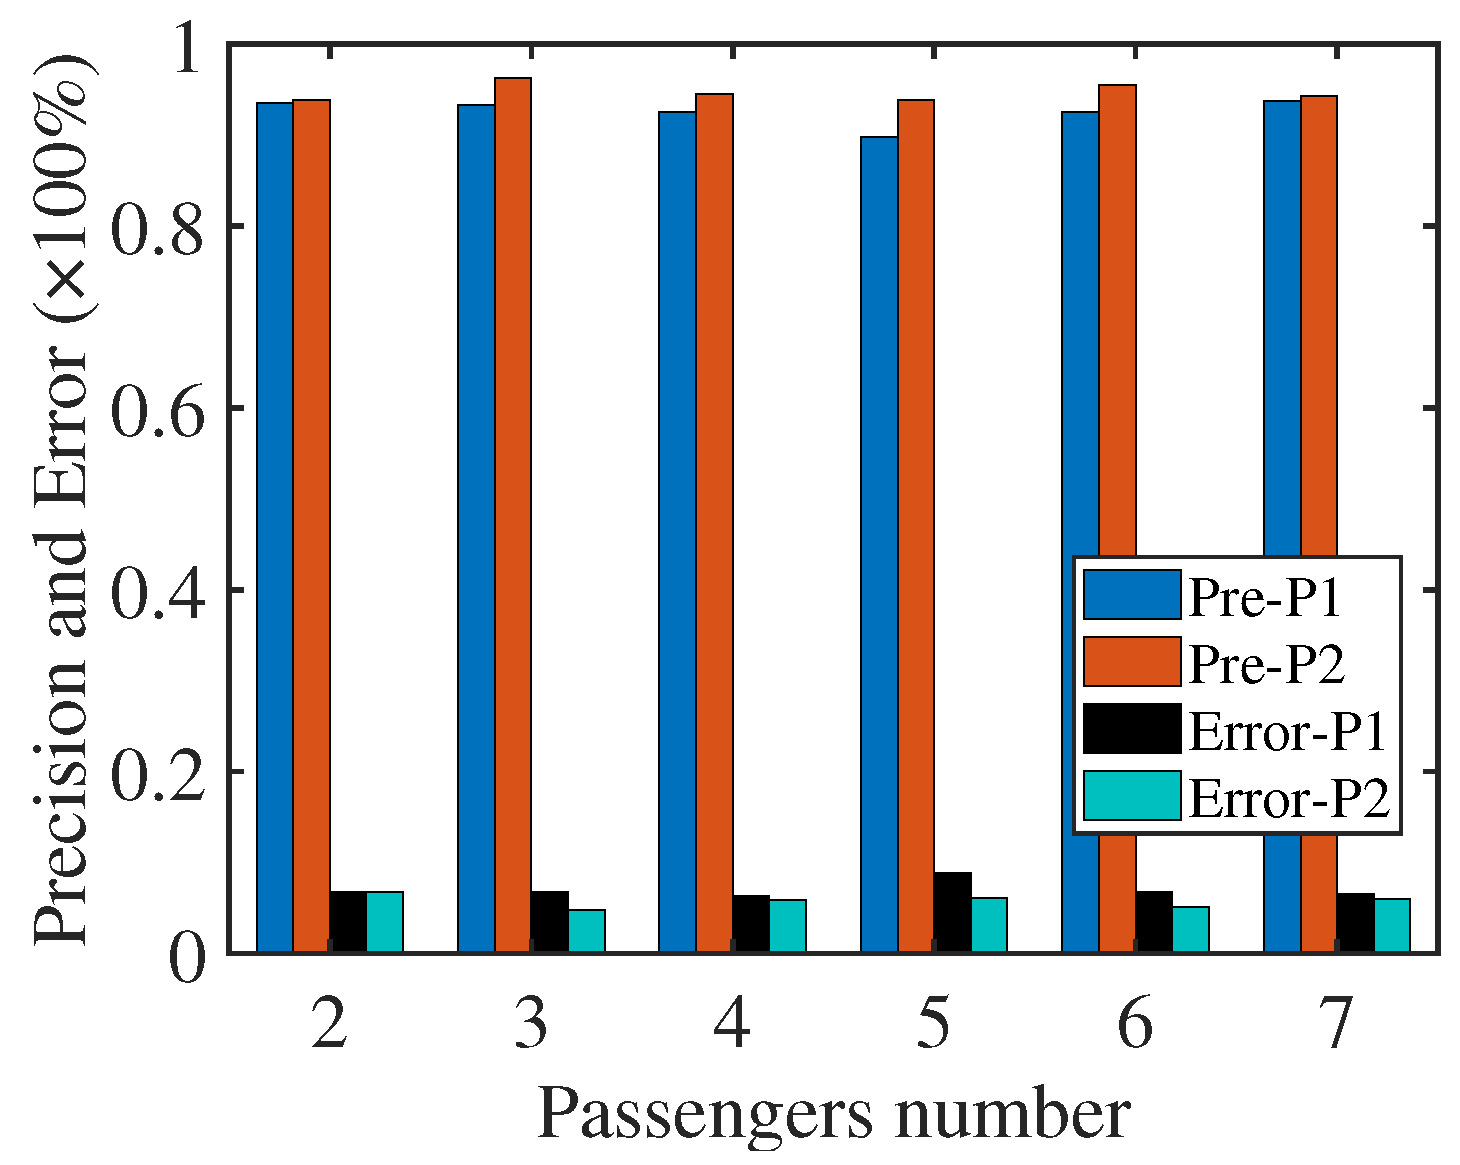
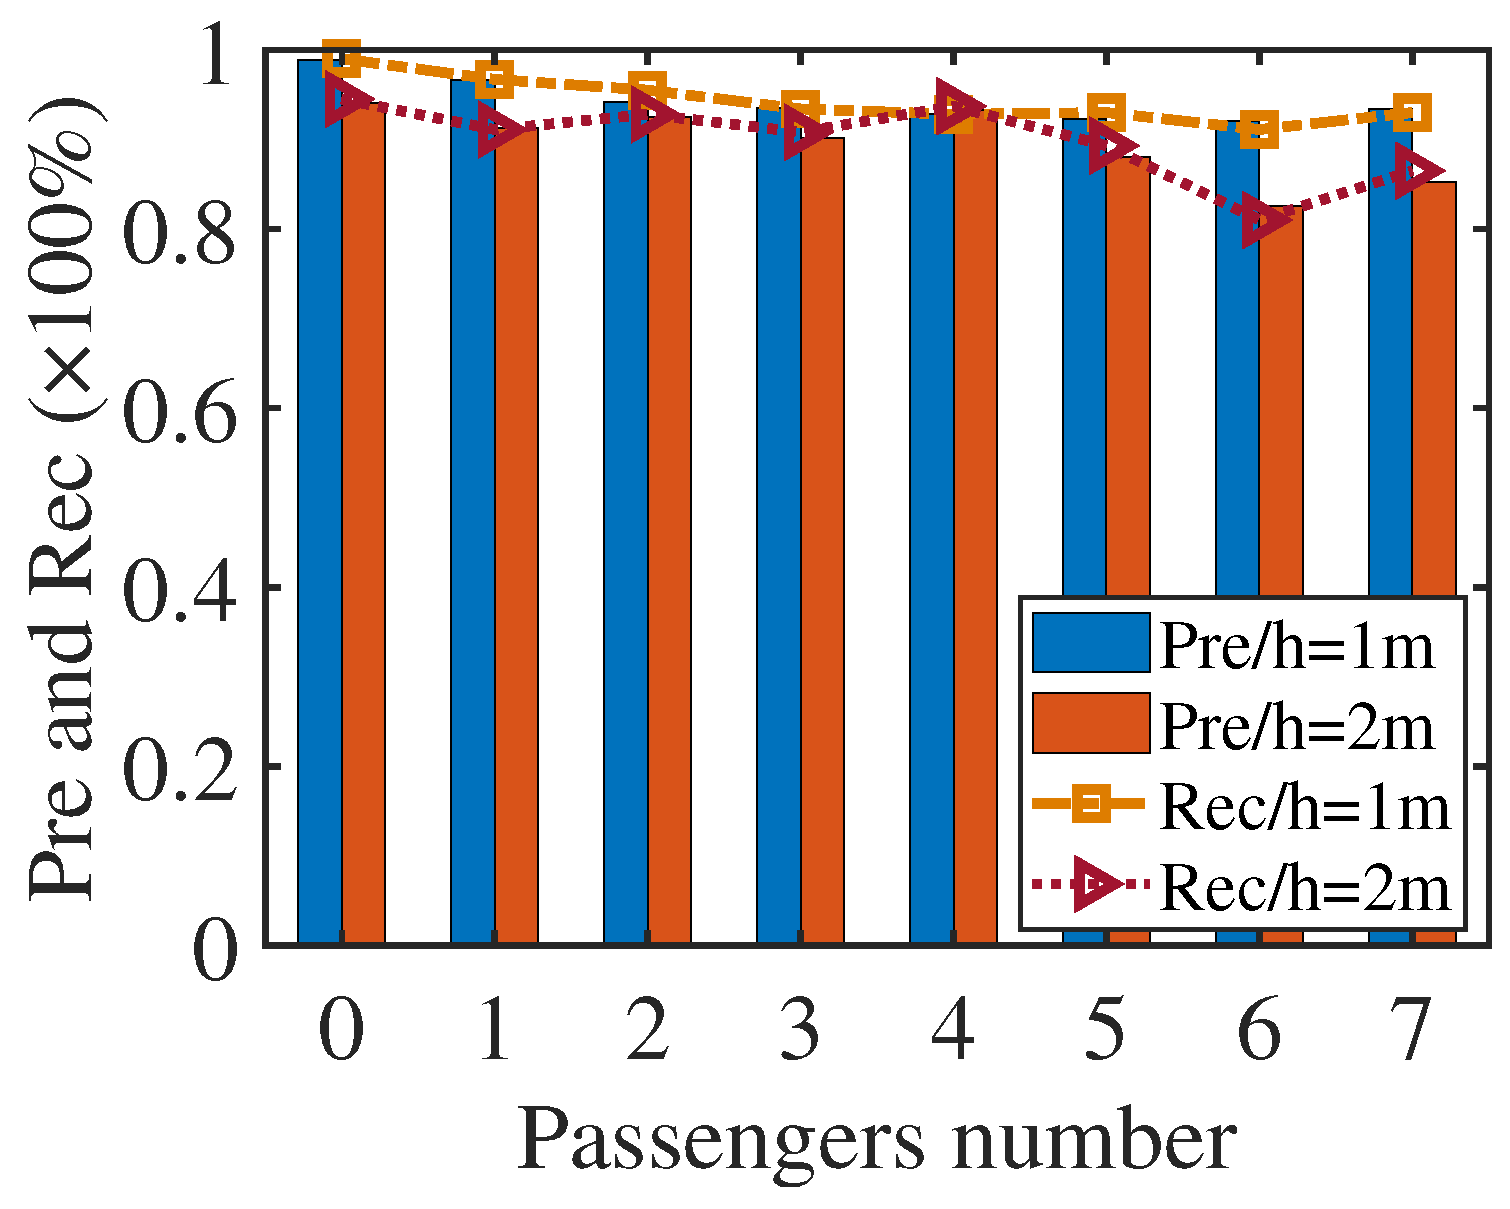
4.7. Impact of Device Layouts

The placement of the devices directly affects the quality of the captured data, which is also related to the performance of the classification. Hence, the impact of device layouts on the predicted results should be analyzed. Because the elevator space is small, in order not to affect the regular use of the elevator, the devices can only be placed in the corner. This experiment changes the layout by adjusting the height of the antennas and conducting a set of experiments. Figure 15 shows the classification results when the height of the antennas from the ground is set to h = 1 and h = 2 m, respectively. The average classification precision and recall rate can reach more than 95% when the antenna height is 1 m, while the above indexes are only about 90% when the antenna height is 2 m. This is because the principle of our method is as the number of people increases, the number of propagation paths reduces, and the attenuation of signal strength decreases. When the antenna height is higher than that of a person, the reflection area for people reduces, and the blocking effect on the signal reduces. Hence, the relationship between the variation of CSI and the people number becomes weaker.

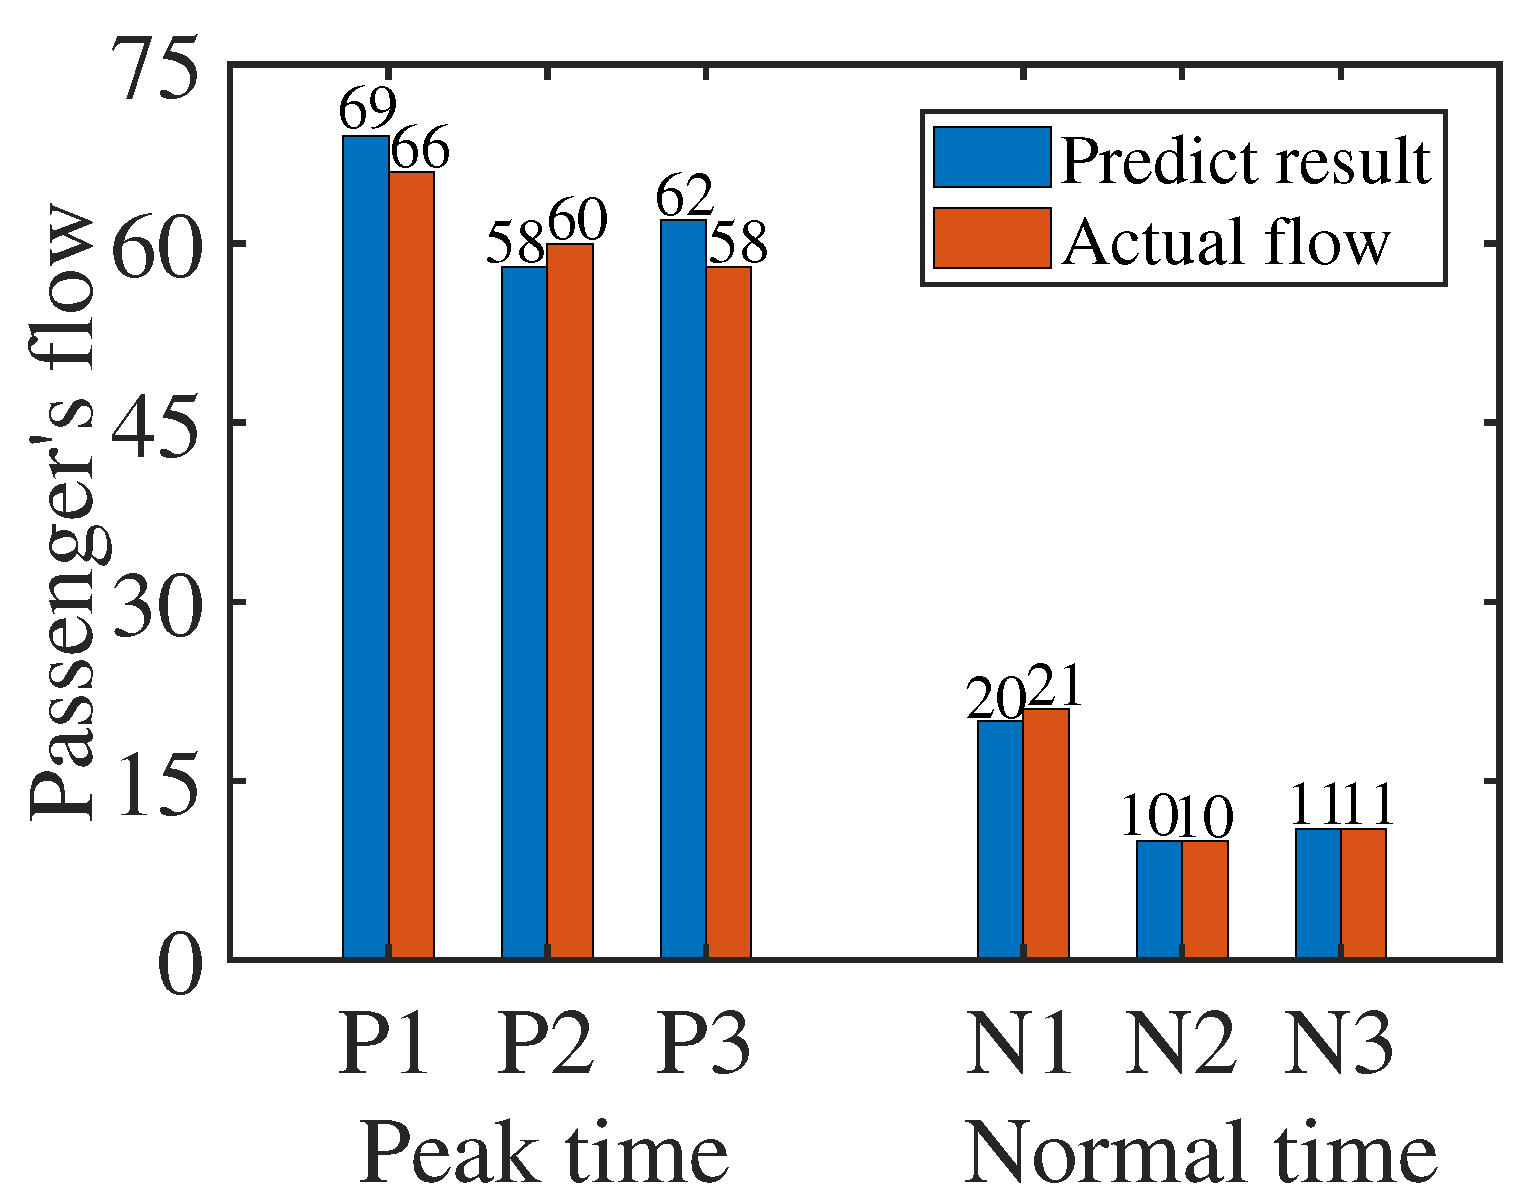
4.8. Precision Comparison of Passenger Flow Rate Statistics

This part shows a set of experiments that verify the practical applicability of ECC. The experiments are carried out in a 5-floor office building equipped with two group-controlled elevators, and the maximum rated number is 15. The passenger flow rates are counted during peak hours (a.m. 8:00∼9:00) and normal hours (a.m. 10:00∼11:00). Three tests are carried out in each period, and each test interval is 10 min. The group control coefficient is ρ = 0.8 . Figure 16 shows the comparison between the predicted results and the actual passenger flow rates. The average predicted precision of flow rate during peak times reaches 95%, while it can achieve 98% for normal times. It is because the saturation ratio of the elevator is low under normal cases, which makes the system performance better.

4.9. Comparison with Other Approaches

Since there are many device-free crowd counting works, ECC needs to compare with the state-of-art approaches. As the underlying data sample distribution of each approach is unbalanced in the different environments, the F1-score, which is not sensitive to the data sample distribution, is used for evaluation. Then, a set of experiments under the same environment of the above subsection are performed. Figure 17 compares the F1-score of these methods in scene 1. For the M1 [25] and M2 [22] methods, about 50% of the results are accurate due to the RSSI-based schemes performing poorly in multi-path complex environments and scene migration. FreeCount [23] (M3) can achieve more than 60% accuracy because CSI is more sensitive to the diversity of transmission channels than RSSI. Due to M4 [24] not only estimating the number of people but also providing human dynamics monitoring through participant number estimation, its F1-score reaches more than 80%.
Though the proposed methods in M5 [38] can achieve about 100% estimation accuracy for moving people in indoor environments based on COTS, its estimation accuracy drops to about 90% for relatively static crowds in the elevator. The M6 [39] approach uses the relationship between the variation of CSI and the people number for counting and locating dynamic and static crowds. However, its average accuracy for crowd counting and localization can only reach 77% and 82%, respectively. In addition, most of these methods need people to keep moving, and the maximum crowd resolution is low. Compared with the above methods, the estimation accuracy and crowd resolution of ECC are much higher, which reaches more than 95%. For a more specific comparison, this paper adds some other related algorithms and gives the benchmark table of ECC and each method, including range, accuracy, infrastructure, characteristics, etc., as shown in Table 1. It also can be seen from each indicator of the methods in the table that the comprehensive performance of the ECC system is the best and is suitable for application in the elevator environment.

4.10. System Overhead

Since the running time of the elevator is very short, the time overhead of the system is related to the practical applicability of ECC. Hence, the time cost of ECC through 10 sets of experiments with the number of passengers from 1 to 10 is tested to ensure that it can handle CSI and identify the passenger number in practice. Table 2 shows the average time overhead of the main processing steps. The results show that the overhead of ECC is modest: The total time overhead of ECC is about 3.5 s, which is less than the shortest running time of the elevator (between adjacent floors). Among all the time overhead, the feature extraction accounts for more than 50%, and the most time-consuming step is the time-frequency analysis step in the feature extraction, which finishes within about 1 s for a sampling rate of 1000 pkts/s. If ECC can be implemented in DSP or other embedded systems, the time overhead can be decreased.

5. Discussion

ECC is still researching prototype implementations that need further improvements before it can finally be deployed for the intended application of elevator safety. The factors that affect the system performance have been summarized in the following fields:
  • A general way of device deployment is required to make sure of WiFi signal coverage and the verification of our system in more types of elevator environments. In the experiments, the device was deployed in positions where it could achieve maximum coverage. However, it is impossible to deploy these devices inside an elevator in an actual environment. In addition, the materials and structures of some elevators are different, which will lead to differences in the mathematical relationship between the variation of CSI and the crowd number. The variation of the features may also be different in different cases.
  • In the experiments, the testers are relatively static, but people usually perform some small activities, such as raising their hand, touching their nose, turning around or talking to each other, etc. These activities may affect the strength and path number of signal propagation that may have different effects on the system.
To solve the above problems, the researchers have designed two improvement schemes and will try to implement each scheme:
  • The researchers first consider using a smaller alternative hardware device, which can be deployed on the top of the elevator, like a camera, without affecting the normal use of the elevator. Then, the device number and the deployment will be adjusted according to the different elevators and verify the system performance.
  • More CSI propagation path information (e.g., the phase, etc.) will be introduced into the multi-dimensional feature to improve the resolution of the crowd when the CSI is interfered with by human activities, thereby improving the estimation accuracy and strengthening the practical applicability of the system.
In addition, there also is a problem with the experimental hardware devices; of course, this problem is not limited to our system. Currently, many wireless sensing research based on commercial WiFi devices use network interface cards, e.g., 5300 and 9300 series NICs. However, the CSI can be accessed through software only in a limited number of chip-set ranges with modified drivers and firmware. If the chip-set manufacturers can expose CSI externally in a wider range of products, it will greatly accelerate our research progress in the field of wireless sensing.

6. Conclusions

As the number of buildings in the city continues to rise, elevators have become an inevitable device for household environments. However, the long-term imbalance between the counterweight and the actual load during the elevator movement will accelerate the consumption of the device, resulting in safety hazards and energy costs. Hence, a passenger counting method is required to calculate the usage rules of elevators. In this way, the actual load range of the elevator can be inferred, thereby regularly adjusting the counterweight of elevators according to practical requirements to solve the above problem. This paper proposes a device-free passenger counting approach in the elevator called ECC based on commodity WiFi. ECC presents an SLD-PCA method to decorrelate the CSI streams and simultaneously performs the pre-treatment process with CSI segmentation and noise reduction. Then, ECC proposes a TVS feature that adopts radar detection schemes, which can calculate the short-time energy variation of CSI attenuation with the passenger number, then constructs a multi-dimensional feature matrix with AOA and PEM features. Finally, the RF classifier is employed to complete the passenger counting work based on the expended datasets. Extensive real-world experiment results demonstrate that ECC performs well in precision, scalability, and reliability, which can be applied to guide the adjustment of the elevator counterweight.

Author Contributions

Conceptualization, X.M. and Z.C.; Data curation, Z.C. and H.H.; Formal analysis, H.H.; Methodology, X.M., W.X. and Z.C.; Project administration, W.X. and J.Z.; Software, X.M.; Supervision, W.X. and J.Z.; Writing—original draft, X.M.; Writing—review and editing, X.M. and Z.C. All authors have read and agreed to the published version of the manuscript.

Funding

This work was supported by the Natural Key R & D Program of China 2019YFB2102200, NSFC Grant No. 61832008, 62072367, 62176205, and National Science Foundation of Shaanxi Province 2021JM-025.

Institutional Review Board Statement

Not applicable.

Informed Consent Statement

Not applicable.

Data Availability Statement

The datasets used and/or analyzed during the current study are available from the corresponding author upon reasonable request.

Conflicts of Interest

The authors declare no conflict of interest.

Abbreviations

The following abbreviations are used in this manuscript:
CSIchannel state information
GDPRgeneral data protection regulation
OFDMorthogonal frequency division multiplexing
COTScommercial off-the-shelf
PCsprincipal components
AOAaverage of amplitude
TVStime-varying spectrum
PEMpercentage of non-zero elements
WTwavelet transform
SLD-PCAshort-time local detection principal component analysis
LPPlocality preserving projection
CAVcapture variance
WCCDAwavelet coefficient correlation de-noising algorithm
DWTdiscrete wavelet transform
STFTshort-time Fourier transform
PBCpower burst curve
MIMO    multiple-input multiple-output
RFrandom forest
DTdecision tree
SVMsupport vector machine
CDFcumulative distribution function

References

  1. Zheng, B. Intelligent Fault Diagnosis of Key Mechanical Components for Elevator. In Proceedings of the 2021 CAA Symposium on Fault Detection, Supervision, and Safety for Technical Processes (SAFEPROCESS), Chengdu, China, 17–18 December 2021; pp. 1–3. [Google Scholar]
  2. Zhang, Y.; Feng, S.; Chen, J.; Niu, K. Research on automatic test system of elevator upward braking check. In Proceedings of the Sixth International Conference on Electromechanical Control Technology and Transportation (ICECTT 2021), Zhuhai, China, 14–15 January 2022; Volume 12081, pp. 375–379. [Google Scholar]
  3. Zhang, X.; Zubair, M.U. Extending the useful life of elevators through appropriate maintenance strategies. J. Build. Eng. 2022, 51, 104347. [Google Scholar] [CrossRef]
  4. Gurudath, B.; Kumawat, K.K.; Tejaswi, V.; Sondar, P.R.; Rakshan Kumar, J.; Hegde, S.R. Failure Analysis of a Bucket Elevator Shaft. J. Fail. Anal. Prev. 2021, 21, 563–569. [Google Scholar] [CrossRef]
  5. Tzou, H.; Schiff, A. Structural dynamics of elevator counterweight systems and evaluation of passive constraint. J. Struct. Eng. 1988, 114, 783–803. [Google Scholar] [CrossRef]
  6. Delussu, R.; Putzu, L.; Fumera, G. Scene-specific crowd counting using synthetic training images. Pattern Recognit. 2022, 124, 108484. [Google Scholar] [CrossRef]
  7. Lin, S.F.; Chen, J.Y.; Chao, H.X. Estimation of number of people in crowded scenes using perspective transformation. IEEE Trans. Syst. Man Cybern. Part A 2001, 31, 645–654. [Google Scholar]
  8. Nichols, J.D.; Bailey, L.L.; O’Connell, A.F., Jr.; Talancy, N.W.; Campbell Grant, E.H.; Gilbert, A.T.; Annand, E.M.; Husband, T.P.; Hines, J.E. Multi-scale occupancy estimation and modelling using multiple detection methods. J. Appl. Ecol. 2008, 45, 1321–1329. [Google Scholar] [CrossRef]
  9. Wang, Y.; Ma, Z.; Wei, X.; Zheng, S.; Wang, Y.; Hong, X. Eccnas: Efficient crowd counting neural architecture search. ACM Trans. Multimed. Comput. Commun. Appl. TOMM 2022, 18, 1–19. [Google Scholar] [CrossRef]
  10. Zhang, Y.; Zhou, D.; Chen, S.; Gao, S.; Ma, Y.S. Single-Image Crowd Counting via Multi-Column Convolutional Neural Network. In Proceedings of the 2016 IEEE Conference on Computer Vision and Pattern Recognition (CVPR), Las Vegas, NV, USA, 27–30 June 2016; pp. 589–597. [Google Scholar]
  11. General Data Protection Regulation. Regulation (EU) 2016/679 of the European Parliament and of the Council. Regulation 2016, 679, 2016. [Google Scholar]
  12. Wirz, M.; Franke, T.; Roggen, D.; Mitleton-Kelly, E.; Lukowicz, P.; Tröster, G. Probing crowd density through smartphones in city-scale mass gatherings. EPJ Data Sci. 2013, 2, 5. [Google Scholar] [CrossRef] [Green Version]
  13. Chen, M.; Yang, X.; Jin, Y.; Zhou, M. Dynamic Time Warping Based Passive Crowd Counting Using WiFi Received Signal Strength. In Proceedings of the International Conference on Artificial Intelligence and Security, Dublin, Ireland, 19–23 July 2021; pp. 667–677. [Google Scholar]
  14. Ding, H.; Han, J.; Liu, A.X.; Zhao, J.; Yang, P.; Xi, W.; Jiang, Z. Human object estimation via backscattered radio frequency signal. In Proceedings of the 2015 IEEE Conference on Computer Communications (INFOCOM), Kowloon, Hong Kong, 26 April–1 May 2015; pp. 1652–1660. [Google Scholar]
  15. More, S.S.; Pathak, G.; Panchal, S.; Patil, M. RFID-Based Railway Crowd Prediction and Revenue Analysis. In Data Intelligence and Cognitive Informatics; Springer: Singapore, 2021; pp. 97–109. [Google Scholar]
  16. Zou, H.; Jiang, H.; Luo, Y.; Zhu, J.; Lu, X.; Xie, L. Bluedetect: An ibeacon-enabled scheme for accurate and energy-efficient indoor-outdoor detection and seamless location-based service. Sensors 2016, 16, 268. [Google Scholar] [CrossRef] [PubMed] [Green Version]
  17. Thati, R.P.; Dhadwal, A.S.; Kumar, P. A novel multi-modal depression detection approach based on mobile crowd sensing and task-based mechanisms. Multimed. Tools Appl. 2022, 1–34. [Google Scholar] [CrossRef] [PubMed]
  18. Sikdar, A.; Zheng, Y.F.; Xuan, D. An iterative clustering algorithm for classification of object motion direction using infrared sensor array. In Proceedings of the 2015 IEEE International Conference on Technologies for Practical Robot Applications (TePRA), Woburn, MA, USA, 11–12 May 2015; pp. 1–6. [Google Scholar]
  19. Choi, J.W.; Quan, X.; Cho, S.H. Bi-Directional Passing People Counting System Based on IR-UWB Radar Sensors. IEEE Internet Things J. 2018, 5, 512–522. [Google Scholar] [CrossRef]
  20. Li, C.; Tanghe, E.; Fontaine, J.; Martens, L.; Romme, J.; Singh, G.; De Poorter, E.; Joseph, W. Multi-Static UWB Radar-based Passive Human Tracking Using COTS Devices. IEEE Antennas Wirel. Propag. Lett. 2022, 21, 695–699. [Google Scholar] [CrossRef]
  21. Beltran, A.; Erickson, V.L.; Cerpa, A.E. Thermosense: Occupancy thermal based sensing for hvac control. In Proceedings of the 5th ACM Workshop on Embedded Systems For Energy-Efficient Buildings, Roma, Italy, 11–15 November 2013; pp. 1–8. [Google Scholar]
  22. Mehmood, U.; Moser, I.; Jayaraman, P.P.; Banerjee, A. Occupancy Estimation using WiFi: A Case Study for Counting Passengers on Busses. In Proceedings of the 2019 IEEE 5th World Forum on Internet of Things (WF-IoT), Limerick, Ireland, 15–18 April 2019; pp. 165–170. [Google Scholar]
  23. Zou, H.; Zhou, Y.; Yang, J.; Gu, W.; Xie, L.; Spanos, C. Freecount: Device-free crowd counting with commodity wifi. In Proceedings of the GLOBECOM 2017—2017 IEEE Global Communications Conference, Singapore, 4–8 December 2017; pp. 1–6. [Google Scholar]
  24. Guo, X.; Liu, B.; Shi, C.; Liu, H.; Chen, Y.; Chuah, M.C. WiFi-enabled smart human dynamics monitoring. In Proceedings of the 15th ACM Conference on Embedded Network Sensor Systems, Delft, The Netherlands, 6–8 November 2017; pp. 1–13. [Google Scholar]
  25. Depatla, S.; Mostofi, Y. Crowd Counting Through Walls Using WiFi. In Proceedings of the 2018 IEEE International Conference on Pervasive Computing and Communications (PerCom), Athens, Greece, 19–23 March 2018; pp. 1–10. [Google Scholar]
  26. Yang, Y.; Cao, J.; Liu, X.; Liu, X. Wi-Count: Passing People Counting with COTS WiFi Devices. In Proceedings of the 2018 27th International Conference on Computer Communication and Networks (ICCCN), Hangzhou, China, 30 July–2 August 2018; pp. 1–9. [Google Scholar]
  27. Wang, W.; Liu, A.X.; Shahzad, M.; Ling, K.; Lu, S. Understanding and modeling of wifi signal based human activity recognition. In Proceedings of the 21st Annual International Conference on Mobile Computing and Networking, Paris, France, 7–11 September 2015; pp. 65–76. [Google Scholar]
  28. Guo, S. Electrodynamics, 3rd ed.; China Higher Education Press: Beijing, China, 1997. [Google Scholar]
  29. Xi, W.; Zhao, J.; Li, X.; Zhao, K.; Tang, S.; Liu, X.; Jiang, Z. Electronic frog eye: Counting crowd using WiFi. In Proceedings of the IEEE INFOCOM 2014—IEEE Conference on Computer Communications, Toronto, ON, Canada, 27 April–2 May 2014; pp. 361–369. [Google Scholar]
  30. Palipana, S.; Rojas, D.; Agrawal, P.; Pesch, D. FallDeFi: Ubiquitous fall detection using commodity Wi-Fi devices. Proc. ACM Interact. Mob. Wearable Ubiquitous Technol. 2018, 1, 155. [Google Scholar] [CrossRef]
  31. Shlens, J. A Tutorial on Principal Component Analysis. Int. J. Remote Sens. 2014, 51, 1–12. [Google Scholar]
  32. Lv, J.; Yang, W.; Man, D. Device-Free Passive Identity Identification via WiFi Signals. Sensors 2017, 17, 2520. [Google Scholar] [CrossRef] [PubMed] [Green Version]
  33. Halperin, D.; Hu, W.; Sheth, A.; Wetherall, D. Predictable 802.11 packet delivery from wireless channel measurements. ACM SIGCOMM Comput. Commun. Rev. 2011, 41, 159–170. [Google Scholar]
  34. He, Z. The Fundamental Theory of Wavelet Transform; Wiley: Hoboken, NJ, USA, 2016; pp. 21–44. [Google Scholar] [CrossRef]
  35. Erol, B.; Amin, M.G. Fall motion detection using combined range and Doppler features. In Proceedings of the 2016 24th European Signal Processing Conference (EUSIPCO), Budapest, Hungary, 29 August–2 September 2016; pp. 2075–2080. [Google Scholar]
  36. Erol, B.; Amin, M.; Ahmad, F.; Boashash, B. Radar fall detectors: A comparison. In Proceedings of the Radar Sensor Technology XX, Baltimore, MD, USA, 17–21 April 2016. [Google Scholar]
  37. Jiang, Z.; Luan, T.H.; Ren, X.; Lv, D.; Hao, H.; Wang, J.; Zhao, K.; Xi, W.; Xu, Y.; Li, R. Eliminating the Barriers: Demystifying Wi-Fi Baseband Design and Introducing the PicoScenes Wi-Fi Sensing Platform. IEEE Internet Things J. 2021, 9, 4476–4496. [Google Scholar] [CrossRef]
  38. Brena, R.F.; Escudero, E.; Vargas-Rosales, C.; Galvan-Tejada, C.E.; Munoz, D. Device-free crowd counting using multi-link Wi-Fi CSI descriptors in doppler spectrum. Electronics 2021, 10, 315. [Google Scholar] [CrossRef]
  39. Choi, H.; Matsui, T.; Fujimoto, M.; Yasumoto, K. Simultaneous crowd counting and localization by WiFi CSI. In Proceedings of the International Conference on Distributed Computing and Networking 2021, Nara Japan, 5–8 January 2021; pp. 239–240. [Google Scholar]
  40. Liu, S.; Zhao, Y.; Xue, F.; Chen, B.; Chen, X. DeepCount: Crowd counting with WiFi via deep learning. arXiv 2019, arXiv:1903.05316. [Google Scholar]
  41. Doong, S.H. Spectral human flow counting with RSSI in wireless sensor networks. In Proceedings of the 2016 International Conference on Distributed Computing in Sensor Systems (DCOSS), Washington, DC, USA, 26–28 May 2016; pp. 110–112. [Google Scholar]
Figure 1. CSI measurements of one sub-carrier.
Applsci 12 07321 g001
Figure 2. The work flow.
Applsci 12 07321 g002
Figure 3. CSI segmentation of one sub-carrier.
Applsci 12 07321 g003
Figure 4. Sub-carrier decorrelation and PC selection.
Applsci 12 07321 g004
Figure 5. De-noising the PCs of 4 persons (a 4-level db3 wavelet).
Applsci 12 07321 g005
Figure 6. AOA and TVS value under different passenger numbers.
Applsci 12 07321 g006
Figure 7. Comparison of spectrograms for different numbers of passengers.
Applsci 12 07321 g007
Figure 8. Comparison of the variation of PEM in two scenes. (a) In the elevator. (b) In the room.
Applsci 12 07321 g008
Figure 9. Performance comparison of different classifiers.
Applsci 12 07321 g009
Figure 10. Precision comparison of different features.
Applsci 12 07321 g010
Figure 11. CDF of the estimation error of different features.
Applsci 12 07321 g011
Figure 12. Comparision of the variation of features in two scenes.
Applsci 12 07321 g012
Figure 13. Precision and estimation error comparison.
Applsci 12 07321 g013
Figure 14. Estimation error in different scenes.
Applsci 12 07321 g014
Figure 15. Performance comparison of different antenna heights.
Applsci 12 07321 g015
Figure 16. Passenger flow rate statistics in different periods.
Applsci 12 07321 g016
Figure 17. Comparison with different methods.
Applsci 12 07321 g017
Table 1. Benchmark of indexes for state-of-the-art WiFi-based crowd counting.
Ref.EnvironmentsStandardsClassifierAccuracy RateMax # of People
 [25]indoor, outdoorD-link WBR-1310 and WLAN card P e 2 > 90 % 20
 [22]busESP8266 battery pack and SD card reader67–88%17
 [23]indoorTPLINK N750SVM-TKL>67–99%7
 [24]indoorIntel 5300 NICsSemi-supervised Learning>90%15
 [38]indoorIntel 5300 NICsSVM-Gaussian>99%8
 [39]indoorESP32 modulesRF77–82%5
 [40]indoorIntel 5300 NICs and mini R1CDeep Learning>82%5
 [41]indoorHBE-ZigbexRF>77%5
ECCelevatorAtheros 9300 NICsRF P e 2 95 % 15
Table 2. System overhead of the main steps.
ProcedureProcessing Time (s)
CSI Segmentation0.29
Stream Selection0.62
Noise Filtering0.45
Feature Extraction1.73
Passenger Counting0.38
Total overhead3.47
Publisher’s Note: MDPI stays neutral with regard to jurisdictional claims in published maps and institutional affiliations.

