Article

An Automated Three-Dimensional Bone Pose Tracking Method Using Clinical Interleaved Biplane Fluoroscopy Systems: Application to the Knee

1
Department of Electrical Engineering, Fu Jen Catholic University, New Taipei City 242062, Taiwan
2
Department of Biomedical Engineering, National Taiwan University, Taipei 100233, Taiwan
3
Department of Orthopaedic Surgery, College of Medicine, National Taiwan University, Taipei 100233, Taiwan
4
Department of Physical Therapy, China Medical University, Taichung 406040, Taiwan
5
Department of Orthopaedic Surgery, China Medical University Hospital, Taichung 404332, Taiwan
*
Authors to whom correspondence should be addressed.
Appl. Sci. 2020, 10(23), 8426; https://doi.org/10.3390/app10238426
Submission received: 29 October 2020 / Revised: 24 November 2020 / Accepted: 24 November 2020 / Published: 26 November 2020
(This article belongs to the Special Issue Skeletal Biomechanics)

Abstract

:

Featured Application

A new fully automated model-based interleaved biplane image tracking scheme in conjunction with clinical asynchronous biplane fluoroscopy was proposed and evaluated for its performance on dynamic tibiofemoral kinematics measurements. The approach may encourage the further use of clinical imaging systems for the noninvasive and precise examination of three-dimensional, dynamic joint functions in clinical practice and extend the application of model-based tracking techniques for orthopedic biomechanical investigations in a budge-efficient way.

Abstract

Model-based tracking of the movement of the tibiofemoral joint via a biplane X-ray imaging system has been commonly used to reproduce its accurate, three-dimensional kinematics. To accommodate the approaches to existing clinical asynchronous biplane fluoroscopy systems and achieve comparable accuracy, this study proposed an automated model-based interleaved biplane fluoroscopy image tracking scheme (MIBFT) by incorporating information of adjacent image frames. The MIBFT was evaluated with a cadaveric study conducted on a knee specimen. The MIBFT reproduced skeletal poses and tibiofemoral kinematics that were in good agreement with the standard reference kinematics provided by an optical motion capture system, in which the root-mean-squared (Rms) errors of the skeletal pose parameters ranged from 0.11 to 0.35 mm in translation and 0.18 to 0.49° in rotation. The influences of rotation speed on the pose errors were below 0.23 mm and 0.26°. The MIBFT-determined bias, precision, and Rms error were comparable to those of the reported model-based tracking techniques using custom-made synchronous biplane fluoroscopy. The results suggested that the further use of the clinical imaging system is feasible for the noninvasive and precise examination of dynamic joint functions and kinematics in clinical practice and biomechanical research.

1. Introduction

Accurate and noninvasive measurement of the three-dimensional (3D) kinematics of human limbs is fundamental for exploring their biomechanical characteristics [1]. With quantified data of rigid-body kinematics and cartilage contact arthrokinematics of the tibiofemoral joint, both subject- and task-specific biomechanics and pathomechanics can be explored further [2,3], leading to a more objective and precise evaluation of functional performance in normally healthy [4,5,6], injured [7], and treated knee joints [8,9]. Direct measurement of skeletal motion has also been increasingly employed for the assessment of other motion capture instruments affected by soft tissue artifacts [10,11,12].
To gain insight into the internal structures of the joint, medical imaging facilities are typically employed to acquire cross-sectional slices or projection images of the target organ. Among these, X-ray fluoroscopy [13], four-dimensional computed tomography (4D CT) [14], and dynamic magnetic resonance (MR) image technologies [15,16] enable the recording of continuous two-dimensional (2D) or 3D images of joint motion at a limited temporal or spatial resolution. The registration of volumetric bone models obtained from high-resolution CT or MR images to a series of continuous images of dynamic joint movement, which is commonly called model-based tracking, can take advantage of the functionalities of different image modalities, yielding continuous six-degree-of-freedom (6-dof) data of skeletal and joint motion. Model-based tracking can be conducted fully based on MR images by registering MR-derived bone models to each frame of a relatively lower-resolution set of dynamic MR image slices [17,18,19] or volumetric images [20]. However, closed-bore MR image scanners restrict subjects from performing limited motions and are also not suitable for patients with metal prostheses.
The application of standard X-ray fluoroscopy or newly developed mobile fluoroscopic imaging systems enable more dynamic kinematic measurements during functional tasks [21,22]. By numerically registering the subject-specific model of the prosthesis or bones to the single-plane fluoroscopic image, model-based tracking routines reproduce 6-dof kinematics of natural knee [23,24] and replacement joints [25,26]. While experimental evaluations showed that the methods enabled the determination of accurate planar translations and rotations, the out-of-plane motion components were found to be substantially less accurate [27,28]. Introducing an additional synchronous X-ray unit yields a framework of stereo X-ray imaging [29], which has been widely demonstrated to be useful for determining 3D tibiofemoral kinematics in submillimeter and subdegree accuracy with biplane 3D to 2D image registration [30,31,32].
Synchronous biplane X-ray imaging of dynamic knee motion is currently achieved by applying custom-made high-speed stereo radiography [33,34] or integrating two C-arm fluoroscopies [35,36], but it is infeasible in clinical biplane X-ray imaging systems [37]. To minimize cross-scatter contamination [38], the clinical imaging system is normally operated with an asynchronous X-ray pulse and acquisition scheme between two X-ray units, generating interleaved biplane fluoroscopic images with a constant temporal offset. The interleaved images have adverse effects on the biplane model-based tracking of the joint motion, however, leading to erroneous skeletal kinematics estimation [39,40]. To address the limitations of the interleaved biplane images, new model-based tracking methods were introduced with strategies related to kinematic interpolation [39,40]. The method termed motion component partition and interpolation (MCPI) [40] was assessed for its accuracy in determining tibiofemoral kinematics in our previous study. While the MCPI improved translation accuracy over single-plane model-based tracking, rotational errors were not significantly improved [40]. Valid kinematic interpolation also relies on precisely registered bone poses in neighboring frames obtained by single-plane image registration [39,40], in which a failed determination of bone poses yields adverse effects on the outcome of kinematic interpolation and therefore the accuracy of subsequent model-based tracking. While precisely adjusting the initial pose of the bone may preclude the issue, minimization of manual intervention is preferable in an automated model-based tracking routine.
To accommodate the interleaved biplane fluoroscopic images obtained from clinical fluoroscopy and eliminate reliance on kinematic interpolation, the present work aimed to develop a new automated model-based tracking scheme for the noninvasive measurement of the 3D kinematics of tibiofemoral motion with an accuracy comparable to those using custom-made synchronous biplane X-ray imaging system. A motion experiment with a knee specimen was performed to evaluate the accuracy of the new model-based tracking method on the determination of 3D bone poses and joint kinematics during dynamic tibiofemoral motions. The influence of the joint rotation speeds on the measurement errors was also quantified.

2. Materials and Methods

2.1. Overview

The dynamic tibiofemoral motions were recorded using a clinical asynchronous biplane fluoroscopy imaging system. The CT data of the same joint were also acquired and used to create volumetric models of the femur and tibia. The 3D pose parameters of the bone in each fluoroscopic frame are determined using the new model-based tracking scheme composed of three major stages, namely (i) 2D/2D template registration; (ii) motion-compensated frame interpolation; (iii) biplane 3D/2D image registration. The registered bone poses for the entire image sequence were then used to compute 3D kinematics of the tibiofemoral joint. A motion experiment using a cadaveric knee joint was performed to evaluate the measurement accuracy of the proposed method. Detailed illustrations of the model-based tracking and motion experiment are provided in the following subsections.

2.2. Asynchronous Biplane Fluoroscopy Imaging

A clinical asynchronous biplane fluoroscopy system was utilized to acquire interleaved biplane 2D fluoroscopic images of the knee in movement from two different perspectives with a 1/2 frame time offset (Figure 1A). Two X-ray units (consisting of an X-ray source and flat-panel detector) positioned orthogonally enabled the acquisition of two perpendicular projections of the knee. Each X-ray unit was represented by an X-ray point source and an image plane, and the overall configuration of the two X-ray units could be virtually reconstructed with known intrinsic and extrinsic parameters. A custom-built calibration box consisting of two parallel acrylic sheets embedded with lead beads at known positions was imaged by fluoroscopy to determine intrinsic parameters, Q j , associated with the j th X-ray units ( j = 1   or   2 ) [41]. Each image plane was attached with a coordinate system, F x y z j , with the x j and y j axes parallel to the image plane and the z j axis normal to the image plane (Figure 1C). Transformation (or extrinsic parameters) between the F x y z j of the two X-ray units was determined following an established procedure [42] using another custom-built calibration object [40]. A global coordinate system G X Y Z was also defined to coincide with the F x y z j of the 1st X-ray unit.

2.3. CT-Based Bone Model

The knee joint was CT scanned to acquire the volumetric image of the CT radiodensities of the knee. Regions of the femur and tibia were segmented using a region-growing method [43]. A volumetric bone model was created by extracting a subvolume from CT images containing the segmented region of the bone of interest. The Hounsfield unit values of the voxels belonging to the region of the bones were transformed to attenuation coefficients [44], while other voxel values were directly set to zero (≈ attenuation coefficient of air). Surface bone models were constructed with a marching cubes algorithm [45] and segmented bone regions. Anatomical frames were then created using an automatic determination method [46].

2.4. Model-Based Interleaved Biplane Fluoroscopy Image Tracking

The new model-based tracking scheme for automated determination of 3D bone poses, termed model-based interleaved biplane fluoroscopy image tracking (MIBFT), was accomplished in three stages: (1) 2D/2D template registration, (2) frame interpolation, and (3) biplane 3D/2D image registration. The 6-dof of the bone at frame k is expressed by a transformation matrix T ( P k ) , parameterized by pose parameters P k = { T X , T Y , T Z , θ X , θ Y , θ Z } T . The three translation components T X , T Y , T Z and rotation components θ X , θ Y , θ Z are represented with respect to G X Y Z .

2.4.1. Two-Dimensional/2D Template Registration

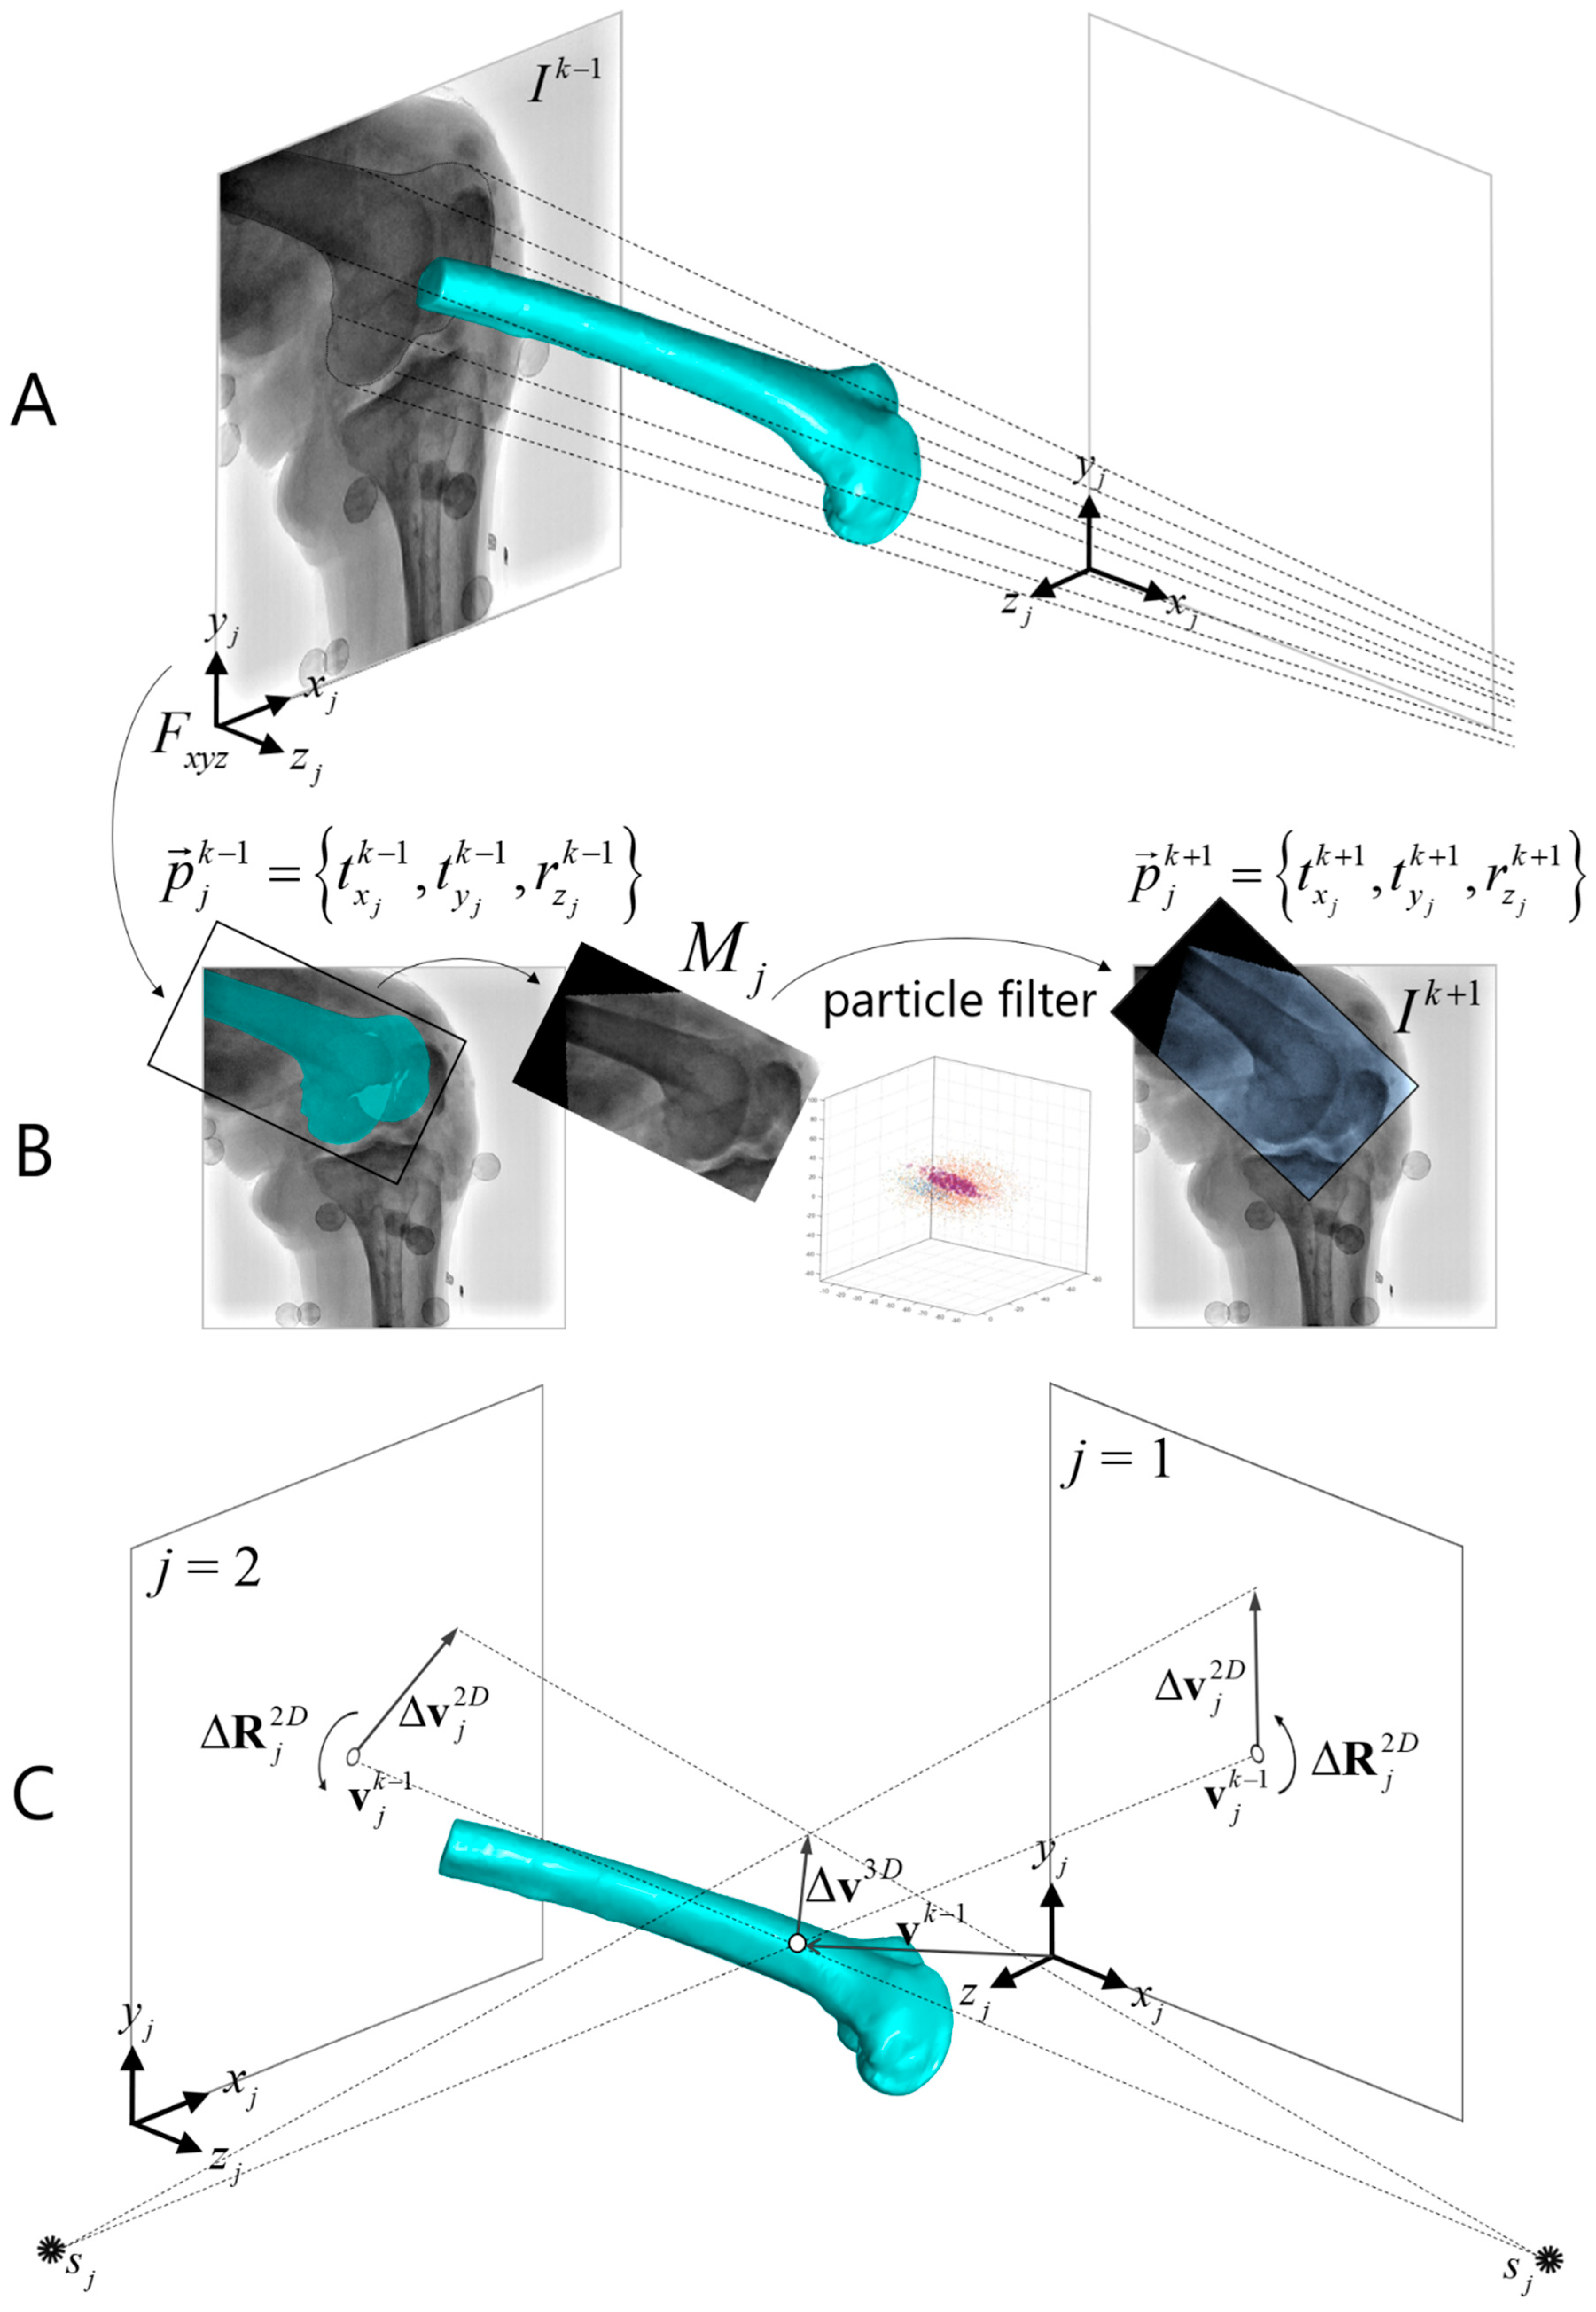
A 2D/2D template registration procedure was devised to provide an initial estimation of the transformation of the bone model for each image frame, T t r e g = T ( R t r e g k , v t r e g k ) , consisting of a rotation matrix R t r e g k ( θ X , θ Y , θ Z ) and a 3D position vector v t r e g k ( T X , T Y , T Z ) . For the first image frame being analyzed, I k , a 2D template of the bone of interest, M j ,   j   =   1   or   2 , was initialized by extracting a bounding image region for the bone from the preceding image frame I k 1 (Figure 2B). The border of the template was determined by the outermost projection boundary of the registered surface bone model (Figure 2A). The template M j was allowed to approximately match the succeeding image frame I k + 1 by adjusting its in-plane positions and rotation p j = { t x j , t y j , r z j } T , as I k 1 and I k + 1 were both acquired from the j th X-ray unit (Figure 2B).
A sampling importance resampling particle filter [47] was employed to perform template matching and motion tracking (number of particles = 3000), in which the state variables of particle i at frame k 1 involved the planar pose parameters of the template on the 2D image plane and their first derivatives S j , i k 1 = { p j , i k 1 , p ˙ j , i k 1 } . The particle state evolved from time steps of I k 1 to I k + 1 via a linear kinetic model, which yielded a set of S j , i k + 1 = { p j , i k + 1 , p ˙ j , i k + 1 } . Evolved particles were then resampled [47] in accordance with the normalized weight of the particles, which led to discarding particles with smaller weight. The weight of particle i , ω i , was defined by the probability density function value of a normal distribution function, evaluated using the mean absolute difference between M j and I k + 1 :
ω i = N ( e i | μ , σ ) ,
e i = 1 | M j | q M j | D ( M j ( q ) ,   p j , i k + 1 ) I k + 1 ( q ) | ,
where |   | denotes the number of pixels, and D represents the function that displaces template M j given a template pose p j , i k + 1 . The final template 2D pose p j k + 1 = { t x j k + 1 , t y j k + 1 , r z j k + 1 } was estimated by averaging the poses p j , i k + 1 of the resampled particles. After template registration, the bone template was updated by linearly interpolating the intensity values from I k + 1 at the grid points of the template.
Increments in in-plane rotation Δ R j 2 D and translation Δ v j 2 D of the template (Figure 2C) between preceding and current frames ( I k 1 I k ) were approximated by halving the motion increments from preceding to succeeding frames ( I k 1 I k + 1 ) and were expressed in G X Y Z following the equations:
Δ v j 2 D = R G X Y Z F x y z j [ 1 2 ( t x j k + 1 t x j k 1 ) , 1 2 ( t y j k + 1 t y j k 1 ) , 0 ] T ,
Δ R j 2 D = R G X Y Z F x y z j R ( ϕ ) ,
ϕ = 1 2 ( r z j k + 1 r z j k 1 ) ,
where R G X Y Z F x y z j describes the rotation between coordinate systems G X Y Z and F x y z j . The above procedure was also carried out between I k 2 and I k , which approximated the in-plane rotation and translation increments from the other X-ray view. Given Δ R j 2 D and Δ V j 2 D from the two X-ray views and the registered pose in the preceding frame T ( R k 1 , v k 1 ) , R t r e g k and v t r e g k were estimated by:
R t r e g k = ( j Δ R j 2 D ) R k 1 ,
v t r e g k = v k 1 + Δ v 3 D ,
where the 3D incremental translation Δ v 3 D is determined by minimizing the differences between its 2D projections and Δ v j 2 D on the two X-ray views and is defined as:
Δ V 3 D = arg min Δ V 3 D   j | ( ( ( z j × Δ v 3 D ) × z j ) | v j k 1 s j | | v k 1 s j | ) Δ v j 2 D | 2 ,
where s j is the position of the X-ray source of the j th X-ray unit, v j k 1 is the position of the perspective projection of v k 1 onto the j th image plane, and z j is the unit normal to the j th image plane (Figure 2C). The Levenberg–Marquardt nonlinear least-squares method was used to solve for (8) [48].

2.4.2. Frame Interpolation

To convert the interleaved biplane images into a synchronous image pair, the missing image at time point I k was replenished by the intermediate image between I k 1 and I k + 1 , which was created using a motion compensated frame interpolation (MCFI) method [49] (Figure 1B). In the MCFI, for each 8 × 8 image block within the intermediate image, a bidirectional motion vector was estimated by minimizing the sum of differences between the enlarged 12 × 12 image blocks in I k 1 and I k + 1 in the direction of that motion vector (Figure 1B). After the estimation of the motion vectors, the pixel intensities of the intermediate image were computed using an overlapped block-motion compensation method [50]. The originally acquired fluoroscopic image I k together with the interpolated image, J k , from the other X-ray view thus formed a configuration of biplane fluoroscopic imaging (Figure 1C). It should be noted that the frame interpolation was only conducted on a rectangular region, defined by the union of successive templates, to minimize computations on image regions irrelevant to the target bone (Figure 1C).

2.4.3. Biplane 3D/2D Image Registration

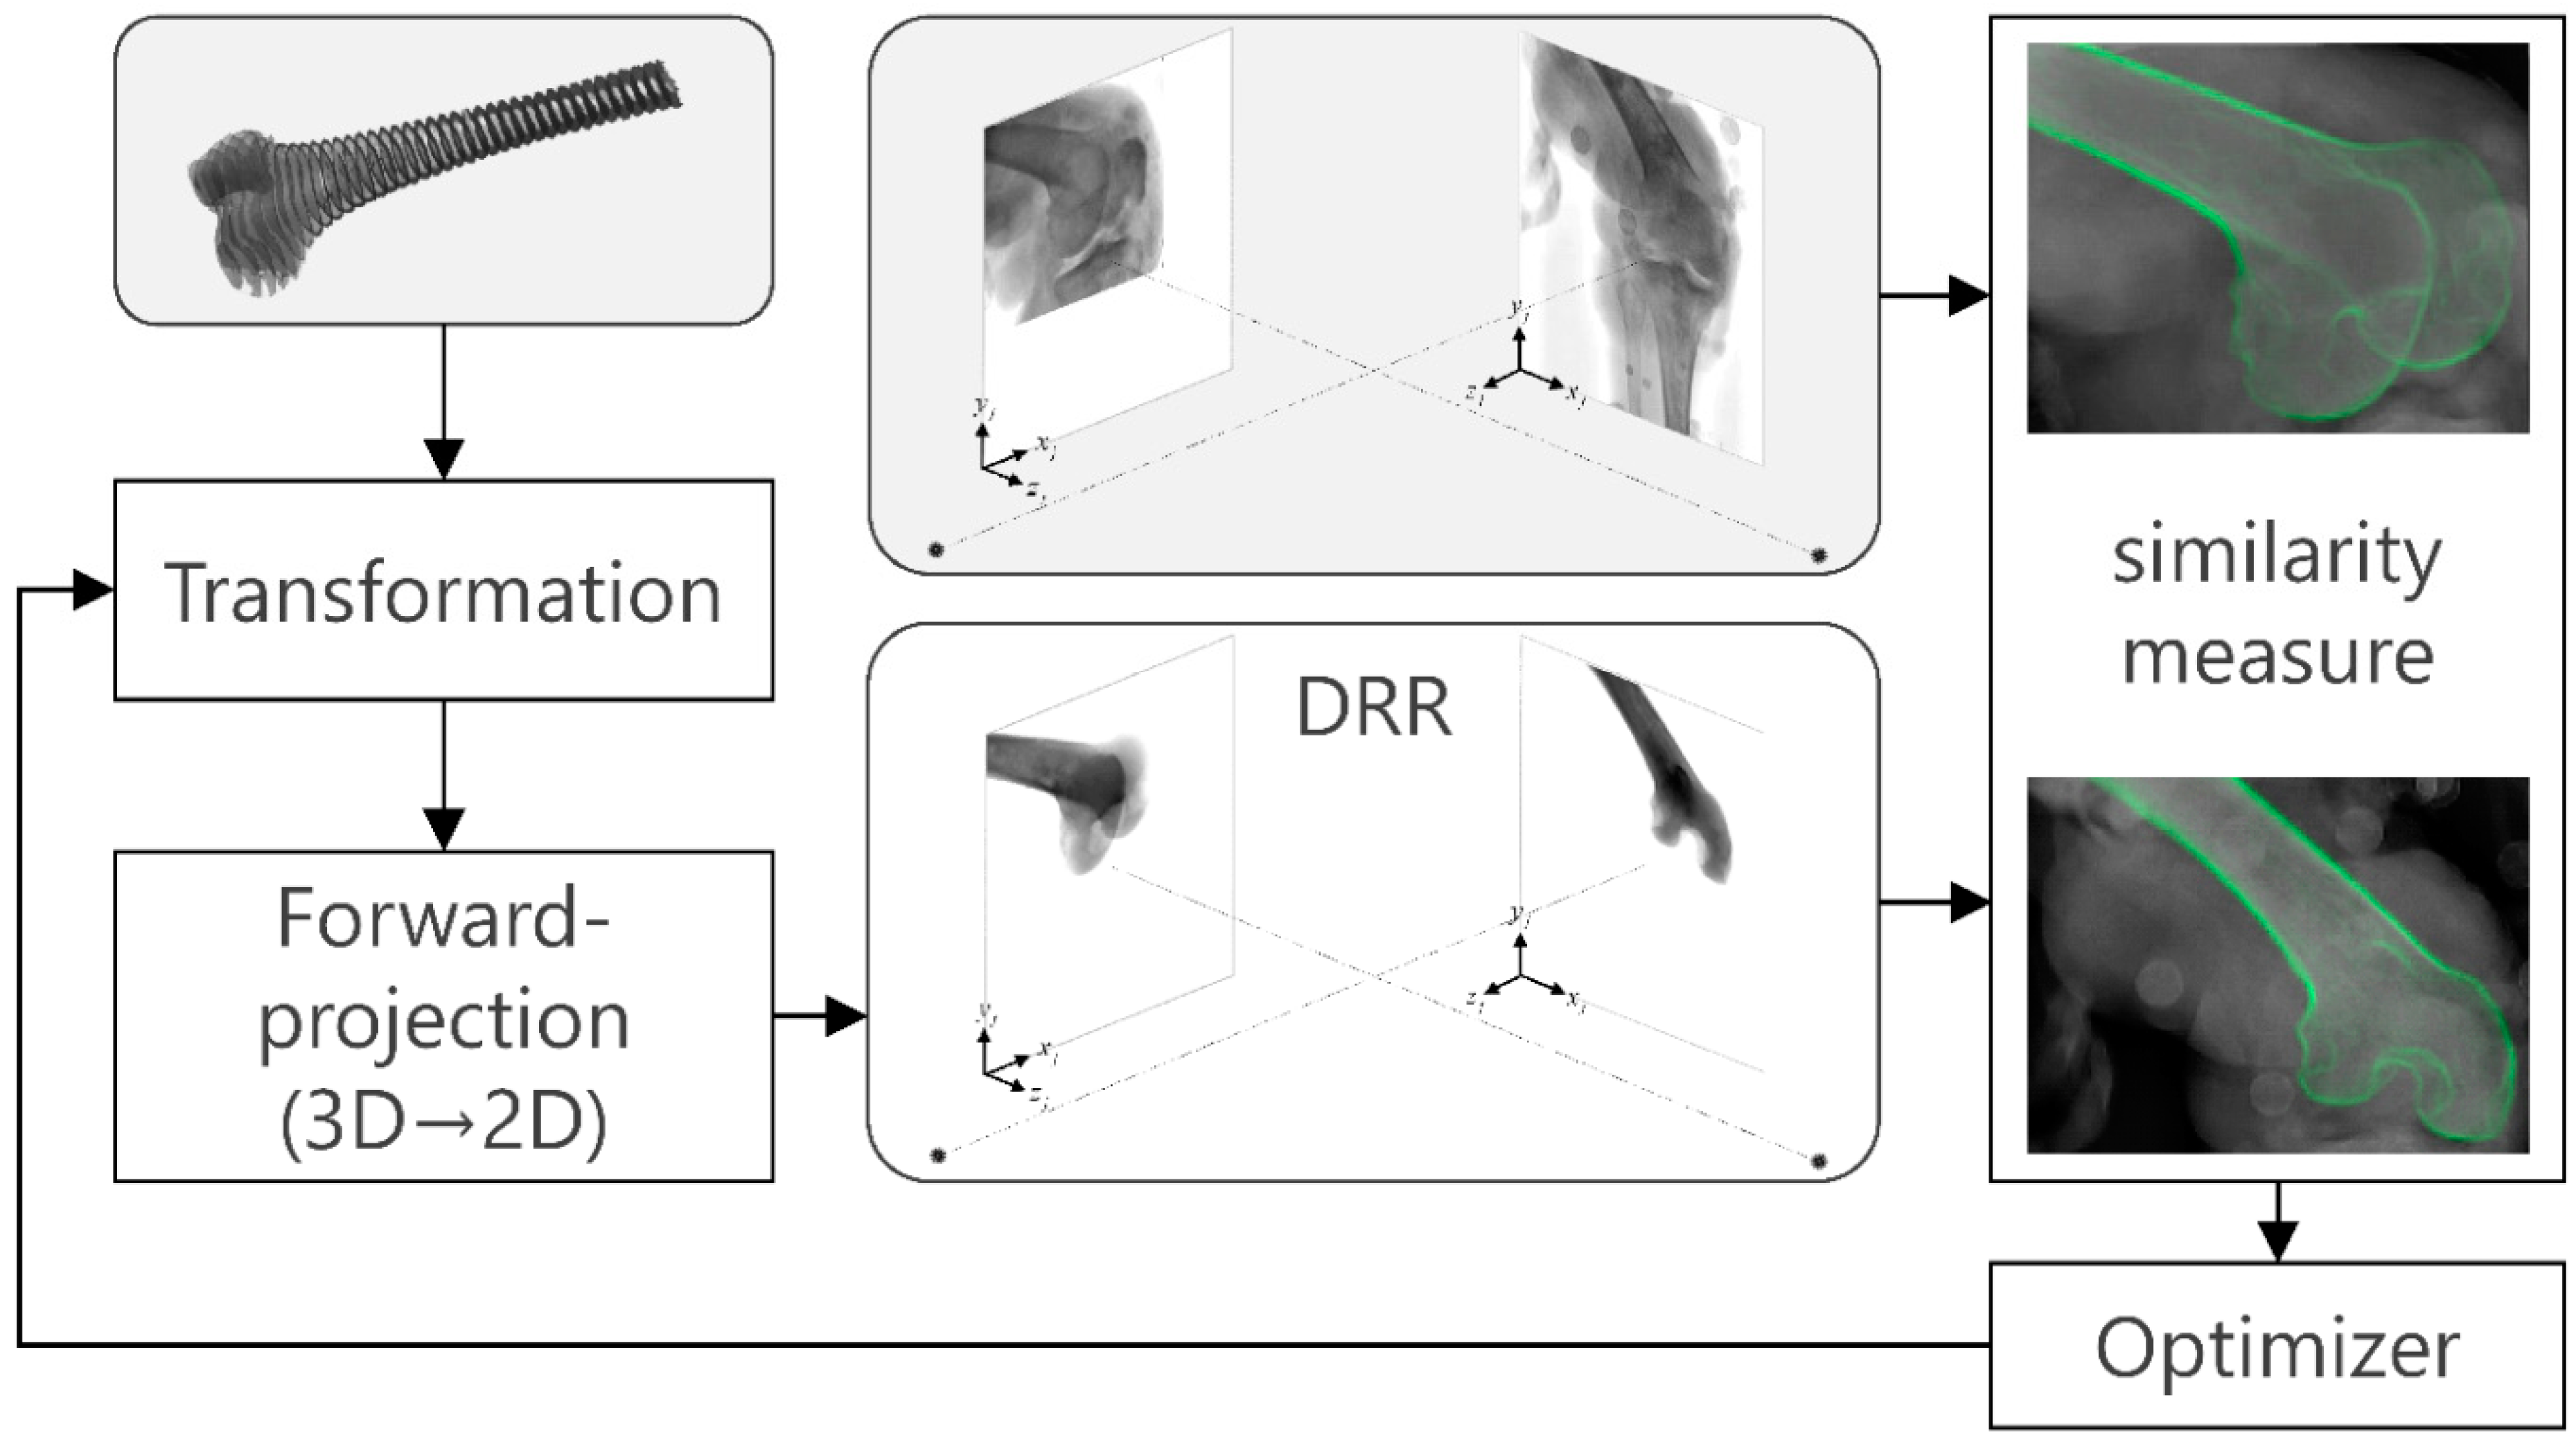
A 3D/2D image registration procedure based on the forward projection model and biplane fluoroscopic images was implemented to precisely determine the pose parameters of the bones (Figure 3). A forward projection model P [51] constructed with ray-tracing with trilinear interpolation [52] was utilized to quickly generate a digitally reconstructed radiography image (DRR, D j ) given the pose parameters T ( P ) , the volumetric bone model V , and calibrated intrinsic parameters Q j (Equation (10)) (Figure 3). A set of pose increments Δ P k = { Δ T X , Δ T Y , Δ T Z , Δ θ X , Δ θ Y , Δ θ Z } T from the template-registered pose T t r e g was determined by minimizing the weighted sum of criterion functions CF using a vectorized genetic algorithm (GA) [53], followed by the Nelder–Mead Simplex method [54]:
Δ P k = arg min Δ P k   ω I CF ( D j = 1   or   2 , I k ) + ω J CF ( D j = 2   or   1 , J k )   ,
D j = P ( T ( P k ) , V , Q j ) ,
T ( P k ) = T ( Δ P k ) T t r e g ,
where CF is set to be the “gradient difference” similarity measure between the digitally reconstructed radiographs and the fluoroscopic images (Figure 3). The weighting factors ω I and ω J were set to be 1.0 and 0.8, respectively, as determined in a preliminary evaluation. The number of populations in GA was set to 50, as this was the largest number of DRRs that could be generated in parallel in our current implementation. The maximum number of generations in GA was empirically set to 60, because a larger number of generations did not improve the pose estimation accuracy in our preliminary evaluation. All procedures of the MIBFT, including template registration, frame interpolation, and 3D/2D image registration, were implemented using MATLAB (MATLAB 2018b, MathWorks Inc., Natick, MA, USA).

2.5. In Vitro Motion Experiment

This study was approved by China Medical University and Hospital Research Ethics Committee (No: DMR101-IRB1-139). The knee specimen used in the current in vitro experiment was obtained from a male donor who received a below-hip amputation for disorders other than the knee joint and had provided written informed consent. Access to information identifying the donor was not provided to the authors.
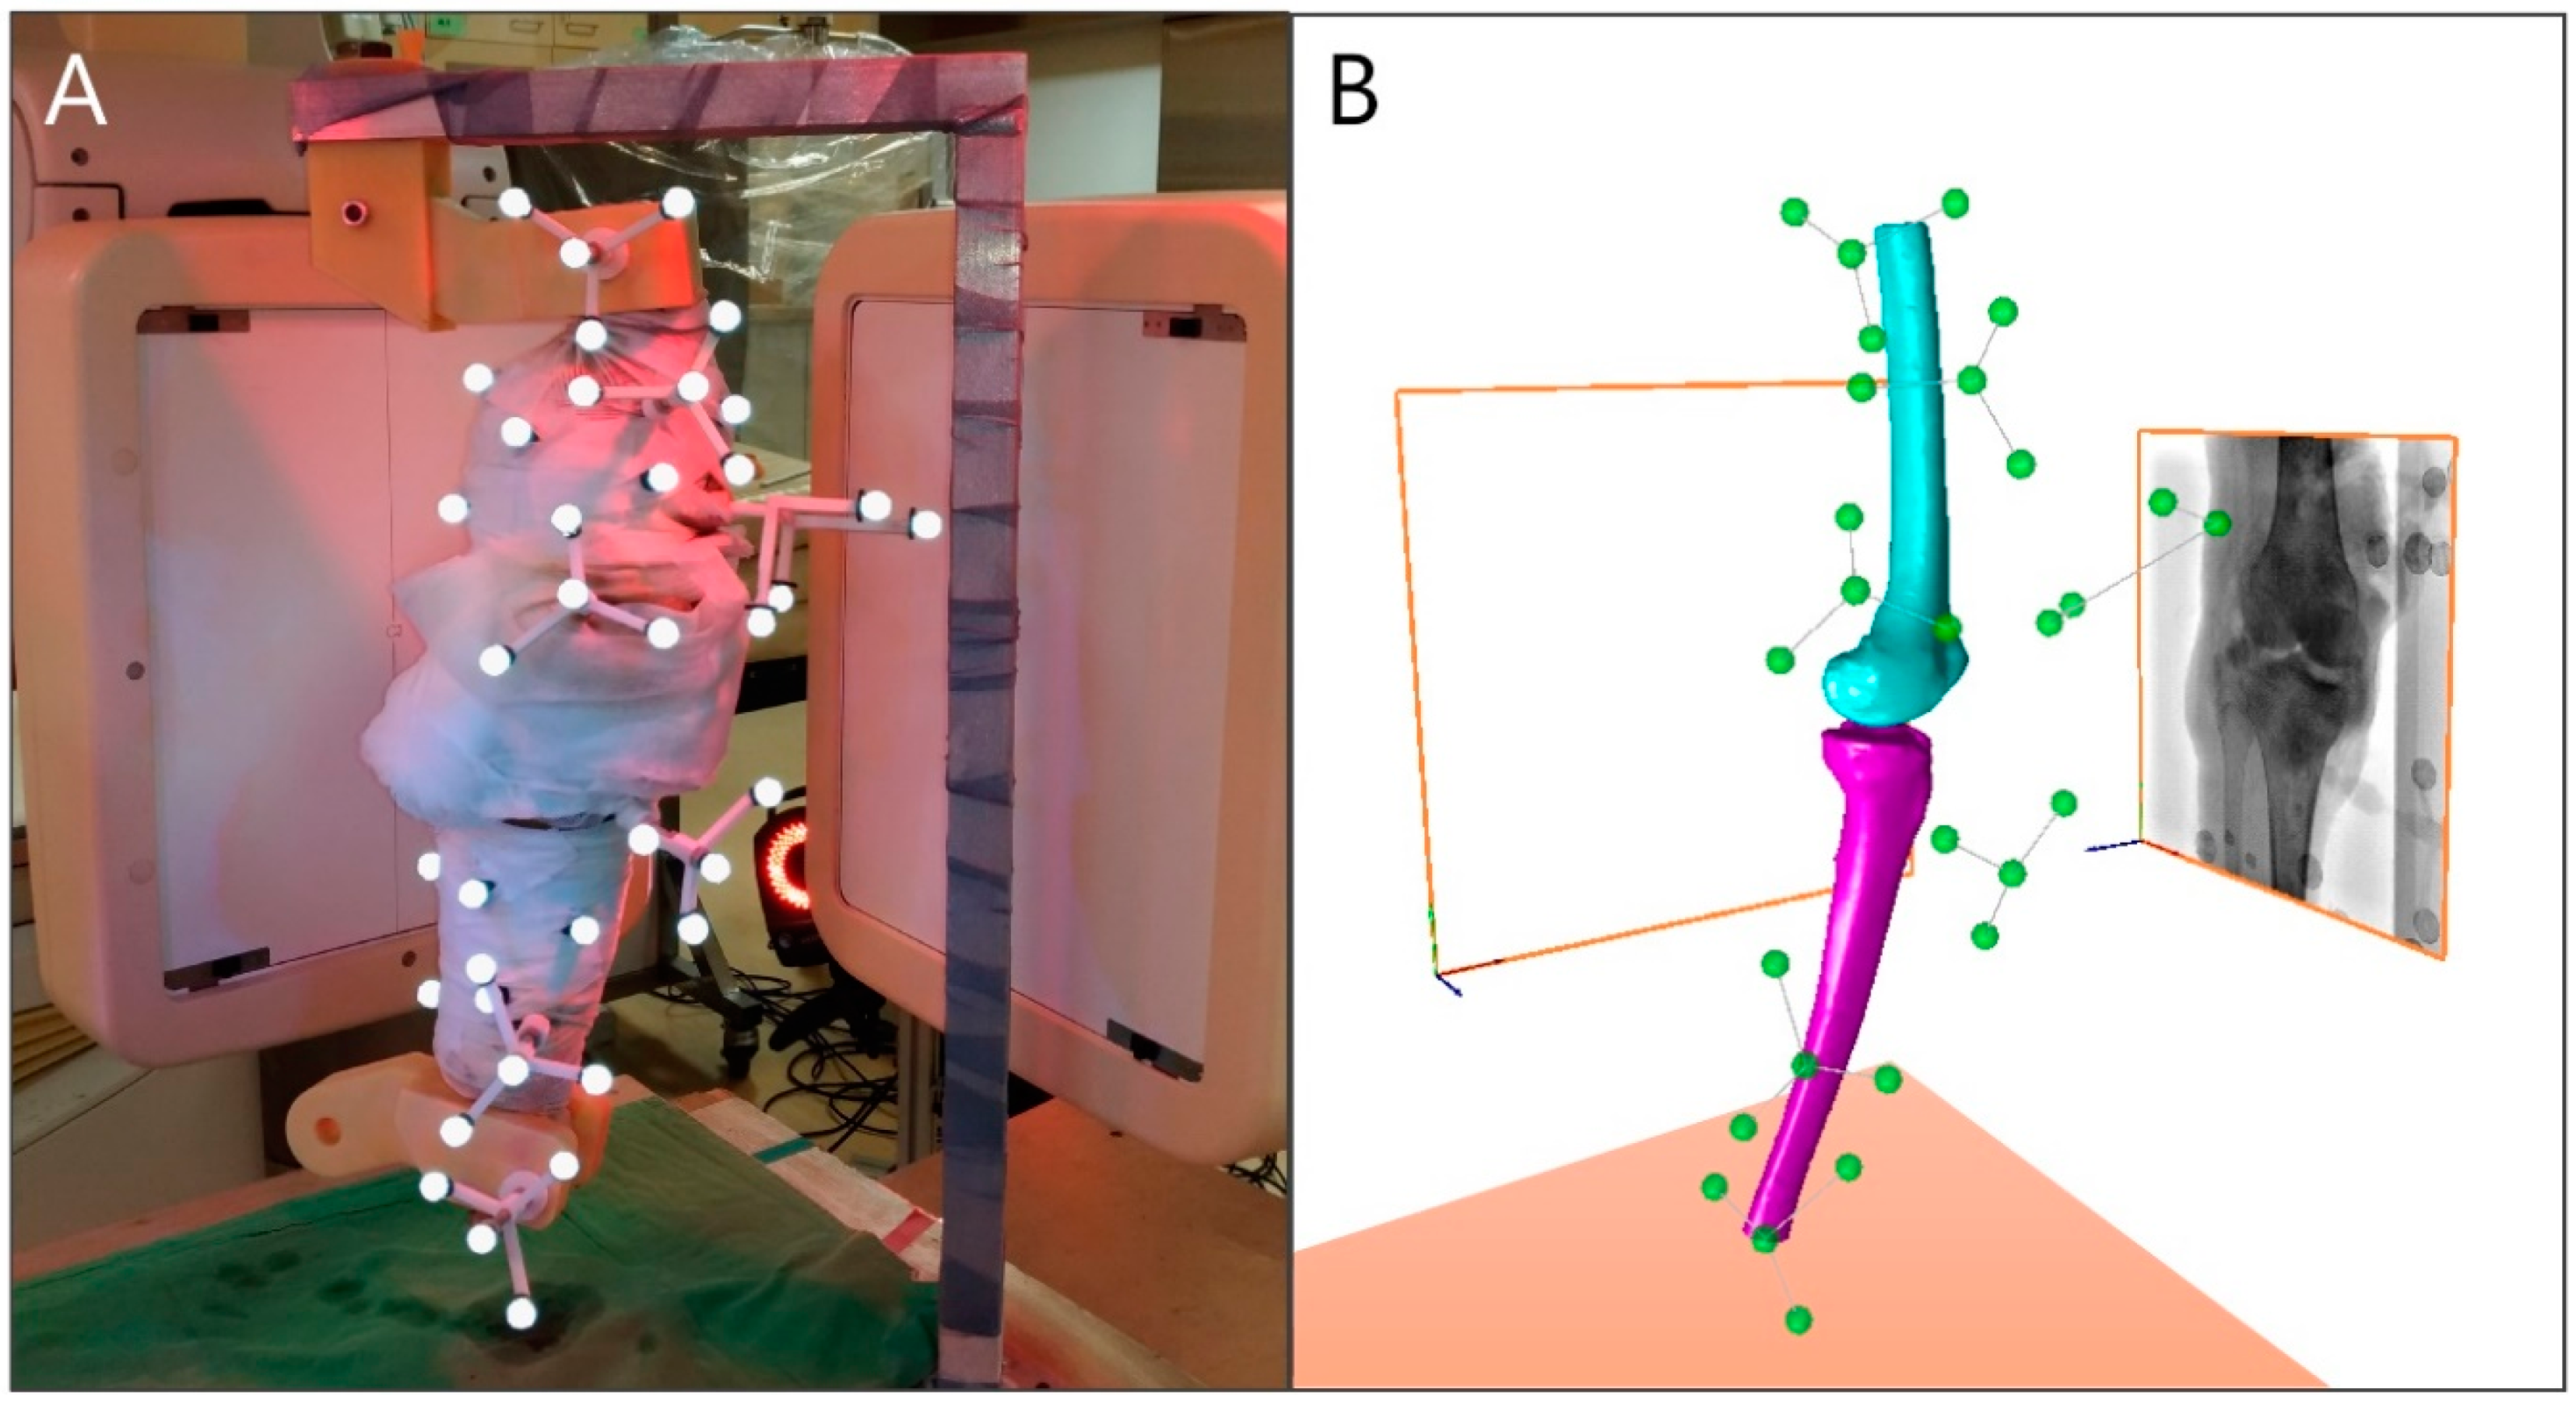
To evaluate the performance of the proposed MIBFT in measuring tibiofemoral kinematics with interleaved biplane fluoroscopy, we conducted a simulated knee-motion experiment on the knee specimen described as follows. Lengths of the femur and tibia of the fresh-frozen knee specimen were approximately 260 and 290 mm, respectively. A plastic connector was affixed onto the proximal end of the femur and distal end of the tibia with bone cement (Figure 4A). Four marker clusters, each attached with four infrared retroreflective markers with a 7 mm radius, were rigidly implanted into the femur and its connector. Three other clusters were implanted into the tibia and its connector. The knee specimen with the clusters and connectors was scanned using a clinical CT scanner (Optima CT660, GE Healthcare, Chicago, IL, USA) to acquire CT images of the whole construct (peak voltage = 120 kVp, tube current = 180 mA, pixel size = 0.709 mm × 0.709 mm, slice thickness = 0.625 mm, matrix size = 512 × 512 × 945).
A clinical biplane fluoroscopy system (Allura Xper FD20/20, Philips Medical Systems, Amsterdam, The Netherlands) was configured with source-to-detector distances of 1195 and 1050 mm for the two X-ray units and was operated with tube voltages ranging from 50 to 59 kVp, a tube current of 5 mA and a frame rate of 30 frames/s per X-ray unit, which allowed us to obtain 512 × 512 8-bit interleaved fluoroscopic images at an effective frame rate of 60 frames/s. Prior to fluoroscopic image acquisition, the specimen was mounted on a custom-made motion testing frame through the connector. While the femoral connector was rigidly mounted to the frame, the femur was kept immobile, and the tibia was allowed to manually rotate about the knee by the operator, and vice versa. Following the cadence from a metronome, the operator extended and flexed the knee by moving the end of the freely moving segment at five rotation speeds (0.25 cycle/s, 0.375 cycle/s, 0.5 cycle/s, 0.625 cycle/s, and 0.75 cycle/s), during which the interleaved biplane fluoroscopic images were acquired. These examinations were termed femoral and tibial isolated flexion/extension (FE). The connector was then detached from the frame, and the specimen was manually bent and extended by the operator to acquire fluoroscopic images of the tibiofemoral FE at four prescribed speeds (0.375 cycle/s, 0.5 cycle/s, 0.625 cycle/s, and 0.75 cycle/s). Overall, three trials per motion speed, each with at least one complete motion cycle, were collected for the femoral isolated FE, tibial isolated FE, and tibiofemoral FE scenarios. During the motion examinations, the 3D trajectories of the markers on the cluster frames were reconstructed using an optical motion capture system (MoCap) with 14 calibrated and synchronized infrared cameras (VICON 612, Oxford Metrics, Oxford, UK).

2.6. Evaluation of the MIBFT

2.6.1. Standard Reference Determination

The reconstructed marker coordinates from the MoCap system were expressed in G X Y Z (Figure 4B) after a spatial transformation that was obtained by registering G X Y Z to the coordinate system of the MoCap using a reported calibration procedure [55] with a custom-made object. The same set of markers presented on the CT images were also semimanually segmented and reconstructed into polygonal models.
The 3D coordinates of the markers were herein extracted by fitting spheres of corresponding radius to the polygonal models and were expressed in their corresponding anatomical frames. The standard references of the bone pose parameters were determined by coregistering the coordinates of the corresponding markers in the anatomical frame and in G X Y Z in the least-squares sense [56]. The standard reference kinematics of the tibiofemoral joint were determined according to standard reference poses of the femur and tibia, and the tibiofemoral angles were expressed in a commonly used joint coordinate system [57]. The tibiofemoral translations were described as the linear displacement of the midpoint of the epicondyles with respect to the tibial anatomical frame. The rotation speeds of the tibiofemoral motions were also derived using the quantified flexion angles at each time instants.

2.6.2. Error Metrics

For each trial in the cadaveric experiment, manual adjustment of the bone pose followed by single-plane 3D/2D image registration [40] was only performed for the first image frame (k = 1). The MIBFT was then executed to determine the bone pose parameters in the following successive image frames (k = 2, 3, …, N). The pose parameters in the first and last image frames were discarded for the error analysis, because they were not included in MIBFT analysis due to the lack of both a preceding and succeeding frame. A 64-bit personal computer with an Intel CPU (Core i7-9700K, 3.6 GHz), an NVIDIA graphics card (GeForce RTX 2080), and 16 GB of RAM were used for all numerical computations.
The bone pose errors were quantified as the deviations of the MIBFT-determined pose parameters from the standard references. The absolute errors at each registration stage and for different tibiofemoral flexion speeds were analyzed. For each trial, the bias (i.e., mean of the errors), precision (i.e., standard deviation (SD) of the errors), and root-mean-squared errors (Rms errors) across all image frames were computed. Descriptive statistics of these error metrics over all trials were obtained. To express the overall positioning error of a bone, a commonly used metric, the mean target registration error (mTRE) [58], was also quantified for each image frame. The agreement between the MIBFT-determined tibiofemoral angles and translations and those obtained from the standard references were quantified by limits-of-agreement (LoA) plots and analysis [59].

3. Results

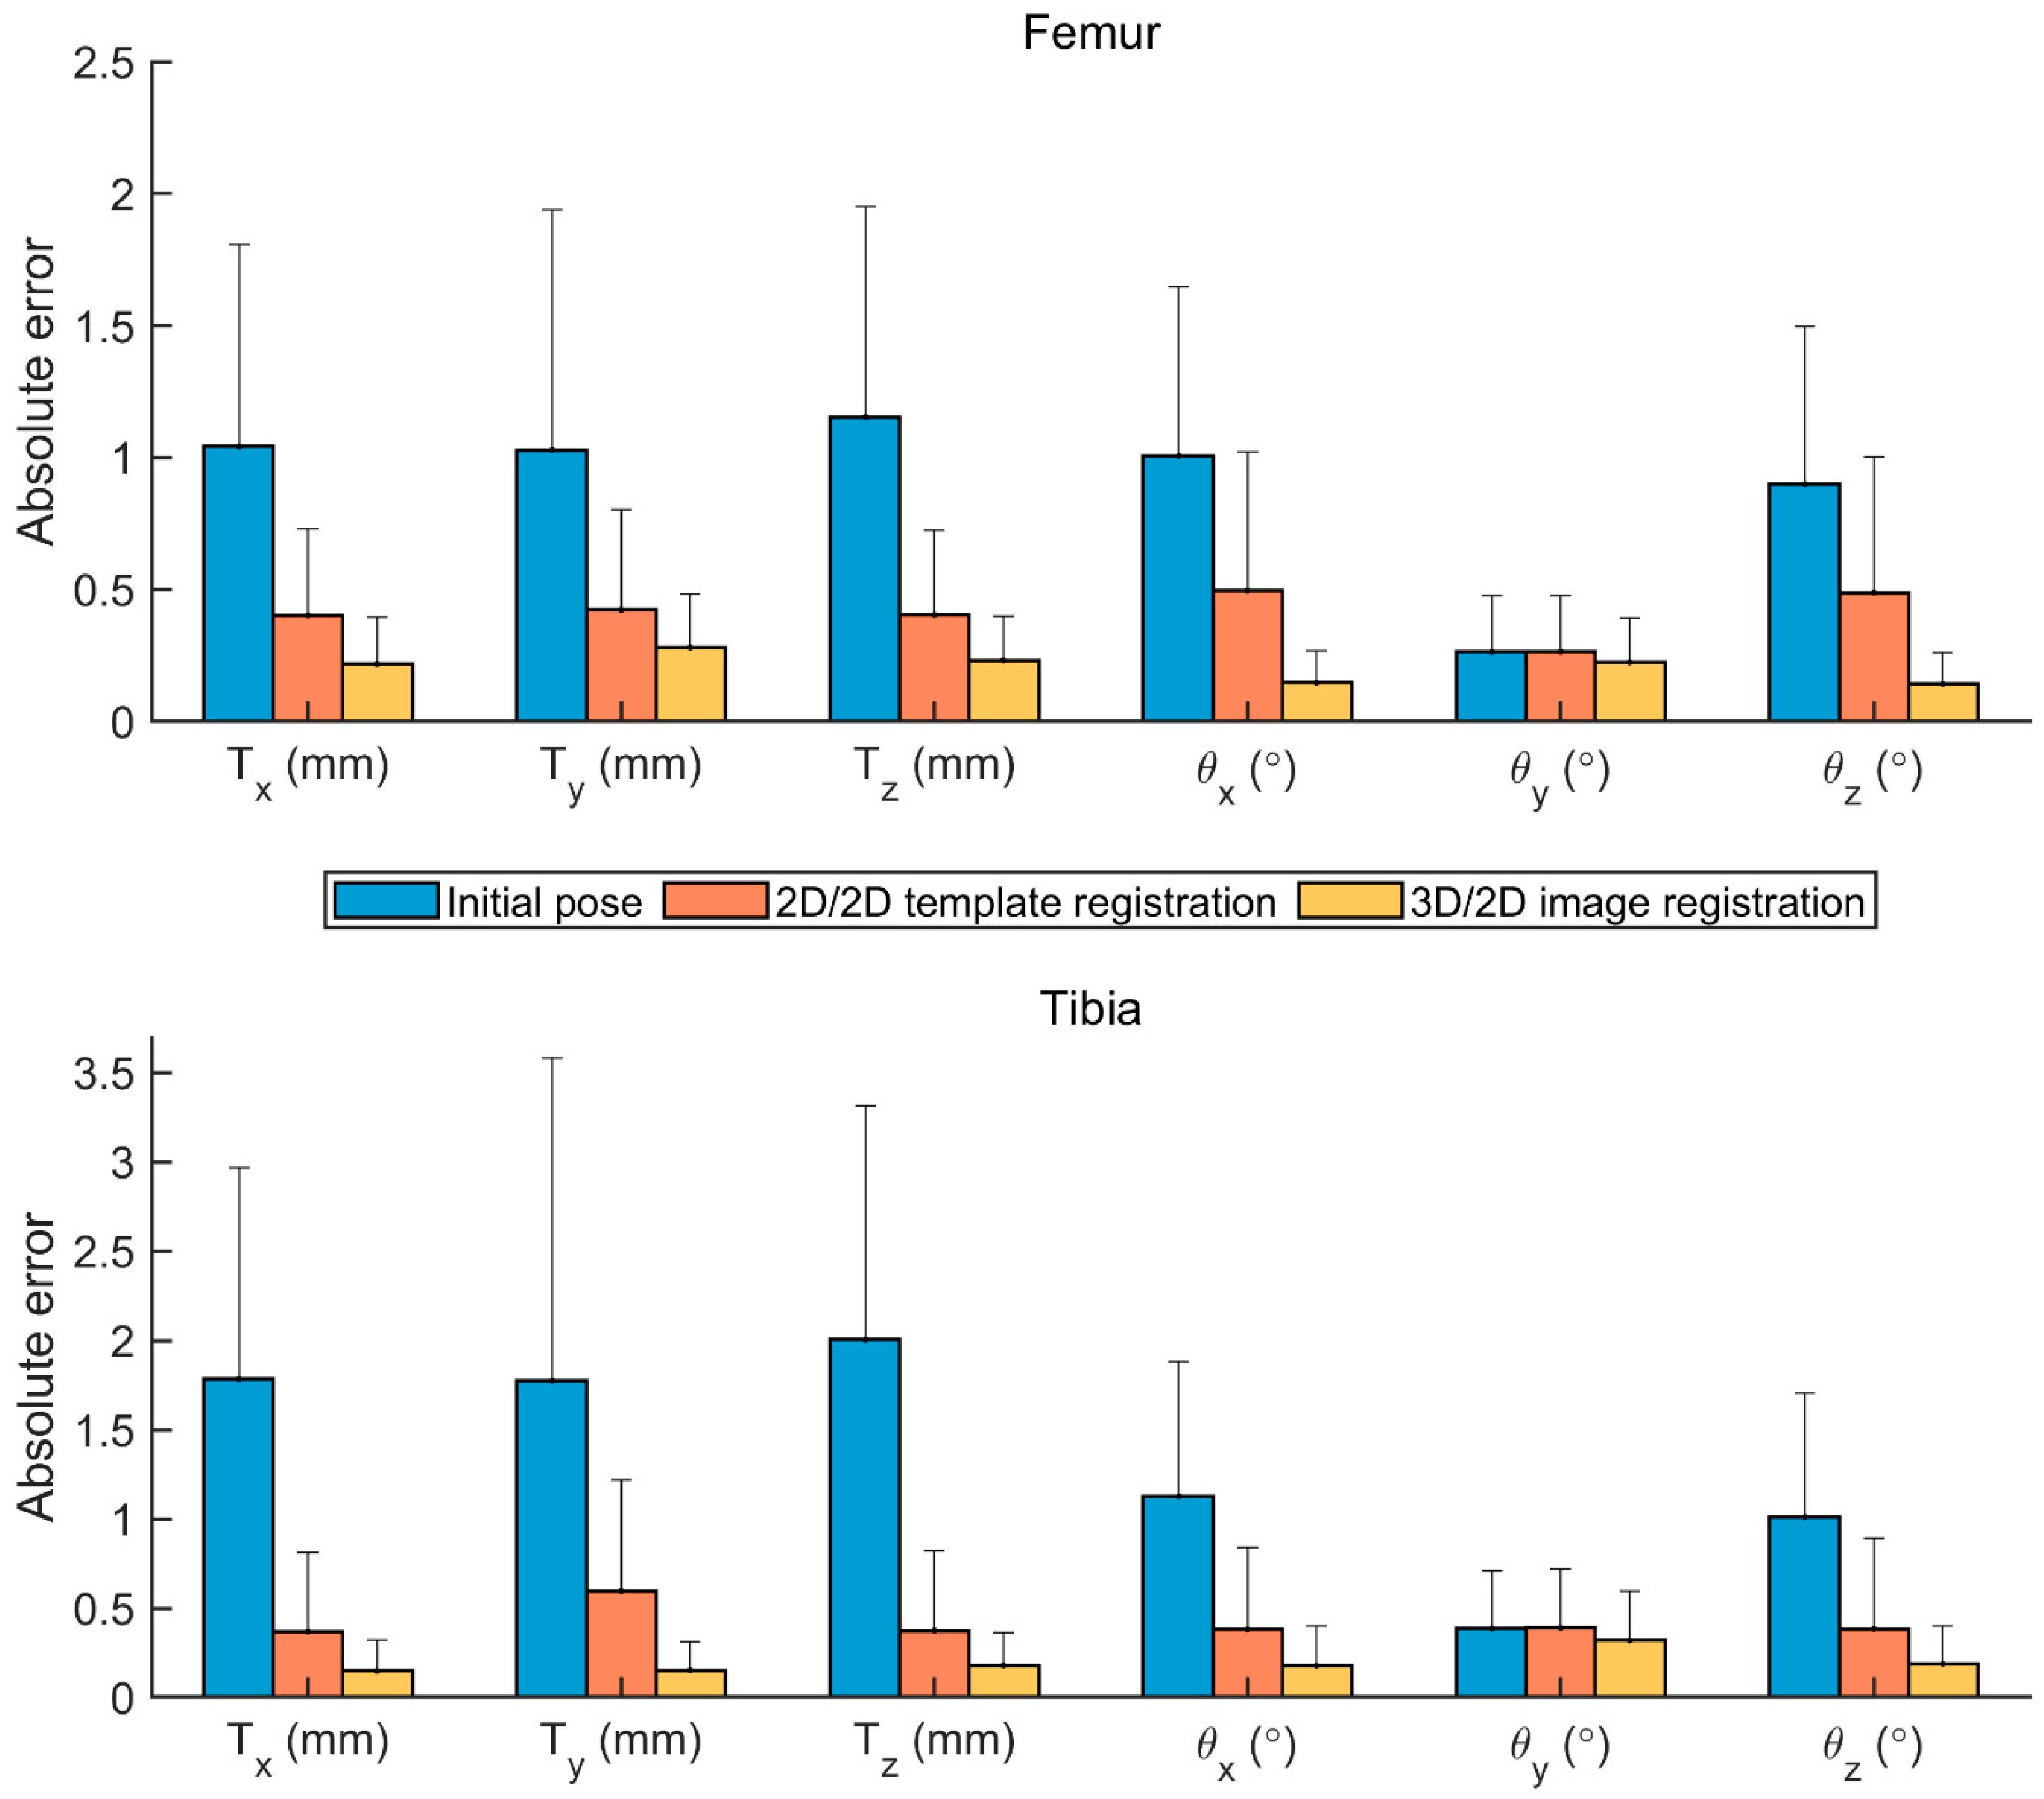
The Rms error of the MIBFT-determined femoral pose parameters ranged from 0.11 to 0.35 mm in translation and 0.18 to 0.47° in rotation (Table 1). The corresponding ranges of Rms error for tibial poses were 0.18 to 0.26 mm in translations and 0.29 to 0.49° in rotation (Table 1). The absolute value of the average bias over all trials was less than 0.27 mm in translation and 0.23° rotation for both the femur and tibia. The corresponding values for the precision were 0.28 mm and 0.46° (Table 1). The errors in the pose parameters were successively reduced throughout the MIBFT process, in which the initial pose parameters taken from the registered pose in the preceding frame gave averaged absolute errors up to 2 mm in translations and 1.1° in rotations that were reduced to 0.6 mm and 0.5°, respectively, after 2D/2D template registration. The ultimate averaged absolute errors were down to 0.3 mm and 0.3° after the 3D/2D image registration (Figure 5).
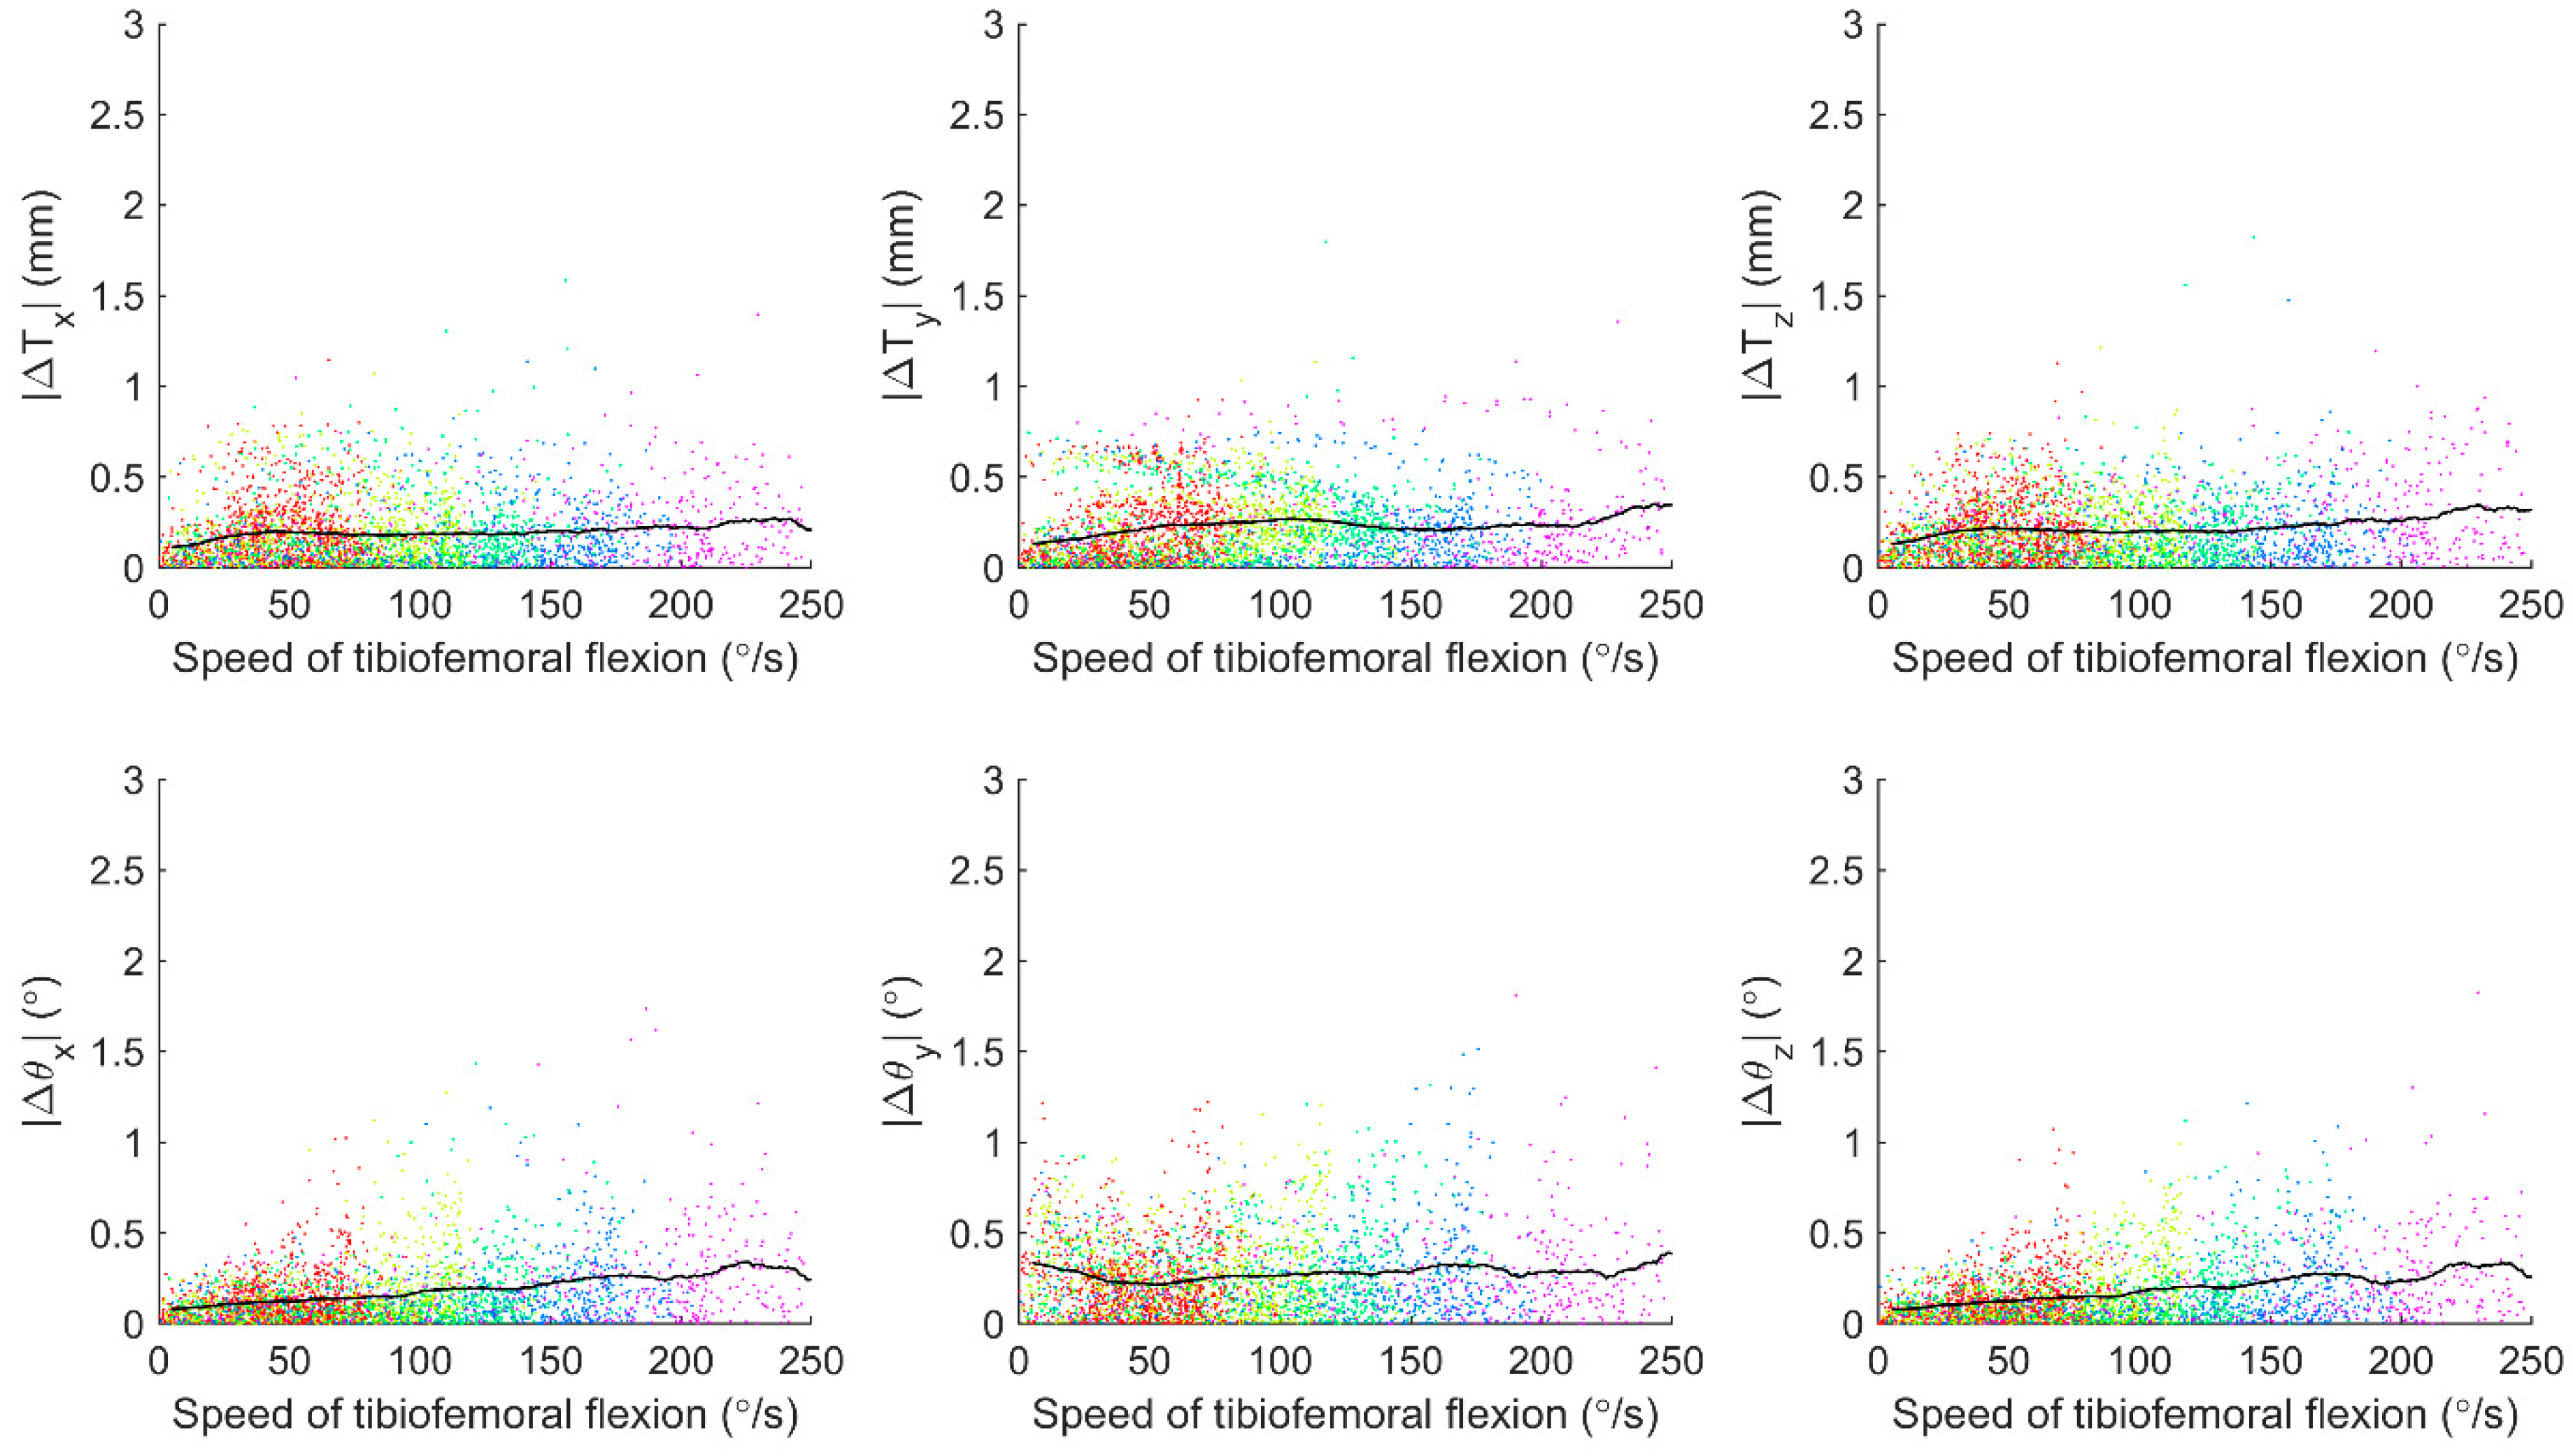
The means (SDs) of the tibiofemoral FE speeds for trials with different rotation speeds were quantified as 42.6 (16.4)°/s, 65.7 (32.0)°/s, 86.7 (40.7)°/s, 121.0 (54.7)°/s, and 154.5 (68.6)°/s for the isolated femoral FE tasks; 51.6 (24.3)°/s, 74.2 (34.7)°/s, 96.9 (44.3)°/s, 122.5 (50.1)°/s, and 158.5 (68.6)°/s for the isolated tibial FE tasks, and 84.6 (41.2)°/s, 101.4 (34.3)°/s, 121.5 (62.8)°/s, and 145.0 (80.7)°/s for the tibiofemoral FE tasks. The influence of rotation speeds on the pose errors is shown in Figure 6, in which the maximum differences of the moving averaged absolute errors across all tested speeds were 0.16, 0.23, and 0.22 mm for the three translational components and 0.26, 0.22, and 0.26° for the rotational components. The moving averaged absolute errors were below 0.36 mm in translation and 0.44° in rotation (Figure 6).
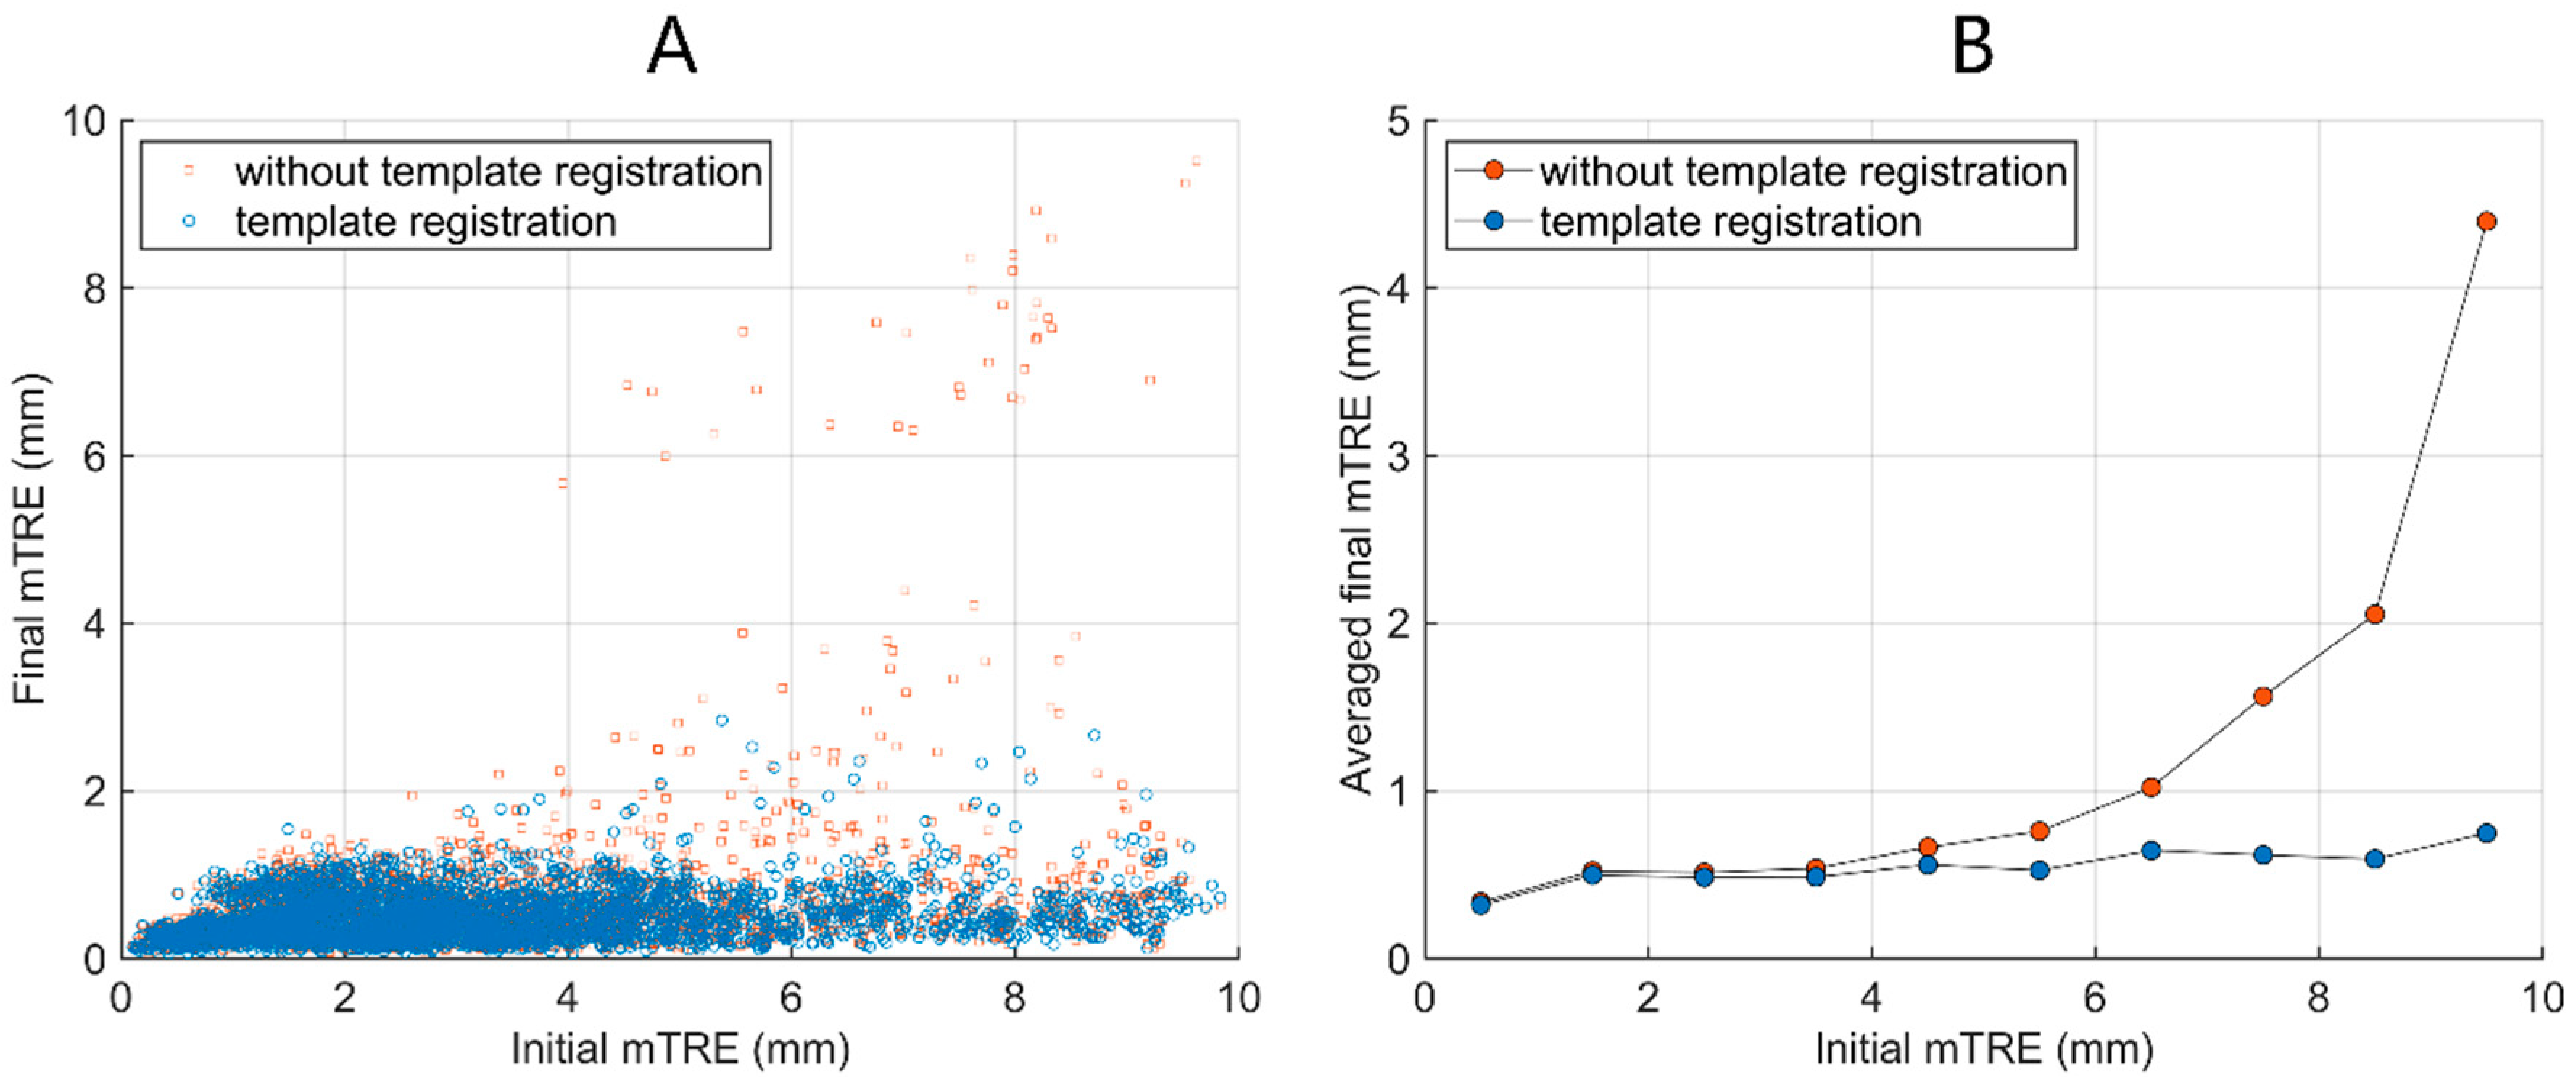
When comparing the mTRE obtained from the proposed method with and without incorporating template registration, a substantial difference was found (Figure 7). With template registration, the MIBFT-determined pose parameters yielded final mTRE values of generally less than 2 mm (Figure 7A). When template registration was not utilized, a proportion of registrations unsuccessfully localized the bone in 3D space, as indicated by instances with final mTRE values larger than 6 mm (Figure 7A). It also led to gradually increased averaged final mTRE values with respect to initial mTRE values, as shown in Figure 7B.
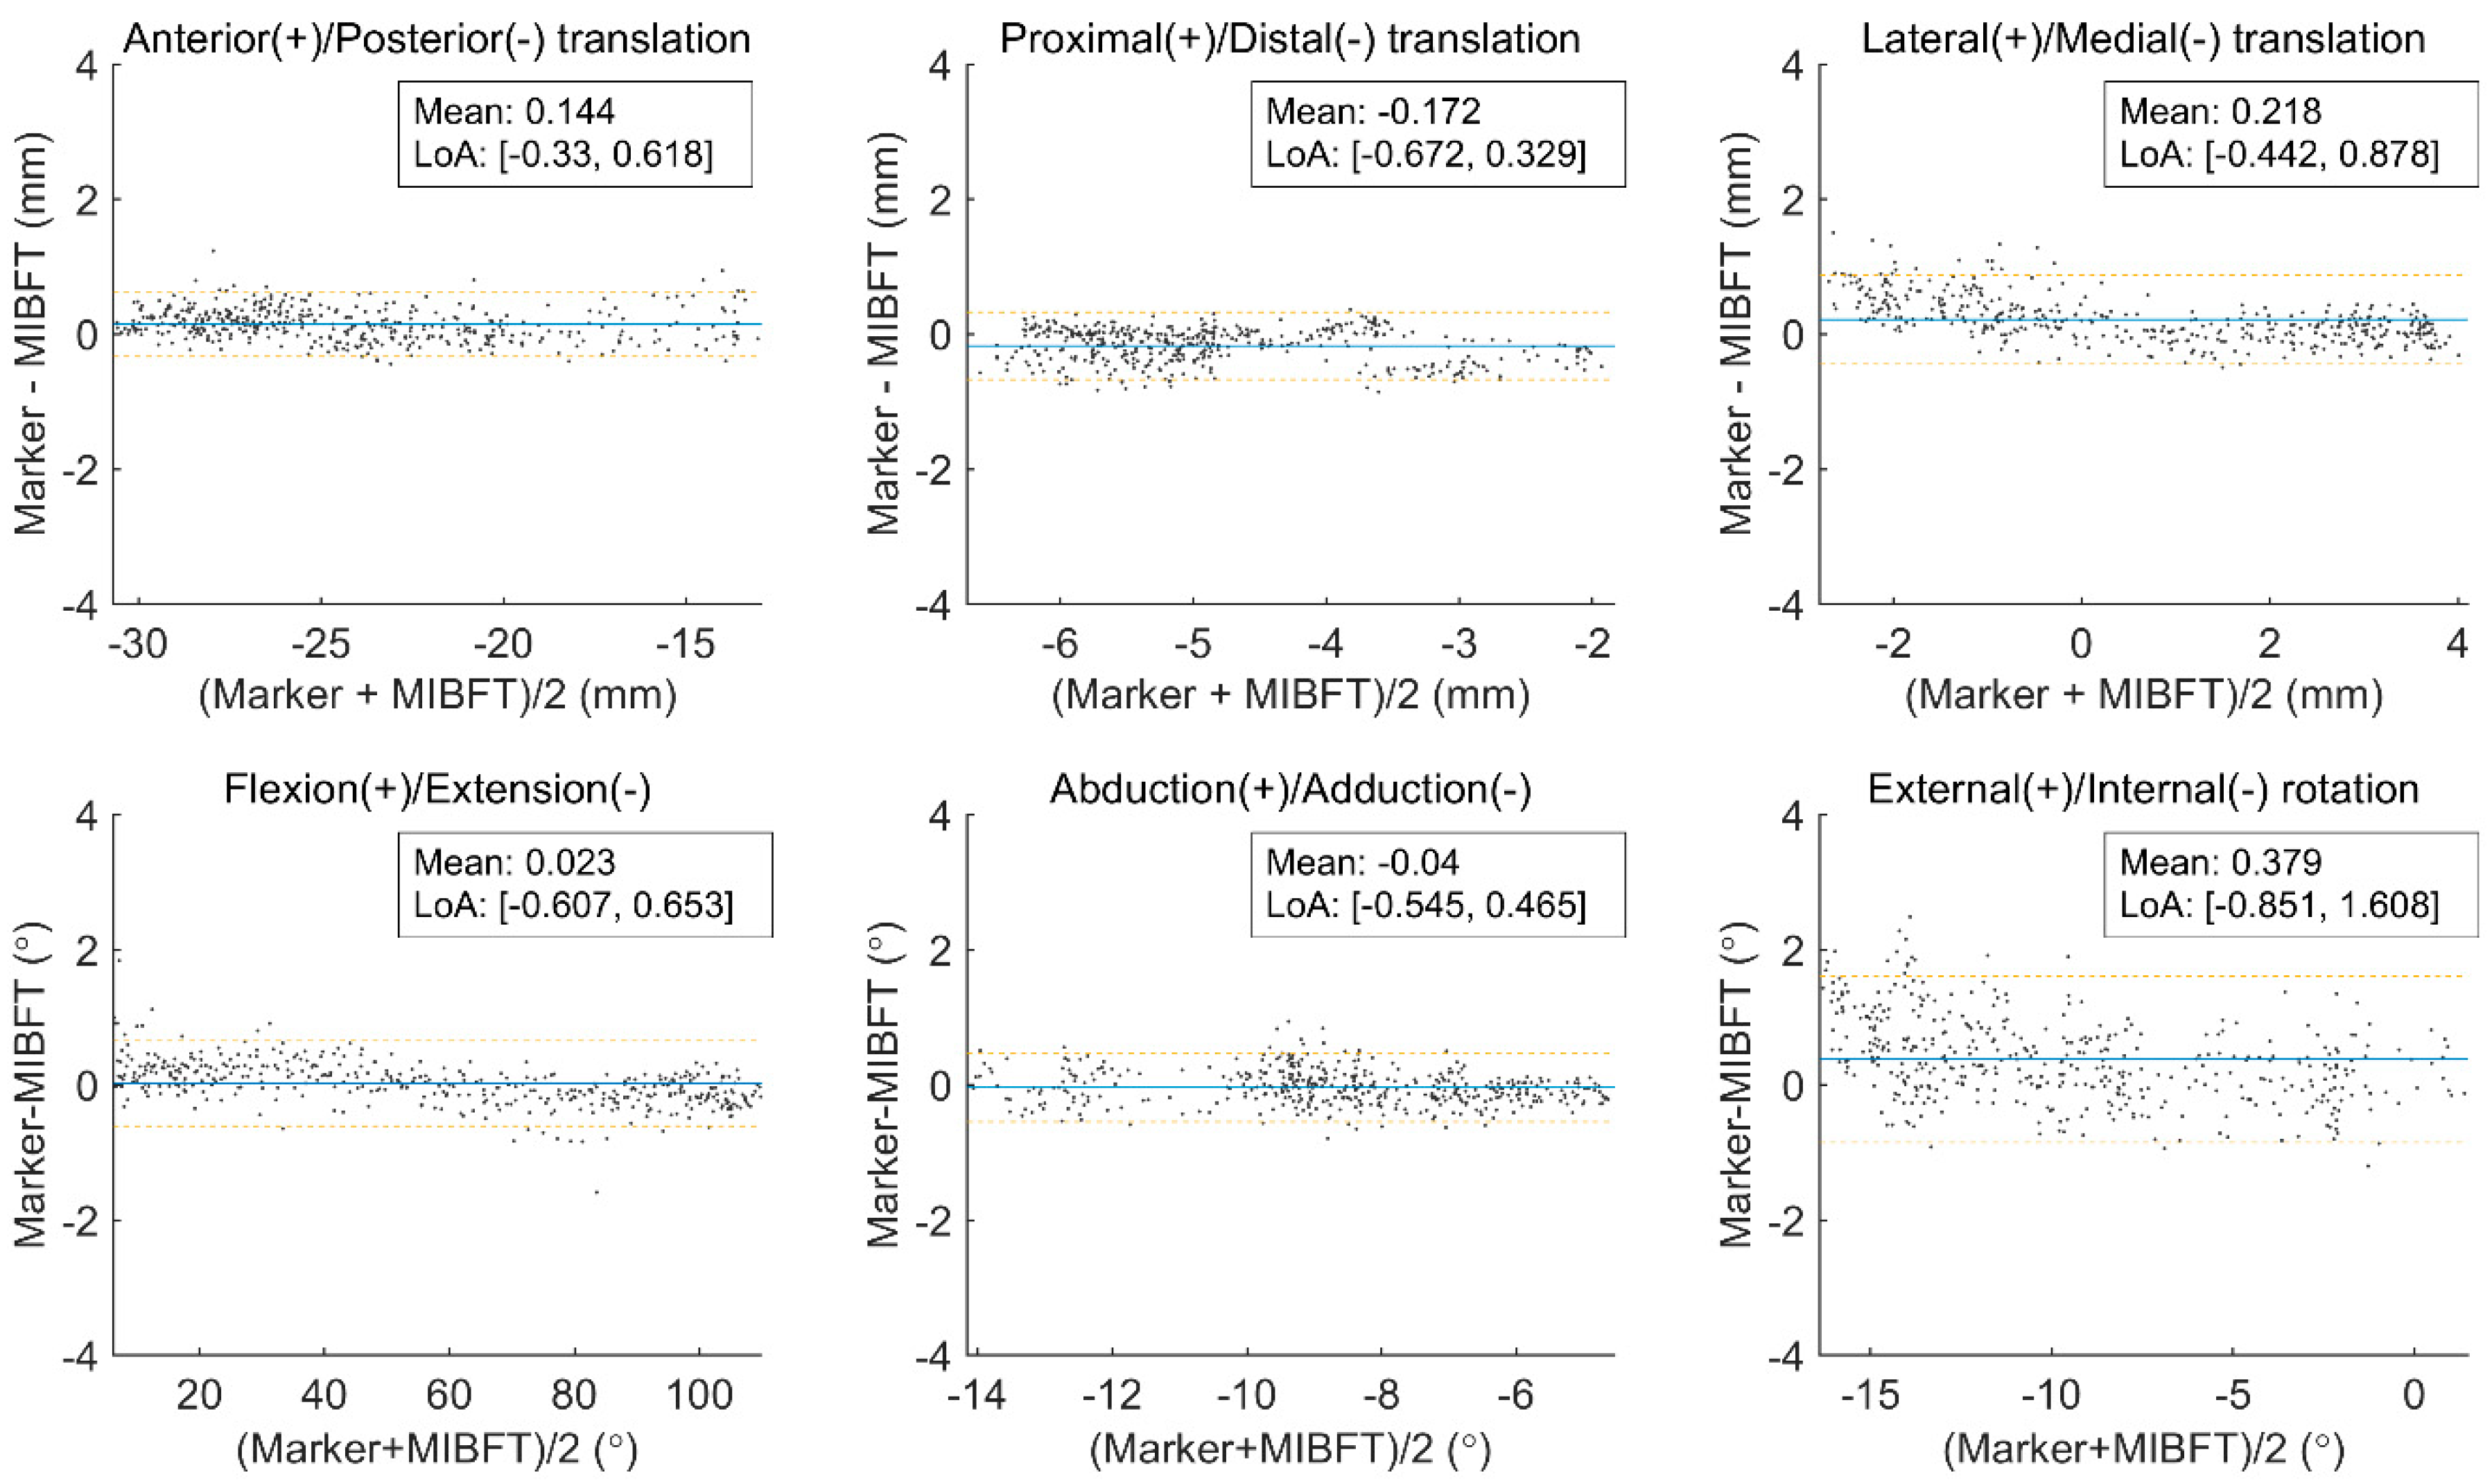
The agreement of the MIBFT-determined tibiofemoral 6-dof kinematics with those of the standard reference values is shown in Figure 8. The MIBFT reproduced tibiofemoral kinematics that were in good agreement with the standard reference kinematics. The Bland–Altman plot gave mean differences for all translation components ranging from −0.17 to 0.22 mm and an LoA in the range of −0.67 to 0.88 mm. For flexion/extension, abduction/adduction, and internal/external rotation, the mean differences ranged from −0.04 to 0.38°, and the LoAs were in the range of −0.85 to 1.6°.
Based on the same experimental dataset, the MIBFT appeared to outperform typical model-based tracking using a single-plane image [24] and the previously reported MCPI method [40] in terms of the Rms errors of skeletal poses (Figure 9). As indicated by the boxplot, the median, 25 and 75% percentile of the Rms error distribution for each motion component were lowest for the MIBFT method (Figure 9). The present study demonstrated bias, precision, and Rms errors that were smaller or within the ranges of accuracy of those from model-based tracking techniques with synchronous or clinically asynchronous biplane X-ray imaging previously reported in the literature (Table 2).

4. Discussion

A new model-based tracking scheme was developed to accommodate interleaved biplane fluoroscopy for measuring tibiofemoral kinematics. It was primarily accomplished by synthesizing an intermediate image with a frame interpolation approach to integrate asynchronous information provided by the clinical biplane fluoroscopy to yield a pseudosynchronous pair of biplane images. In previously reported techniques with the same objective, the approaches have normally relied on the data generated from the interpolation of 3D skeletal kinematics [39,40], which must be obtained from an additional image registration procedure based on a single-plane fluoroscopic image. This therefore led to two image analysis steps for an entire kinematics reconstruction process. Successful single-plane image registration must be ensured to generate precise kinematic interpolation, which subsequently affects the accuracy of the measured bone poses. In contrast, the present approach requires only a single image analysis step. In combination with template registration for initial pose estimation, fully automated image registration for a complete image set was achieved.
Directly comparing the present accuracy values to those reported with different biplane fluoroscopy-based model-based tracking approaches was difficult, as the imaging system used, experimental conditions of the motion tasks, and the reported error metrics were different (Table 2). Nonetheless, a comparison of the primary error metrics calculated for the determination of tibiofemoral kinematics, such as bias, precision, and Rms error (Table 2), was made. It appeared that the present MIBFT with a clinical biplane X-ray imaging system was capable of producing submillimeter and subdegree accuracy in terms of the compared error metrics and was well within the values generated by techniques based on custom-made imaging systems, which supports the applicability of the clinical asynchronous X-ray imaging system for precise functional examinations of the knee. On the same dataset, we further implemented and evaluated a single-plane MBT [24] and the relevant MCPI algorithm specifically devised for clinical asynchronous biplane fluoroscopy [40]. The present MIBFT was shown to not only be capable of addressing the out-of-plane translation problem in single-plane MBT and reducing errors in out-of-plane rotation, as shown in MCPI [40], but further reduce errors in other relatively accurate motion components (Figure 9).
Among the 6-dof reconstructed tibiofemoral kinematics, the internal/external rotation was less accurate than the other motion components (Table 2) and was the only one that showed an LoA beyond 1° (Figure 8). Similar results were also found in previous studies [31,32] (Table 2) conducted on the synchronous biplane imaging system. This is reasonable, as the nature of the cylindrical shape of both the femur and tibia leads to a less sensitive, and thus less accurate, model rotation around the long axis during image registration [32]. On the other hand, the specimen leg was hung on a frame in the experimental setup used in the present study, which caused the long axes of the bones to be most near-parallel to the y-axis of the fluoroscopic coordinate system (Figure 1C), even during motion tasks. The less accurate y-axis rotation of the bone (Table 1), as a result of being an out-of-plane motion component from the perspective of both detectors [40], would also propagate the errors to the long-axis rotation of the bones and the description of the tibiofemoral internal/external rotation.
Template registration on video fluoroscopy has been applied for the analysis of the planar displacement of vertebrae during motion in three-parameter space [13,61,62,63]. While the pose parameters may be accurately reproduced through a semirigid template [61] or with an exhaustive search strategy to ensure a global optimum [13,63], increased computational effort and run time are inevitable. Since accurate estimation of template poses was not the major aim of the study, a quick and simple approximation of template displacement between successive frames using a particle filter was shown to be a valid alternative. Integrating the planar displacements from two perspectives, the estimated 3D bone displacement appeared to greatly compensate for the deviations in bone poses between successive image frames (Figure 5). This diminishes the search space of pose parameters required in the subsequent 3D/2D image registration and therefore increases the probability of finding the optimal solution, allowing for measurement of faster motions involving a greater between-frame bone displacement (Figure 7).
The influences of the motion speeds on the determination of bone poses were analyzed in the present study, as the motion speed was found to affect the quantification of joint motion via fluoroscopy [26]. The average and instantaneous maximum tibiofemoral FE speeds were approximately 158 and 250°/s, respectively (Figure 6), which were higher than the values reported in [31] and [64] (i.e., 45–60°/s) and comparable to those reported in [65] and [26] (i.e., 202–225°/s). In addition to the factors related to the equipment used (e.g., fluoroscopy), the quality of the synthetic images obtained from the frame interpolation should be considered, especially when the motion activity is fast. A higher motion speed could result in a more pronounced object displacement and nonrigid deformation between successive images, which would directly increase the required search space for the motion vectors and probably deteriorate blocking artifacts caused by inaccurate optical flow. Recently reported deep-learning-based approaches (e.g., [66]) showed great potential in reproducing high-quality interpolation images with minimal artifacts; such approaches can be feasibly integrated in the present MIBFT and may be taken into account in future applications. Nonetheless, the current implementation of a block-based frame interpolation algorithm yielded acceptable interpolation images for biplane image registration, and their influence on the quantification of high-speed kinematics was limited to approximately 0.3 mm and 0.3° (Figure 6).

5. Conclusions

A new fully automated model-based tracking scheme in conjunction with clinical asynchronous biplane fluoroscopy has been developed and evaluated for the accuracy on the measurement of dynamic tibiofemoral motions. Less than 0.4 mm Rms error in measuring tibiofemoral translation and 0.8° Rms error in measuring rotation were achieved, comparable to those of a variety of model-based tracking techniques using custom-made synchronous biplane imaging systems. This may encourage the further use of clinical imaging systems for the noninvasive and precise examination of dynamic joint functions in clinical practice and extend the application of MBT for kinematic measurement investigations in a budge-efficient way. The presented approach may be also integrated into image-guided intervention procedures to spatially align the pre-interventional image data with the intra-intervention data.

Author Contributions

Each author contribution to the article is subdivided as follows: Conceptualization, C.-C.L. and T.-W.L.; methodology, C.-C.L., T.-W.L. and J.-D.L.; software, C.-C.L. and J.-D.L.; validation, J.-D.L., M.-Y.K. and C.-C.K.; formal analysis, C.-C.L. and J.-D.L.; investigation, C.-C.L., T.-W.L., J.-D.L., M.-Y.K., C.-C.K. and H.-C.H.; resources, C.-C.K. and H.-C.H.; data curation, T.-W.L. and H.-C.H.; writing—original draft preparation, C.-C.L.; writing—review and editing, T.-W.L., J.-D.L., M.-Y.K., C.-C.K. and H.-C.H.; visualization, C.-C.L. and J.-D.L.; supervision, T.-W.L. and C.-C.K.; project administration, T.-W.L. and H.-C.H.; funding acquisition, T.-W.L. and H.-C.H. All authors have read and agreed to the published version of the manuscript.

Funding

This research was funded by Ministry of Science and Technology of Taiwan, grant number: 104-2218-E-030-001, 103-2627-B-002-001 and 109-2221-E-030 -002 -MY2.

Acknowledgments

The authors gratefully acknowledge the staff of the China Medical University Hospital for their assistance in the image data collection.

Conflicts of Interest

The authors declare no conflict of interest. The funders had no role in the design of the study; in the collection, analyses, or interpretation of data; in the writing of the manuscript, or in the decision to publish the results.

References

  1. Wilson, D.R.; Feikes, J.D.; O’Connor, J.J. Ligaments and articular contact guide passive knee flexion. J. Biomech. 1998, 31, 1127–1136. [Google Scholar] [CrossRef]
  2. Navacchia, A.; Kefala, V.; Shelburne, K.B. Dependence of Muscle Moment Arms on In Vivo Three-Dimensional Kinematics of the Knee. Ann. Biomed. Eng. 2017, 45, 789–798. [Google Scholar] [CrossRef] [PubMed] [Green Version]
  3. Hosseini Nasab, S.H.; Smith, C.R.; Schütz, P.; Postolka, B.; List, R.; Taylor, W.R. Elongation Patterns of the Collateral Ligaments After Total Knee Arthroplasty Are Dominated by the Knee Flexion Angle. Front. Bioeng. Biotechnol. 2019, 7, 323. [Google Scholar] [CrossRef] [PubMed] [Green Version]
  4. Kono, K.; Tomita, T.; Futai, K.; Yamazaki, T.; Tanaka, S.; Yoshikawa, H.; Sugamoto, K. In vivo three-dimensional kinematics of normal knees during different high-flexion activities. Bone Jt. J. 2018, 100, 50–55. [Google Scholar] [CrossRef]
  5. Gray, H.A.; Guan, S.; Thomeer, L.T.; Schache, A.G.; de Steiger, R.; Pandy, M.G. Three-dimensional motion of the knee-joint complex during normal walking revealed by mobile biplane x-ray imaging. J. Orthop. Res. 2019, 37, 615–630. [Google Scholar] [CrossRef]
  6. Kefala, V.; Cyr, A.J.; Harris, M.D.; Hume, D.R.; Davidson, B.S.; Kim, R.H.; Shelburne, K.B. Assessment of Knee Kinematics in Older Adults Using High-Speed Stereo Radiography. Med. Sci. Sports Exerc. 2017, 49, 2260–2267. [Google Scholar] [CrossRef]
  7. Yang, C.; Tashiro, Y.; Lynch, A.; Fu, F.; Anderst, W. Kinematics and arthrokinematics in the chronic ACL-deficient knee are altered even in the absence of instability symptoms. Knee Surg. Sports Traumatol. Arthrosc. 2018, 26, 1406–1413. [Google Scholar] [CrossRef]
  8. Leardini, A.; Belvedere, C.; Nardini, F.; Sancisi, N.; Conconi, M.; Parenti-Castelli, V. Kinematic models of lower limb joints for musculo-skeletal modelling and optimization in gait analysis. J. Biomech. 2017, 62, 77–86. [Google Scholar] [CrossRef]
  9. Zheng, L.; Carey, R.; Thorhauer, E.; Tashman, S.; Harner, C.; Zhang, X. In vivo tibiofemoral skeletal kinematics and cartilage contact arthrokinematics during decline walking after isolated meniscectomy. Med. Eng. Phys. 2018, 51, 41–48. [Google Scholar] [CrossRef]
  10. Hume, D.R.; Kefala, V.; Harris, M.D.; Shelburne, K.B. Comparison of Marker-Based and Stereo Radiography Knee Kinematics in Activities of Daily Living. Ann. Biomed. Eng. 2018, 46, 1806–1815. [Google Scholar] [CrossRef]
  11. Barré, A.; Jolles, B.M.; Theumann, N.; Aminian, K. Soft tissue artifact distribution on lower limbs during treadmill gait: Influence of skin markers’ location on cluster design. J. Biomech. 2015, 48, 1965–1971. [Google Scholar] [CrossRef] [PubMed]
  12. Li, J.-D.; Lu, T.-W.; Lin, C.-C.; Kuo, M.-Y.; Hsu, H.-C.; Shen, W.-C. Soft tissue artefacts of skin markers on the lower limb during cycling: Effects of joint angles and pedal resistance. J. Biomech. 2017, 62, 27–38. [Google Scholar] [CrossRef] [PubMed]
  13. Cerciello, T.; Romano, M.; Bifulco, P.; Cesarelli, M.; Allen, R. Advanced template matching method for estimation of intervertebral kinematics of lumbar spine. Med. Eng. Phys. 2011, 33, 1293–1302. [Google Scholar] [CrossRef] [PubMed]
  14. Forsberg, D.; Lindblom, M.; Quick, P.; Gauffin, H. Quantitative analysis of the patellofemoral motion pattern using semi-automatic processing of 4D CT data. Int. J. Comput. Assist. Radiol. Surg. 2016, 11, 1731–1741. [Google Scholar] [CrossRef] [PubMed]
  15. Krohn, S.; Gersdorff, N.; Wassmann, T.; Merboldt, K.-D.; Joseph, A.A.; Buergers, R.; Frahm, J. Real-time MRI of the temporomandibular joint at 15 frames per second-A feasibility study. Eur. J. Radiol. 2016, 85, 2225–2230. [Google Scholar] [CrossRef] [PubMed]
  16. Kaiser, J.; Bradford, R.; Johnson, K.; Wieben, O.; Thelen, D.G. Measurement of tibiofemoral kinematics using highly accelerated 3D radial sampling. Magn. Reson. Med. 2013, 69, 1310–1316. [Google Scholar] [CrossRef] [PubMed] [Green Version]
  17. Borotikar, B.S.; Sipprell Iii, W.H.; Wible, E.E.; Sheehan, F.T. A methodology to accurately quantify patellofemoral cartilage contact kinematics by combining 3D image shape registration and cine-PC MRI velocity data. J. Biomech. 2012, 45, 1117–1122. [Google Scholar] [CrossRef] [Green Version]
  18. Barrance, P.J.; Williams, G.N.; Novotny, J.E.; Buchanan, T.S. A method for measurement of joint kinematics in vivo by registration of 3-D geometric models with cine phase contrast magnetic resonance imaging data. J. Biomech. Eng.-Trans. ASME 2005, 127, 829–837. [Google Scholar] [CrossRef]
  19. Lin, C.-C.; Zhang, S.; Hsu, C.-Y.; Frahm, J.; Lu, T.-W.; Shih, T.-F. Measuring three-dimensional tibiofemoral kinematics using dual-slice real-time magnetic resonance imaging. Med. Phys. 2019, 46, 4588–4599. [Google Scholar] [CrossRef]
  20. Kaiser, J.; Monawer, A.; Chaudhary, R.; Johnson, K.M.; Wieben, O.; Kijowski, R.; Thelen, D.G. Accuracy of model-based tracking of knee kinematics and cartilage contact measured by dynamic volumetric MRI. Med. Eng. Phys. 2016, 38, 1131–1135. [Google Scholar] [CrossRef] [Green Version]
  21. List, R.; Postolka, B.; Schütz, P.; Hitz, M.; Schwilch, P.; Gerber, H.; Ferguson, S.J.; Taylor, W.R. A moving fluoroscope to capture tibiofemoral kinematics during complete cycles of free level and downhill walking as well as stair descent. PLoS ONE 2017, 12, e0185952. [Google Scholar] [CrossRef] [PubMed] [Green Version]
  22. Guan, S.; Gray, H.A.; Keynejad, F.; Pandy, M.G. Mobile Biplane X-Ray Imaging System for Measuring 3D Dynamic Joint Motion During Overground Gait. IEEE Trans. Med. Imaging 2016, 35, 326–336. [Google Scholar] [CrossRef]
  23. Postolka, B.; List, R.; Thelen, B.; Schütz, P.; Taylor, W.R.; Zheng, G. Evaluation of an intensity-based algorithm for 2D/3D registration of natural knee videofluoroscopy data. Med. Eng. Phys. 2020. [Google Scholar] [CrossRef] [PubMed]
  24. Tsai, T.Y.; Lu, T.W.; Chen, C.M.; Kuo, M.Y.; Hsu, H.C. A volumetric model-based 2D to 3D registration method for measuring kinematics of natural knees with single-plane fluoroscopy. Med. Phys. 2010, 37, 1273–1284. [Google Scholar] [CrossRef] [PubMed]
  25. Flood, P.D.L.; Banks, S.A. Automated Registration of 3-D Knee Implant Models to Fluoroscopic Images Using Lipschitzian Optimization. IEEE Trans. Med. Imaging 2018, 37, 326–335. [Google Scholar] [CrossRef]
  26. Ellingson, A.M.; Mozingo, J.D.; Magnuson, D.J.; Pagnano, M.W.; Zhao, K.D. Characterizing fluoroscopy based kinematic accuracy as a function of pulse width and velocity. J. Biomech. 2016, 49, 3741–3745. [Google Scholar] [CrossRef] [Green Version]
  27. Zhu, Z.; Li, G. An automatic 2D–3D image matching method for reproducing spatial knee joint positions using single or dual fluoroscopic images. Comput. Methods Biomech. Biomed. Eng. 2011, 15, 1245–1256. [Google Scholar] [CrossRef] [Green Version]
  28. Lin, C.-C.; Lu, T.-W.; Wang, T.-M.; Hsu, C.-Y.; Shih, T.-F. Comparisons of surface vs. volumetric model-based registration methods using single-plane vs. bi-plane fluoroscopy in measuring spinal kinematics. Med. Eng. Phys. 2014, 36, 267–274. [Google Scholar] [CrossRef]
  29. You, B.M.; Siy, P.; Anderst, W.; Tashman, S. In vivo measurement of 3-D skeletal kinematics from sequences of biplane radiographs: Application to knee kinematics. IEEE Trans. Med. Imaging 2001, 20, 514–525. [Google Scholar] [CrossRef] [Green Version]
  30. Anderst, W.; Zauel, R.; Bishop, J.; Demps, E.; Tashman, S. Validation of three-dimensional model-based tibio-femoral tracking during running. Med. Eng. Phys. 2009, 31, 10–16. [Google Scholar] [CrossRef] [Green Version]
  31. Giphart, J.E.; Zirker, C.A.; Myers, C.A.; Pennington, W.W.; LaPrade, R.F. Accuracy of a contour-based biplane fluoroscopy technique for tracking knee joint kinematics of different speeds. J. Biomech. 2012, 45, 2935–2938. [Google Scholar] [CrossRef] [PubMed]
  32. Stentz-Olesen, K.; Nielsen, E.T.; De Raedt, S.; Jørgensen, P.B.; Sørensen, O.G.; Kaptein, B.L.; Andersen, M.S.; Stilling, M. Validation of static and dynamic radiostereometric analysis of the knee joint using bone models from CT data. Bone Jt. Res. 2017, 6, 376–384. [Google Scholar] [CrossRef] [PubMed] [Green Version]
  33. Brainerd, E.L.; Baier, D.B.; Gatesy, S.M.; Hedrick, T.L.; Metzger, K.A.; Gilbert, S.L.; Crisco, J.J. X-ray reconstruction of moving morphology (XROMM): Precision, accuracy and applications in comparative biomechanics research. J. Exp. Zool. A Ecol. Genet. Physiol. 2010, 313, 262–279. [Google Scholar] [CrossRef]
  34. Ivester, J.C.; Cyr, A.J.; Harris, M.D.; Kulis, M.J.; Rullkoetter, P.J.; Shelburne, K.B. A Reconfigurable High-Speed Stereo-Radiography System for Sub-Millimeter Measurement of In Vivo Joint Kinematics. J. Med. Devices 2015, 9. [Google Scholar] [CrossRef]
  35. Li, G.; Van de Velde, S.K.; Bingham, J.T. Validation of a non-invasive fluoroscopic imaging technique for the measurement of dynamic knee joint motion. J. Biomech. 2008, 41, 1616–1622. [Google Scholar] [CrossRef] [PubMed]
  36. Barré, A.; Aminian, K. Error performances of a model-based biplane fluoroscopic system for tracking knee prosthesis during treadmill gait task. Med. Biol. Eng. Comput. 2018, 56, 307–316. [Google Scholar] [CrossRef]
  37. Mozingo, J.D.; Akbari Shandiz, M.; Marquez, F.M.; Schueler, B.A.; Holmes, D.R.; McCollough, C.H.; Zhao, K.D. Validation of imaging-based quantification of glenohumeral joint kinematics using an unmodified clinical biplane fluoroscopy system. J. Biomech. 2018, 71, 306–312. [Google Scholar] [CrossRef]
  38. Cross, J.A.; McHenry, B.; Schmidt, T.G. Quantifying cross-scatter contamination in biplane fluoroscopy motion analysis systems. JMIOBU 2015, 2, 043503. [Google Scholar] [CrossRef] [Green Version]
  39. Akbari-Shandiz, M.; Mozingo, J.D.; Holmes Iii, D.R.; Zhao, K.D. An interpolation technique to enable accurate three-dimensional joint kinematic analyses using asynchronous biplane fluoroscopy. Med. Eng. Phys. 2018, 60, 109–116. [Google Scholar] [CrossRef]
  40. Lin, C.-C.; Li, J.-D.; Lu, T.-W.; Kuo, M.-Y.; Kuo, C.-C.; Hsu, H.-C. A model-based tracking method for measuring 3D dynamic joint motion using an alternating biplane x-ray imaging system. Med. Phys. 2018, 45, 3637–3649. [Google Scholar] [CrossRef]
  41. Lin, C.-C.; Lu, T.-W.; Shih, T.-F.; Tsai, T.-Y.; Wang, T.-M.; Hsu, S.-J. Intervertebral anticollision constraints improve out-of-plane translation accuracy of a single-plane fluoroscopy-to-CT registration method for measuring spinal motion. Med. Phys. 2013, 40, 031912. [Google Scholar] [CrossRef] [PubMed]
  42. Kaptein, B.L.; Shelburne, K.B.; Torry, M.R.; Erik Giphart, J. A comparison of calibration methods for stereo fluoroscopic imaging systems. J. Biomech. 2011, 44, 2511–2515. [Google Scholar] [CrossRef]
  43. Rafael, C.; Gonzalez, R.E.W. Digital Image Processing, 4th ed.; Pearson Education Limited: London, UK, 2017. [Google Scholar]
  44. De Bruin, P.W.; Kaptein, B.L.; Stoel, B.C.; Reiber, J.H.C.; Rozing, P.M.; Valstar, E.R. Image-based RSA: Roentgen stereophotogrammetric analysis based on 2D–3D image registration. J. Biomech. 2008, 41, 155–164. [Google Scholar] [CrossRef] [PubMed]
  45. Lorensen, W.E.; Cline, H.E. Marching Cubes: A High Resolution 3D Surface Construction Algorithm. Comput. Graph. (ACM) 1987, 21, 163–169. [Google Scholar] [CrossRef]
  46. Miranda, D.L.; Rainbow, M.J.; Leventhal, E.L.; Crisco, J.J.; Fleming, B.C. Automatic determination of anatomical coordinate systems for three-dimensional bone models of the isolated human knee. J. Biomech. 2010, 43, 1623–1626. [Google Scholar] [CrossRef] [PubMed] [Green Version]
  47. Arulampalam, M.S.; Maskell, S.; Gordon, N.; Clapp, T. A tutorial on particle filters for online nonlinear/non-Gaussian Bayesian tracking. IEEE Trans. Signal Process. 2002, 50, 174–188. [Google Scholar] [CrossRef] [Green Version]
  48. Moré, J.J. The Levenberg-Marquardt Algorithm: Implementation and Theory; Springer: Berlin/Heidelberg, Germany, 1978; pp. 105–116. [Google Scholar]
  49. Jiefu, Z.; Yu, K.; Jiang, L.; Shipeng, L. A low complexity motion compensated frame interpolation method. In Proceedings of the International Symposium on Circuits and Systems (ISCAS 2005), Kobe, Japan, 23–26 May 2005; Volume 4925, pp. 4927–4930. [Google Scholar]
  50. Byung-Tae, C.; Sung-Hee, L.; Sung-Jea, K. New frame rate up-conversion using bi-directional motion estimation. IEEE Trans. Consum. Electron. 2000, 46, 603–609. [Google Scholar] [CrossRef]
  51. Markelj, P.; Tomaževič, D.; Likar, B.; Pernuš, F. A review of 3D/2D registration methods for image-guided interventions. Med. Image Anal. 2012, 16, 642–661. [Google Scholar] [CrossRef]
  52. Otake, Y.; Armand, M.; Armiger, R.S.; Kutzer, M.D.; Basafa, E.; Kazanzides, P.; Taylor, R.H. Intraoperative image-based multiview 2D/3D registration for image-guided orthopaedic surgery: Incorporation of fiducial-based C-arm tracking and GPU-acceleration. IEEE Trans. Med. Imaging 2012, 31, 948–962. [Google Scholar] [CrossRef] [Green Version]
  53. Goldberg, D.E. Genetic Algorithms in Search, Optimization, and Machine Learning; Addison-Wesley: Boston, MA, USA, 1989. [Google Scholar]
  54. Lagarias, J.C.; Reeds, J.A.; Wright, M.H.; Wright, P.E. Convergence Properties of the Nelder--Mead Simplex Method in Low Dimensions. SIAM J. Optim. 1998, 9, 112–147. [Google Scholar] [CrossRef] [Green Version]
  55. Lin, C.-C.; Chang, C.-L.; Lu, M.; Lu, T.-W.; Wu, C.-H. Quantification of three-dimensional soft tissue artifacts in the canine hindlimb during passive stifle motion. BMC Vet. Res. 2018, 14, 389. [Google Scholar] [CrossRef] [PubMed] [Green Version]
  56. Söderkvist, I.; Wedin, P.-Å. Determining the movements of the skeleton using well-configured markers. J. Biomech. 1993, 26, 1473–1477. [Google Scholar] [CrossRef]
  57. Grood, E.S.; Suntay, W.J. A joint coordinate system for the clinical description of three-dimensional motions: Application to the knee. J. Biomech. Eng.-Trans. ASME 1983, 105, 136–144. [Google Scholar] [CrossRef] [PubMed]
  58. Van de Kraats, E.B.; Penney, G.P.; Tomazevic, D.; van Walsum, T.; Niessen, W.J. Standardized evaluation methodology for 2-D-3-D registration. IEEE Trans. Med. Imaging 2005, 24, 1177–1189. [Google Scholar] [CrossRef] [PubMed]
  59. Bland, J.M.; Altman, D.G. Statistical methods for assessing agreement between two methods of clinical measurement. Lancet 1986, 1, 307–310. [Google Scholar] [CrossRef]
  60. Ohnishi, T.; Suzuki, M.; Nawata, A.; Naomoto, S.; Iwasaki, T.; Haneishi, H. Three-dimensional motion study of femur, tibia, and patella at the knee joint from bi-plane fluoroscopy and CT images. Radiol. Phys. Technol. 2010, 3, 151–158. [Google Scholar] [CrossRef]
  61. Balkovec, C.; Veldhuis, J.H.; Baird, J.W.; Brodland, G.W.; McGill, S.M. A videofluoroscopy-based tracking algorithm for quantifying the time course of human intervertebral displacements. Comput. Methods Biomech. Biomed. Eng. 2017, 20, 794–802. [Google Scholar] [CrossRef]
  62. Breen, A.; Breen, A. Accuracy and repeatability of quantitative fluoroscopy for the measurement of sagittal plane translation and finite centre of rotation in the lumbar spine. Med. Eng. Phys. 2016, 38, 607–614. [Google Scholar] [CrossRef]
  63. Bifulco, P.; Cesarelli, M.; Romano, M.; Fratini, A.; Sansone, M. Measurement of intervertebral cervical motion by means of dynamic x-ray image processing and data interpolation. Int. J. Biomed. Imaging 2013, 2013, 152920. [Google Scholar] [CrossRef]
  64. Bey, M.J.; Kline, S.K.; Tashman, S.; Zauel, R. Accuracy of biplane x-ray imaging combined with model-based tracking for measuring in-vivo patellofemoral joint motion. J. Orthop. Surg. Res. 2008, 3, 38. [Google Scholar] [CrossRef] [Green Version]
  65. Pitcairn, S.; Lesniak, B.; Anderst, W. In vivo validation of patellofemoral kinematics during overground gait and stair ascent. Gait Posture 2018, 64, 191–197. [Google Scholar] [CrossRef] [PubMed]
  66. Jiang, H.; Sun, D.; Jampani, V.; Yang, M.; Learned-Miller, E.; Kautz, J. Super SloMo: High Quality Estimation of Multiple Intermediate Frames for Video Interpolation. In Proceedings of the 2018 IEEE/CVF Conference on Computer Vision and Pattern Recognition, Salt Lake City, UT, USA, 18–23 June 2018; pp. 9000–9008. [Google Scholar]
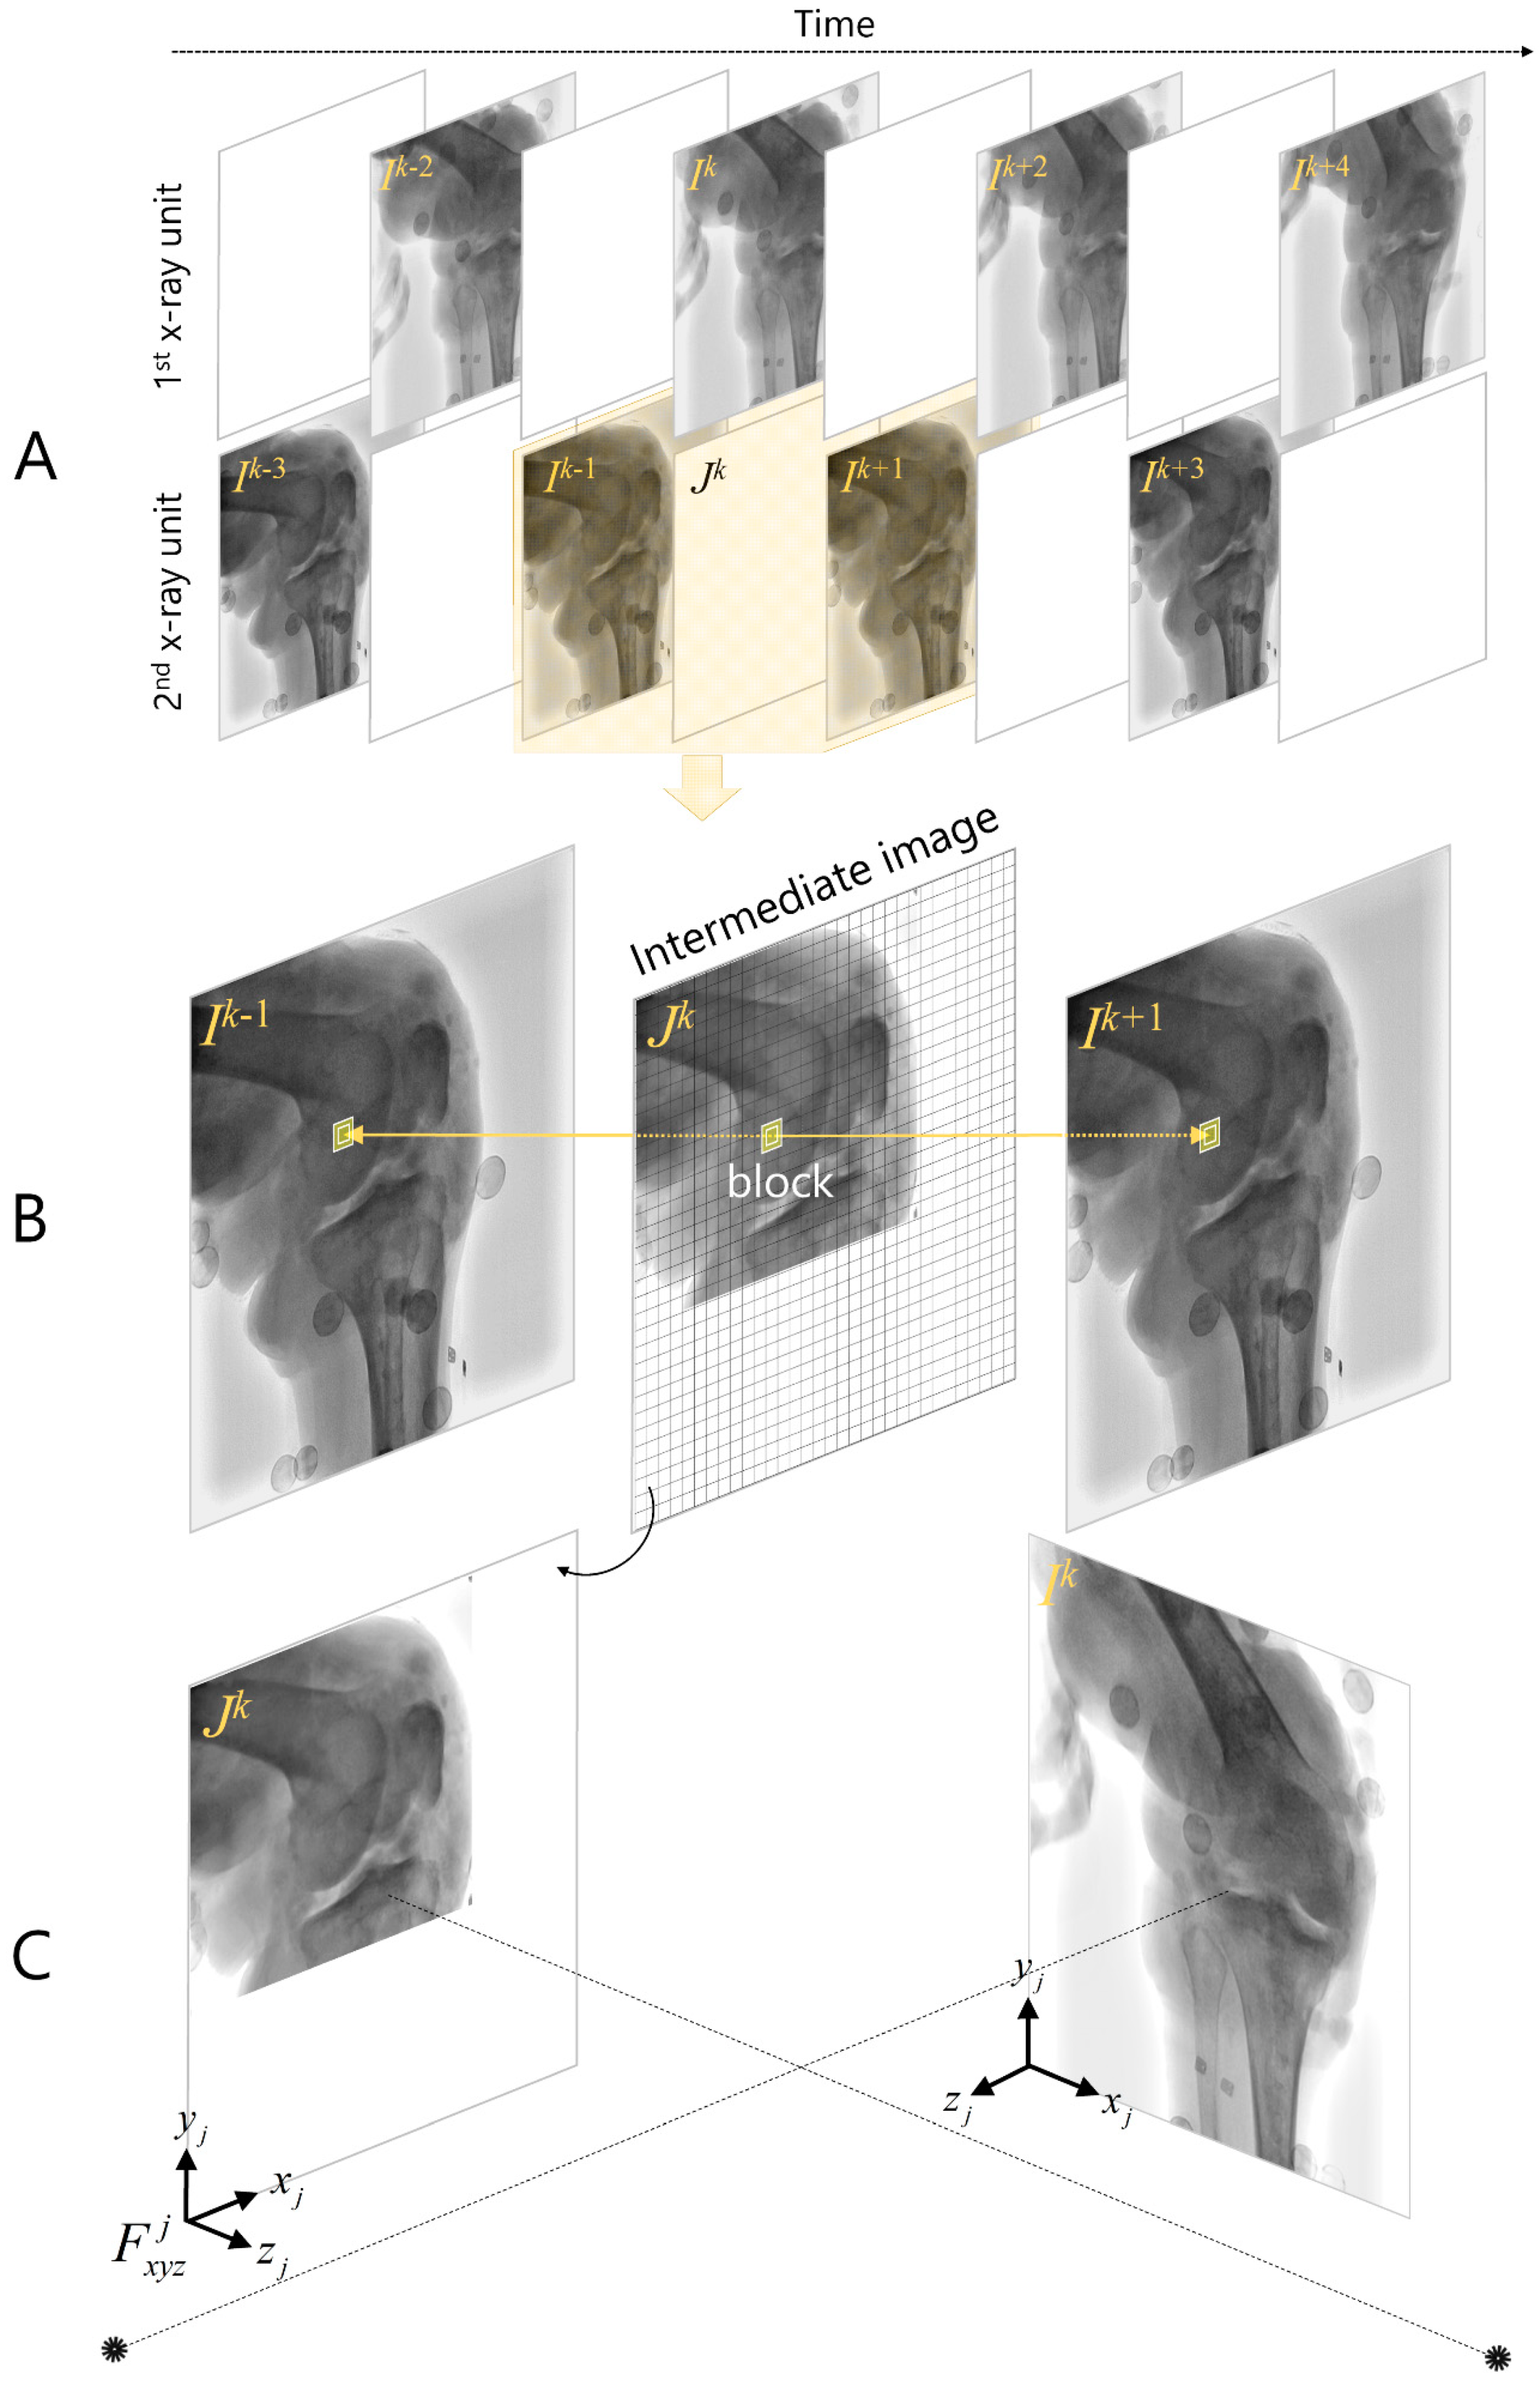
Figure 1. (A) Continuous interleaved biplane fluoroscopic images collected from two X-ray units of a clinical biplane X-ray imaging system. (B) The intermediate image ( J k ) at time step k can be generated from the preceding ( I k 1 ) and succeeding images ( I k + 1 ) by means of a motion-compensated frame interpolation method. (C) The interpolated J k together with the originally acquired image I k constitute a configuration of biplane fluoroscopy imaging.
Applsci 10 08426 g001
Figure 2. Schematic representation of the 2D/2D template registration procedure. (A) The surface model at the registered pose in the preceding frame was projected onto the image plane, from which (B) a bone template, M j , determined by the outermost boundary, was extracted and used to match the succeeding image frame with a particle filter. (C) The 2D translations and rotations on the two image planes estimated from the template registration were incorporated to update the pose parameters of the bone model.
Applsci 10 08426 g002
Figure 3. The 3D/2D image registration procedure that numerically searches for the optimal pose parameters of the bone such that its forward projected digitally reconstructed radiographs best match the real fluoroscopic image and the image interpolated from the adjacent image frames.
Applsci 10 08426 g003
Figure 4. (A) A cadaveric experiment was conducted on a knee specimen to provide the interleaved biplane fluoroscopic images for model-based interleaved biplane fluoroscopy image tracking (MIBFT) analysis and to record the 3D trajectories of the bone-anchor markers via a motion capture system (MoCap). (B) The marker data obtained from the MoCap were also imported into the virtually reconstructed biplane imaging environment, which were then used to determine the reference pose parameters of the femur and tibia.
Applsci 10 08426 g004
Figure 5. The means and standard deviations of the absolute errors in the six degrees-of-freedom of the femur and tibia throughout the MIBFT. The results corresponding to the initial pose (registered pose in preceding frame), template-registered pose, and final pose are shown in blue, orange, and yellow, respectively.
Applsci 10 08426 g005
Figure 6. The scatter plot of the absolute errors for the six degrees-of-freedom of both the femur and tibia against the rotation speeds of the tibiofemoral flexion and extension. The different colors represent data obtained from different trials with different prescribed motion speeds. The black solid lines indicate the moving average of the absolute errors across various speed intervals.
Applsci 10 08426 g006
Figure 7. (A) Scatter plot of the final mean target registration errors (mTREs) against the initial mTREs obtained from MIBFT with (blue dots) and without template registration (red dots). (B) The mTREs were also averaged over fixed intervals of initial mTRE to observe the general trends in the errors.
Applsci 10 08426 g007
Figure 8. Bland–Altman (BA) plots show the agreement of the six degrees-of-freedom tibiofemoral kinematics obtained from MIBFT and the marker-based MoCap (standard reference). The blue solid lines indicate the mean differences and the dashed yellow lines show the limits of agreement (LoA) of the differences.
Applsci 10 08426 g008
Figure 9. The box plots show the root-mean-squared (Rms) errors of the skeletal poses obtained using single-plane model-based tracking (MBT, blue), motion component partition and interpolation (MCPI) (orange) and presented MIBFT (yellow) methods. The central dots within the boxes represent the median values; the edges of the boxes represent the first and third quartiles of the Rms error distribution; the ranges of the whiskers indicate the upper and lower extremes.
Applsci 10 08426 g009
Table 1. Means (standard deviation) of the root-mean-squared errors (Rms errors) of each motion component over all trials for the femur and tibia during isolated femoral and tibial flexion/extension (FE) and tibiofemoral FE. The averaged bias and precision over all trials are also shown.
ComponentError MetricFemoral FETibial FETibiofemoral FE
FemurTibiaFemurTibia
Tx (mm)Rms error0.28 (0.04)0.23 (0.03)0.15 (0.03)0.18 (0.05)
Bias ± precision−0.07 ± 0.280.08 ± 0.22−0.07 ± 0.130.08 ± 0.16
Ty (mm)Rms error0.35 (0.04)0.22 (0.03)0.11 (0.01)0.20 (0.04)
Bias ± precision0.27 ± 0.230.12 ± 0.180.02 ± 0.100.13 ± 0.15
Tz (mm)Rms error0.29 (0.05)0.26 (0.05)0.18 (0.02)0.22 (0.04)
Bias ± precision−0.13 ± 0.260.01 ± 0.26−0.04 ± 0.170.00 ± 0.22
θx (°)Rms error0.20 (0.06)0.30 (0.07)0.19 (0.04)0.31 (0.13)
Bias ± precision0.03 ± 0.200.12 ± 0.270.04 ± 0.190.14 ± 0.27
θy (°)Rms error0.28 (0.04)0.43 (0.05)0.47 (0.10)0.49 (0.11)
Bias ± precision−0.03 ± 0.280.09 ± 0.42−0.23 ± 0.410.07 ± 0.46
θz (°)Rms error0.20 (0.06)0.29 (0.05)0.18 (0.02)0.33 (0.14)
Bias ± precision−0.03 ± 0.190.02 ± 0.290.03 ± 0.180.01 ± 0.33
Table 2. Comparison of reported accuracies in the measurement of tibiofemoral kinematics obtained from biplane model-based tracking in the literature and the present study. The accuracy values are represented in the form of bias (precision) [Rms error].
StudyEquipment eActivityAdd/Abd (°)
(X-axis)
I/E Rot (°)
(Y-axis)
Flex/Ext (°)
(Z-axis)
AP Tran. (mm)
(X-axis)
PD Tran. (mm)
(Y-axis)
LM Tran. (mm)
(Z-axis)
Li et al. [35] aSynchronous BXIDynamic0.31 (0.72)−0.16 (0.61)0.37 (0.91)0.24 (0.16)−0.11 (0.18)−0.13 (0.18)
Anderst et al. [30]Synchronous BXIDynamic−0.11 (0.30) [0.54]1.01 (0.62) [1.44]−0.3 (0.94) [1.75]−0.68 (0.74) [1.54]−0.16 (0.37) [0.69]−0.49 (0.31) [0.69]
Ohnishi et al. [60] bClinical BXIStatic[0.34][0.55][0.62][0.51][0.49][0.53]
Giphart et al. [31] cSynchronous BXIDynamic−0.03 (0.61)−0.05 (0.69)0.03 (0.43)−0.02 (0.49)0.08 (0.60)0.27 (0.71)
Stentz-Olesen et al. [32] dSynchronous BXIDynamic0.05 (0.71)−0.17 (0.77)−0.11 (0.45)−0.05 (0.56)−0.23 (0.38)0.16 (0.68)
Present studyClinical BXIDynamic−0.04 (0.26) [0.26]0.38 (0.63) [0.73]0.02 (0.32) [0.32]0.14 (0.24) [0.28]−0.17 (0.26) [0.31]0.22 (0.34) [0.40]
a Data were extracted from Knee 1. b Details regarding the definition of the joint axes were not provided in the study. c Data were extracted from an isolated extension trial. d Precision values were taken as the standard deviation of errors estimated from the Bland–Altman plots. e Abbreviation “BXI” indicates the biplane X-ray imaging system.
Publisher’s Note: MDPI stays neutral with regard to jurisdictional claims in published maps and institutional affiliations.