Article

Shock Wave Characterization Using Different Diameters of an Optoacoustic Carbon Nanotube Composite Transducer

1
Department of Ocean System Engineering, Jeju National University, Jeju-si 63243, Korea
2
Department of Radiology and Medical Imaging, University of Virginia, Charlottesvile, VA 22908, USA
*
Author to whom correspondence should be addressed.
These authors contributed equally to this work.
Appl. Sci. 2022, 12(14), 7300; https://doi.org/10.3390/app12147300
Submission received: 9 June 2022 / Revised: 6 July 2022 / Accepted: 13 July 2022 / Published: 20 July 2022

Abstract

:
Carbon nanotube–polymethyl siloxane (CNT-PDMS) composite transducers generate shock waves using optoacoustic technology. A thin layer of thermally conductive CNT and elastomeric polymer, PDMS, is applied on the concave surface of transparent polymethylmethacrylate (PMMA) to convert laser energy to acoustic energy using the thermoelastic effect of the composite transducer. The efficient conversion of laser energy requires an optimum utilization of the different properties of composite transducers. Among these properties, the diameter of composite transducers is a significant parameter. To practically verify and understand the effect of the diameter of composite transducers on the properties of shock waves, CNT-PDMS composite transducers with different diameters and focal lengths were constructed. Increases in the diameter of the composite transducer and input laser energy resulted in increased peak pressures of the shock waves. The maximum positive and negative pressures of the shock waves generated were 53 MPa and −25 MPa, respectively. This practically demonstrates that high peak amplitudes of shock waves can be achieved using larger transducers, which are suitable for practical applications in transcranial studies.

1. Introduction

Laser-guided focused ultrasound (LGFUS) is a promising alternative to other ultrasound generating modalities (electric, electromagnetic, and piezoelectric) to produce broadband ultrasound signals [1]. LGFUS has proven successful in providing a better alternative to non-invasive procedures for therapeutic purposes and many other biomedical applications [2]. The most prominent mechanism of LGFUS is the thermoelastic effect, also known as the photoacoustic or optoacoustic effect [3], in which laser energy is converted into acoustic energy using the thermal and elastic effect of the materials used in the ultrasound transducer fabrication. Another major characteristic feature of LGFUS is the generation of the shock wave at the focal point with a significant positive phase and long trailing negative phase, as formed in shock wave lithotripsy [4]. These shock waves can be achieved using specially constructed photoacoustic composite transducers for the efficient conversion of laser energy into acoustic energy [2].
Such composite transducers constitute a high optical absorbing material and an elastomeric polymer grown on a substrate [1]. High optical absorbance material is required to absorb maximum light from the source with a minimum reflection, and an elastomeric polymer with a high heat expansion coefficient is needed to convert it into acoustic energy with a high amplitude [1,5]. CNTs have a high light absorption ratio and generate high temperatures locally under laser exposure [6]. Additionally, CNTs enhanced peak pressure to more than one order of magnitude compared to metals by reducing reflectance and increasing the maximum optical absorbance [7,8]. Under pulsed laser excitation, CNT composites generate extreme acoustic pressure: eighteen times stronger than a Cr (Chromium) film and five times more potent than a gold nanoparticle composite with the same elastomeric polymer [9]. Furthermore, rapid heat diffusion to the surrounding medium is one of the main characteristics of CNTs [4]. Due to the nanometer spatial configuration of CNTs, thermal energy can be transferred to the adjacent expanding layer. Polydimethylsiloxane (PDMS) has been widely used as a thermally expanding layer because of its high thermal coefficient of volume expansion (α = 0.92 × 10⁻³ K−1) [6]. Therefore, when CNTs are heated, they immediately transfer most of their absorbed heat energy to the adjacent PDMS layer, which can cause rapid thermal expansion with a high amplitude [4]. LGFUS can produce high frequency (>15 MHz) and acoustic pressure of >50 MPa from a single element lens (6 mm in diameter) via a CNT and PDMS composite transducer on a concave surface [4]. Baac et al. confirmed that CNT-PDMS films can endure a higher optical fluence than a chromium (Cr) film, making them a perfect composite film to apply the maximum available laser energy to optoacoustic excitation. The structural characteristics of the lamination layers define them as excellent materials for high amplitude and high-frequency ultrasound generation [10].
LGFUS has used different techniques to generate shock waves and investigate the effect of different physical parameters on shock wave characteristics. Baac et al. used a small optoacoustic lens of varying diameters to determine the peak positive and negative pressure of the focal waveform (6 mm and 12 mm) and attained a maximum positive pressure of more than 50 MPa [4]. Richard et al. utilized functionalized CNTs and dissolved them into a PDMS solvent before coating them on a substrate. They employed planar optical fibers as the substrate and achieved maximum pressures of 3.6 MPa and 4.5 MPa [11]. Furthermore, experiments using CNTs of different diameters and tube lengths were also carried out to investigate the effect of the thermal conductivity of CNTs on the performance of optoacoustic transducers, resulting in CNTs with a diameter and length of 8 nm and 10–30   μ m, respectively [12]. Yixuan et al. used different thicknesses of CNT-PDMS composites on pure PDMS to discover better-performing transducers and found a decrease in the thermal conductivity of composite transducers due to a reduction in the thickness of the CNT film [13]. In another study, the characteristics of LGFUS were evaluated using a perforated photoacoustic lens, and a peak positive pressure of 46.5 MPa was attained [14]. These studies provide significant knowledge and an understanding of the CNT-PDMS composite structure and its relative impacts on shock wave characteristics. However, no study has been conducted on the characterization of shock waves using composite transducers with diameters that are more practical to use (up to 8 cm or more) in order to understand their relative effect on the properties of shock waves.
CNT-PDMS composite transducers are a promising modality in the field of optoacoustic transducers due to their exceptional heat conduction and expansion properties. They can generate high optoacoustic pressure at the focal point. Shock waves, one of the characteristic features of acoustics, are used for many therapeutic purposes, including histotripsy and shock wave lithotripsy for kidney and liver stones [15,16]. Therefore, optoacoustic transducers are another effective way of generating shock waves with similar or improved properties for use in different applications with improved performance.
This paper investigates the effect of changing diameter in a CNT-PDMS composite transducer on the peak amplitude and properties of shock waves. The areas of interest are the maximum positive and negative pressure generation of shock waves at the focal point using larger diameters, compared to previous studies. The purpose of using larger diameters is to fabricate transducers with more suitable sizes and peak pressures at the focal point. Smaller diameters are beneficial for cell culture studies, but to further investigate the effect of shock waves, as well as acoustic attenuation and impedance, in transcranial studies, miniature composite transducers cannot be effectively used. Therefore, this paper aims to construct a CNT-PDMS composite transducer with maximum pressure generation using more practical diameters.

2. Materials and Methods

2.1. Fabrication of a CNT-PDMS Composite Transducer

To fabricate all composite transducers, concave-shaped polymethyl methacrylate (PMMA) was used as a substrate. Multiwalled CNTs (MWCNTs) (purity: 85%wt, 90%wt. refining, diameter: 5~20 nm, length: ~10 μ m) (Applied Carbon Nano, Pohang-si, Korea) were used for the thermal conductivity layers. PDMS (SYLGARD 184, Dow Silicones Corporations, Auburn, MI, USA) was used for an elastomeric heat expansion layer. MWCNTs were grown on a PMMA surface using a spray coating. The PDMS layer was then spin-coated on CNTs at 2000 rpm for 2 min. The PDMS was cured at 100 °C for 1 h. In the fabrication process, structural changes through producing different diameters were introduced: composite transducers with diameters of 2 cm, 5 cm, and 8 cm and with focal lengths of 1.4 cm, 5 cm, and 5 cm, respectively, were fabricated.

2.2. Experimental Setup

The experimental setup for optoacoustic wave signal generation and characterization is illustrated in Figure 1. A Q-switched Nd: YAG laser (STL-5000Q, Stratek, Anyang-si, Korea) was employed as an optical source with a wavelength of 532 nm and a pulse repetition frequency of 2 Hz. The diameter of the laser beam was initially 6 mm. It expanded up to 80 mm, increasing the distance from the composite transducer after passing through the beam expander. The composite transducer of interest was mounted inside a degassed water tank and aligned with the laser system. The laser beam has a spatial beam profile of Gaussian distribution with a much higher acoustic pressure at the center than the off-axis location [8]. A 0.2 mm needle hydrophone (NH0200, Precision Acoustics Ltd., Dorchester, UK) was aligned with an acoustic wave generation setup and immersed inside the degassed water tank for the acoustic signal measurement. The needle hydrophone was fixed on an XYZ base with adjustable handwheels to find the focal point and range of the acoustic pressure. The distance of the needle hydrophone from the composite transducer was kept to the focal length of the respective composite transducer. The acoustic wave signal recorded through the needle hydrophone was amplified using a preamplifier (HP Precision Acoustics. Ltd., Dorchester, UK) and fed to an oscilloscope (LT354, Lecroy, New York, NY, USA), which was connected to a personal computer to record the signal data. An external trigger from the laser system was employed to synchronize the time series of laser excitation with the data collected from the oscilloscope. Ultrasound wave signals received by the needle hydrophone were postprocessed to calculate the acoustic pressure and investigate for further characterization.

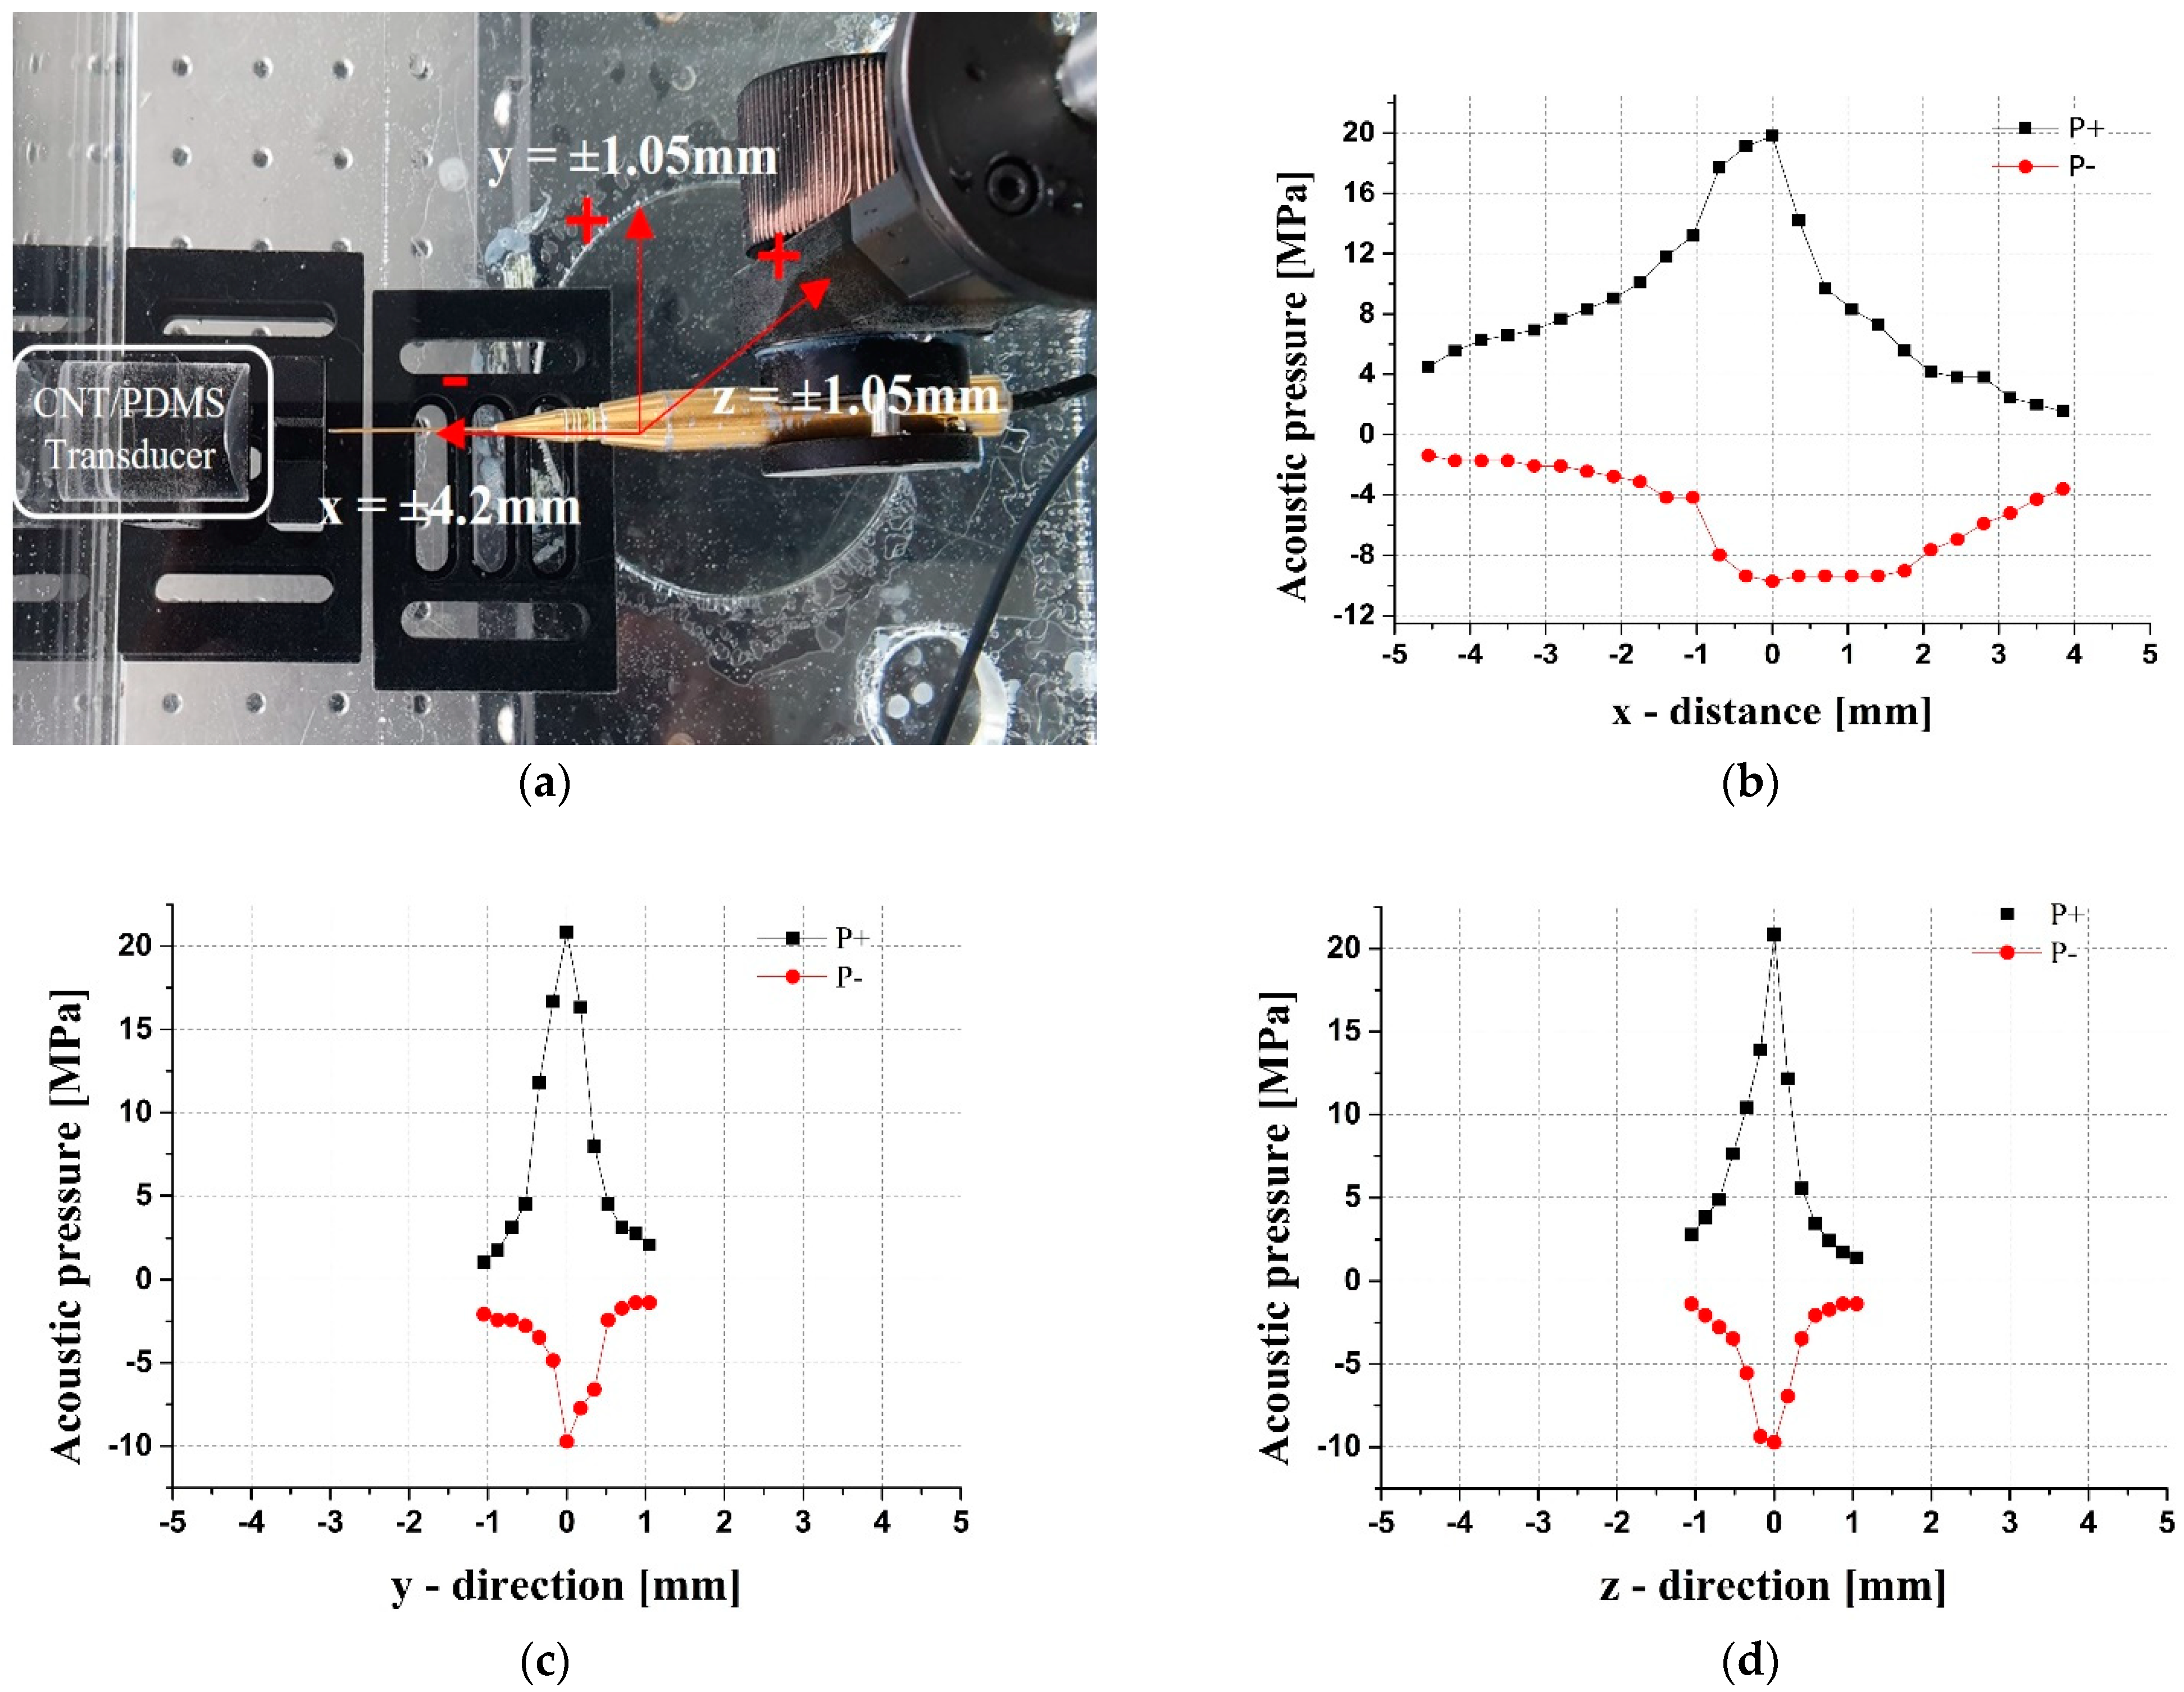
2.3. Measurement of Acoustic Intensity around Focal Point

The needle hydrophone was moved along x, y, and z planes to investigate the acoustic attenuation away from the focal point. Along x-axis (which is a wave propagation axis), the needle was moved in the range of ± 4.2 mm from the focal point. Along the y-axis and z-axis, the needle hydrophone was moved in the range of ± 1.05 mm concerning the focal point.

3. Results

3.1. Peak Amplitudes

A strong shock wave was observed at the focal point due to the nonlinear propagation of the wave pulse. Figure 2a–c shows the focal waveforms of the 2 cm, 5 cm, and 8 cm composite transducers, respectively. The positive peak pressures of the shock waveform correspond to 35 MPa, 42 MPa, and 53 MPa, respectively. Their corresponding negative pressures are −10 MPa, −22 MPa, and −25 MPa, respectively. The frequency spectra of these shock wave signals are shown in Figure 2d–f. The center frequencies, peak amplitudes, and −6 dB bandwidth values of the CNT-PDMS composite transducers are shown in Table 1. The center frequencies are between 4 and 6.5 MHz and the bandwidths between 6 and 7.8 MHz.

3.2. Relationship between Laser Energy and Acoustic Pressure

The relationship between laser energy and generated acoustic pressure is shown in Figure 3 through a linear curve fitting. The pressure amplitudes at focal points were measured for all the excited laser energy levels in all three transducers of different diameters (2 cm, 5 cm and 8 cm). The increased laser energy (mJ/pulse) increased positive and negative pressures in all CNT-PDMS composite transducers [17], except for the 2 cm diameter transducer, which showed a saturation at −10 MPa without any further increase in negative pressure with increasing laser energy [10]. Table 2 shows the values for the slopes, intercepts, and R2 of the linear fitting graphs shown in Figure 3. The R2 value closer to 1 shows a stronger linear relationship between the two values, except for the negative pressure curve for the 2 cm composite transducer.

3.3. Measurement Range of Shock Wave

The acoustic pressure at the axial and lateral directions is shown in Figure 4. Ultrasonic decay is observed away from the focal point. Figure 4b–d shows the fall in the amplitude of the shock wave away from the focal point. The needle hydrophone was moved forward and backward along the axial direction from the focal point to evaluate the pressure distribution. A peak positive pressure of 20 MPa and peak negative pressure of −10 MPa were observed at 0 mm with reference to the focal point (Figure 4b). When the needle hydrophone was moved along the y-axis, a peak positive acoustic pressure of ~20 MPa was observed, while a negative peak pressure of −10 MPa was also observed at 0 mm at the focal point (Figure 4c). Furthermore, when the needle hydrophone was shifted along the z-axis, a positive peak pressure of ~20 MPa and a negative peak pressure of −10 MPa were measured at 0 mm with reference to the focal point (Figure 4d). The CNT-PDMS composite transducer used for these measurements was 2 cm in diameter.

3.4. Prediction of Peak Amplitudes of the Shock Wave

Predicted peak amplitudes of the shock wave were formulated. In order to predict the peak amplitudes of the shock wave for composite transducers other than those with 2 cm, 5 cm and 8 cm diameters at higher laser energy values over 500 mJ/pulse, a predictive sound pressure equation was calculated. The predicted peak positive and negative amplitudes for composite transducers between 2 cm and 8 cm were calculated by linear fitting the measured values of laser energies at 600 mJ/pulse, 700 mJ/pulse, and 800 mJ/pulse, as shown in Equations (1) and (2). The calculated root mean square (RMS) errors of Equations (1) and (2) are 1.7 MPa and 1.2 MPa, respectively:
Predict   P + [ MPa ] = ( 0.00775 E 3.13 ) D + 28
Predict   P [ MPa ] = ( 0.00425 E 0.468 ) D 5.35
E = laser energy in mJ/pulse, D = diameter of transducer in cm.
The predicted and measured peak amplitudes of the shock waves are shown in Figure 5. The broken lines and the marks correspond to the predicted and measured positive and negative pressures of the shock waves, respectively. They show an agreement between the predicted and experimental values. For the 5 cm and 8 cm diameters, the measured values show a slight difference from the predicted values. For the 5 cm diameter, the measured positive pressures are a little lower than the predicted values, while the measured negative pressures are higher than the predicted values.

4. Discussion

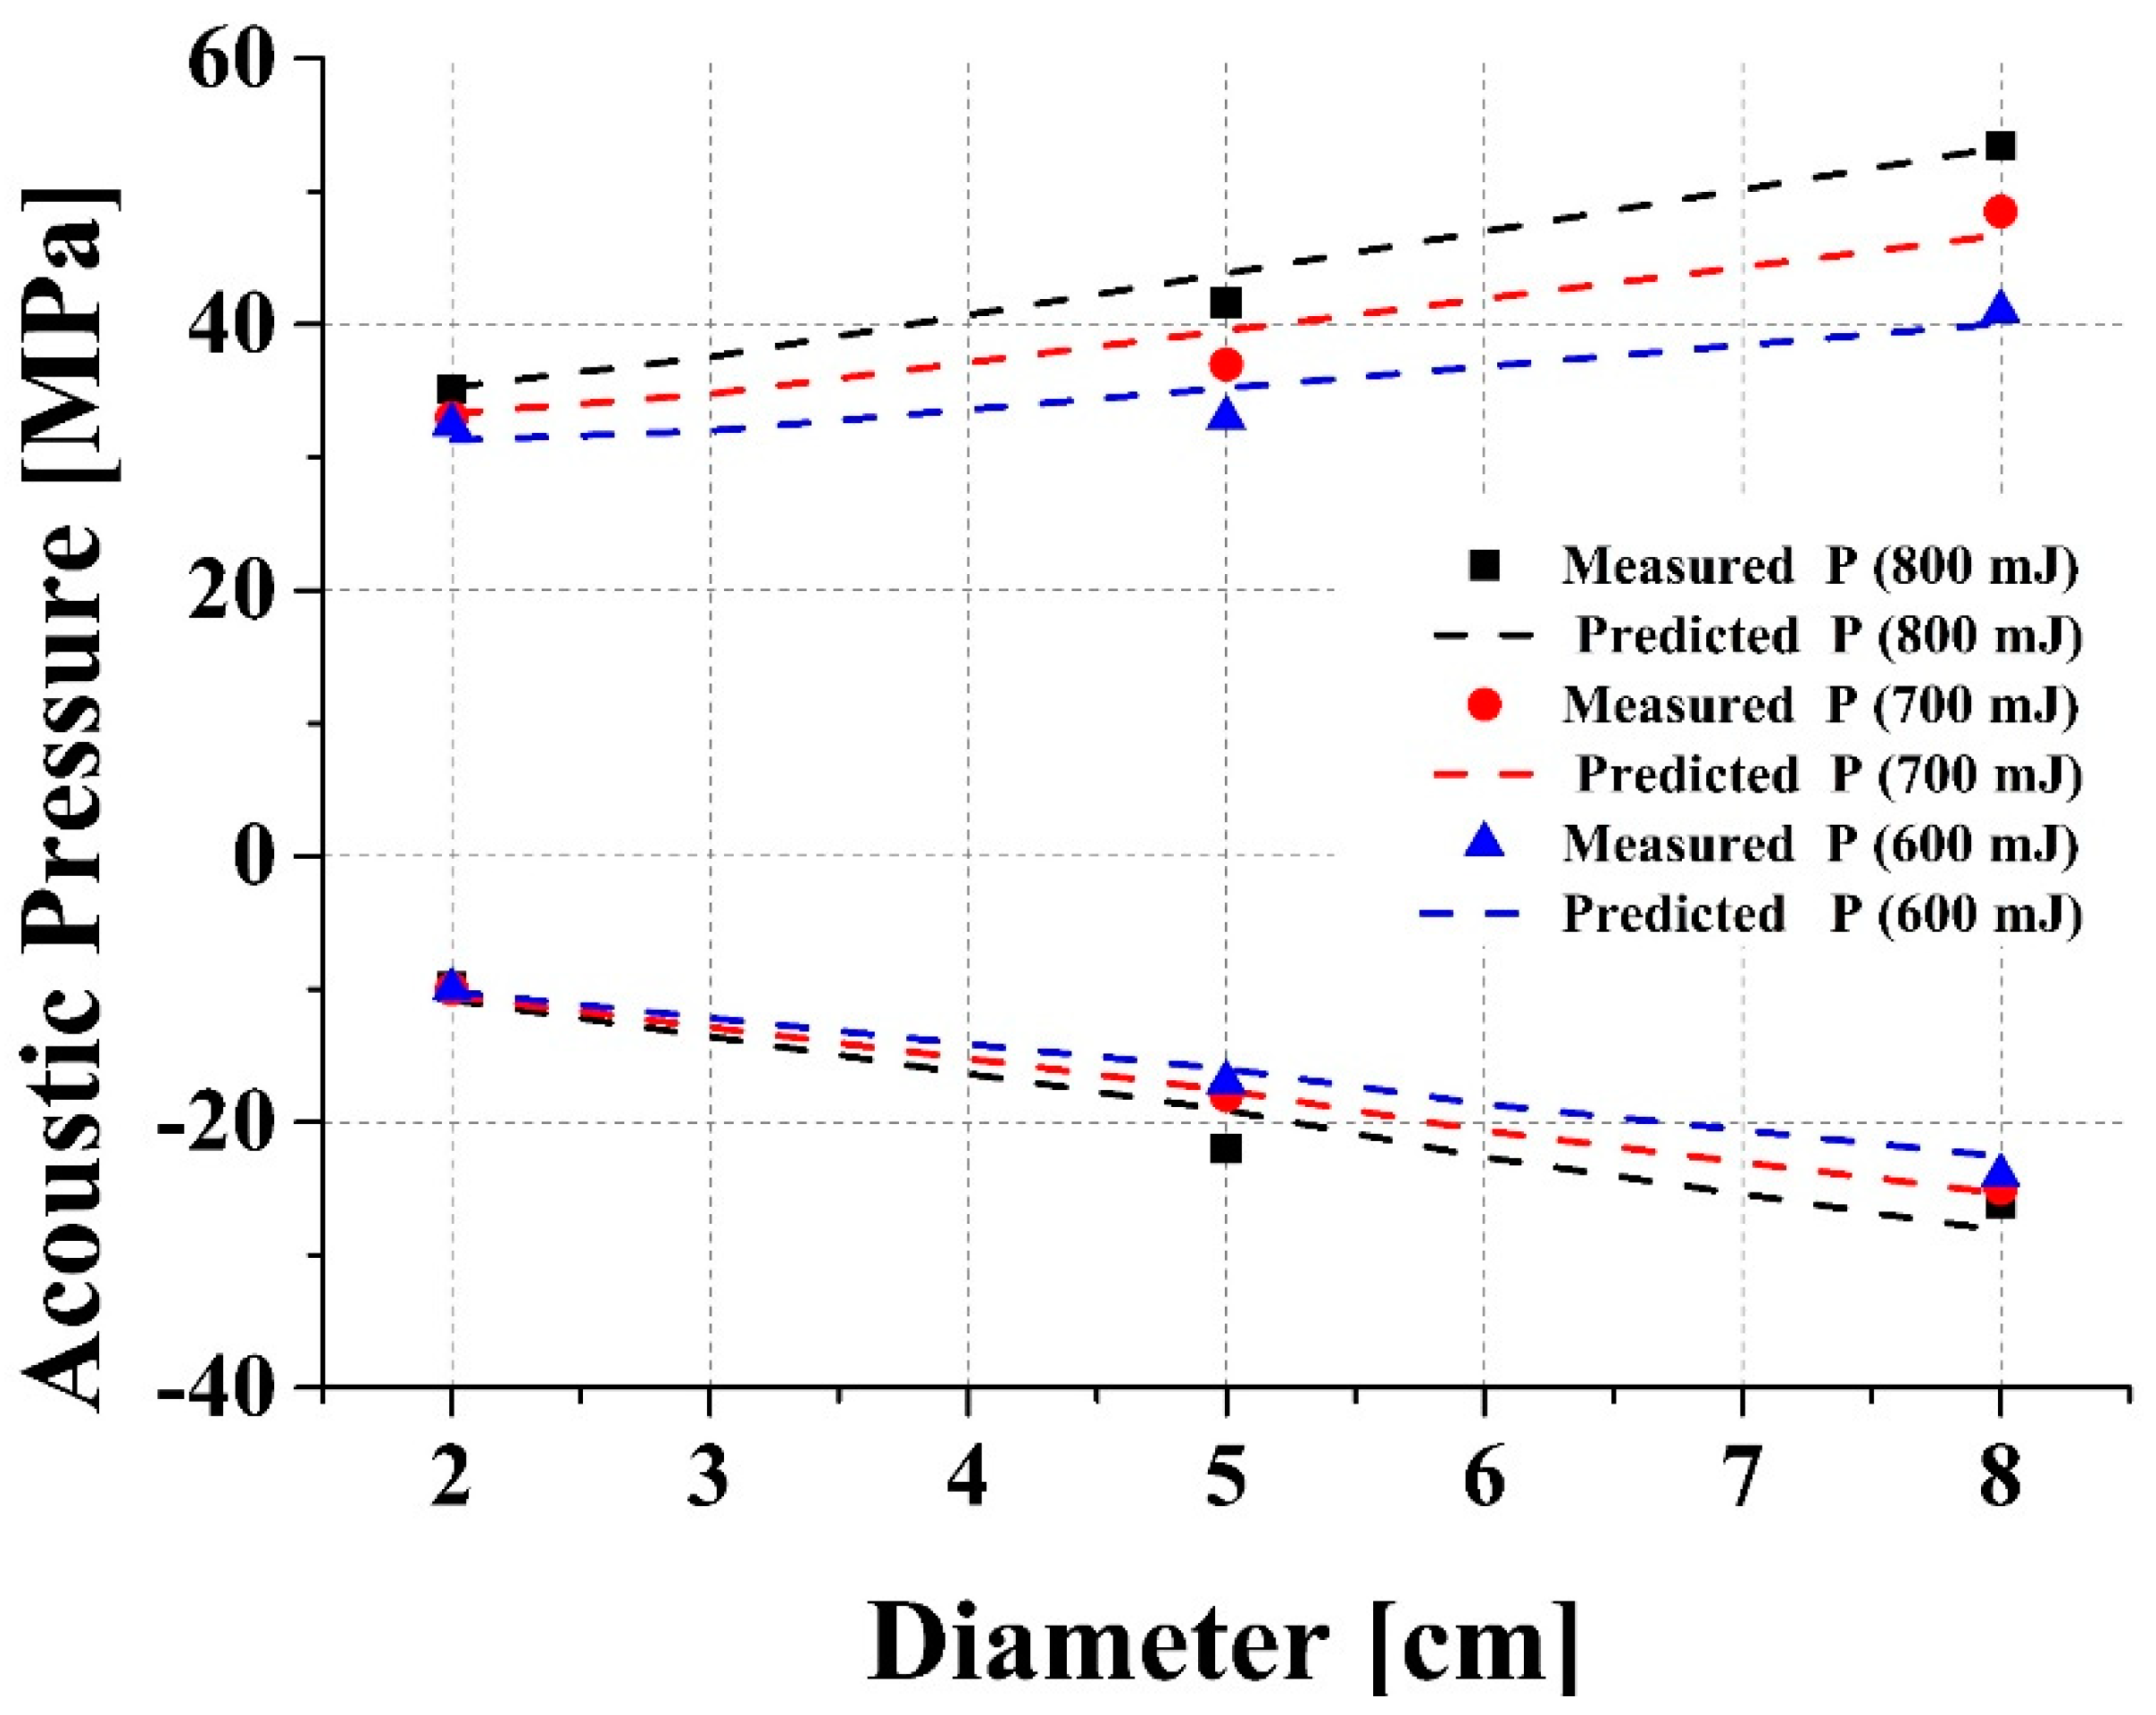
In this study, composite transducers with larger diameters (2 cm, 5 cm, and 8 cm) were used for the experiments, and higher peak amplitudes of the shock waves were successfully achieved. The three optoacoustic transducers exhibited a similar pattern of increased peak pressures with an increase in diameter. As the diameter of the transducer increases, the expansion of the laser energy also increases, resulting in higher peak pressures. Under the same laser energy (800 mJ/pulse), the transducer with an 8 cm diameter produced the maximum positive and negative amplitudes of 53 MPa and −25 MPa, respectively. The laser-generated acoustic pressure increased with the increased input of laser energy. The higher amplitudes of shock waves obtained in this study have the potential for utilization in many applications, such as transcranial studies.
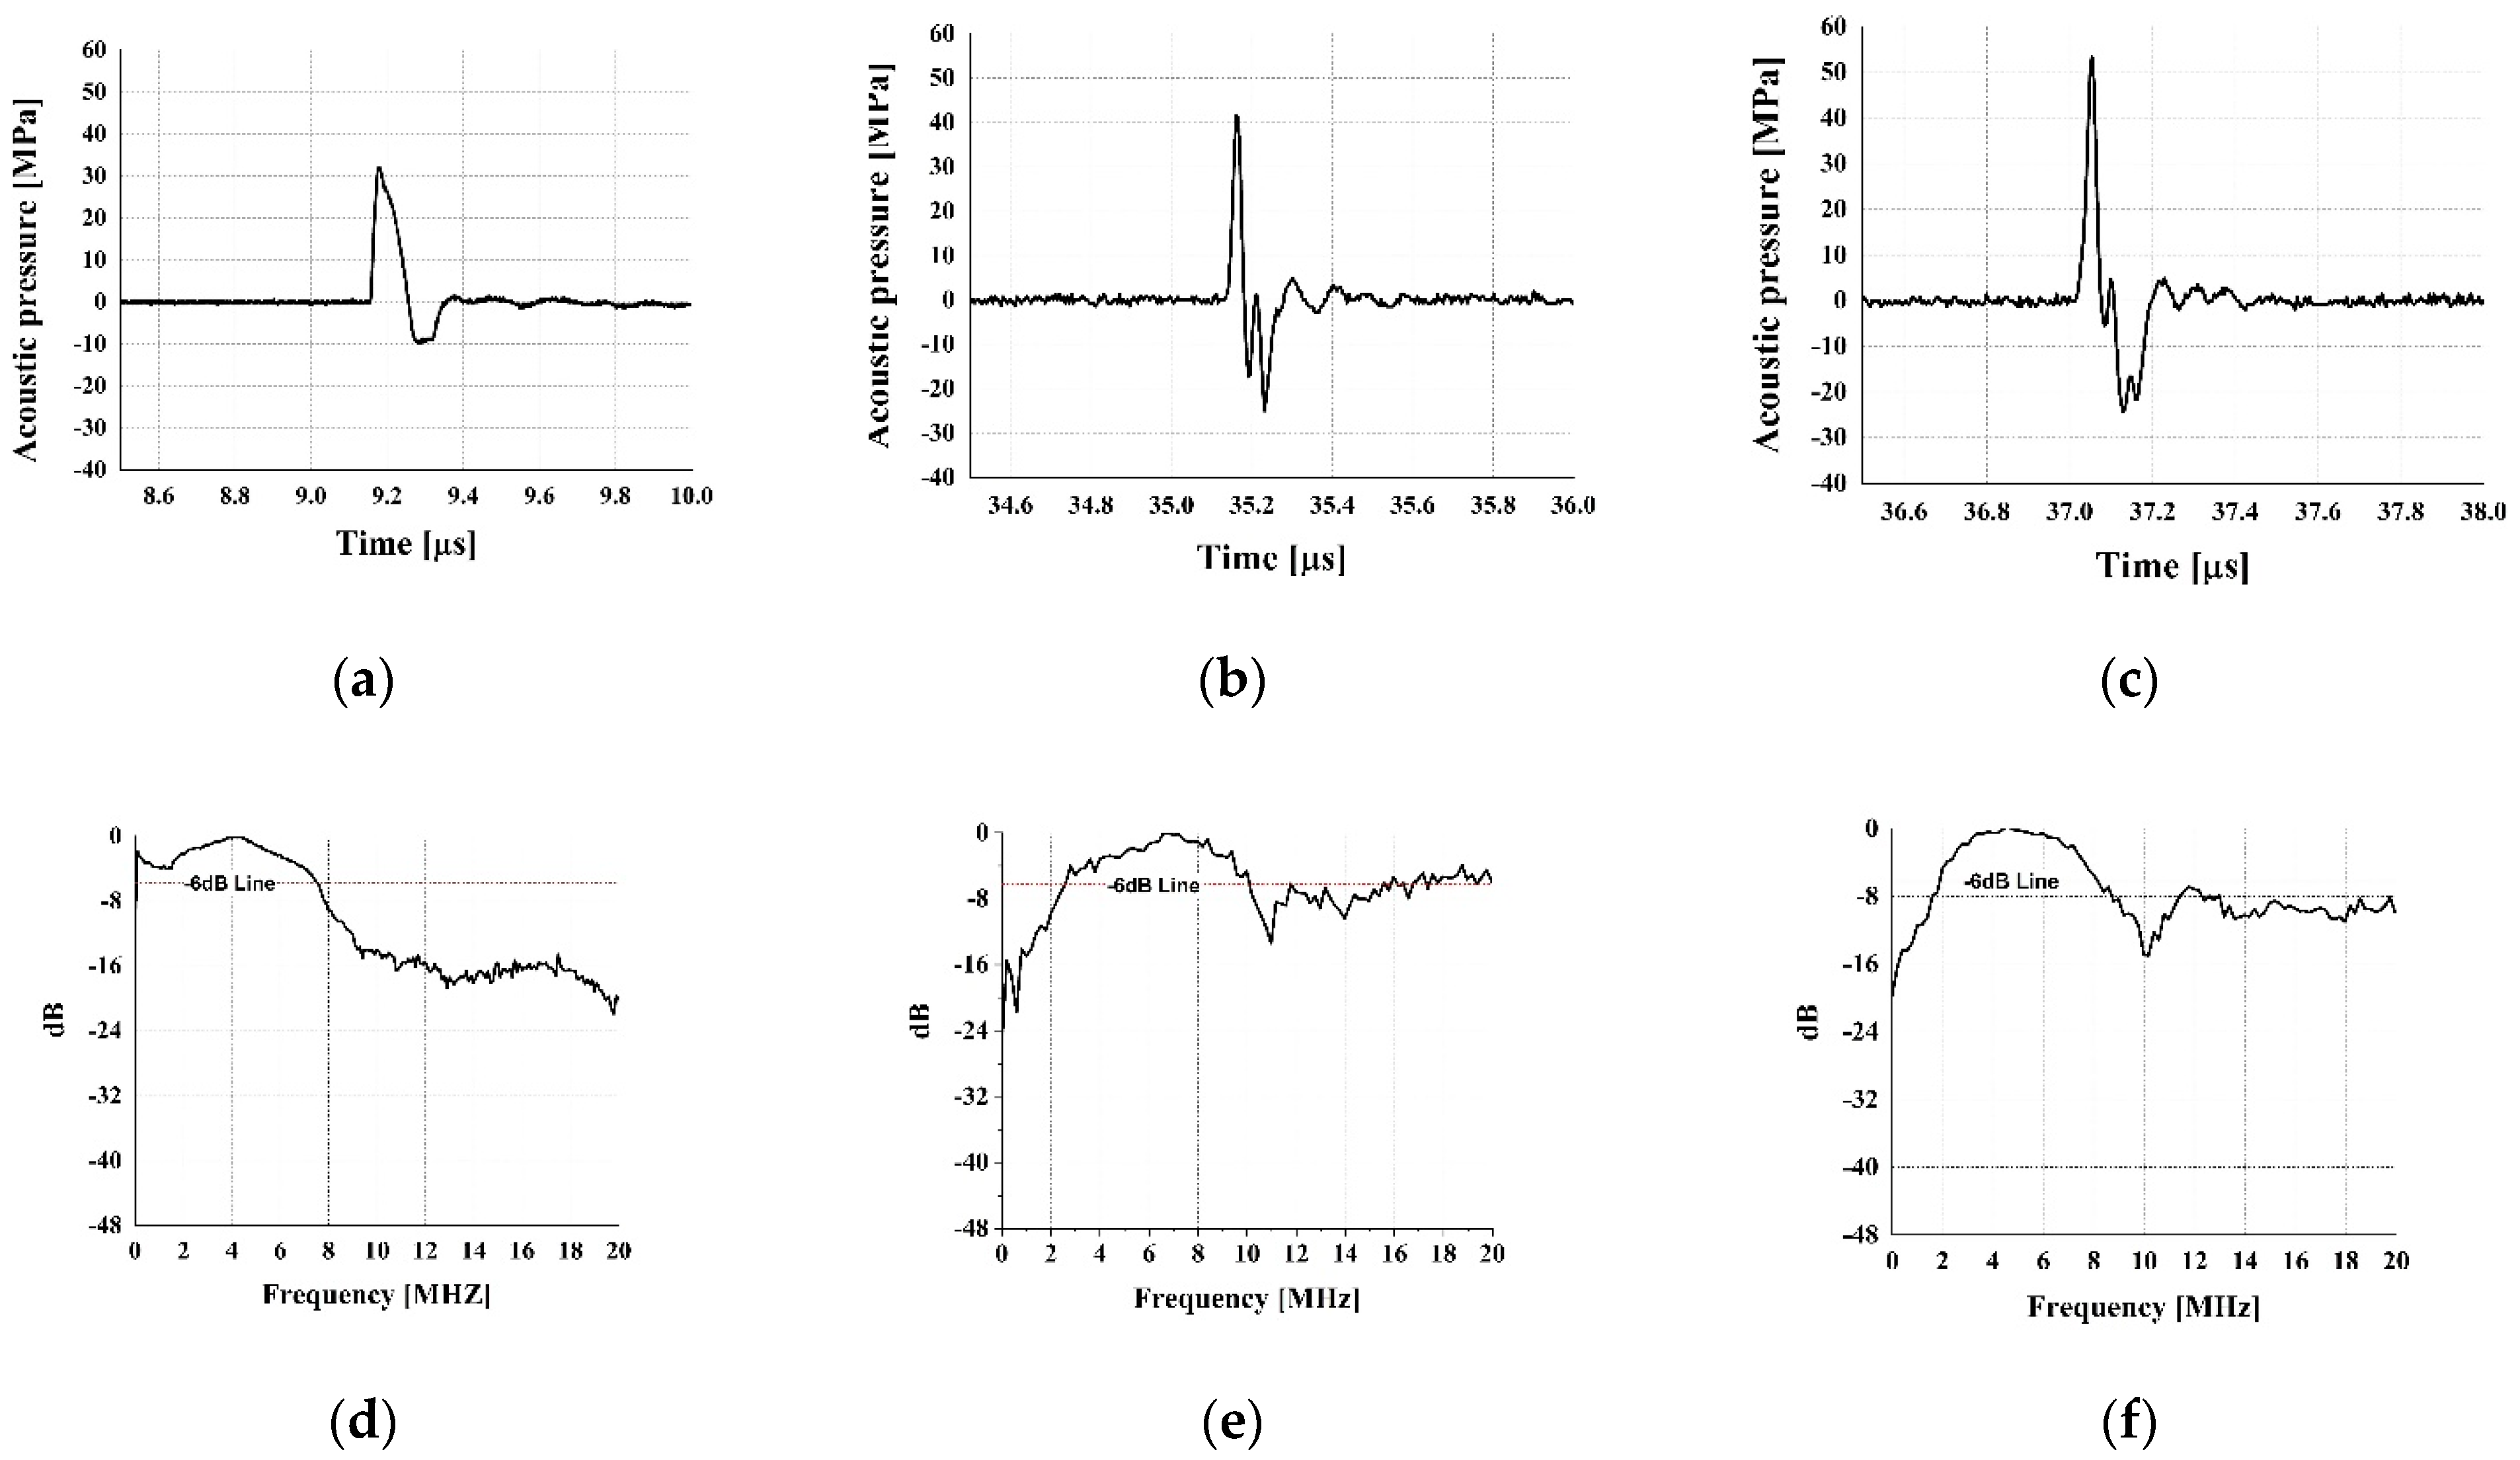
The pattern of the shock waves was similar in all three transducers. Optoacoustic-generated shock waves have a very short duration of 0.1~0.4   μ s [2] compared to shock waves from other sources (electrohydraulic, electromagnetic, and piezoelectric) [15,16]. The shock wave observed in this study showed a duration of 0.2   μ s . (Figure 2). The characteristic feature of the shock wave with a broad frequency distribution was observed in the frequency domain of the signals. In Figure 2, the frequency spectra show a similar pattern with a center frequency and −6 dB bandwidth less than 10 MHz, although the composite transducer with a 2 cm diameter shows large amounts of energy at a frequency range of less than 2 MHz. In another study involving smaller transducers with diameters in millimeters, similar peak amplitudes and spectra were achieved but at a higher center frequency of around 20 MHz [4].
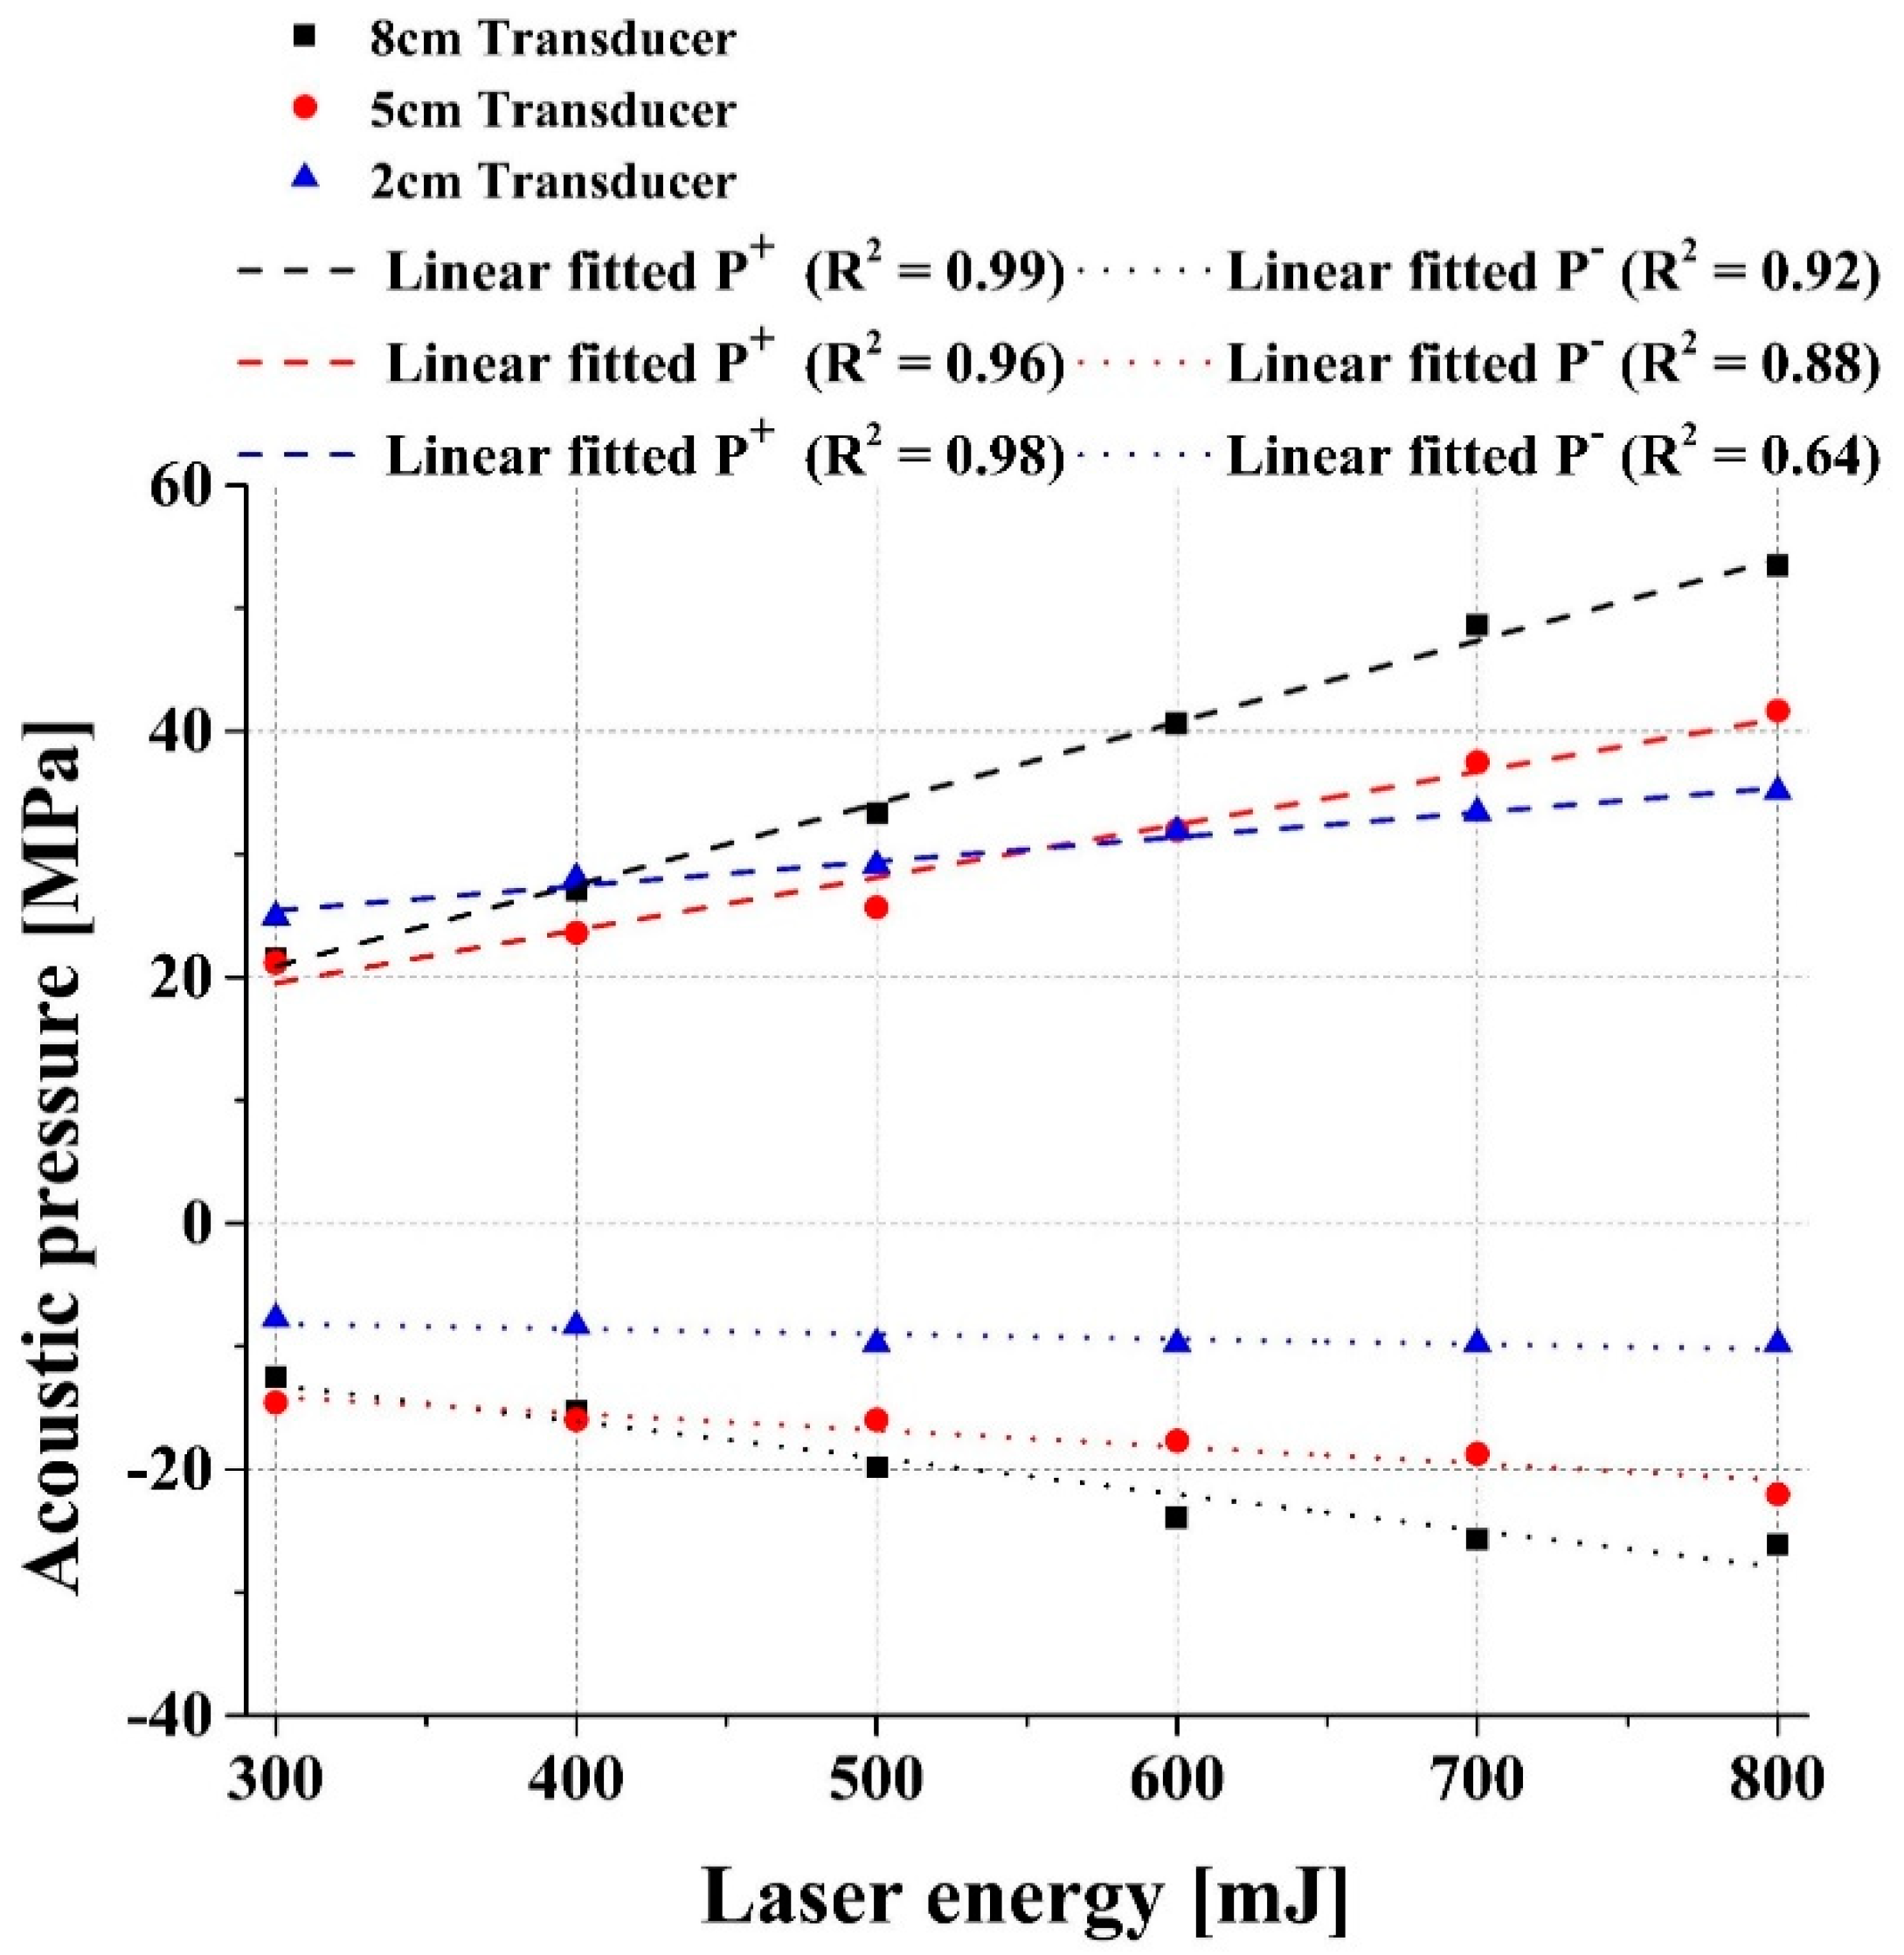
As shock waves constitute higher frequency components, they attenuate faster at high frequencies [8]. This explains the faster decay of the shock wave. When the relationship between laser energy and different diameters of the composite transducer was analyzed, it was observed that the measured peak pressures have a linear relationship with the laser energy, which is also confirmed in previous studies [18]. However, in negative peak pressures, the 2 cm transducer was saturated at higher laser energy levels (Figure 3) [10]. We observed another important phenomenon: at a lower laser energy, the 5 cm and 8 cm transducers show almost similar positive and negative pressures, but when the laser energy is increased, there is a difference between the peak pressures. The CNT-PDMS films could withstand higher optical fluence, and this endurance of CNT-PDMS makes it possible to increase the laser energy to the maximum available optical energy [10]. Otherwise, materials with less laser fluence can be damaged when the laser beam’s energy is increased [2].
Figure 5 shows an agreement between the measured and predicted peak amplitudes of the shock waves with the different diameters of the CNT-PDMS composite transducers. The reference laser energy values used for predicting peak amplitudes are higher values over 600 mJ/pulse. In an experimental setting, higher energy values are usually employed as it is useful to make predictions at these levels. For lower energy values, there is little difference; therefore, it is not very practical to make predictions at these levels.
The comparison between the shock wave signal of the CNT-PDMS composite transducer and extracorporeal shock wave therapy (ESWT) shows that the former has a narrower beam width than the latter. The shock wave generated by the CNT-PDMS composite transducer has a beam width of 2.5 mm in the axial direction and 0.70 mm in the lateral direction (Figure 4). On the other hand, the beam width of ESWT measured in [19] is 14 mm in the axial direction and 2 mm in the lateral direction. It shows that shock waves generated through optoacoustic effects achieve a tighter focus than those generated through other sources. Moreover, in ESWT, the long negative trailing phase of the shock wave appears before the geometric focal point towards the face of the transducer, while in the CNT-PDMS composite transducer, the trailing negative phase of the shock wave is at the focal point increasing the focal depth (Figure 4).
In the previous studies, smaller diameters were used but only for cell culture studies [4]. In order to construct a transducer that can be used for practical applications such as transcranial studies, larger diameters are required [9,20]. By using larger diameters, high pressures of shock waves were achieved in this study. Therefore, to improve laboratory work in practice, more suitable diameters with efficient performance are required. The experimental results of this study can be compared with simulation results in the future for further validation.

5. Conclusions

An experimental study was performed to investigate the relationship between the diameter of a composite transducer and peak amplitudes of the shock waves to fabricate a high-performance CNT-PDMS composite transducer. Composite transducers with larger diameters were used in the experiments. The maximum diameter used in this study was 8 cm, which achieved a peak positive and negative pressure of 53 MPa and −25 MPa, respectively, at the focal point. Furthermore, the comparative analysis shows that the CNT-PDMS composite transducer with a larger diameter achieved a narrow beam width at the focal point. The pressure of the shock wave also shows a linear relationship with the input laser energy. The results confirm that the generation of the shock wave through the optoacoustic method requires optimum heat absorbance and heat expansion of materials. These understandings provide technical advancement toward constructing efficient optoacoustic transducers for optimum ultrasound generation.

Author Contributions

Conceptualization, J.L., D.-G.P.; methodology, J.L.; software, J.L.; validation, D.-G.P.; formal analysis, J.L.; investigation, J.L., S.B.Z.; resources, D.-G.P.; data curation, J.L.; writing—original draft preparation, S.B.Z.; writing—review and editing, S.B.Z.; visualization, S.B.Z., J.L.; supervision, D.-G.P.; project administration, D.-G.P.; funding acquisition, D.-G.P. All authors have read and agreed to the published version of the manuscript.

Funding

This work was supported by the Focused Ultrasound Foundation and the National Research Foundation of Korea (NRF) grants funded by the Korea government (MSIT) (No. 2018R1A2B2007997 and No. 2022R1A5A1022977).

Institutional Review Board Statement

Not applicable.

Informed Consent Statement

Not applicable.

Data Availability Statement

Not applicable.

Acknowledgments

The authors thank Hafiz Muhammad Umer Farooqi, who helped to review this paper.

Conflicts of Interest

The authors declared no conflict of interest.

References

  1. Buma, T.; Spisar, M.; O’Donnell, O. High-frequency ultrasound array element using thermoelastic expansion in an elastomeric film. Appl. Phys. Lett. 2001, 79, 548–550. [Google Scholar] [CrossRef]
  2. Lee, T.; Baac, H.W.; Li, Q.; Guo, L.J. Efficient Photoacoustic Conversion in Optical Nanomaterials and Composites. Adv. Opt. Mater. 2018, 6, 1800491. [Google Scholar] [CrossRef]
  3. White, R.M. Generation of Elastic Waves by Transient Surface Heating. J. Appl. Phys. 1963, 34, 3559–3567. [Google Scholar] [CrossRef]
  4. Baac, H.W.; Ok, J.G.; Maxwell, A.; Lee, K.-T.; Chen, Y.-C.; Hart, A.J.; Xu, Z.; Yoon, E.; Guo, L.J. Carbon-Nanotube Optoacoustic Lens for Focused Ultrasound Generation and High-Precision Targeted Therapy. Sci. Rep. 2012, 2, 989. [Google Scholar] [CrossRef] [PubMed]
  5. Miranda, I.; Souza, A.; Sousa, P.; Ribeiro, J.; Castanheira, E.M.S.; Lima, R.; Minas, G. Properties and Applications of PDMS for Biomedical Engineering: A Review. J. Funct. Biomater. 2022, 13, 2. [Google Scholar] [CrossRef] [PubMed]
  6. Chang, W.-Y.; Huang, W.; Kim, J.; Li, S.; Jiang, X. Candle soot nanoparticles-polydimethylsiloxane composites for laser ultrasound transducers. Appl. Phys. Lett. 2015, 107, 161903. [Google Scholar] [CrossRef] [Green Version]
  7. Shi, H.; Ok, J.G.; Won Baac, H.; Jay Guo, L. Low density carbon nanotube forest as an index-matched and near perfect absorption coating. Appl. Phys. Lett. 2011, 99, 211103. [Google Scholar] [CrossRef] [Green Version]
  8. Hsieh, B.-Y.; Kim, J.; Zhu, J.; Li, S.; Zhang, X.; Jiang, X. A laser ultrasound transducer using carbon nanofibers–polydimethylsiloxane composite thin film. Appl. Phys. Lett. 2015, 106, 021902. [Google Scholar] [CrossRef] [Green Version]
  9. Won Baac, H.; Ok, J.G.; Park, H.J.; Ling, T.; Chen, S.-L.; Hart, A.J.; Guo, L.J. Carbon nanotube composite optoacoustic transmitters for strong and high frequency ultrasound generation. Appl. Phys. Lett. 2010, 97, 234104. [Google Scholar] [CrossRef] [PubMed] [Green Version]
  10. Baac, H.W.; Ok, J.G.; Lee, T.; Jay Guo, L. Nano-structural characteristics of carbon nanotube–polymer composite films for high-amplitude optoacoustic generation. Nanoscale 2015, 7, 14460–14468. [Google Scholar] [CrossRef] [PubMed]
  11. Colchester, R.J.; Mosse, C.A.; Bhachu, D.S.; Bear, J.C.; Carmalt, C.J.; Parkin, I.P.; Treeby, B.E.; Papakonstantinou, I.; Desjardins, A.E. Laser-generated ultrasound with optical fibres using functionalised carbon nanotube composite coatings. Appl. Phys. Lett. 2014, 104, 173502. [Google Scholar] [CrossRef] [Green Version]
  12. Li, J.; Lan, X.; Lei, S.; Ou-Yang, J.; Yang, X.; Zhu, B. Effects of carbon nanotube thermal conductivity on optoacoustic transducer performance. Carbon 2019, 145, 112–118. [Google Scholar] [CrossRef]
  13. Li, Y.; Song, A.; Qiu, W.; Gong, S.; Wu, D.; Xiao, Z.; Jiang, Y.; Zhu, Z. Electrical characterization of flexible CNT/polydimethylsiloxane composite films with finite thickness. Carbon 2019, 154, 439–447. [Google Scholar] [CrossRef]
  14. Heo, J.; Biswas, D.; Park, K.K.; Son, D.; Park, H.J.; Baac, H.W. Laser-generated focused ultrasound transducer using a perforated photoacoustic lens for tissue characterization. Biomed. Opt. Express 2021, 12, 1375–1390. [Google Scholar] [CrossRef] [PubMed]
  15. Cleveland, R.O.; McAteer, J.A. Physics of Shock-Wave Lithotripsy. In Smith’s Textbook of Endourology; John Wiley & Sons Ltd.: New York, NY, USA, 2012; pp. 527–558. [Google Scholar]
  16. Xu, Z.; Hall, T.L.; Vlaisavljevich, E.; Lee, F.T. Histotripsy: The first noninvasive, non-ionizing, non-thermal ablation technique based on ultrasound. Int. J. Hyperth. 2021, 38, 561–575. [Google Scholar] [CrossRef] [PubMed]
  17. Tong, L.H.; Lim, C.W.; Li, Y.C. Generation of High-Intensity Focused Ultrasound by Carbon Nanotube Opto-Acoustic Lens. J. Appl. Mech. 2014, 81, 081014. [Google Scholar] [CrossRef]
  18. Moon, C.; Fan, X.; Ha, K.; Kim, D. Generation of planar blast waves using carbon nanotubes-poly-dimethylsiloxane optoacoustic transducer. AIP Adv. 2017, 7, 015107. [Google Scholar] [CrossRef] [Green Version]
  19. Kang, K.-S. Acoustic and Optical Characteristics of Cavitation Bubble Clouds Produced by Shock Wave Pulse; Jeju National University Graduate School: Jeju, Korea, 2018. [Google Scholar]
  20. Lee, J.; Paeng, D.-G.; Ha, K. Attenuation of the human skull at broadband frequencies by using a carbon nanotube composite photoacoustic transducer. J. Acoust. Soc. Am. 2020, 148, 1121–1129. [Google Scholar] [CrossRef] [PubMed]
Figure 1. (a) Experimental setup for shock wave generation and measurement. The CNT-PDMS composite transducer was mounted inside a degassed water tank and aligned with the laser system (Q-switched Nd: YAG laser (STL-5000Q, Stratek, Anyang-si, Korea). The needle hydrophone (NH0200, Precision Acoustics Ltd., Dorchester, UK) collected the shock wave signal generated from the CNT-PDMS composite transducer, which was then amplified by a pre-amplifier (HP Precision Acoustics. Ltd., Dorchester, UK) and sent to the oscilloscope (LT354, Lecroy, New York, NY, USA). The signal data from the oscilloscope were fed to a PC for analysis. (b) CNT-PDMS composite transducers of different sizes were used in the experiment. The top view of 2 cm, 5 cm, and 8 cm transducers, along with their side view, are presented.
Applsci 12 07300 g001
Figure 2. Graph representing the peak positive and negative pressures of the shock waves generated by CNT-PDMS composite transducers of different diameters. (ac) show the time domain signals, while (df) show the frequency domain analysis of the 2 cm, 5 cm, and 8 cm CNT-PDMS composite transducers, respectively.
Applsci 12 07300 g002
Figure 3. Linear curve fitting showing the relationship between laser energy and the acoustic pressure generated by CNT-PDMS composite transducers. It shows a linear relationship between laser energy and positive and negative acoustic pressures in all transducers, except the transducer with a 2 cm diameter, which shows saturation at −10 MPa in negative pressure with the increase in laser energy.
Applsci 12 07300 g003
Figure 4. (a) Experimental setup for measuring the focal point of the shock wave. The focal point was at 0 mm. (b) The peak positive and negative pressures were observed at 0 mm with reference to the focal point along the axial direction. (c) The peak pressures were observed at 0 mm with reference to the focal point along the y-direction. (d) The peak pressures along the z- direction were also observed at 0 mm with reference to the focal point.
Applsci 12 07300 g004
Figure 5. Scatter graph of predicted and experimental (measured) values of the CNT-PDMS composite transducer for different diameters. The dotted lines correspond to the predicted values, while the marks represent the measured values, indicating an agreement between them. This prediction was made at the energy levels of 600 mJ/pulse, 700 mJ/pulse, and 800 mJ/pulse.
Applsci 12 07300 g005
Table 1. Center frequencies, bandwidths, and peak positive and negative pressures of 2 cm, 5 cm, and 8 cm CNT-PDMS composite transducers.
Diameter
(cm)
Center Frequency (MHz)−6 dB Bandwidth (MHz) Peak Positive Pressure (MPa)Peak Negative Pressure (MPa)
2473510
56.57.84222
8565325
Table 2. R2, intercept, and slope values for 2 cm, 5 cm, and 8 cm transducers for both the positive and negative pressures presented in Figure 3.
Diameter (cm) Positive Negative
R2InterceptSlopeR2InterceptSlope
20.9819.450.0190.64−6.93−0.004
50.966.640.0430.88−10.08−0.0135
80.991.0390.0660.92−4.29−0.029
Publisher’s Note: MDPI stays neutral with regard to jurisdictional claims in published maps and institutional affiliations.

