1. Introduction
Science and technology talents constitute the future and hope of science and the foundation of a country’s independent scientific research and technological innovation. Therefore, the cultivation and effective management of science and technology talents, along with their evaluation, will make an important contribution to the development of the country’s economy and an improvement in its national, regional and organizational competitiveness.
Much of the literature studying technology firms and technology talent is worthwhile. There is a U-shaped curve relationship between international talent and corporate innovation performance and strengthening the embeddedness of international talent within a company can enhance its innovation capability [
1]. Companies should pay attention to the psychological needs of knowledge-based talents and make management innovations to absorb and retain them to promote the joint development of companies and talents, where business execution, teamwork, strategic thinking and management decision making are key competencies for innovation and entrepreneurship [
2]. Digitization is leading to a strong convergence of digital technologies and supply management executives, making the division of roles clearer and supply chain management executive talent will dominate in the future [
3]. More than 40% of distinguished young academics have mobility experience, so technology mobility policies, career environment development and institutional reputation and treatment have a strong impact on talent [
4]. Talent’s social media skills, business analytics and knowledge exploration and knowledge utilization are positively correlated [
5]. The emphasis on cost leadership and differentiation is positively associated with firm performance, but marketing and technological capabilities are the main and dynamic drivers of firm performance [
6]. High-tech companies are exposed to eight dimensions of risk, including technology risk, capital risk, patent risk, talent risk, management risk, policy risk, industry risk and market risk, while achieving high returns through technological innovation [
7]. Universities, although they gather many elites and train talents for the country, do not have enough experience in technology transfer or networks in industry and should focus on technology transfer activities, whose technology market applicability, attitude and ability of talents are key factors [
8]. In enhancing corporate innovation, attention should be paid to macro regulation and supervision of green technologies, optimization of environmental management, strengthening of incentives for green innovation talents and strengthening of green technology R&D and service centers [
9]. Artificial intelligence contributes most to corporate performance, and companies should intentionally increase the requirements for artificial intelligence when recruiting new talent [
10]. A sample of Nobel laureates found that family democracy, family size and family function drive the responsibility of innovative talent, so it is important to promote the positive impact of early growth experiences on personality [
11]. “University-industry” collaboration does not enhance innovation performance equally in all regions, but is moderated by region-specific absorptive capacity dimensions [
12]. Government policies in support of talent positively influence innovation attitudes, subjective norms and perceived behavioral control of talent in organizations [
13]. AI significantly promotes technological innovation controlling for R&D investment, foreign direct investment, ownership structure and intensity of technological imitation [
14]. The improvement in regional carbon efficiency is crucial for regional ecological protection and plans to build a leading demonstration belt of ecological civilization [
15]. Firm ecology and competitive environment are key elements for innovation ecosystems to capture value and achieve innovation breakthroughs [
16]. HRM research can be divided into three themes, namely HR enablers (technical and organizational), HR applications (description and diagnosis) and HR value (organizational value and talent value) [
17]. An inclusive work environment fosters employee loyalty to the company and leads to greater employee involvement in innovative activities [
18]. The international competitiveness of China’s service trade is analyzed using the International Market Share Index, the Displayed Comparative Advantage Index and the Trade Competitiveness Index [
19]. Companies should improve their technology, talent, data governance, model development and service innovation capabilities based on digital domain research and manage service systems with advanced analytics [
20].
Through the study, we recognize that the level of internationalization, psychological needs, social media skills, mobility experience and marketing skills of the tech talent themselves are crucial to corporate innovation, while digital technologies, green innovation technologies, artificial intelligence technologies, ecological environment, competitive environment, inclusive environment and the service concept are also crucial to strengthen innovation factors from the perspective of R&D institutions and companies, and to consider the innovation. It is also critical to consider the many risk factors in the process of innovation and decision making. When considering institutional factors, talent factors, as well as decision psychology and decision risks, we need some relevant theories to help solve the practical problems in talent performance assessment.
In 1979, Tversky and Kahneman proposed the prospect theory, and in 1992, they proposed the cumulative prospect theory based on the prospect theory [
21,
22]. These theories provide the behavioral decision model under new risk conditions and not only have implications for psychology but also potential to strengthen the relationship with other disciplines, such as economics, philosophy and risk management, among many others. The reference point of prospect theory is important. When making decisions, individuals refer not just to the absolute utility value of various possible outcomes of the decision-making scheme, but also to an existing psychological neutral base point, which is known as the reference point. Upon the basis of the reference point, the decision result is understood to be the deviation direction and extent of the actual profit (loss) and the psychological reference point. The study of the reference point is divided into single, double, triple, quadruple and multiple reference points according to the number of reference points.
Mellers et al. suggested that loss aversion and gain seeking can be reconciled by moderating the reference point [
23]. Jiang et al. proposed a dynamic gray target performance assessment model for new R&D institutions based on four assessment indicators, three reference points and four stages [
24]. Choi et al., in their study on consumption and portfolio choice problems in economic agents with irreversible consumption, found that the consumer’s previous consumption level is the reference point [
25].
The social reference point is indirect and hypothetically relative and contrasts with the personal reference point, which is direct, authentic and absolute. Kibris et al. proposed a decision model based on maximizing conspicuousness ranking to determine the reference point, reflecting the prominence or compellingness of the alternative relative to other alternatives [
26]. Hashidate et al. examined how context dependence affects social image concerns, and in particular, how decision makers exhibit a variety of social emotions stemming from their intrinsic reference points that may not be manifested through conformity to social norms [
27]. Shoham et al. proposed that the choice of reference points can be influenced not only by personal characteristics, situational factors and goals, but also by the attributes of the decision maker’s performance feedback itself, and that one can use social or personal information as a reference point for comparison [
28]. Siebold argued that an organization’s key stakeholders—beneficiaries, donors, customers, employees, partners, competitors and governments—can be reference points upon which an organization innovates its business model to increase its social impact [
29]. Ruiz et al. developed compensatory indicators for multiple reference points, based on weak and strong sustainability, and created different compensation indices for each indicator [
30]. In real life, reference points are used at every stage of the evaluation of science and technology talents. In the introduction stage, scientific and technological organizations determine the wage of recruited science and technology talents in accordance with their own reference points, and science and technology talents draw on their own reference points when deciding whether to join scientific and technological organizations. While the findings from research on the reference point are rich, they are rarely applied to the evaluation of science and technology talents.
The grey target theory is the application and embodiment of the non-uniqueness principle in the grey system theory in decision-making, with high achievement in the past 20 years. According to the grey target theory, Liu Sifeng proposed a weighted multi-attribute grey target decision model and uniform effect measure functions [
31]. The critical value of the grey target was set as the positive and negative boundary point of the uniform effect measure function. The decision-making objectives with different meanings, dimensions and properties were transformed into uniform effect measure and comprehensive effect measure. In this method, the cases of hitting the target and missing the target are fully considered. The differentiation in the comprehensive effect measure is greatly improved. This method has been widely used. Based on the methods of grey system theory, Xi Shasha discussed the decision-making problem of the indicator with the interval grey number in practical problems [
32]. Li Peng constructed a new grey target model, which considers the concepts of encouragement and punishment [
33]. Li Ye proposed a multi-attribute group grey target decision-making method based on a three-parameter interval grey number, which takes into account the value information of the three-parameter interval grey number and the risk attitude of decision-makers [
34]. Having advantages and universality, the grey target method can be used in evaluation, selection and inspection, and can also take into account linguistic representation and uncertainty representation.
This study draws on the aforementioned research reference points to evaluate science and technology talents. It initially researches on science and technology talents and then establishes input and output indicators for science and technology talents, and then considers dominant and implicit reference points that relate to the indicators. A number of reference points that consider the ‘dominant-implicit’ dual reference are used to establish a grey target evaluation model for science and technology talents and a case is then finally applied.
2. Consider the ‘Dominant-Implicit’ Reference Point Setting for the Assessment of Science and Technology Talents from the Perspective of ‘Input-Output’
The input and output of science and technology talents have always been the focus of scholars’ research and key to the evaluation of science and technology talents.
The 13th Five-Year National Science and Technology Talents Development Plan observes that the country’s development of science and technology talents is still undermined by insufficient overall investment in science and technology talents and uneven distribution in industries, fields and regions. The input mechanism of multi-talents should be improved and the top-level design of the structure and layout of science and technology talents strengthened. The indicators of intellectual investment in science and technology mainly include salary, welfare, housing, technological infrastructure, insurance, professional titles, promotion of science and technology, funds, human concern and cultivation. This paper selects three annualized indicators (salary, insurance and welfare) and two one-time indicators (housing and funds) and applies them alongside each other to constitute the input indicators of science and technology talents (
Figure 1).
The State Council’s
Opinions on Deepening the Reform of Project Evaluation, Talent Evaluation and Organization Evaluation argues for the scientific establishment of talent evaluation indicators and increasing the stable support for excellent talents and teams. Furthermore, the State Council’s
Notice on Measures to Optimize Scientific Research Management and Improve Scientific Research Performance proposes that the issue of ‘evaluating talents by only papers, only professional titles and only academic qualifications’ should be resolved and proposes the establishment of a performance evaluation system grounded on innovation quality and contribution. As
Figure 2 shows, the output of science and technology talents mainly includes paper, project, profit, influence and ability.
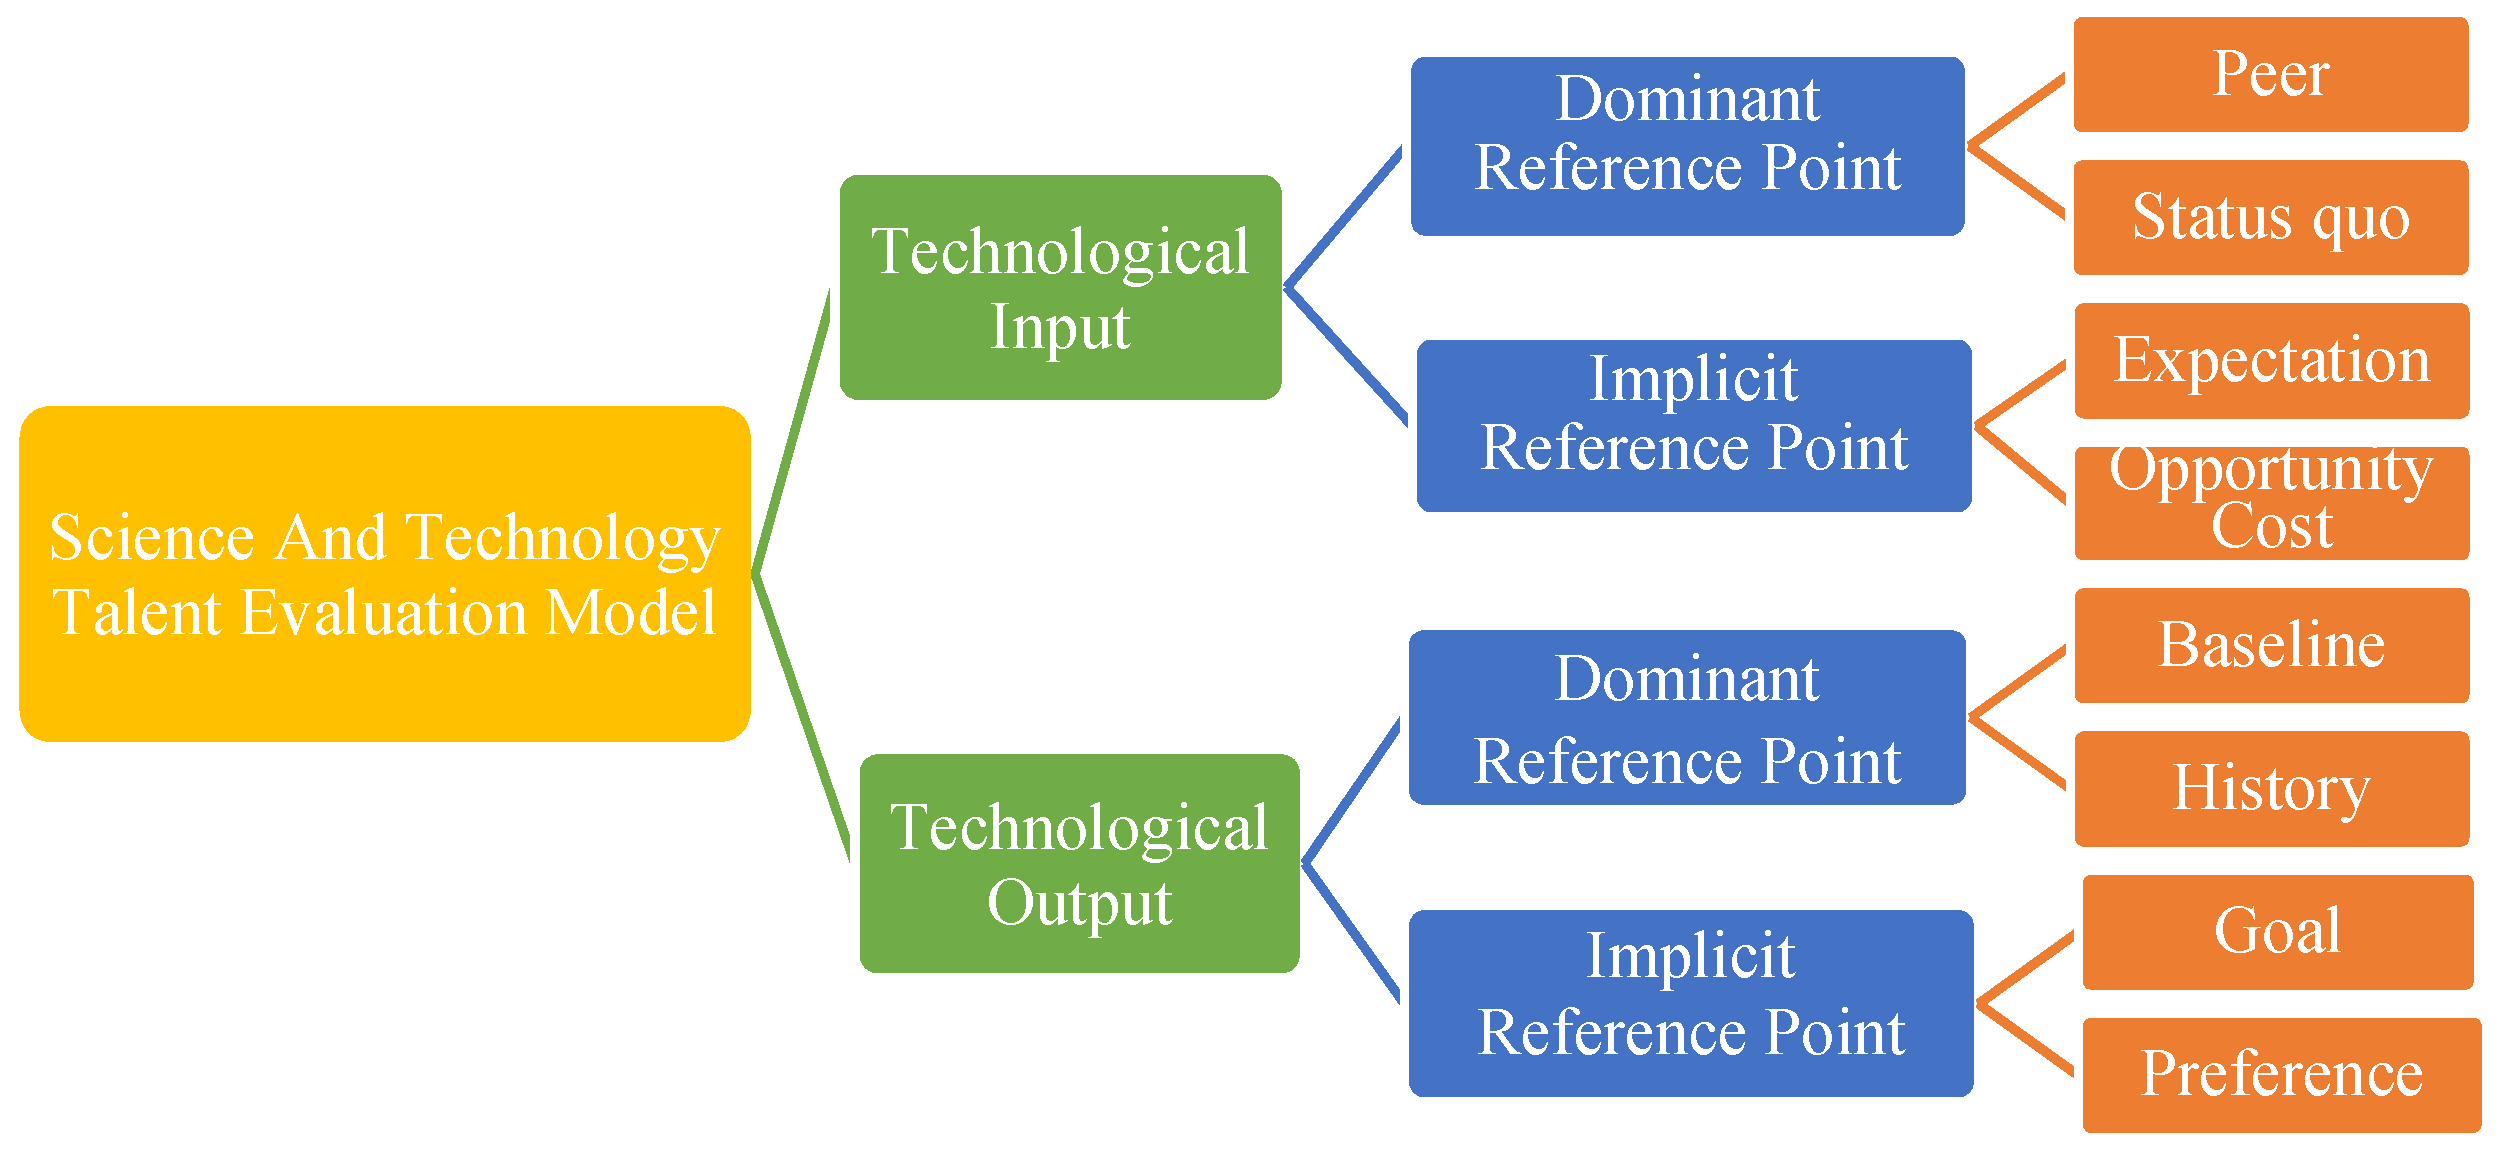
In the process of science and technology talent assessment, scientific and technological organizations often draw on implicit evaluation reference standards when judging and evaluating the input and output indicators of science and technology talents. The decision-making criteria are often not based on the absolute utility value of each indicator but can be traced back to an existing psychological neutral base point (the reference point). The evaluation result, meanwhile, is understood as the deviation direction and extent of the actual utility value and reference point. The dominant reference points of scientific and technological organizations and science and technology talents are open and easily obtained, and the exact opposite applies to the implicit reference points. Under the input indicators, scientific and technological organizations will fully consider peer and status quo reference points. This is the most common external and internal reference point and the information is open and easy to obtain. Science and technology talents will consider expectation and opportunity cost. This information is not open, is hard to obtain and needs to be provided by science and technology talents. In some cases, the provided reference value will be preferred by science and technology talents. If the information is disclosed, it can be obtained through statistics. If the information is not made public, it will not be easy to obtain.
Increased investment in science and technology talents means that the costs of scientific and technological organizations will increase alongside target requirements. As the output of science and technology talents increases, scientific and technological organizations will need to invest more to acquire talents. Scientific and technological organizations will seek to increase input–output efficiency and achieve higher output while making less investment. Science and technology talents, meanwhile, will seek to achieve higher investment with less output.
This paper considers the ‘dominant-implicit’ dual-reference evaluation model for science and technology talents. Specific reference points are shown in
Figure 3.
Definition 1. is the reference point for scientific and technological input, which includes two dominant and two implicit reference points.Dominant reference points include peer reference point and status quo reference point , while implicit reference points include expectation reference point and opportunity cost reference point .
represent the indicators of scientific and technological investment. When , it indicates that the salary input of scientific and technology organizations is higher than the reference point and the satisfaction of science and technology talents is improved; means that the salary input provided by the scientific and technological organizations is lower than the reference point, and the satisfaction of science and technology talents is decreased.
is the peer reference sequence. It compares the benefits of science and technology talents to be introduced with that of peers in the same type of organizations in the same industry. If it is higher than peers’, then it has obvious competitive advantages; however, if it is lower than peers’, it does not possess absolute competitiveness.
is the status quo reference sequence, which refers to the benefit reference that is being implemented under the financial framework that the scientific and technological organization can provide. It is closely related to the welfare investment of science and technology talents and the limitation of financial resources.
is the expectation reference sequence, which refers to the expectation value of benefits that the science and technology talents themselves have, and is subject to factors, such as education, employment area, gender, historical benefits, personal ability, position, school attended prior to graduation and the nature of working units.
is the opportunity cost reference sequence, which refers to the highest value of the benefits provided by other scientific and technological organizations, which scientific and technical talents have given up for this position. In some cases, science and technology talents are already satisfied with the offered benefits; however, if they find some room for negotiation, they will propose opportunity costs that increase their own price, in order to gain more benefits for themselves.
Definition 2. is the reference point of scientific and technological output, which includes two dominant and two implicit reference points.Dominant reference points include baseline reference point and history reference point.
Implicit reference points include goal reference point
and preference reference point .
represent the value of the reference point under the sci-tech output indicators. When , the output of the research papers provided by the science and technology talents is higher than the reference point, which means the scientific and technological organization gains; means that the output of the paper provided by the science and technology talents is lower than the reference point, with the consequence that the scientific and technological organization loses.
is the baseline reference sequence that refers to the minimum requirement for the number and quality of published papers. It is only possible to carry out the next evaluation if it meets the minimum requirements set by the scientific and technological organization. This reference point refers to management rigidity.
is the history reference sequence, which is the output of other science and technology talents that have been introduced in the current environment of scientific and technological organizations (the two are often compared).
is the goal reference sequence. In science and technology enterprises, the development goal of talents is sometimes clear, sometimes vague and sometimes even changes with policy environment. Although the goal is often not fixed, it is an important reference point.
is the preference reference sequence. The decision-makers in the scientific and technological organizations show their preference for science and technology talents, which include a preference for men, famous schools, well-known tutors, engineering backgrounds, scientific and technological achievements and research papers.
The function of the eight reference sequences listed in this paper makes how to select and compare science and technology talents straightforward. The parameter sequence of this paper is obtained in practice and, thus, suits different organizational backgrounds with a certain level of universality. In the later stage, we can expand the range of data collection, increase the number of demonstration experts and make the data more reasonable. The actual situation analysis of these reference data can be studied in another paper.
The initial decision matrix and reference point sequence are as follows:
Initial decision matrix under input indicators: .
Initial decision matrix under output indicators: .
Input reference point sequence: , .
Output reference point sequence: ,.
3. Construction of Science and Technology Talent Evaluation Model: Considering the ‘Dominant-Implicit’ Double Reference Point and the Grey Target Theory
3.1. Interval Grey Number Comparison and Calculation Algorithm
The grey number is an uncertain number that takes values in a certain interval or general number set. It only offers a range of information and not the exact information value. The symbol
is usually used to represent the grey number. Interval grey number
,
indicates the lower bound and
the upper bound [
35,
36,
37,
38]. In this paper, interval grey number is used to represent the initial evaluation value of science and technology talents.
Definition 3. Set the interval grey number and its background or domain as
.
is the measure value of interval grey number under background or domain .
If the interval grey number is a continuous grey number and the distribution information of its value is unknown, then is called the kernel of the interval grey number .
is the degree of greyness of the interval grey number ⨂, because , so , satisfies the normalization and can be abbreviated as . The degree of greyness of the interval grey number reflects the uncertainty degree of things described by the grey number. The closer is to 0, the smaller the uncertainty of the interval grey number ⨂ is; the closer is to 1, the greater the uncertainty of the interval grey number ⨂ is.
Definition 4. represents the domain of the j-th input indicators.
represents the domain of the j-th output indicators.In this paper, and select the maximum range of sample value and reference point value. Definition 5. Let be the kernel of the interval grey number ⊗, and be the degree of greyness of the interval grey number, is a simplified form of the interval grey number.
Definition 6. Set two interval grey numbers ,
,
,
,
;the size comparison and algorithm of the two grey numbers are as follows: 3.2. Uniform Effect Measure of Multi-Objective Intelligent-Weighted Grey Target
The Grey Target Theory was introduced and developed by Professor Deng Julong. It is a grey evaluation and decision theory that can objectively reflect the interaction and influence of each evaluation indicator. Its major concern is to determine the corresponding optimal mode in accordance with the nature of each indicator in a standard pattern sequence. It then combines the mode to be evaluated with the optimal mode (the bullseye) to form a grey target. Liu Sifeng proposed a weighted multi-attribute grey target decision method and uniform effect measure functions in 2010. He thinks that the uniform effect measure is the concrete embodiment of the target’s realization or deviation rate, which fully considers two different situations of target effect value: hitting the target and missing the target, with clear physical meaning. In many cases, it is impossible to obtain the absolute optimization. People often try to find a satisfactory result, which is commonly called ‘middle target’. In other words, the decision-making grey target is essentially the area of satisfactory effect in the sense of relative optimization. This method takes the critical value of the target effect as the reference point: if the target is benefit oriented, it forms the measurement value based on the maximum effect sample value and the critical value of the target effect; if the target is cost oriented, it forms the measurement value based on the minimum effect sample value and the critical value of the target effect.
In the
j-th indicator, the target effect measures calculated by different target effect critical values are different. As time goes on, the critical value of the target effect will also change. In reality, there are many reference points, that is, multiple target effect critical values. Some reference points are explicit, while some others are recessive. The higher the evaluation value under the input indicators, the higher the satisfaction of science and technology talents. The higher the evaluation value under the output indicators, the higher the satisfaction of scientific and technological institutions. The degree of bilateral matching will only increase if the satisfaction of both parties is guaranteed [
39]. In this paper, we consider multiple reference points. In this way, the evaluation results are not determined by a certain reference point, and each reference point forms only a part of it, which is more in line with the actual situation and makes the uniform effect measure more reasonable.
Definition 7. In this paper, there is only one selection event: set is the talent set, is the target set and is the critical value of the j-th target under the p-th reference point. When j is a benefit indicator, is the benefit target effect measure of the j-th indicator of the i-th talent under the p-th reference point. When j is a cost indicator, is the cost target effect measure of the j-thindicatorof the i-th talent under the p-th reference point. The benefit target effect measure and the cost target effect measure are called uniform effect measure, which reflects the degree of realization or deviation of each indicator.
The kernel of is not normative and does not necessarily conform to [−1, 1]. For example, if 5 people take the exam, 60 is the reference threshold, with the highest score of 70 and the lowest score of 30. Theuniform effect measureof 30 points is −3. In order to eliminate the influence of different dimensions on decision-making results, the maximum method is used to normalize theuniform effect measure. The normalized valueis in the unified threshold [−1, 1]. If theuniform effect measureis in [0, 1], the target can be hit and matched; if it is in [−1, 0), it will miss the target and cannot be matched. The interval grey number of the initial value and the reference point value is analyzed by drawing on the definition 3–7 grey number comparison method to determine whether it is a gain or loss. In this paper, under the input indicators of science and technology talents, the higher the value, the stronger the ability to attract science and technology talents; under the output indicators of science and technology talents, the higher the value, the greater the possibility of employing science and technology talents by technology enterprises. The combination of scientific and technological enterprises and science and technology talents is a two-way choice. Only when both sides are satisfied can they cooperate. Therefore, the input indicators and output indicators in this paper are a benefit type. The benefit target effect measure is used to reflect the closeness between the effect sample value and the maximum effect sample value and the degree far away from the target effect critical value.
3.3. Determination of Indicator Weight by Maximum Deviation Method
Many methods are used to determine the indicator weight. The different sources of the original data that are used to calculate the weight can be divided into three categories; specifically, these are the Subjective, Objective and Combination Weight Methods.
The Subjective Weight Method mainly includes the Expert Investigation Method and the Analytic Hierarchy Process, which originated earlier and is a more mature method. Its advantage is that experts can reasonably determine the order of attribute weights in accordance with actual decision-making problems and their own knowledge and experience. However, while this will not contradict the actual importance of attributes, decision-making or evaluation results will become subjective and arbitrary. However, it also increases the burden on decision-makers and shows great limitations in application.
The Objective Weight Method mainly includes the Principal Component Analysis, Entropy, Deviation and Mean Square Deviation Methods. It is strongly objective and does not increase the burden on decision-makers. It has a strong mathematical theoretical basis, with one disadvantage—it relies on the original data.
The Combination Weight Method organically integrates the subjective weight preference information given by the decision-maker with the objective decision matrix information—this largely incorporates the Multi-Objective Programming Method and ensures that the determined weight can simultaneously reflect the subjective and objective degree. The evaluation of science and technology talents seeks to resolve the problem of comparison and selection between talents and to distinguish them.
The comprehensive evaluation value of science and technology talents that are calculated in the framework of the existing model should be set as far as possible to widen the gap, so this paper extracts the method of maximizing dispersion [
22].
The larger the dispersion, the greater the effect of the indicator on the scheme ordering and the higher the weight that is given. When the dispersion is smaller, the indicator will have a smaller effect on the ordering of the scheme and less weight will be given.
is the j-th indicator weight under the p-th reference point. The idea of maximizing dispersion is drawn on to establish an optimization model M-1 that solves
[
40].
The normalized uniform effect measure is multiplied by the indicator weight to obtain the uniform effect measure under different reference points.
3.4. Determining the Weight of Reference Point by Spherical Grey Target Method
The reference point weight is a difficult point in the multi-reference point decision problem. It is especially significant in distinguishing the importance of each reference point and ensuring that the evaluation result does not appear to be one sided. In this paper, the spherical grey target is established and the maximum, minimum and arithmetic mean values of the target effect measure values of each reference point are the bullseye, which ensures the full utilization of information and the consistency of decision results.
Definition 8. is the target effect measurement value of the i-th talent under the p-th reference point. ,
,
are the maximum value, minimum value and average value of the effect measure under the p-th reference point [29]. The weight of the reference point is calculated by Formulas (13) and (14). 3.5. Calculation of Comprehensive Effect Measurement Value
Put the above data, such as the uniform effect measure and reference point weight, under different reference points into the following formula to obtain the comprehensive uniform effect measure.
and
denote input value and output value, respectively.
and
represent the integrated value under each indicator.
and
represent the weights of reference points.
is the weight of the input indicator and of the output indicator. The dominant positions of scientific and technological organizations and science and technology talents determine the weight of output and input indicators.
The comprehensive value has the following three characteristics: dimensionless; the closer to the reference grey target, the larger the comprehensive value; . When , it is hitting the target and can compare the development status of science and technology talents in accordance with the comprehensive value. When , it is missing the target and there is no possibility of matching. If the kernels for the comprehensive value are not equal, the science and technology talents can be ranked according to the comprehensive value. If the kernels of the composite values are equal, the relative kernels must be converted before comparison.
3.6. Calculate the Relative Kernel Value of Comprehensive Value
The comprehensive value is still an interval grey number. According to the method of reference [
30], it is transformed into relative kernel value, which is convenient for comparison and ranking.
Definition 9. Set the interval grey number ,
is the kernel and is the degree of greyness of the interval grey number; if, let be the relative kernel value of the comprehensive effect measure. If the relative kernel value of the composite value is greater than 0, science and technology talents can be ranked according to the relative kernel value.
The steps of this paper are as follows:
Step 1 To construct the evaluation indicators and ‘dominant-implicit’ reference point of science and technology talents.
Step 2 The original evaluation value and reference point value are collected and transformed into the interval-grey-number-simplified expression of kernel and degree of greyness. The uniform effect measure under different indicators and different reference points are calculated according to the interval grey number operation, Formulas (1)–(8), and the uniform effect measure, Formulas (9) and (10).
Step 3 Normalize the uniform effect measure according to maximum method of Formula (11).
Step 4 Optimize and solve the indicator weight according to the deviation method of model M-1 and Formula (12).
Step 5 Calculate the reference point weight according to the spherical grey target method from Formulas (13) and (14).
Step 6 The comprehensive value is obtained according to Formulas (15) and (16) and the relative kernel value is obtained according to Formula (17). Finally, we compare and rank the science and technology talents.
4. Case Application
4.1. Case Background Analysis
The high-tech Z enterprise, which was founded in 2013 and is headquartered in the city of Yancheng, is mainly engaged in the design and manufacture of tires. It is currently undergoing transformation and development. Before 2017, the sales of China’s tire companies increased significantly every year, which was mainly attributable to increased raw material and tire prices. The optimization of the tire industry’s production capacity also resulted in leading tire companies being acquired. Future increases in market and consumer orders will result in the concentration of this kind of capacity and brand concentration will also become more obvious; domestic and old brands, meanwhile, will experience the latest investment as a new round of factories are established.
Exposure to these development pressures will cause high-tech Z enterprise to engage with customer perceptions. They will conduct management integration and will develop an expansive vision, fine workmanship, large systems and technical capabilities. They will also initiate scientific and technological research and assist in the emergence of a development department that will conduct application research into new materials and new techniques and contribute to improved production efficiency, thereby reducing the pressure on labor unit prices for labor costs. In addition, they will introduce automated industrial robots, which will reduce their dependence on field workers, and will use big data and an internal management system.
In 2021, the Z enterprise’s goal is to achieve CNY 20 million of income from scientific and technological transformation, and it is, therefore, an urgent priority for it to employ a group of talents in development, management and sci-tech research. The local government has given strong support (different procedures for on-site service, funding that enables university teachers to work with Z enterprise and seeking solutions to practical problems, partial tax reduction, preferential prices for plant land and priority review and approval). Although it is located in the northern part of the relatively developed Jiangsu Province, the local traffic system is not that developed. Comparison against the southern part of the Province also reveals a gap between the economic aggregate and the income level, although there are also a number of comparative benefits, such as a high-air-quality indicator and the rapid construction of a high-speed rail network. The Government has strongly emphasized the importance of ecological development and talent introduction. In 2018, it promoted “515” talent market strategy, which sought to stimulate talent introduction through the allocation of public service resources, the creation of an entrepreneurial financing environment, the development of an innovation and entrepreneurship carrier, the establishment of an honor recognition system and the introduction of a long-term talent platform. The meaning of the “515” policy is to divide talents into three levels, introducing 50 talents at the first level, 100 talents at the second level and 500 talents at the third level. Good sales performance in 2020 enabled the Z enterprise to build an integrated hotel next to the factory that would accommodate science and technology talents. Good performance also enables Z enterprise to provide more funds.
Z enterprise plans to hire 10 science and technology talents and 4 management talents in 2021. As such, 45 science and technology talents have submitted resumes in response to initial advertisements. An initial screening process then selects five science and technology talents for interview. An evaluation of the investment by scientific and technological enterprises and the existing output of science and technology talents is then conducted.
4.2. Basic Data and Results Analysis
Table 1 and
Table 2 show the initial decision-making matrix and reference point sequence values of enterprise Z for five science and technology talents. The data in
Table 1 are the evaluation values under the input indicators and the data in
Table 2 are the evaluation values under the output indicators. The indicators that this paper uses are usually applied in the comparison of scientific and technological enterprises. The parameter values that this paper selects are drawn from the actual data of Z enterprise, which can be obtained directly from the recruitment market, materials and website and the human resource department, along with other sources. They have good applicability and can potentially be expanded and verified by further experiments. The evaluation value of this paper is represented by an interval grey number. There are two ways to express interval grey numbers, one being the conventional data range expression (see the data on the left of each column in the table) and the other being the combination expression of a kernel and the degree of greyness (see the data on the right of each column in the table).
Because the indicators in this paper are all of benefit type, the original data in
Table 1 and
Table 2 are used to calculate the uniform effect measure by Formula (9) and grey number algorithm. According to the maximum deviation method in the M-1 model, Formula (12) and the uniform effect measure value, the indicator weights are calculated, as shown in
Table 3 and
Table 4. The data in
Table 3 are input indicator weights and the data in
Table 4 are output indicator weights.
The results show:
(1) The input quota has the highest weight of housing and funds. House purchase demand has become a more important demand for science and technology talents, which is consistent with the actual situation.
(2) The weight of insurance and welfare indicators are low, which indicates that the investment of science and technology organizations in insurance and welfare is generally not high. The salary and funds that science and technology talents pay more attention to fall in the middle, which is in line with the reality.
The results show that:
(1) The objective indicator weight is obviously higher than the subjective indicator weight and the subjective ratio is about 20 percent, which is consistent with reality.
(2) The weight of the paper indicator and profit indicator is higher because most science and technology talents have papers, but the transformation of scientific and technological achievements is not enough, which means that there is a big gap under this indicator. There is little difference in the ability of science and technology talents.
The weights of reference points are calculated according to the spherical grey target composed of Formulas (13) and (14), and the input value and output value are calculated according to Formula (15), which are shown in
Table 5 and
Table 6.
The results show that:
(1) Peer and opportunity cost weights are higher in the reference point. The weight of the expectation is second while the weight of status quo is the lowest (between 0.2 and 0.3), which verifies the aforementioned Consistency Principle.
(2) For the peer reference point, only S4 reached 0.8. This indicates that, setting peer investment aside, the company has considerable room for improvement.
(3) For the status quo reference point, is the highest; and also exceed 0.4, which indicates that the investment of newly introduced talents is quite different from the income of existing personnel within the enterprise. It is necessary to increase the input of internal talents and prevent the loss of existing talents.
(4) In terms of expectation reference point, and deviate from the target, reaches 0.8; is only about 0.2, indicating that the expectation of talents is generally high. Enterprises need to increase family care and emotional investment to improve the stability of talents.
(5) For the opportunity cost reference point, and deviate from the target, indicating that and have technology companies extending olive branches to them. In the process of interview and negotiation, enterprises should pay more attention to their stability.
(6) According to the input value, , , and are all targeted and the target rate reaches 80 percent, and sorting several science and technology talents is conducted in the following order: .
The results show that:
(1) The preference and history weights are higher in the reference point, the goal weight is the second and the baseline weight is the lowest; however, they all basically fall between 0.2 and 0.3, which verifies the aforementioned Consistency Principle. In this paper, the proportion of the implicit reference point is larger than the dominant reference point. In the actual work, the hidden reference point cannot be ignored.
(2) In the case of the baseline reference point, the five science and technology talents reach the baseline; and attain 0.7 or above, and and also rise to 0.3 or more, which indicates that the baseline requirements are not high and can be appropriately raised in the future. If there is only a baseline reference point, can also be selected.
(3) For the history and goal reference point, only and are eligible. , and still need to refuel. For the preference reference point, only is off the target.
(4) According to the output value, , , and are all targeted, and the target rate reaches 80 percent; and reach above 0.4 and the matching intention is very strong and sorting several science and technology talents is conducted in the following order: .
The comprehensive value and the relative kernel value of the science and technology talents are as shown in
Table 7.
The results show that:
(1) When h = 0.5, the input and output indicators are equally important. is missing the target. , , and are sorted in accordance with the relative kernel value: .
(2) When h = 0.2, the output indicator is more important. The scientific and technological organization is dominant. is missing the target. , , and are sorted in accordance with the relative kernel value: .
(3) When h = 0.8, the input indicator is more important. The science and technology talents are dominant. is missing the target. , , and are sorted in accordance with the relative kernel value: .
4.3. Method Comparison
Different methods are used to evaluate the performance of science and technology talents and the evaluation results are different.
Method A: the method used in this paper. The evaluation value is represented by interval grey number and multiple ‘dominant-implicit’ reference points are considered. The deviation method is used to optimize the indicator weight and the ball grey target method is used to solve the reference point weight.
Method B: on the basis of method A, only dominant reference points are considered.
Method C: on the basis of method A, only implicit reference points are considered.
Method D: on the basis of method A, the weights of indicators and reference points are given in advance. ,.
Method E: according to the grey incidence degree theory in reference [
35], first normalize the data and find the optimal target center,
,
,
, then calculate the target center distance
and the degree of interval grey number incidence
,
,
. Finally, calculate the comprehensive value,
.
Method F: the kernel of the interval grey number is used to replace the interval grey number; first normalize the data, , , then the kernel value is calculated, . Finally, calculate the comprehensive value, .
In the above methods, the weight h of input indicators is 0.5 and the comprehensive values under different methods are obtained, as shown in
Table 8.
The comprehensive values of different methods are not the same and the order is not exactly the same. The target rate of the method in this paper is 80%. The method that this paper uses does not only consider dominant–implicit multiple reference points, but also uses Interval Grey Number Analysis and Grey Target Theory. Given indicator weight and optimized indicator weight, the evaluation results of science and technology talents are inconsistent. The paper’s method emphasizes operability and practicability, and it provides a new way to solve multi-attribute decision-making problems associated with multiple reference points and has a closer resemblance to reality.
5. Conclusions
(1) This paper introduces two types of indicators, “scientific and technological input” and “scientific and technological output”, in the process of evaluating the performance of scientific and technological talents in new R&D institutions, considering not only the importance of “scientific and technological output”, but also the recognition and support of scientific and technological talents in new R&D institutions from “scientific and technological input”. The performance of scientific and technological talents is not only reflected in their own scientific and technological achievements, but also in the consistency with the development goals in the new R&D institutions and the recognition of their development prospects.
(2) In this paper, we find multiple reference points of “explicit and implicit” in the performance evaluation of scientific and technological talents in new R&D institutions, considering the psychological effect of multiple reference points of multiple decision-makers on the one hand, and classifying multiple reference points as explicit and implicit on the other hand. In the decision-making process, the role of different reference points is different, and sometimes the seemingly hidden reference points may become decisive factors. Therefore, new R&D institutions should consider reference points in many aspects, not only focusing on explicit reference points, but also on implicit reference points.
(3) Characterizing the performance assessment value of scientific and technological talents based on the interval grey number takes into account the uncertainty of the performance assessment value, which has a great uncertainty due to the very diverse investment subjects and many decision-makers in new R&D institutions. This uncertainty is not completely fuzzy; we know a certain range of values but not the distribution, the characterization by the interval grey number is especially suitable and the data can be assembled according to the relevant calculation method of grey system theory.
(4) This paper constructs the performance evaluation model of scientific and technological talents based on multi-objective intelligent grey target decision, thus, dividing the performance evaluation results into two cases of on target and off target, which improves the resolution of the performance evaluation results and has a very obvious physical significance. At the same time, this paper expands the multi-objective intelligent grey target decision-making method from the use of real numbers to the use of interval grey numbers, which further broadens the scope of the application of the theory and further enhances the ability of the method to solve practical problems.
(5) This paper solves the indicator weights based on the deviation maximum method and determines the reference point weights based on the targeting of the data themselves, so as to derive a comprehensive consistent effect measure. The indicator weights pay more attention to the differences between programs, and the reference point weights pay more attention to the importance of the data themselves, so that both subjective and objective weight information are considered for the new R&D institutions to evaluate scientific and technological talents, rank the performance of scientific and technological talents and it is a good assessment method and foundation for new R&D institutions to evaluate scientific and technological talents, rank and reward their performance.
To improve the efficiency and effectiveness of the performance of scientific and technological talents is the constant pursuit of talent workers, new R&D institutions have made a lot of explorations to make scientific and technological talents more satisfied; some of them expand the input of scientific and technological talents to the family level, some of them purchase commercial houses in advance and give them to scientific and technological talents for transitional use after refurbishment, some of them keep researching peer standards to adjust the treatment policy in real time and some leaders visit the scene of performance evaluation to respond directly to the requests made by scientific and technological talents. Some of the leaders personally visit the performance evaluation site to respond directly to the requirements raised by scientific and technological talents. With more and more scientific and technological talents, the pressure of scientific and technological innovation in new R&D institutions is increasing year by year, and the output requirements of scientific and technological talents are also increasing year by year. Therefore, scientifically setting the bottom line, target, preference and other reference sequences has put forward new requirements for new R&D institutions, which provides useful exploration for the policy adjustment of scientific and technological talents and the follow-up assessment of scientific and technological talents. Later, we will consider setting dynamic reference points for the performance evaluation of scientific and technological talents in new R&D institutions, so as to realize the dynamic management of scientific and technological talents in new R&D institutions.


