Abstract
The paradigmatic sequence–structure–dynamics–function relation in proteins is currently well established in the scientific community; in particular, a large effort has been made to probe the first connection, indeed providing convincing evidence of its strength and rationalizing it in a quantitative and general framework. In contrast, however, the role of dynamics as a link between structure and function has eluded a similarly clear-cut verification and description. In this work, we propose a pipeline aimed at building a basis for the quantitative characterization of the large-scale dynamics of a set of proteins, starting from the sole knowledge of their native structures. The method hinges on a dynamics-based clusterization, which allows a straightforward comparison with structural and functional protein classifications. The resulting basis set, obtained through the application to a group of related proteins, is shown to reproduce the salient large-scale dynamical features of the dataset. Most interestingly, the basis set is shown to encode the fluctuation patterns of homologous proteins not belonging to the initial dataset, thus highlighting the general applicability of the pipeline used to build it.
1. Introduction
The internal motions of proteins are intimately linked to protein function [1]. Such conformational movements span a wide range of spatial and temporal scales, going from local sidechain rotations and loop motions (ps to ns), to conformational transitions involving unfolding/refolding processes (ms to hours) [2]. In between these two extremes, internal large-scale protein fluctuations happening on timescales of the order of ns-s [3] typically involve the collective movements of secondary structure elements; such fluctuations lead to a variety of potential conformational states, which might promote the exposure of specific binding sites [4,5] or facilitate the induced fit of the protein upon interaction with partner molecules [6,7]. It has been shown not only that this large-scale dynamics is essential for a protein to carry out its biological role [8], but also that a remarkable correlation exists between a protein’s function and its specific dynamical signature [9], thus strengthening the view of dynamics as a link between a protein’s structure and its specific function. This is particularly evident for the case of allosteric proteins, where the binding of a ligand conveys a signal that is propagated within the protein structure through a modulation of its internal dynamics, resulting in alternative conformational states and an altered protein function [10,11,12].
Several computational methods exist for the study of collective dynamics in proteins [13,14,15]; however, in order to develop a more general view of how dynamics bridges structure and function, it is necessary to build a datasetwise approach for the comparison of such large-scale dynamics among proteins sharing different degrees of sequence and structural similarity. Attempts in this direction have been performed in several works [16,17,18,19,20,21]. Maguid et al. [22] based their analysis on a dataset of pairs of homologous proteins; the comparison of vibrational backbone dynamics within each pair led to the remarkable observation of a correlation between dynamics and evolutionary conservation. Velázquez-Muriel et al. [23] performed a comparison between the protein flexibility shown by the structurally aligned members of a CATH superfamily [24] and the protein flexibility sampled by molecular dynamics simulation of a reference protein belonging to the same superfamily. Singular-value decomposition was used to capture the essential components of the two spaces, which show different size and complexity and are therefore suggested to be combined for a thorough exploration of protein deformations. Analyses of the distance in dynamics have also been performed in the case of structurally and functionally diverse sets of proteins; in this regard, Hensen et al. [9] introduced the notion of the “dynasome”, namely an ensemble of observables computed from molecular dynamics (MD) simulations of a structurally heterogeneous protein dataset. The method highlights a striking correlation between the dynasome descriptors (which include 34 observables for each protein, ranging from the first five eigenvalues of the covariance matrix of C fluctuations to the average ruggedness of the energy landscape) and the proteins’ functional classification. However, this approach relies on time-consuming MD simulations, which limits its applicability to large protein datasets. In addition, the large number and sophistication of the descriptors employed do not enable a straightforward recognition and visualization of the similarities in dynamics between proteins in terms of conformational movements.
To overcome these limitations, in this work, we set up and validate a novel pipeline for the identification of a basis set of conformational motions in an enzymatic family, representing a common vocabulary of their large-scale dynamics. To this aim, we investigated internal, collective protein dynamics in terms of fluctuations at the level of single residues. Our approach does not require the acquisition of expensive MD simulations, since it is based on the topology of native contacts derived from a protein’s experimental structure; specifically, we made use of normal mode analysis (NMA) [25], which represents, together with principal component analysis (PCA) [26], one of the main protocols employed to identify the most relevant patterns in the large-scale dynamics of proteins. While PCA requires a large set of configurations (for example, from MD trajectories) to build the covariance matrix, NMA can be performed with the sole knowledge of an equilibrium configuration of the system. For this reason, NMA is often used in combination with simplified quadratic models, such as the linearized versions of elastic network models (ENMs) [27]. Another degree of simplification can also be introduced by building coarse-grained (CG) models of the protein, where the atomistic degrees of freedom are replaced by a smaller number of physically relevant representative beads. In spite of this simplicity, the collective, large-scale dynamical features obtained by the NMA of the ENMs of proteins have been shown to be successful to predict experimental B-factors [28] and also conformational changes [29,30].
Given the nature of the ENMs, the proposed pipeline is particularly suited for the study of collective dynamics in globular proteins; ENMs might indeed show limitations for biomolecules whose dynamics is strongly anharmonic, as in the case of intrinsically disordered proteins. For this reason, the validation of the method is herein performed on a set of globular enzymes, namely chymotrypsin-related proteases, for which in-depth analyses of evolutionary relationships and structural similarities are available in the literature [31,32,33,34]; in addition, ENM-based NMA has been successfully applied to chymotrypsin-like proteases in previous works, both in the Cartesian space [35,36] and the torsion space [37]. In our approach, normal modes are computed from the -Gaussian elastic network model of the dataset members [38]. In the -Gaussian model, each residue is described in a simplified representation as two beads: one corresponds to the C atom and represents the main chain, while the second, describing the sidechain, is positioned according to the degrees of freedom of the first bead. An effective quadratic potential energy is used to model the bead fluctuations from the native conformation. We made use of this information to perform a dynamics-based alignment between all pairs of proteins from the dataset; the results from the alignment were used to construct a distance matrix in the space of protein dynamics and to cluster together proteins with similar large-scale motions, thus adding an additional layer of information to clustering procedures based on sequence identity [39,40] or structural similarity [41,42,43].
Moreover, we developed a way to represent each protein’s large-scale normal mode as a vector field on the 3D space. Thanks to this representation, we were able to build a high-dimensional basis set of large-scale protein modes. The basis set is validated by comparison with results from MD simulations, with the perspective of applying this methodology to a dataset comprehensive of a large number of protein classes, differing in structure and function. In this way, common fluctuations between distant proteins can be correlated to the presence of local structural elements, with implications in protein engineering for the design of scaffolds that are able to perform controlled conformational changes in functional enzymes [44,45]. In addition, the large-scale dynamics might serve as a guide to the identification of those patterns where the preservation of a high resolution is of paramount importance in the construction of simplified, multiscale models [46,47,48,49,50] that retain the original dynamics. In particular, by describing at an atomistic level the structural elements identified as important for the desired conformational movements and simultaneously coarse-graining the remainder of the protein, it might be possible to obtain a simplified and computationally inexpensive protein model that shows the conformational dynamics of the high-resolution one.
2. Overview of the Workflow
In our approach, the identification of a common set of conformational motions among different proteins is based on the analysis of their dynamics in a CG representation; from here, a representative set of normal modes is identified through a dynamics-based clustering of the proteins comprising the initial dataset. The selected, representative modes are then orthonormalized and ordered, so as to obtain the final basis set. An overview of the workflow is given in Figure 1 and explained in detail in the following paragraphs.
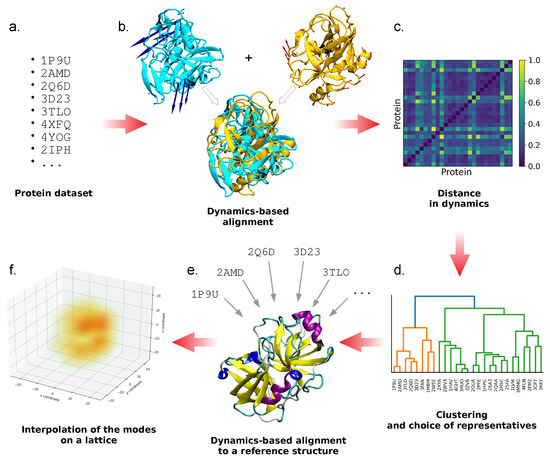
Figure 1.
Schematic representation of the workflow proposed. Once the protein dataset is chosen (a), dynamics-based alignment is performed between all protein pairs (b); the resulting similarity scores (c) are used to perform a clustering and to identify one representative protein for each cluster and one for the whole dataset (d). All the cluster representatives are dynamically aligned with respect to the latter (e), and their normal modes are interpolated on a cubic lattice (f). Once orthonormalized and ordered, the latter are used to construct the final basis set.
The starting point is the identification of a set of proteins (Figure 1a). The choice of this dataset is arbitrary and independent of the pipeline; however, the number of proteins that the dataset contains is supposed to be large enough so as to be representative of the families or superfamilies that are included, meaning that the more distant are the members in terms of homology, the larger should be the dataset. This is necessary to ensure the sufficient generality of the resulting basis set of conformational motions.
The selected set of structures is used to run pairwise dynamics-based protein alignments with the ALADYN software developed by some of us [51] (Figure 1b). ALADYN takes two input structures and performs the maximization of a score function that takes into account the spatial superposition of protein regions that have similar motion. The dynamical information is encoded in the low-energy (large-amplitude) eigenvectors obtained from the diagonalization of the interaction matrix of the Hamiltonian function of the -Gaussian network model:
where is the displacement vector of the i-th bead with respect to the equilibrium configuration. Once the eigenvectors have been obtained, the extent and consistency of the alignment are quantified through the root-mean-squared inner product (RMSIP) between the spaces given by the first 10 modes of each aligned protein. If we call and the total number of residues in the chains of the two aligned proteins, the RMSIP calculation is limited to a subset of marked C. These subsets of amino acids are chosen by firstly grouping the amino acids into groups of 10 subsequent ones, then maximizing a single scoring parameter via the standard Metropolis criterion over the space of possible pairs of groups among the two proteins’ sequences, as exhaustively explained in [51]. Specifically, the RMSIP is defined as:
The RMSIP takes on the value of 1 in the case of the perfect correspondence of the spaces and 0 in the case of their complete orthogonality. The quantity (1.0-RMSIP), which still takes values in the interval , is therefore suitable to define a distance in dynamics between two proteins after alignment. The statistical significance of the alignment, quantified by means of a z-score, is taken into account by weighting the RMSIP by the hyperbolic tangent of the module of the z-score, so as to give more importance to the most reliable results. The distance in dynamics between two aligned proteins i and j is therefore defined as:
After all the pairwise alignments between the elements of the dataset are performed, a distance matrix that expresses differences in the large-scale dynamics is obtained (Figure 1c); then, the dataset undergoes hierarchical clustering [52] based on this distance matrix, in order to identify groups of dynamics-related proteins (Figure 1d). The optimal number of clusters is identified from the interplay between resolution and relevance [53,54,55,56,57]. These two quantities are entropies that are related to each other and depend on the clusterization procedure adopted. We exploited them to select the number of clusters to retain, by considering the smallest number of clusters (hence, the lowest resolution) that gives the highest relevance (Figure 2). Specifically, given a labeling (e.g., a clustering) to a sparse dataset made by data points (in our case, the single proteins in the dataset), the resolution is defined as an entropy representing the relative amount of information loss in the process:
where is the number of data points that fall into the same cluster s. It has been proven [54] that increases monotonically with the number of clusters, in accordance with the idea that the coarser is our clustering, the more information we lose. On the other hand, the relevance is defined as:
where is the number of clusters containing the same amount of data points, for a given clustering process. By choosing the lowest resolution value corresponding to the largest relevance (Figure 2), we can rely on the most compact clusterization (thus increasing the statistics within each cluster) that preserves the highest empirical information content.
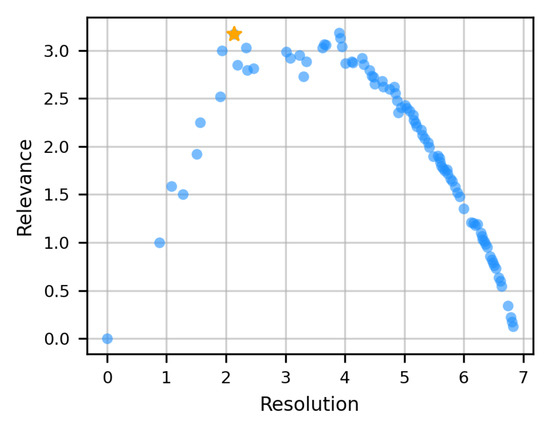
Figure 2.
Resolution–relevance curve used to determine the optimal number of clusters in the dynamics-based clusterization of the protein dataset. Each point corresponds to a different number of clusters. The optimal subdivision, indicated with an orange star, corresponds to 9 clusters.
Once the optimal number of clusters is derived, protein representatives of each cluster are identified as the cluster centroids, namely the proteins with the shortest distance to every other protein of the cluster itself. In addition, a representative for the whole dataset is selected as the protein with the most characteristic dynamics, expressed in terms of the lowest distance with respect to all the other dataset members. The other protein structures are then dynamically aligned to this one with ALADYN, so as to have a consistent orientation in space (Figure 1e).
From an ENM representation of each of these newly oriented structures, normal modes are computed. In order to facilitate the comparison between modes belonging to proteins with a different sequence length, the first five reoriented normal modes of the cluster representatives are placed on a cubic lattice and interpolated on the grid points so as to obtain a smooth vector field (Figure 1f). In this way, we move from comparing the -dimensional modes of different proteins (where N is the number of residues, different for each protein), to comparing vector fields defined on identical 3D lattices having the same dimension. More details on the lattice construction and interpolation are given in Section 3. Proteins belonging to the dataset employed in this work, despite displaying a range of sequence length and radius of gyration, do not grandly differ in size; therefore, the modes interpolated on the lattice can be directly compared. However, it might be the case that the dataset includes proteins with very different size; this would require a rescaling of the protein coordinates before the interpolation on the lattice, so as to compare motions occupying similar volumes in space.
The interpolated modes are orthonormalized using the Gram–Schmidt algorithm [58]. The components of the basis are finally ordered according to decreasing entropy, considered as a measure of their degree of collectivity. The entropy S of a mode k is defined as:
where N is the number of lattice sites and is the square modulus of the k-th mode on the lattice site i. takes a maximum value of 1 if the mode is delocalized on all the lattice sites and a minimum value of 0 if the mode is localized on a single site.
The final set of orthonormalized and ordered vector spaces represents the basis of protein dynamics. In the next section, technical details of the methods employed are presented.
3. Materials and Methods
3.1. Preprocessing of the Dataset
A dataset of 116 chymotrypsin-related proteases, for which structural experimental information is available, was selected. This dataset is based on the one used in [34], from which proteins with sequence identity >70% were removed. The dataset comprises serine proteases from bacteria, eukaryotes, archaea, and viruses, in addition to chymotrypsin-related cysteine proteases from positive-strand RNA viruses. The full list of the proteins’ PDB IDs is given in Table S1. The structures were downloaded from the Protein Data Bank, and the coordinate files were cleaned-up from heteroatoms, from copies of the protein in the crystallographic cell, and from residue-configurations with low occupancy. The position of missing atoms was rebuilt and the protein conformations were optimized using the software FoldX 4 [59]. Non-terminal missing residues were modeled with MODELLER [60,61]. An analysis of the first 3 normal modes for each protein was run using an elastic network model with a cutoff of 10 Å, in order to identify the problematic cases in which the flexible protein termini impaired the analysis of the motion of the protein core. Such analysis was conducted by visual inspection of the modes on the protein structures. In those cases, flexible tails were not considered in the following analyses, which thus focused on globular structures. Moreover, in the case of multi-domain structures, only the domain known to have protease activity was retained.
3.2. Dynamics-Based Alignment and Clustering
The dynamics-based alignment of all the pairs of protein structures was performed with the ALADYN software [51], developed by some of us, using as input the cleaned coordinates files. From the resulting alignment scores, clustering of the structures was performed with the Python library SciPy, using the ward linkage method. The calculation of relevance and resolution, used to identify the optimal number of clusters, was performed with an in-house script.
3.3. Lattice Interpolation and Basis Construction
Normal modes of each protein of the dataset were computed with an in-house code. The first 5 reoriented normal modes of the cluster representatives were placed on a cubic lattice, with a lattice constant of 1 Å (for a total of 45 modes, namely vector fields). The vector on each protein C was translated on the nearest lattice grid point. The mode vectors were interpolated on the lattice in order to create a smooth vector field (Figure 1), using Gaussian functions with = 0.8 Å and truncated at a distance of 2 Å. This distance is slightly smaller than the lowest spatial distance between two C atoms to make sure that the vector coming from the original protein mode is not spuriously modified during interpolation. The chosen value of ensures that, in correspondence with the cutoff, the mode field is close to zero. The resulting vector at each grid point is the sum of the mode fields centered on the nearby C grid points, calculated at , within the cutoff. Eventually, the orthonormalization and ordering of the modes were performed with Python scripts.
3.4. Molecular Dynamics Simulations
Molecular dynamics simulations have been performed on the representatives of each cluster, using the software Gromacs 2019 [62]. The proteins were described with the Amber99sb-ildn force field [63], and the TIP3P model [64] was used for water molecules. Sodium and chloride ions were added at a concentration of 0.15 M and balanced so as to neutralize the charge in the simulation box. All systems were energy minimized for 100 steps by steepest descent. The solvent was then equilibrated for 500 ps with positional restraints on the protein heavy atoms, using a force constant of 1000 kJ·molnm. MD simulations were carried out in the NPT ensemble for 250 ns for each system. Protein and solvent were coupled separately to a 300 K heat bath with a coupling constant of 0.1 ps, using the velocity-rescaling thermostat [65]. The systems were isotropically pressure-coupled at 1 bar with a coupling constant of 2.0 ps, using the Parrinello–Rahman barostat [66]. The application of the LINCS [67] algorithm on hydrogen-containing bonds allowed for an integration time step of 2 fs. Short-range electrostatic and Lennard–Jones interactions were calculated within a cut-off of 1.0 nm, and the neighbor list was updated every 10 steps. The particle mesh Ewald (PME) method was used for the long-range electrostatic interactions [68], with a grid spacing of 0.12 nm.
The calculation of the root-mean-squared fluctuations from the trajectory coordinates was performed on the protein C atoms using the Gromacs tool gmx rmsf. The dynamic cross-correlation was computed with a Python script, using the library MDTraj [69]. Plots were produced with Python libraries, and protein images were rendered with VMD [70].
4. Results and Discussion
4.1. Overview of the Protein Dataset
Proteases are enzymes catalyzing the reaction of the hydrolysis of peptide bonds. The independent evolutionary origin of these enzymes [71] is reflected in their large variety of sizes, shapes, and specificity [72]. In this work, we focus on a specific superfamily, namely the chymotrypsin-related proteases. The latter share a common structure with two -barrel-like domains accommodating the binding site (Figure 3); however, the size and structural completeness of the -barrels and the length of the turns and loops connecting the sheets greatly vary. The result of this structural variability is a range of sequence lengths and protein sizes among the 116 proteins included in our dataset (Figure S1). The proteolytic reaction is performed by a catalytic triad of residues, located between the -barrels. The type of amino acid playing the role of nucleophile in the mechanism of catalysis determines the class of proteases: in the serine proteases, the catalytic triad contains His, Asp/Glu, and Ser residues [73]; in the cysteine proteases, the triad is composed of His, Asp/Glu, and Cys or of a dyad of His and Cys residues [74].
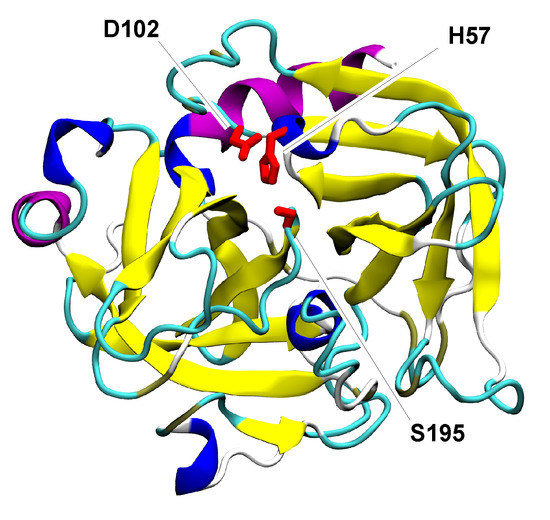
Figure 3.
Cartoon representation of chymotrypsin from Bos taurus (PDB ID: 2CGA). Colors are used to differentiate the structural elements; in particular, the two -barrels are distinguishable in yellow. The catalytic triad is represented in licorice and colored in red.
The classification used in the remainder of the paper is based on MEROPS, a hierarchical classification scheme for proteases [75,76]. In the MEROPS database, chymotrypsin-related proteases constitute the PA clan, which contains 9 families of cysteine proteases (representing proteases of positive-strand RNA viruses) and 14 families of serine proteases (representing proteolytic enzymes from eukaryotes, bacteria, some DNA viruses, and eukaryotic positive-strand RNA viruses). Families are defined on the basis of sequence similarity and/or resemblance of the folds among their protein members. However, experimental structural information is available for a limited number of these families; therefore, not all of them are represented in the dataset employed in this work.
4.2. Results of the Dynamics-Based Alignment
We performed an alignment based on the dynamical information entailed into the first 10 lowest frequency modes obtained by the NMA on the -Gaussian network model of each pair of proteins in the dataset. The alignment consists of the optimization of a score function that maximizes the RMSIP of the two sets of normal modes. For each pair of dynamically aligned proteins, matching regions in the two structures are identified as the subset of residues giving the best overlap. The number of residues belonging to these cores shows great variability (Figure S2), and their RMSD values range from 0.6 to 4.0 Å; these results are indicative of heterogeneity in dynamics within the dataset.
The distance matrix obtained from the pairwise dynamics-based alignments of all proteins of this dataset is used as a measure of similarity in dynamics. This can be compared to the MEROPS classification by computing the average distance between protein pairs that fall into the same family. Following such a procedure, it is apparent that the average distance in dynamics is lower within each family, with respect to the total average (Figure 4). In other words, proteins belonging to the same family are significantly closer in dynamics than they are to members of other families.
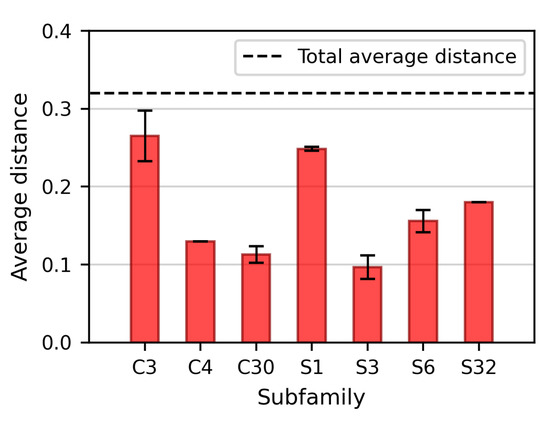
Figure 4.
Average distances (in terms of dynamics) between proteins of the dataset belonging to the same family. Only those subfamilies including more than one representative member are displayed here. The histograms show that proteins are significantly closer in dynamics within the same family than they are to members of other families.
The distance matrix is used as the input for the division of the dataset into dynamically homogeneous protein clusters. The outcome of the hierarchical clustering is graphically expressed by the dendrogram in Figure S3. On the basis of the resolution–relevance plot, nine clusters were identified (Figure 2); this corresponds to a threshold of ≈0.58 in the clustering dendrogram. The resulting clusters appear to be quite homogeneous in terms of protease classification (Figure S4). Importantly, the dynamics-based clustering automatically tends to group proteins belonging to the same subfamily. Figure 5a shows that in most of the cases (17 of the 19 subfamilies represented in the dataset), all the members of each subfamily fall into the same cluster, thus suggesting that these proteins share a similar conformational dynamics and strengthening the idea of homogeneity in dynamics between homologous proteins [77,78]. On the other hand, each cluster groups several subfamilies, and only 4 clusters out of 9 include proteins belonging to only one subfamily (Figure 5b). Therefore, the clustering procedure proves able to effectively group different protein subfamilies that, despite the different evolutionary origin, share similar dynamics.
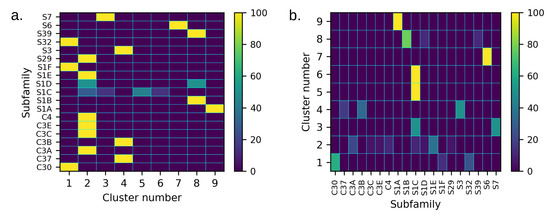
Figure 5.
(a) Distribution of the members of each subfamily among the different clusters, expressed as a percentage with respect to the total number of members of the subfamily. In (b), each row represents the content of each cluster classified on the basis of the function (in percentage, with respect to the total population of the cluster). The results show that the dynamics-based clustering automatically tends to group proteins belonging to the same subfamily.
4.3. Comparison between the Dynamics-Based and the Structure-Based Clustering
We compared the results from the dynamics-based clustering on the proteases of the PA clan with the structure-based distance tree calculated in the work of Mönttinen et al. [34]. There, the authors identified a common structural core of 72 residues for the set of PA clan proteases taken into account; according to the structural similarities of this common core, they built a distance tree between the members of the dataset. Five different clusters were identified, contrary to the nine cluster found in this work.
Despite the two different approaches, the results present several similarities, showing a close relation between structure and dynamics. The S1A subfamily, which includes both bacterial and eukaryotic proteases, forms a clearly distinct and compact cluster both in terms of structure and dynamics. On the other hand, the S1D subfamily, which includes bacterial proteases, is split into two different groups in terms of structure, as well as dynamics: in both cases, the S1D Achromobacter protease I (1ARB) is close to the bacterial S1B proteases, while the S1D protease AL20 of Nesterenkonia abyssinica (3CP7) is close to the members of the bacterial S1E subfamily. This difference between members of the S1D subfamily has been explained on the basis of the different evolutionary history of the bacteria in which they are expressed [34].
Another common feature emerging from the two clustering approaches is the similarity between the S39 subfamily of positive-strand RNA viruses and the bacterial S1B proteases; interestingly, such a degree of similarity is higher than between S39 and the other viral proteases, as already reported on the basis of structural comparisons [79]. Moreover, the bacterial S6 family forms an independent group in both clustering approaches. This peculiarity has been attributed to the presence of a long -stalk structure at the C-terminus (Figure S5), which is absent in all the other proteases of the PA clan [34,80]; the protease domain alone, instead, shares high structural similarity with that of the S1A subfamily. However, the -stalk domain was cut before the dynamics-based alignment, meaning that our analysis of the dynamics of the S6 protease domain alone is able to distinguish this subfamily from the other members of the PA clan.
Importantly, the two types of clustering present also some differences. In the case of the structure-based analysis, the cysteine proteases tend to be grouped together; however, in the dynamics-based alignment, the similarity is only at the level of one of the two large groups into which the dataset is divided, as evident from the dendrogram in Figure S4. Within this group, C families are mixed with S families and appear to be more distributed among different clusters than in the distance tree built on the basis of the structural features. This is indicative of a clear differentiation of the C proteases in terms of dynamics, despite their structural similarity in the protein core. This can be explained not only by the fact that different classes of C proteases are involved in the processing of different viral polyproteins (therefore, requiring adaptation to the substrate), but also because some of them have additional functions, playing the role of inhibitors of host cell protein synthesis [81]. Another difference regards the heat-shock proteases S1C, which include proteins from bacteria, chloroplasts, and mitochondria; even though structurally similar in the proteolytic core, members of this subfamily appear very scattered in the dynamics-based clustering. Specifically, the observed similarities in the dynamics accentuates the structural relatedness already observed between some eukaryotic S1C proteases and different viral protease subfamilies, in that these similarities are stronger than the similarity within the S1C subfamily itself. This relatedness has been previously explained on the basis of exchanges of protease genes between eukaryotic viruses and their hosts [34].
In the structure-based distance tree, proteases from flavivirus (families S29 and S7) and from togavirus (family S3) are grouped together, even though the two viruses belong to different families; on the other hand, S29/S7 and S3 are placed in different clusters when their dynamics is included in the analysis. This distinction might arise from the difference in function: the S3 protein togavirin, in fact, does not only function as a viral protease, but plays also the structural role of the capsid protein of the virus [82]. S29 and S7 proteases, on the other hand, possess only proteolytic function and do not work as structural components.
Overall, the inclusion of dynamics in the comparison of the proteases from the PA clan adds therefore an additional level of classification, which seems appropriate to bridge structural and functional similarities.
4.4. Creation and Validation of the Basis Set of the High-Dimensional Space of Protein Dynamics
The representative proteins of the nine clusters are identified by the PDB codes: 3D23, 1HPG, 2YOL, 1VCP, 3QO6, 1L1J, 1WXR, 4JCN, and 4I8H. Their structures are represented in Figure S6. Protein 1GDQ was chosen as the reference structure of the whole dataset, against which the other representatives are dynamically aligned prior to lattice interpolation of their normal modes (see Section 3). In the latter, the oriented protein modes are placed and interpolated on a cubic lattice, orthonormalized, and finally, ordered. The interpolation on the grid allows us to easily compare the dynamics of any pair of proteins, irrespective of the number of residues. For instance, modes from proteins with a different number of C cannot be directly compared in terms of scalar products, while different vector fields on the grid have the same dimensionality.
We investigated the quality of the orthonormalized modes as a basis set for the dynamics of the whole dataset, by computing the overlap between the spaces given by the protein modes and by the basis. To this aim, the RMSIP was computed between the space spanned by the first five modes of each protein in the dataset (after their interpolation on the lattice) and the first n components of the basis. For each protein, the components of the basis are ordered so as to maximize the RMSIP with the protein modes. The resulting RMSIP for each protein is plotted in Figure 6a as a function of the number n of basis vectors considered for the calculation of the RMSIP. From the distribution of the values attained when using the full basis set (45 vector fields), the RMSIP is greater than 0.5 for ≈94% of the proteins, showing in those cases a good agreement between the dynamics of the protein and the one expressed by the basis [83]. The agreement is excellent (RMSIP > 0.7) for ≈61% of the proteins; therefore, we can conclude that the identified basis is indeed able to describe with good generality the large-scale conformational dynamics of the dataset. For each protein, we also computed the normalized RMSIP, by dividing each value of the RMSIP with the value obtained with the use of the full basis set. The normalized RMSIP curves show that, for each dataset member, as few as 15 basis components are sufficient to reproduce 80% of the dynamics that would be attained with the use of the full basis set (Figure 6b); however, such components differ from protein to protein, meaning that there are no vector fields in the basis that can be considered more essential than others. This suggests that a further reduction in the dimension of the basis set would lead to a loss of generality in the description of the dynamics of this class of proteins.
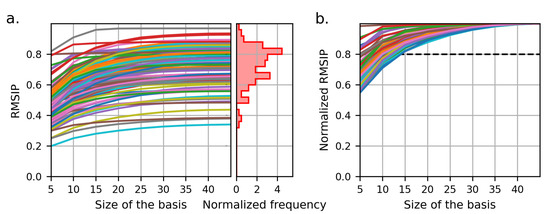
Figure 6.
(a) Root-mean-squared inner product (RMSIP) between the subspaces spanned by the first 5 modes of each protein and the first n basis vectors, as a function of the basis size n. Each line corresponds to one protein of the dataset. The histogram on the right represents the distribution of the RMSIP values attained when the full basis is used. The RMSIP shows a good overlap of the subspaces (RMSIP > 0.5) for ≈94% of the proteins. (b) RMSIP normalized with respect to the value attained from the use of the full basis. For each dataset member, as few as 15 basis components are sufficient to reproduce 80% of the dynamics that would be attained with the use of the full basis set.
4.5. Comparison with MD Simulations
In order to better assess the ability of the basis to reproduce the general dynamics of chymotrypsin-like proteases, we performed MD simulations of four proteins belonging to the same family and compared the per-residue fluctuations emerging from the simulations with those obtained by filtering the trajectory along the vectors of the basis; a good agreement would be indicative of the ability of the basis to describe the large-scale dynamics of the protein. Two of the proteins used as a test-case belong to the dataset; these are 1EKB [84] and 1NPM [85], eukaryotic proteases belonging to the S1A subfamily. The other two proteins, 4YOG [86] and 3W94 [87], are external to the dataset and, as such, have not been used to define the basis. 4YOG is a C30 protease from the bat coronavirus HKU4, while 3W94 is an S1A enteropeptidase. These two proteins have been included here in order to test the generality of the identified basis for the description of the dynamics of the PA clan, independently of the specific members of the initial dataset.
For each of the four proteins we compared the root-mean-squared fluctuations (RMSF) as computed from the simulation and as computed from the same trajectory filtered along the “modes” given by the backmapping of the protein structure on the basis vectors. The comparison shows a good qualitative agreement (Figure 7 and Figure S7), in particular in correspondence with all the secondary structure elements. In the unstructured regions, the comparison is slightly less accurate; this is particularly true for long loops, which are more sensitive to the limitations of the ENM and of the NMA employed to define the modes of the basis, since both assume small-amplitude fluctuations from a well-defined reference structure. From the two sets of trajectories, namely the original MD simulations and the filtered ones, we also computed the dynamic cross-correlation matrices (Figures S8 and S9), which give a measure of the degree of correlation between each pair of C atoms in terms of fluctuations from their average position. When comparing the original and filtered trajectories, the intensity of the resulting correlations are different, with higher correlations/anti-correlations emerging from the trajectory filtered on the basis; however, the patterns of correlation are strikingly similar between the two trajectories for all four proteins. In addition, we computed the RMSIP between the first n modes obtained from the PCA of the MD simulation and of the filtered trajectory, where n is the number of components that capture 80% of the variance in the original simulation (Table S2); in all cases, the results show a good overlap of the two subspaces, with RMSIP > 0.5. Therefore, the basis set appears to be able to describe the relevant large-scale dynamics of the considered protein systems.
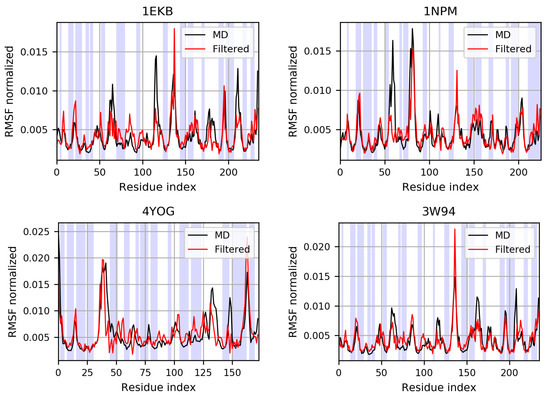
Figure 7.
Root-mean-squared fluctuations (RMSF) of the C atoms, normalized with respect to their sum, computed on proteins belonging to the initial dataset (1EKB, 1NPM) and external to it (4YOG, 3W94). The shaded areas correspond to structured regions, identified with the DSSP algorithm [88,89]. The comparison shows a good qualitative agreement, particularly in correspondence with secondary structure elements.
5. Conclusions
In this work, we proposed a workflow for the identification of common large-scale conformational motions in a set of proteins. Specifically, we performed a dynamics-based clusterization of 116 chymotrypsin-related proteases, belonging to the PA clan, and compared the resulting clusters to the MEROPS classification and to a more recent structure-based classification of the same dataset of proteases. The clustering based on the dynamics adds interesting information to that known on the basis of structural and evolutionary relationships between the members of the protein family, thus facilitating the interpretation of dynamics as a bridge between protein structure and function. In addition, we used NMA and the -GNM to build a basis set of vectors of the high-dimensional space of the PA clan large-scale dynamics and tested the basis set to demonstrate that it is sufficiently complete to describe the main large-scale dynamical features of the members of the dataset. The basis set of conformational motions was also successfully validated by comparison with results from MD simulations of proteins internal and external to the initial dataset.
In this regard, the method proved to deal particularly well with the conformational dynamics of structured regions; loops and disordered regions are by definition challenging to describe with an ENM, which is able to reproduce only small-amplitude fluctuations with respect to a well-defined reference structure; the dynamics of such regions, however, is qualitatively different from the functional one of the structured part, which is the one responsible for carrying out the biological function in the proteins under examination. Additionally, we note that the dataset employed contained only a number of proteins belonging to the family of chymotrypsin-related proteases: a larger dataset is expected to lead to more general results; however, the number of proteins included was limited by the availability of experimental structures and by the choice to remove proteins with too high sequence identity. The natural development of the methodology presented and discussed in this work is its application to a larger dataset of proteins, comprehensive of multiple enzyme superfamilies, with the aim of building a basis set of conformational motions that represents a general vocabulary of proteins’ common dynamics. Once mapped on a protein structure, the basis components can help to identify the most common—but diverse among each other—movements that better describe the common large-scale dynamics of the proteins belonging to the dataset. The dynamics of any protein not belonging to the initial set can be projected on the basis, so as to describe it in terms of a few general movements, thus facilitating the comparison between the dynamical features of different proteins. In addition, the method can be employed to identify those common structural signatures that characterize the dynamics encoded in the basis components and relate them to specific biological functions.
Supplementary Materials
The following supporting information can be downloaded at: https://www.mdpi.com/article/10.3390/app12147157/s1, Figure S1: Histograms of the sequence length (a) and radius of gyration (b) of the proteins in the dataset. Figure S2: Histograms of the number of residues belonging to the superimposed protein cores, defined from the dynamics-based alignment of each pair of proteins from the dataset. Figure S3: Dendrogram resulting from the hierarchical clustering, performed on the basis of the distance in dynamics between the dataset elements. The labels represents the PDB IDs, and colors are used to differentiate the clusters. Figure S4: Dendrogram resulting from the hierarchical clustering, performed on the basis of the distance in dynamics between the dataset elements. The labels represents the protease subfamily of each protein, and colors are used to differentiate the clusters. Figure S5: (a) Full structure of the 1WXR protease from subfamily S6, displaying the long -stalk domain at the C-terminus. (b) Structural alignment of 1WXR (in cyan) and 4I8H from subfamily S1A (in orange), showing the similarity of their protein core. Figure S6: Structure of the representatives of each protein cluster, resulting from the dynamics-based alignment. The color corresponds to the type of secondary structure element: -sheets in yellow, -helices in magenta, 3–10 helices in blue and loops in cyan. Figure S7: Scatter plots of the root-mean-square fluctuation (RMSF) values, computed on the C atoms, from the MD simulations of the protein and from the same trajectories filtered on the basis set. indicates the value of Pearson Coefficient computed between the two sets of fluctuations. All cases show satisfactory results. Figure S8: Cross-correlation computed from the simulations of the proteins 1EKB and 1NPM, both on the original and filtered trajectories. Both proteins belong to the dataset. Figure S9: Cross-correlation computed from the simulations of the two proteins 4YOG and 3W94, both on the original and filtered trajectories. The two proteins are not part of the dataset from which the basis set is derived. Table S1: List of the PDB IDs of the proteins comprising the dataset. Table S2: RMSIP computed between the first n modes obtained from the PCA of the MD simulation and of the filtered trajectory, where n is the number of components that capture the 80% of the variance in the original trajectory. The results show a good overlap of the two subspaces in all the simulated systems.
Author Contributions
Conceptualization: R.P.; methodology, data collection, and analysis: T.T. and M.R.; writing—original draft preparation: T.T. and G.M.; writing—review and editing: T.T., G.M., M.R. and R.P.; supervision: R.P.; funding acquisition: R.P. All authors have read and agreed to the published version of the manuscript.
Funding
This project received funding from the European Research Council (ERC) under the European Union’s Horizon 2020 research and innovation program (Grant 758588).
Institutional Review Board Statement
Not applicable.
Informed Consent Statement
Not applicable.
Data Availability Statement
The raw data produced and analyzed in this work are freely available on the Zenodo repository at https://doi.org/10.5281/zenodo.6669245.
Acknowledgments
The authors thank Roberto Menichetti for a critical and insightful reading of the manuscript.
Conflicts of Interest
The authors declare no conflict of interest.
References
- Berendsen, H.J.; Hayward, S. Collective protein dynamics in relation to function. Curr. Opin. Struct. Biol. 2000, 10, 165–169. [Google Scholar] [CrossRef]
- Henzler-Wildman, K.A.; Lei, M.; Thai, V.; Kerns, S.J.; Karplus, M.; Kern, D. A hierarchy of timescales in protein dynamics is linked to enzyme catalysis. Nature 2007, 450, 913–916. [Google Scholar] [CrossRef] [PubMed]
- Narayanan, C.; Bafna, K.; Roux, L.D.; Agarwal, P.K.; Doucet, N. Applications of NMR and computational methodologies to study protein dynamics. Arch. Biochem. Biophys. 2017, 628, 71–80. [Google Scholar] [CrossRef]
- Ma, B.; Kumar, S.; Tsai, C.J.; Nussinov, R. Folding funnels and binding mechanisms. Protein Eng. 1999, 12, 713–720. [Google Scholar] [CrossRef] [PubMed]
- Nussinov, R.; Ma, B. Protein dynamics and conformational selection in bidirectional signal transduction. BMC Biol. 2012, 10, 2. [Google Scholar] [CrossRef]
- Koshland, D., Jr. Application of a theory of enzyme specificity to protein synthesis. Proc. Natl. Acad. Sci. USA 1958, 44, 98. [Google Scholar] [CrossRef]
- Paul, F.; Weikl, T.R. How to distinguish conformational selection and induced fit based on chemical relaxation rates. PLoS Comput. Biol. 2016, 12, e1005067. [Google Scholar] [CrossRef]
- Yang, L.Q.; Sang, P.; Tao, Y.; Fu, Y.X.; Zhang, K.Q.; Xie, Y.H.; Liu, S.Q. Protein dynamics and motions in relation to their functions: Several case studies and the underlying mechanisms. J. Biomol. Struct. Dyn. 2014, 32, 372–393. [Google Scholar] [CrossRef]
- Hensen, U.; Meyer, T.; Haas, J.; Rex, R.; Vriend, G.; Grubmüller, H. Exploring protein dynamics space: The dynasome as the missing link between protein structure and function. PLoS ONE 2012, 7, e33931. [Google Scholar] [CrossRef]
- Kern, D.; Zuiderweg, E.R. The role of dynamics in allosteric regulation. Curr. Opin. Struct. Biol. 2003, 13, 748–757. [Google Scholar] [CrossRef]
- Zhang, Y.; Doruker, P.; Kaynak, B.; Zhang, S.; Krieger, J.; Li, H.; Bahar, I. Intrinsic dynamics is evolutionarily optimized to enable allosteric behavior. Curr. Opin. Struct. Biol. 2020, 62, 14–21. [Google Scholar] [CrossRef] [PubMed]
- Liang, Z.; Verkhivker, G.M.; Hu, G. Integration of network models and evolutionary analysis into high-throughput modeling of protein dynamics and allosteric regulation: Theory, tools and applications. Briefings Bioinform. 2020, 21, 815–835. [Google Scholar] [CrossRef] [PubMed]
- Balsera, M.A.; Wriggers, W.; Oono, Y.; Schulten, K. Principal component analysis and long time protein dynamics. J. Phys. Chem. 1996, 100, 2567–2572. [Google Scholar] [CrossRef]
- Stein, S.A.M.; Loccisano, A.E.; Firestine, S.M.; Evanseck, J.D. Principal components analysis: A review of its application on molecular dynamics data. Annu. Rep. Comput. Chem. 2006, 2, 233–261. [Google Scholar]
- Kmiecik, S.; Kouza, M.; Badaczewska-Dawid, A.E.; Kloczkowski, A.; Kolinski, A. Modeling of protein structural flexibility and large-scale dynamics: Coarse-grained simulations and elastic network models. Int. J. Mol. Sci. 2018, 19, 3496. [Google Scholar] [CrossRef]
- Marsh, J.A.; Teichmann, S.A. Parallel dynamics and evolution: Protein conformational fluctuations and assembly reflect evolutionary changes in sequence and structure. BioEssays 2014, 36, 209–218. [Google Scholar] [CrossRef]
- Zou, T.; Risso, V.A.; Gavira, J.A.; Sanchez-Ruiz, J.M.; Ozkan, S.B. Evolution of conformational dynamics determines the conversion of a promiscuous generalist into a specialist enzyme. Mol. Biol. Evol. 2015, 32, 132–143. [Google Scholar] [CrossRef]
- Narayanan, C.; Bernard, D.N.; Bafna, K.; Gagné, D.; Chennubhotla, C.S.; Doucet, N.; Agarwal, P.K. Conservation of dynamics associated with biological function in an enzyme superfamily. Structure 2018, 26, 426–436. [Google Scholar] [CrossRef]
- Zhang, S.; Li, H.; Krieger, J.M.; Bahar, I. Shared signature dynamics tempered by local fluctuations enables fold adaptability and specificity. Mol. Biol. Evol. 2019, 36, 2053–2068. [Google Scholar] [CrossRef]
- Mikulska-Ruminska, K.; Shrivastava, I.; Krieger, J.; Zhang, S.; Li, H.; Bayır, H.; Wenzel, S.E.; VanDemark, A.P.; Kagan, V.E.; Bahar, I. Characterization of differential dynamics, specificity, and allostery of lipoxygenase family members. J. Chem. Inf. Model. 2019, 59, 2496–2508. [Google Scholar] [CrossRef]
- Gaur, N.K.; Ghosh, B.; Goyal, V.D.; Kulkarni, K.; Makde, R.D. Evolutionary conservation of protein dynamics: Insights from all-atom molecular dynamics simulations of ‘peptidase’domain of Spt16. J. Biomol. Struct. Dyn. 2021, 1–13. [Google Scholar] [CrossRef] [PubMed]
- Maguid, S.; Fernandez-Alberti, S.; Echave, J. Evolutionary conservation of protein vibrational dynamics. Gene 2008, 422, 7–13. [Google Scholar] [CrossRef] [PubMed]
- Velázquez-Muriel, J.A.; Rueda, M.; Cuesta, I.; Pascual-Montano, A.; Orozco, M.; Carazo, J.M. Comparison of molecular dynamics and superfamily spaces of protein domain deformation. BMC Struct. Biol. 2009, 9, 6. [Google Scholar] [CrossRef]
- Pearl, F.; Todd, A.; Sillitoe, I.; Dibley, M.; Redfern, O.; Lewis, T.; Bennett, C.; Marsden, R.; Grant, A.; Lee, D.; et al. The CATH Domain Structure Database and related resources Gene3D and DHS provide comprehensive domain family information for genome analysis. Nucleic Acids Res. 2005, 33, D247–D251. [Google Scholar] [CrossRef] [PubMed]
- Levitt, M.; Sander, C.; Stern, P.S. Protein normal-mode dynamics: Trypsin inhibitor, crambin, ribonuclease and lysozyme. J. Mol. Biol. 1985, 181, 423–447. [Google Scholar] [CrossRef]
- David, C.C.; Jacobs, D.J. Principal Component Analysis: A Method for Determining the Essential Dynamics of Proteins. In Protein Dynamics: Methods and Protocols; Humana Press: Totowa, NJ, USA, 2014; pp. 193–226. [Google Scholar]
- Tirion, M.M. Large Amplitude Elastic Motions in Proteins from a Single-Parameter, Atomic Analysis. Phys. Rev. Lett. 1996, 77, 1905–1908. [Google Scholar] [CrossRef]
- Zheng, W. Anharmonic normal mode analysis of elastic network model improves the modeling of atomic fluctuations in protein crystal structures. Biophys. J. 2010, 98, 3025–3034. [Google Scholar] [CrossRef]
- Dobbins, S.E.; Lesk, V.I.; Sternberg, M.J.E. Insights into protein flexibility: The relationship between normal modes and conformational change upon protein-protein docking. Proc. Natl. Acad. Sci. USA 2008, 105, 10390–10395. [Google Scholar] [CrossRef]
- Delarue, M.; Sanejouand, Y.H. Simplified Normal Mode Analysis of Conformational Transitions in DNA-dependent Polymerases: The Elastic Network Model. J. Mol. Biol. 2002, 320, 1011–1024. [Google Scholar] [CrossRef]
- Gorbalenya, A.E.; Donchenko, A.P.; Blinov, V.M.; Koonin, E.V. Cysteine proteases of positive strand RNA viruses and chymotrypsin-like serine proteases: A distinct protein superfamily with a common structural fold. FEBS Lett. 1989, 243, 103–114. [Google Scholar] [CrossRef]
- Di Cera, E. Serine proteases. IUBMB Life 2009, 61, 510–515. [Google Scholar] [CrossRef] [PubMed]
- Laskar, A.; Rodger, E.J.; Chatterjee, A.; Mandal, C. Modeling and structural analysis of PA clan serine proteases. BMC Res. Notes 2012, 5, 1–11. [Google Scholar] [CrossRef] [PubMed]
- Mönttinen, H.A.; Ravantti, J.J.; Poranen, M.M. Structural comparison strengthens the higher-order classification of proteases related to chymotrypsin. PLoS ONE 2019, 14, e0216659. [Google Scholar] [CrossRef] [PubMed]
- Ma, W.; Tang, C.; Lai, L. Specificity of trypsin and chymotrypsin: Loop-motion-controlled dynamic correlation as a determinant. Biophys. J. 2005, 89, 1183–1193. [Google Scholar] [CrossRef]
- Sola, R.J.; Griebenow, K. Influence of modulated structural dynamics on the kinetics of α-chymotrypsin catalysis: Insights through chemical glycosylation, molecular dynamics and domain motion analysis. FEBS J. 2006, 273, 5303–5319. [Google Scholar] [CrossRef]
- Dauber-Osguthorpe, P.; Osguthorpe, D.J.; Stern, P.S.; Moult, J. Low frequency motion in proteins: Comparison of normal mode and molecular dynamics of streptomyces griseus protease A. J. Comput. Phys. 1999, 151, 169–189. [Google Scholar] [CrossRef]
- Micheletti, C.; Carloni, P.; Maritan, A. Accurate and efficient description of protein vibrational dynamics: Comparing molecular dynamics and Gaussian models. Proteins Struct. Funct. Bioinform. 2004, 55, 635–645. [Google Scholar] [CrossRef]
- Li, W.; Fu, L.; Niu, B.; Wu, S.; Wooley, J. Ultrafast clustering algorithms for metagenomic sequence analysis. Briefings Bioinform. 2012, 13, 656–668. [Google Scholar] [CrossRef]
- Gabler, F.; Nam, S.Z.; Till, S.; Mirdita, M.; Steinegger, M.; Söding, J.; Lupas, A.N.; Alva, V. Protein sequence analysis using the MPI bioinformatics toolkit. Curr. Protoc. Bioinform. 2020, 72, e108. [Google Scholar] [CrossRef]
- Holm, L.; Sander, C. The FSSP database: Fold classification based on structure-structure alignment of proteins. Nucleic Acids Res. 1996, 24, 206–209. [Google Scholar] [CrossRef]
- Ravantti, J.; Bamford, D.; Stuart, D.I. Automatic comparison and classification of protein structures. J. Struct. Biol. 2013, 183, 47–56. [Google Scholar] [CrossRef] [PubMed]
- Holm, L. DALI and the persistence of protein shape. Protein Sci. 2020, 29, 128–140. [Google Scholar] [CrossRef] [PubMed]
- Friedland, G.D.; Kortemme, T. Designing ensembles in conformational and sequence space to characterize and engineer proteins. Curr. Opin. Struct. Biol. 2010, 20, 377–384. [Google Scholar] [CrossRef] [PubMed]
- Campbell, E.; Kaltenbach, M.; Correy, G.J.; Carr, P.D.; Porebski, B.T.; Livingstone, E.K.; Afriat-Jurnou, L.; Buckle, A.M.; Weik, M.; Hollfelder, F.; et al. The role of protein dynamics in the evolution of new enzyme function. Nat. Chem. Biol. 2016, 12, 944–950. [Google Scholar] [CrossRef]
- Neri, M.; Anselmi, C.; Cascella, M.; Maritan, A.; Carloni, P. Coarse-Grained Model of Proteins Incorporating Atomistic Detail of the Active Site. Phys. Rev. Lett. 2005, 95, 218102. [Google Scholar] [CrossRef]
- Tarenzi, T.; Calandrini, V.; Potestio, R.; Carloni, P. Open-Boundary Molecular Mechanics/Coarse-Grained Framework for Simulations of Low-Resolution G-Protein-Coupled Receptor–Ligand Complexes. J. Chem. Theory Comput. 2019, 15, 2101–2109. [Google Scholar] [CrossRef]
- Fogarty, A.C.; Potestio, R.; Kremer, K. A multi-resolution model to capture both global fluctuations of an enzyme and molecular recognition in the ligand-binding site. Proteins Struct. Funct. Bioinform. 2016, 84, 1902–1913. [Google Scholar] [CrossRef]
- Fiorentini, R.; Kremer, K.; Potestio, R. Ligand-protein interactions in lysozyme investigated through a dual-resolution model. Proteins Struct. Funct. Bioinform. 2020, 88, 1351–1360. [Google Scholar] [CrossRef]
- Giulini, M.; Rigoli, M.; Mattiotti, G.; Menichetti, R.; Tarenzi, T.; Fiorentini, R.; Potestio, R. From system modeling to system analysis: The impact of resolution level and resolution distribution in the computer-aided investigation of biomolecules. Front. Mol. Biosci. 2021, 8, 676976. [Google Scholar] [CrossRef]
- Potestio, R.; Aleksiev, T.; Pontiggia, F.; Cozzini, S.; Micheletti, C. ALADYN: A web server for aligning proteins by matching their large-scale motion. Nucleic Acids Res. 2010, 38, W41–W45. [Google Scholar] [CrossRef][Green Version]
- Defays, D. An efficient algorithm for a complete link method. Comput. J. 1977, 20, 364–366. [Google Scholar] [CrossRef]
- Marsili, M.; Mastromatteo, I.; Roudi, Y. On sampling and modeling complex systems. J. Stat. Mech. Theory Exp. 2013, 2013, P09003. [Google Scholar] [CrossRef]
- Cubero, R.J.; Jo, J.; Marsili, M.; Roudi, Y.; Song, J. Statistical criticality arises in most informative representations. J. Stat. Mech. Theory Exp. 2019, 2019, 063402. [Google Scholar] [CrossRef]
- Marsili, M.; Roudi, Y. Quantifying relevance in learning and inference. Phys. Rep. 2022, 963, 1–43. [Google Scholar] [CrossRef]
- Mele, M.; Covino, R.; Potestio, R. Information-theoretical measures identify accurate low-resolution representations of protein configurational space. arXiv 2022, arXiv:2205.08437. [Google Scholar]
- Holtzman, R.; Giulini, M.; Potestio, R. Making sense of complex systems through resolution, relevance, and mapping entropy. arXiv 2022, arXiv:2203.00100. [Google Scholar]
- Cheney, W.; Kincaid, D. Linear algebra: Theory and applications. Aust. Math. Soc. 2009, 110, 544–550. [Google Scholar]
- Schymkowitz, J.; Borg, J.; Stricher, F.; Nys, R.; Rousseau, F.; Serrano, L. The FoldX web server: An online force field. Nucleic Acids Res. 2005, 33, W382–W388. [Google Scholar] [CrossRef]
- Fiser, A.; Do, R.K.G.; Šali, A. Modeling of loops in protein structures. Protein Sci. 2000, 9, 1753–1773. [Google Scholar] [CrossRef]
- Webb, B.; Sali, A. Comparative protein structure modeling using MODELLER. Curr. Protoc. Bioinform. 2016, 54, 5–6. [Google Scholar] [CrossRef]
- Abraham, M.J.; Murtola, T.; Schulz, R.; Páll, S.; Smith, J.C.; Hess, B.; Lindahl, E. GROMACS: High performance molecular simulations through multi-level parallelism from laptops to supercomputers. SoftwareX 2015, 1, 19–25. [Google Scholar] [CrossRef]
- Lindorff-Larsen, K.; Piana, S.; Palmo, K.; Maragakis, P.; Klepeis, J.L.; Dror, R.O.; Shaw, D.E. Improved side-chain torsion potentials for the Amber ff99SB protein force field. Proteins Struct. Funct. Bioinform. 2010, 78, 1950–1958. [Google Scholar] [CrossRef] [PubMed]
- Jorgensen, W.L.; Chandrasekhar, J.; Madura, J.D.; Impey, R.W.; Klein, M.L. Comparison of simple potential functions for simulating liquid water. J. Chem. Phys. 1983, 79, 926–935. [Google Scholar] [CrossRef]
- Bussi, G.; Donadio, D.; Parrinello, M. Canonical sampling through velocity rescaling. J. Chem. Phys. 2007, 126, 014101. [Google Scholar] [CrossRef] [PubMed]
- Parrinello, M.; Rahman, A. Polymorphic transitions in single crystals: A new molecular dynamics method. J. Appl. Phys. 1981, 52, 7182–7190. [Google Scholar] [CrossRef]
- Hess, B.; Bekker, H.; Berendsen, H.J.; Fraaije, J.G. LINCS: A linear constraint solver for molecular simulations. J. Comput. Chem. 1997, 18, 1463–1472. [Google Scholar] [CrossRef]
- Darden, T.; York, D.; Pedersen, L. Particle mesh Ewald: An N log (N) method for Ewald sums in large systems. J. Chem. Phys. 1993, 98, 10089–10092. [Google Scholar] [CrossRef]
- McGibbon, R.T.; Beauchamp, K.A.; Harrigan, M.P.; Klein, C.; Swails, J.M.; Hernández, C.X.; Schwantes, C.R.; Wang, L.P.; Lane, T.J.; Pande, V.S. MDTraj: A modern open library for the analysis of molecular dynamics trajectories. Biophys. J. 2015, 109, 1528–1532. [Google Scholar] [CrossRef]
- Humphrey, W.; Dalke, A.; Schulten, K. VMD: Visual molecular dynamics. J. Mol. Graph. 1996, 14, 33–38. [Google Scholar] [CrossRef]
- Neurath, H.; Walsh, K.A.; Winter, W.P. Evolution of Structure and Function of Proteases: Amino acid sequences of proteolytic enzymes reflect phylogenetic relationships. Science 1967, 158, 1638–1644. [Google Scholar] [CrossRef]
- López-Otín, C.; Bond, J.S. Proteases: Multifunctional enzymes in life and disease. J. Biol. Chem. 2008, 283, 30433–30437. [Google Scholar] [CrossRef] [PubMed]
- Hedstrom, L. Serine protease mechanism and specificity. Chem. Rev. 2002, 102, 4501–4524. [Google Scholar] [CrossRef] [PubMed]
- Verma, S.; Dixit, R.; Pandey, K.C. Cysteine proteases: Modes of activation and future prospects as pharmacological targets. Front. Pharmacol. 2016, 7, 107. [Google Scholar] [CrossRef]
- Rawlings, N.D.; Tolle, D.P.; Barrett, A.J. MEROPS: The peptidase database. Nucleic Acids Res. 2004, 32, D160–D164. [Google Scholar] [CrossRef]
- Rawlings, N.D.; Barrett, A.J.; Finn, R. Twenty years of the MEROPS database of proteolytic enzymes, their substrates and inhibitors. Nucleic Acids Res. 2016, 44, D343–D350. [Google Scholar] [CrossRef] [PubMed]
- Maguid, S.; Fernandez-Alberti, S.; Ferrelli, L.; Echave, J. Exploring the common dynamics of homologous proteins. Application to the globin family. Biophys. J. 2005, 89, 3–13. [Google Scholar] [CrossRef]
- He, Y.; Maisuradze, G.G.; Yin, Y.; Kachlishvili, K.; Rackovsky, S.; Scheraga, H.A. Sequence-, structure-, and dynamics-based comparisons of structurally homologous CheY-like proteins. Proc. Natl. Acad. Sci. USA 2017, 114, 1578–1583. [Google Scholar] [CrossRef]
- Gayathri, P.; Satheshkumar, P.; Prasad, K.; Nair, S.; Savithri, H.; Murthy, M. Crystal structure of the serine protease domain of Sesbania mosaic virus polyprotein and mutational analysis of residues forming the S1-binding pocket. Virology 2006, 346, 440–451. [Google Scholar] [CrossRef]
- Khan, S.; Mian, H.S.; Sandercock, L.E.; Chirgadze, N.Y.; Pai, E.F. Crystal structure of the passenger domain of the Escherichia coli autotransporter EspP. J. Mol. Biol. 2011, 413, 985–1000. [Google Scholar] [CrossRef]
- Sun, D.; Chen, S.; Cheng, A.; Wang, M. Roles of the picornaviral 3C proteinase in the viral life cycle and host cells. Viruses 2016, 8, 82. [Google Scholar] [CrossRef]
- Choi, H.K.; Lee, S.; Zhang, Y.P.; McKinney, B.R.; Wengler, G.; Rossmann, M.G.; Kuhn, R.J. Structural analysis of Sindbis virus capsid mutants involving assembly and catalysis. J. Mol. Biol. 1996, 262, 151–167. [Google Scholar] [CrossRef] [PubMed]
- David, C.C.; Jacobs, D.J. Characterizing protein motions from structure. J. Mol. Graph. Model. 2011, 31, 41–56. [Google Scholar] [CrossRef] [PubMed]
- Lu, D.; Fütterer, K.; Korolev, S.; Zheng, X.; Tan, K.; Waksman, G.; Sadler, J.E. Crystal structure of enteropeptidase light chain complexed with an analog of the trypsinogen activation peptide. J. Mol. Biol. 1999, 292, 361–373. [Google Scholar] [CrossRef]
- Kishi, T.; Kato, M.; Shimizu, T.; Kato, K.; Matsumoto, K.; Yoshida, S.; Shiosaka, S.; Hakoshima, T. Crystal structure of neuropsin, a hippocampal protease involved in kindling epileptogenesis. J. Biol. Chem. 1999, 274, 4220–4224. [Google Scholar] [CrossRef] [PubMed]
- John, S.E.S.; Tomar, S.; Stauffer, S.R.; Mesecar, A.D. Targeting zoonotic viruses: Structure-based inhibition of the 3C-like protease from bat coronavirus HKU4—The likely reservoir host to the human coronavirus that causes Middle East Respiratory Syndrome (MERS). Bioorganic Med. Chem. 2015, 23, 6036–6048. [Google Scholar] [CrossRef] [PubMed]
- Xu, J.; Hu, S.; Wang, X.; Zhao, Z.; Zhang, X.; Wang, H.; Zhang, D.; Guo, Y. Structure basis for the unique specificity of medaka enteropeptidase light chain. Protein Cell 2014, 5, 178–181. [Google Scholar] [CrossRef] [PubMed][Green Version]
- Kabsch, W.; Sander, C. Dictionary of protein secondary structure: Pattern recognition of hydrogen-bonded and geometrical features. Biopolym. Orig. Res. Biomol. 1983, 22, 2577–2637. [Google Scholar] [CrossRef]
- Touw, W.G.; Baakman, C.; Black, J.; Te Beek, T.A.; Krieger, E.; Joosten, R.P.; Vriend, G. A series of PDB-related databanks for everyday needs. Nucleic Acids Res. 2015, 43, D364–D368. [Google Scholar] [CrossRef]
Publisher’s Note: MDPI stays neutral with regard to jurisdictional claims in published maps and institutional affiliations. |
© 2022 by the authors. Licensee MDPI, Basel, Switzerland. This article is an open access article distributed under the terms and conditions of the Creative Commons Attribution (CC BY) license (https://creativecommons.org/licenses/by/4.0/).