
Human Activity Recognition Based on Non-Contact Radar Data and Improved PCA Method


Abstract
:1. Introduction
2. Related Work
3. Methodology
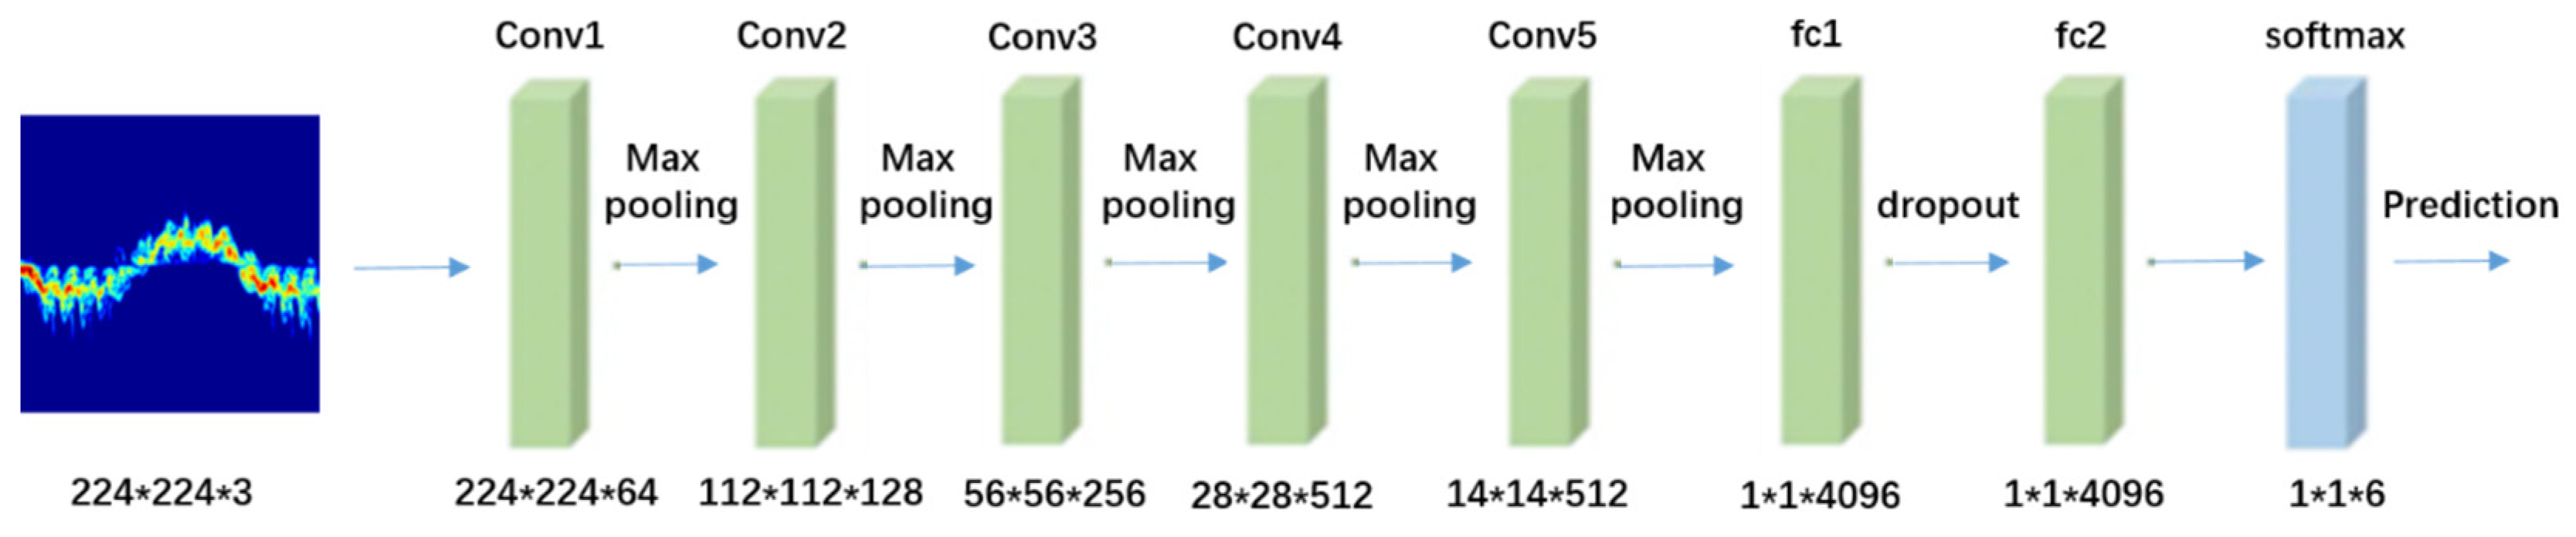
3.1. Improved VGG16
3.1.1. Improvement of the Model Structure
3.1.2. Optimization of the Parameter
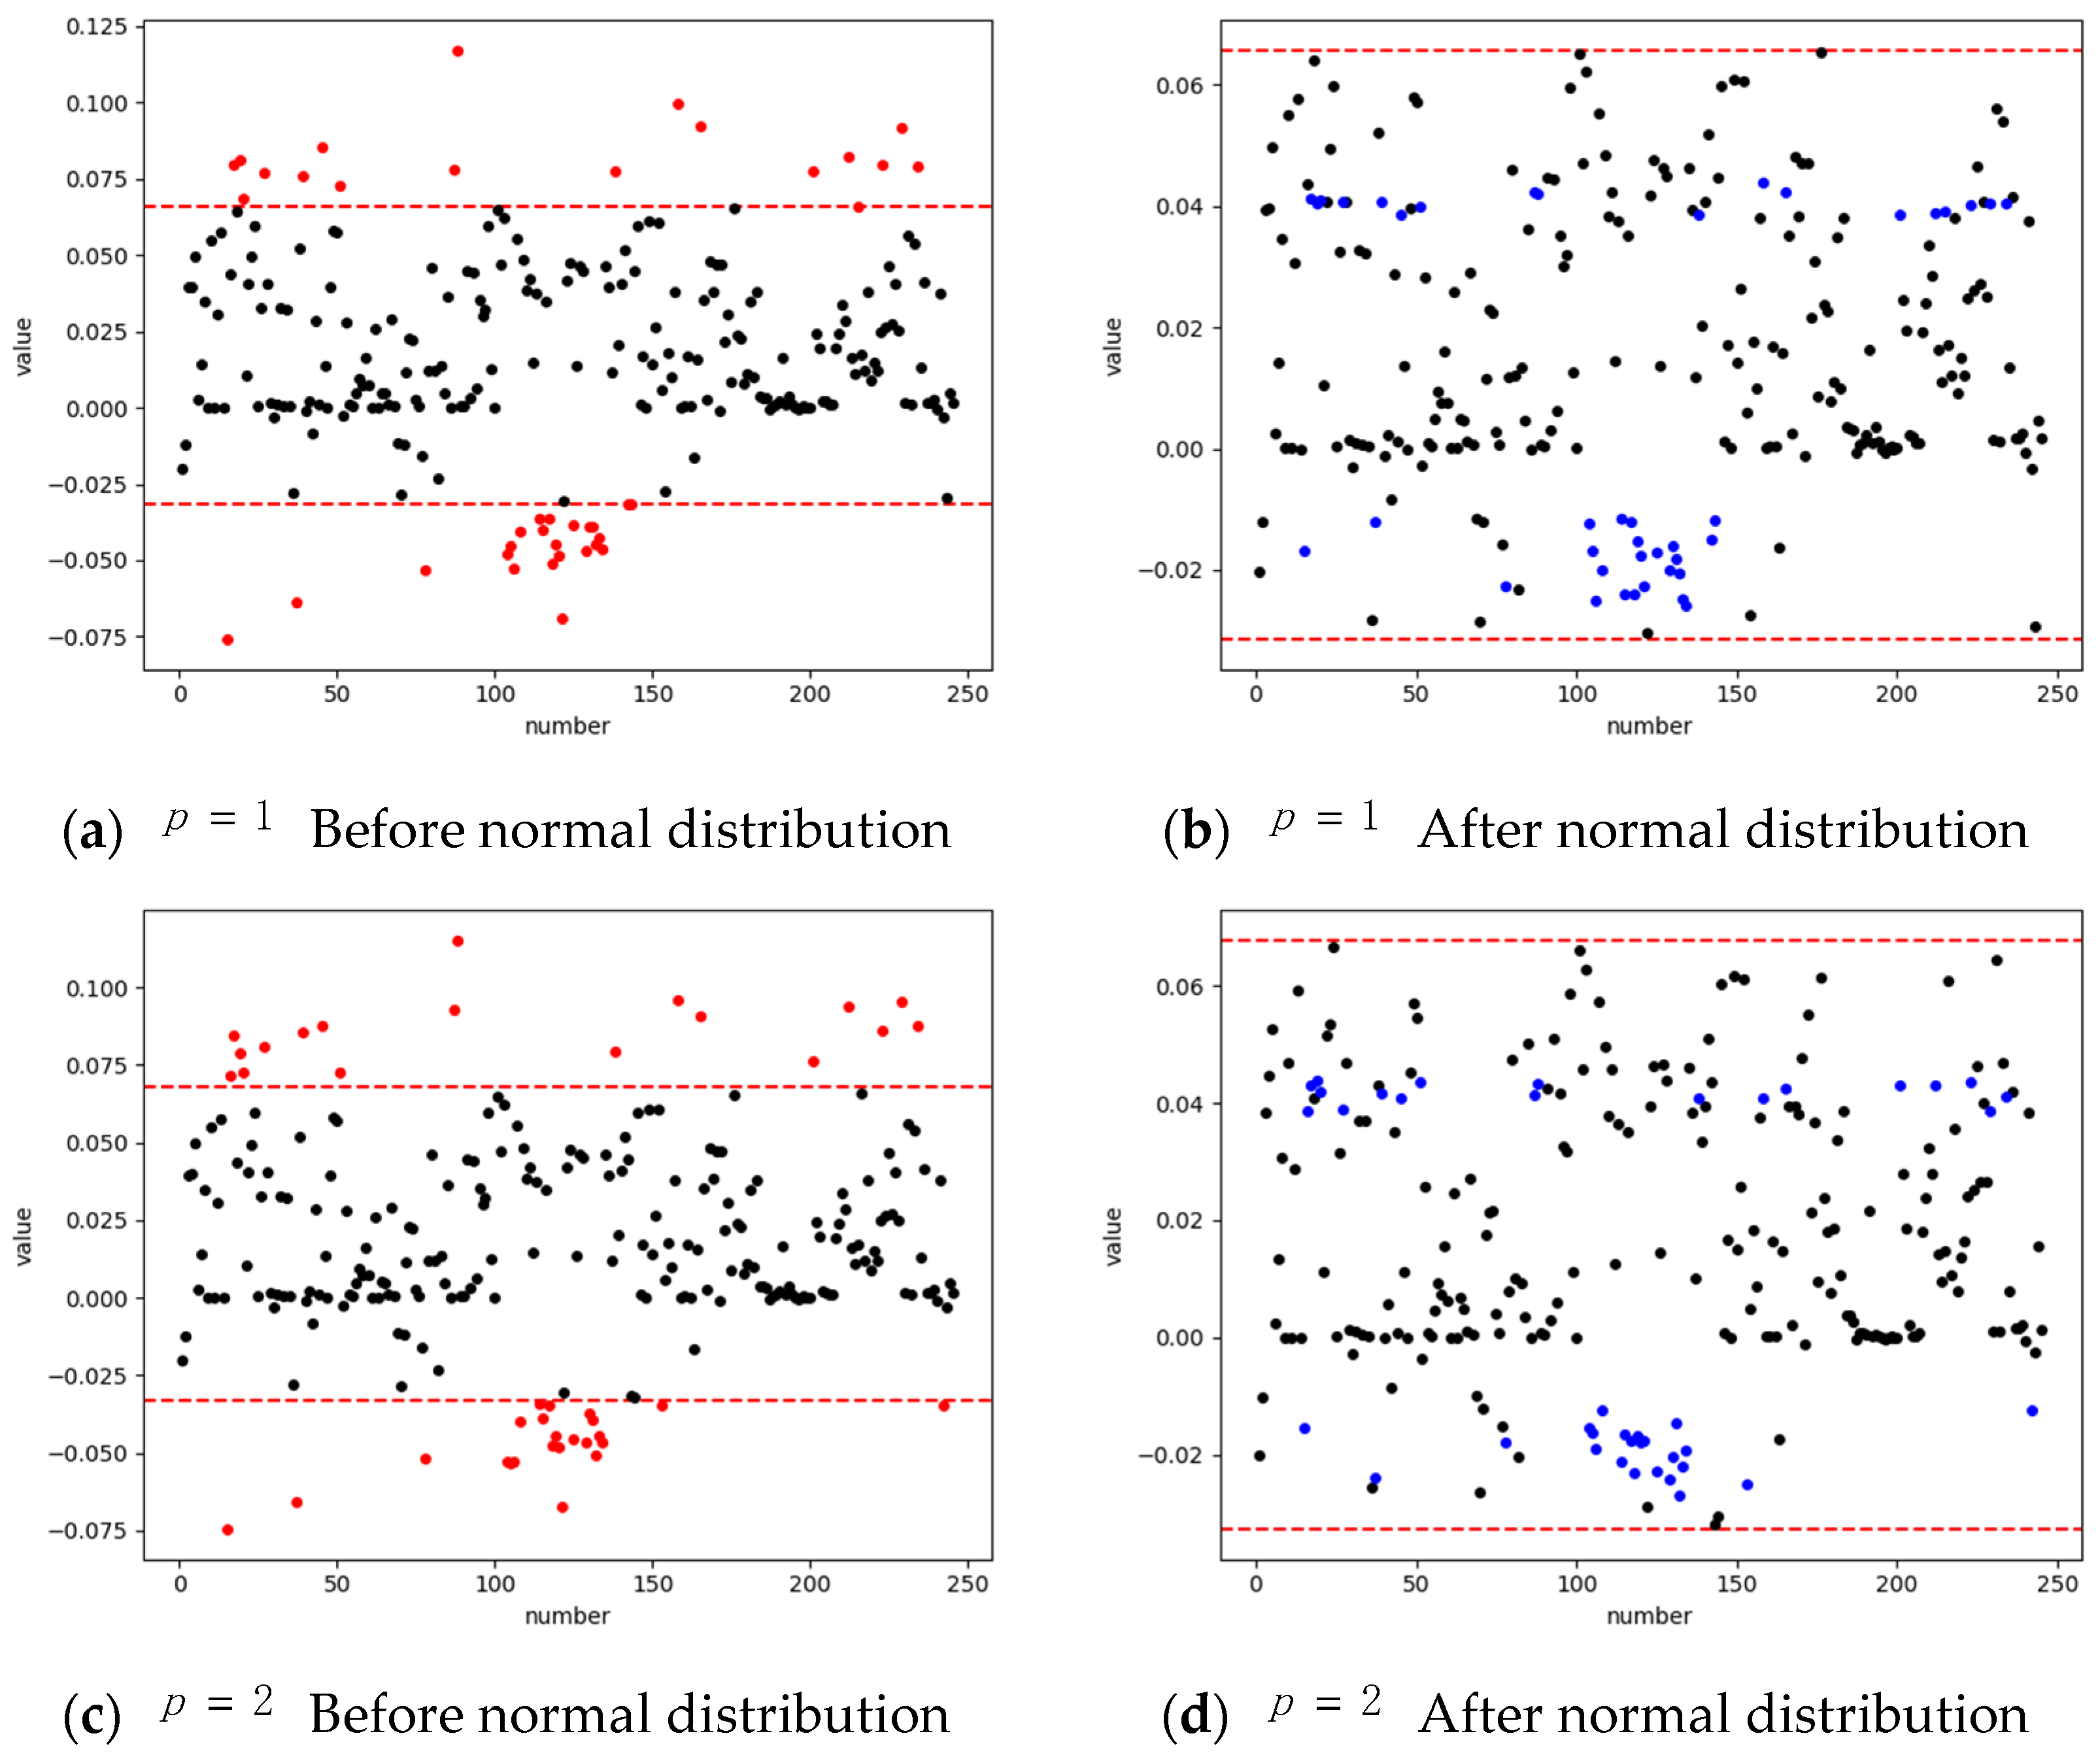
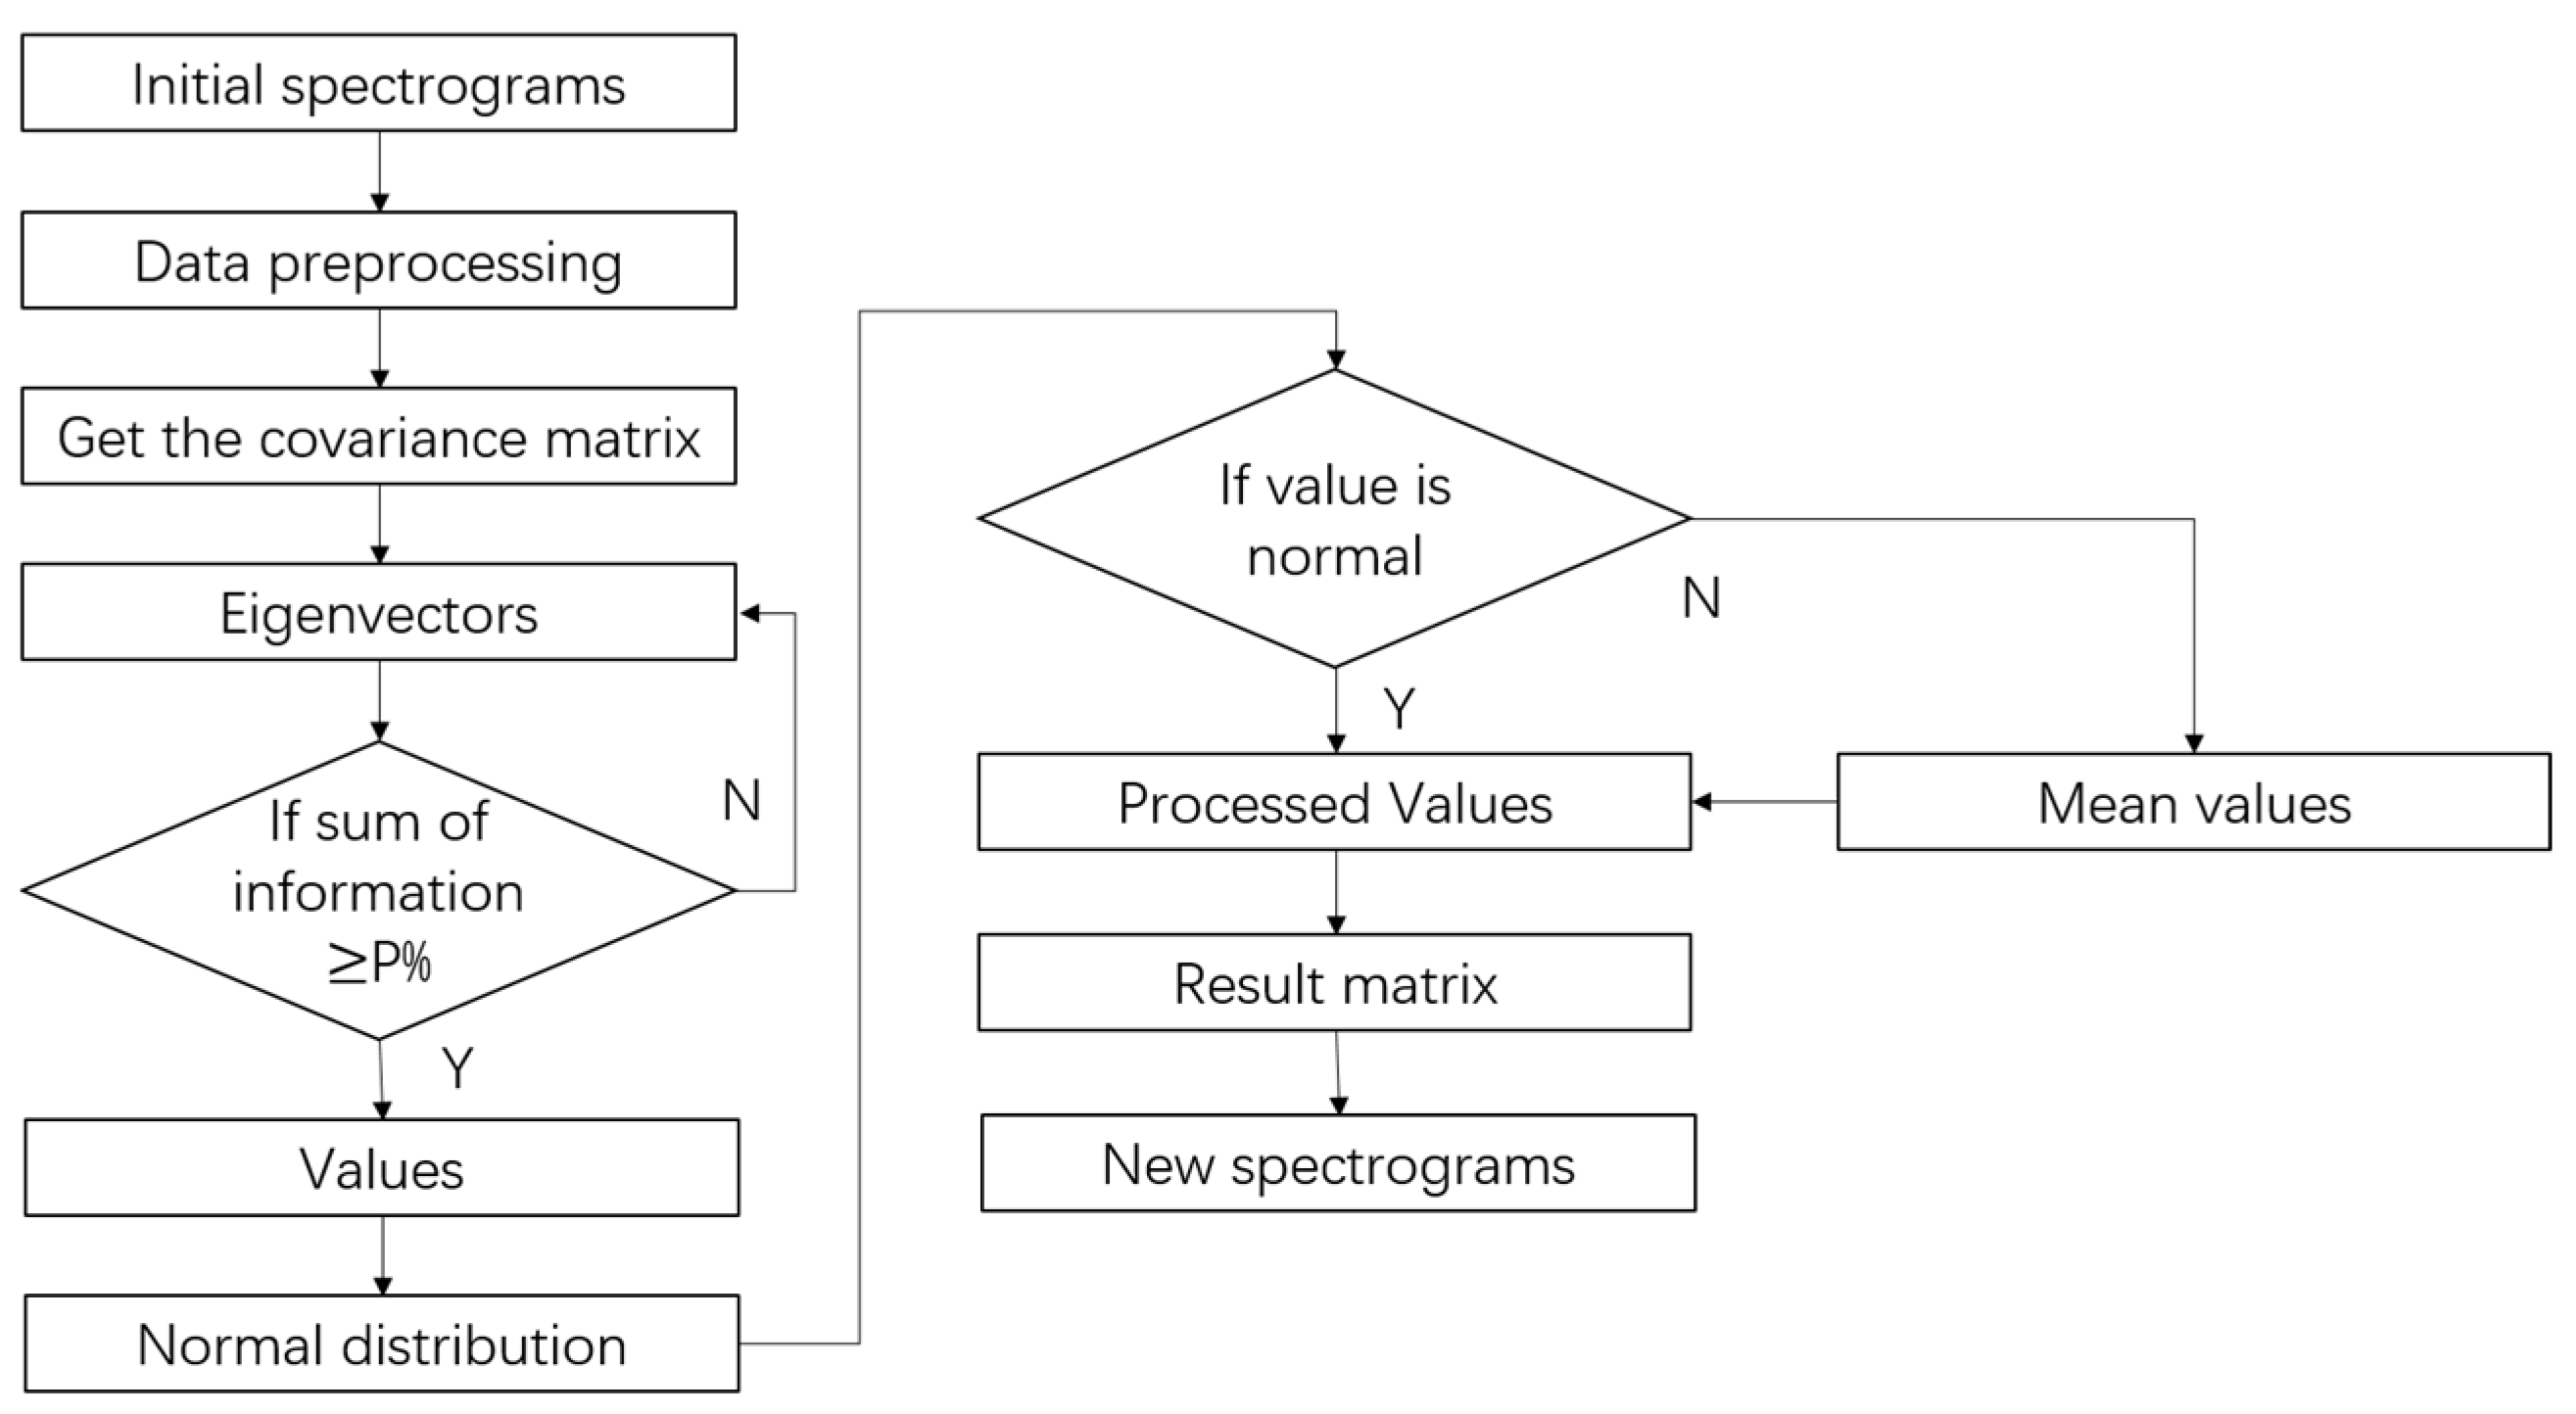
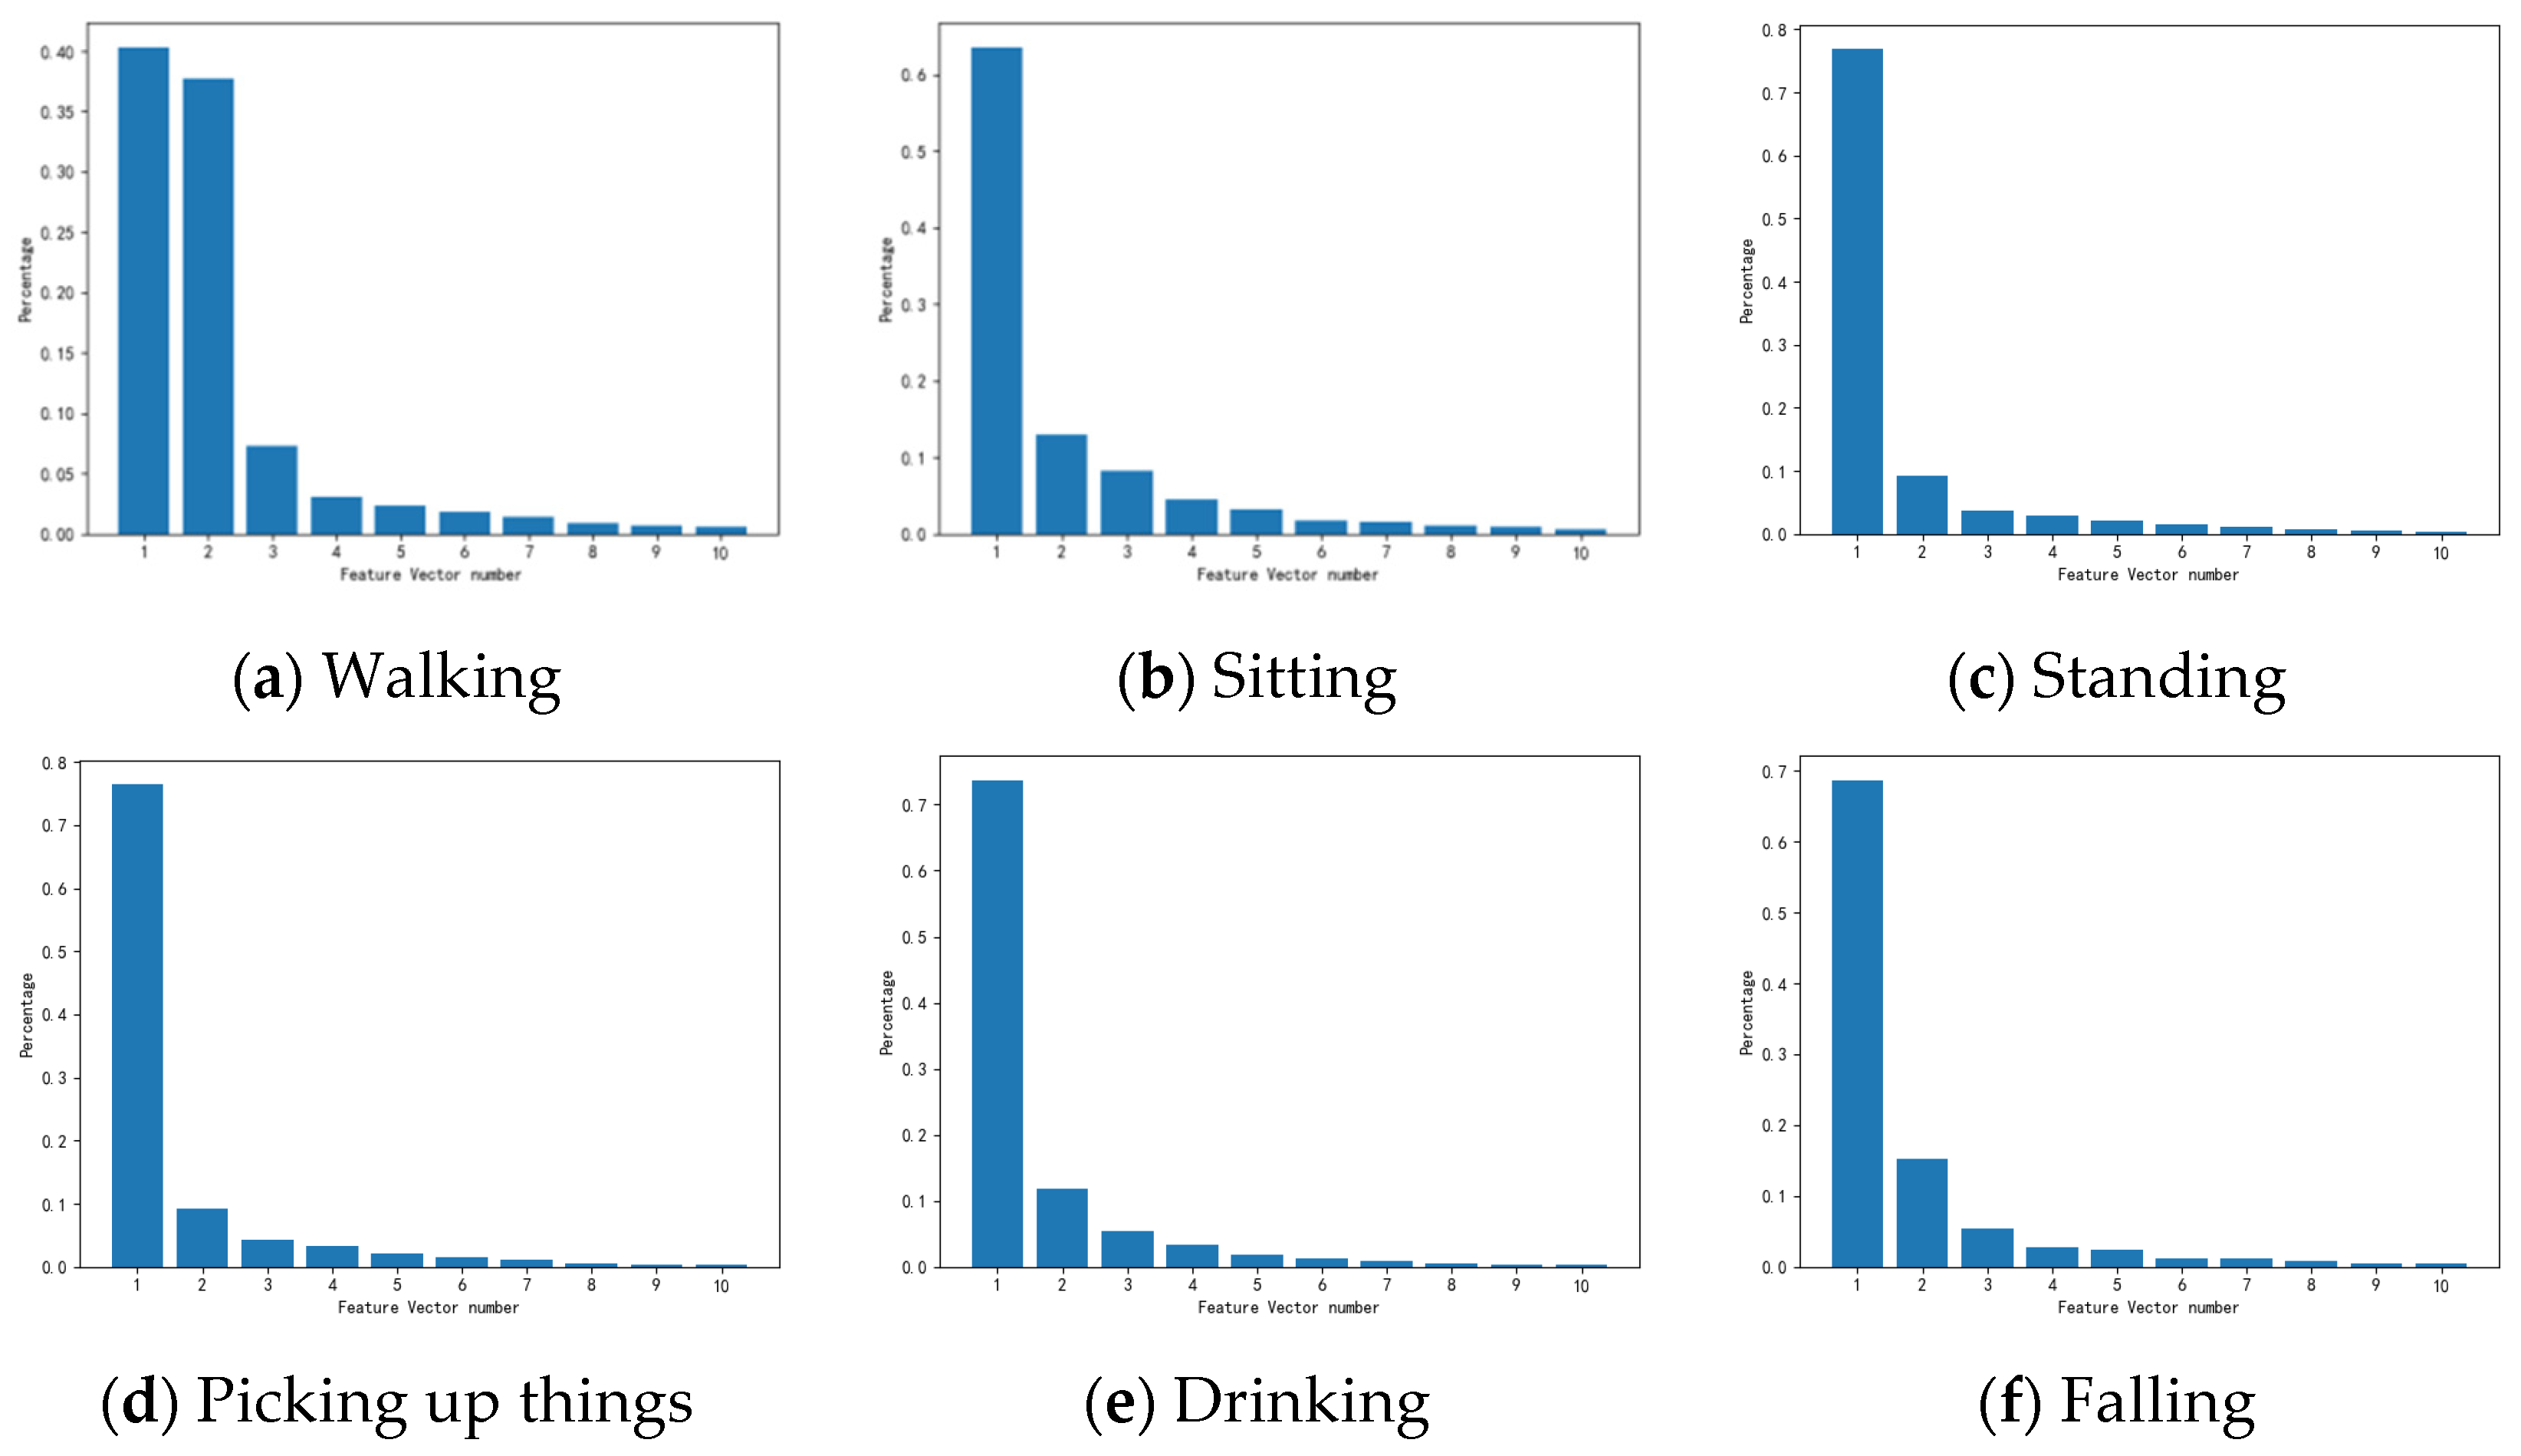
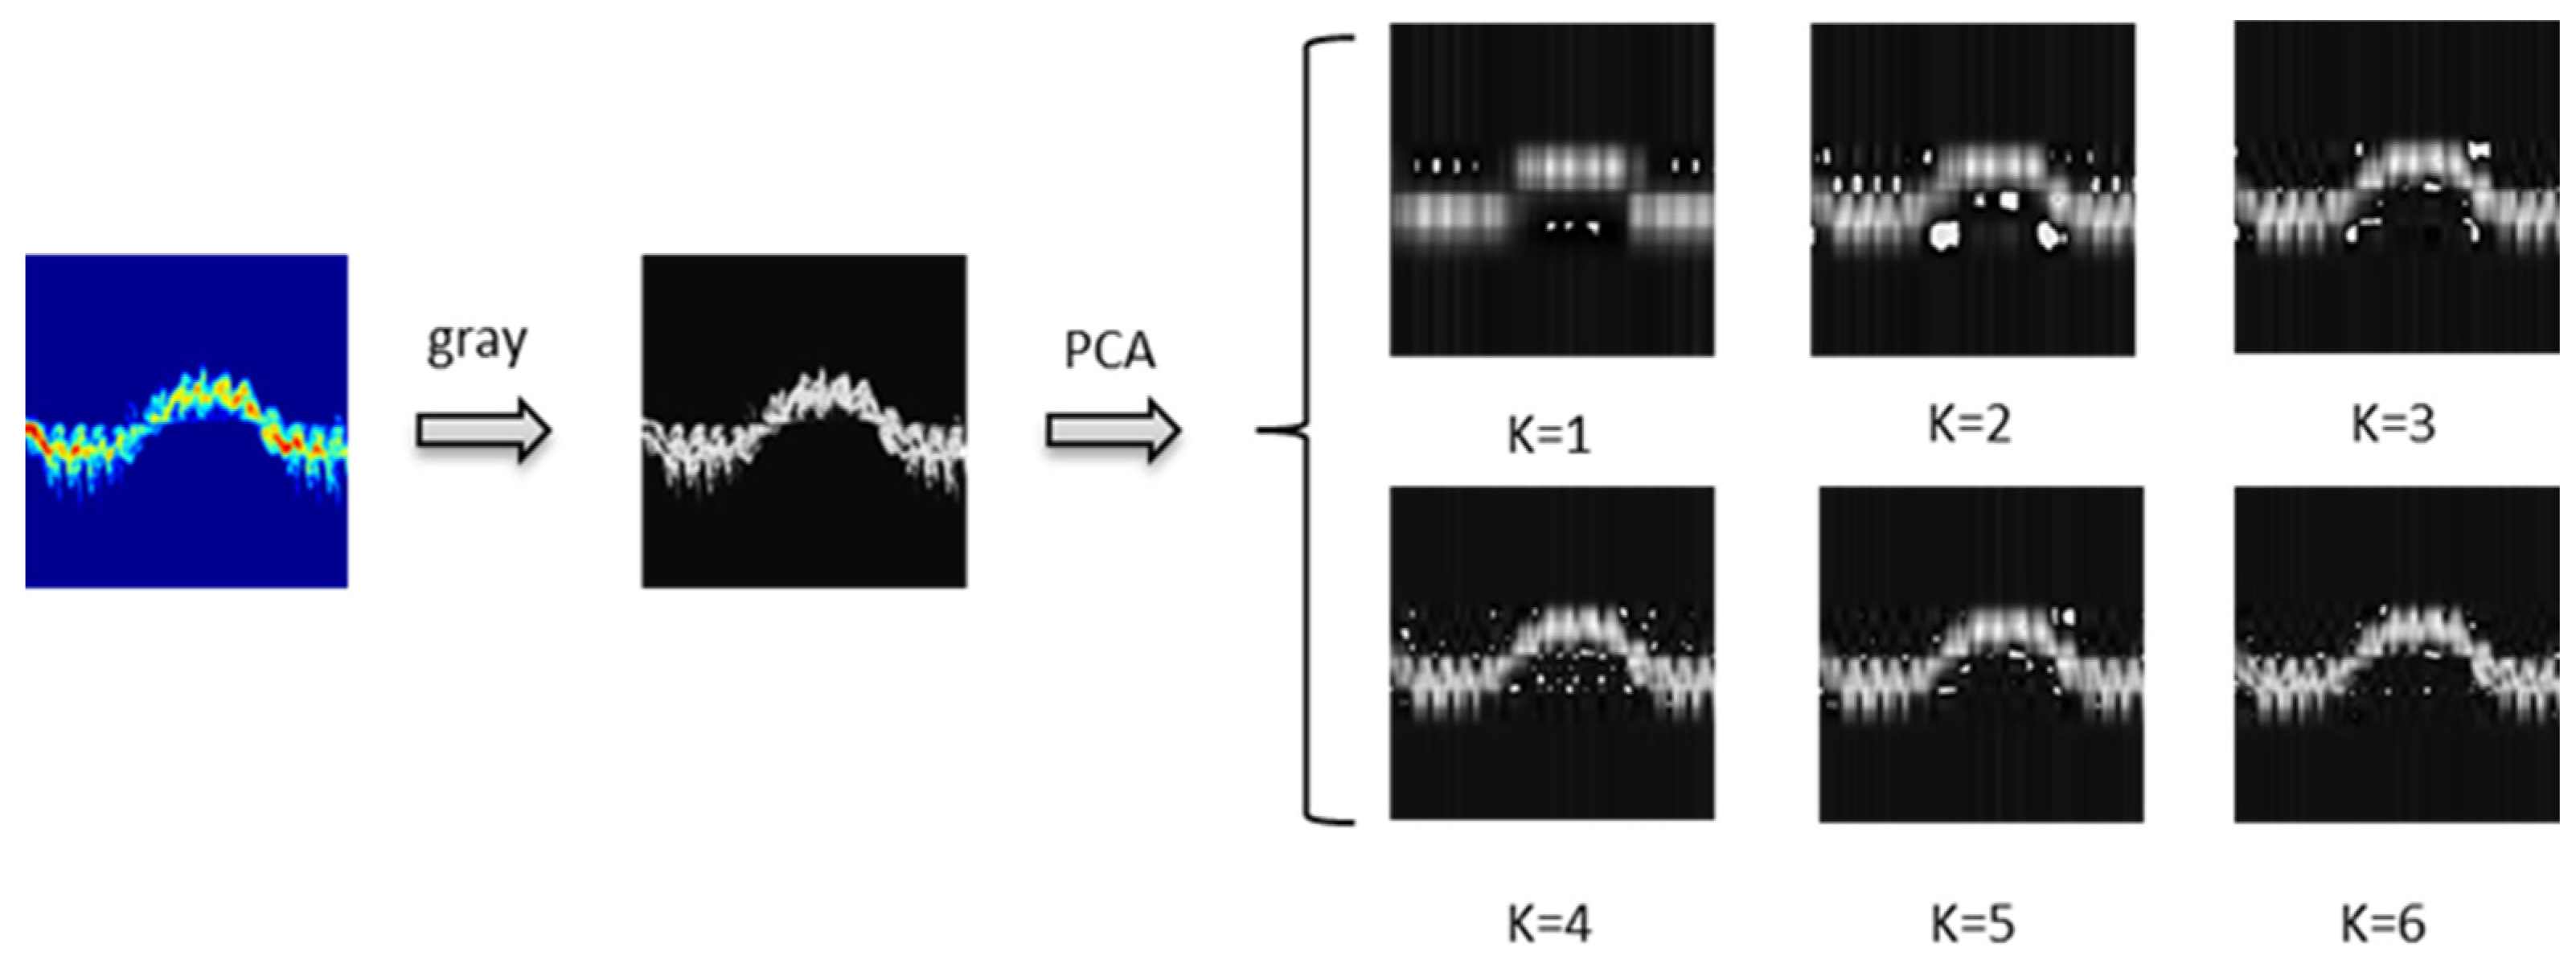
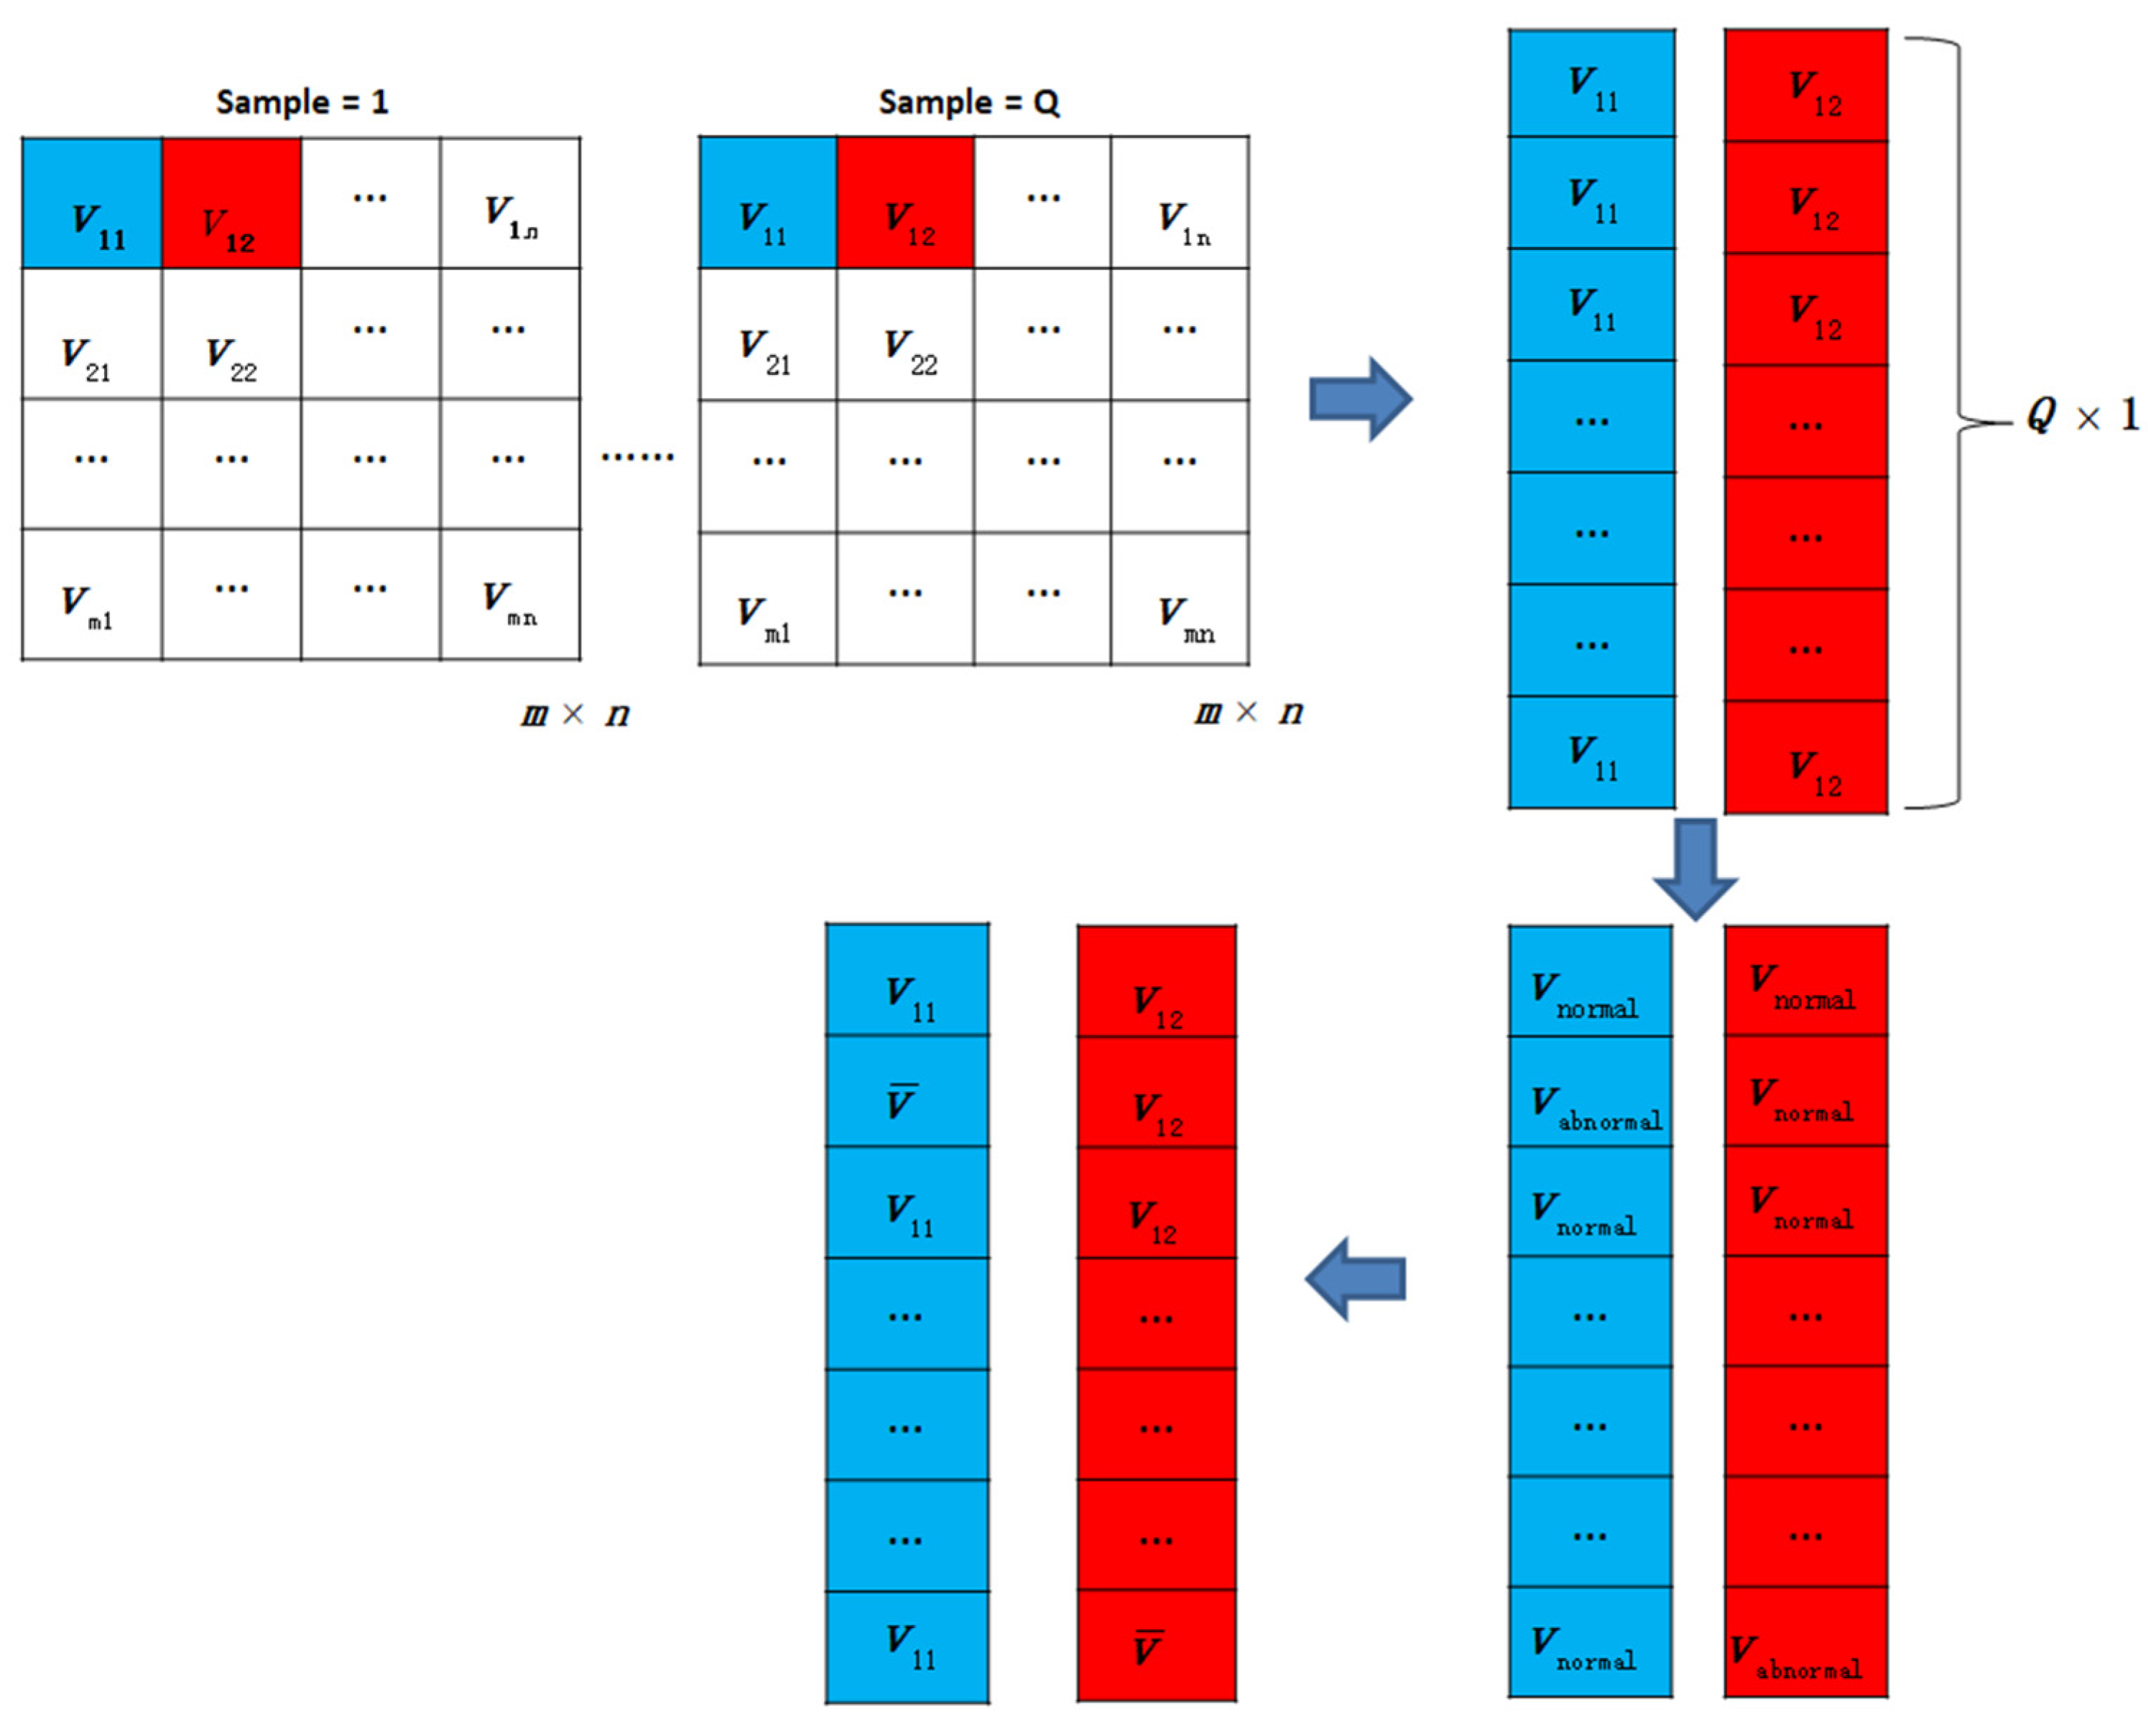
3.2. Improved PCA
4. Experiments and Results
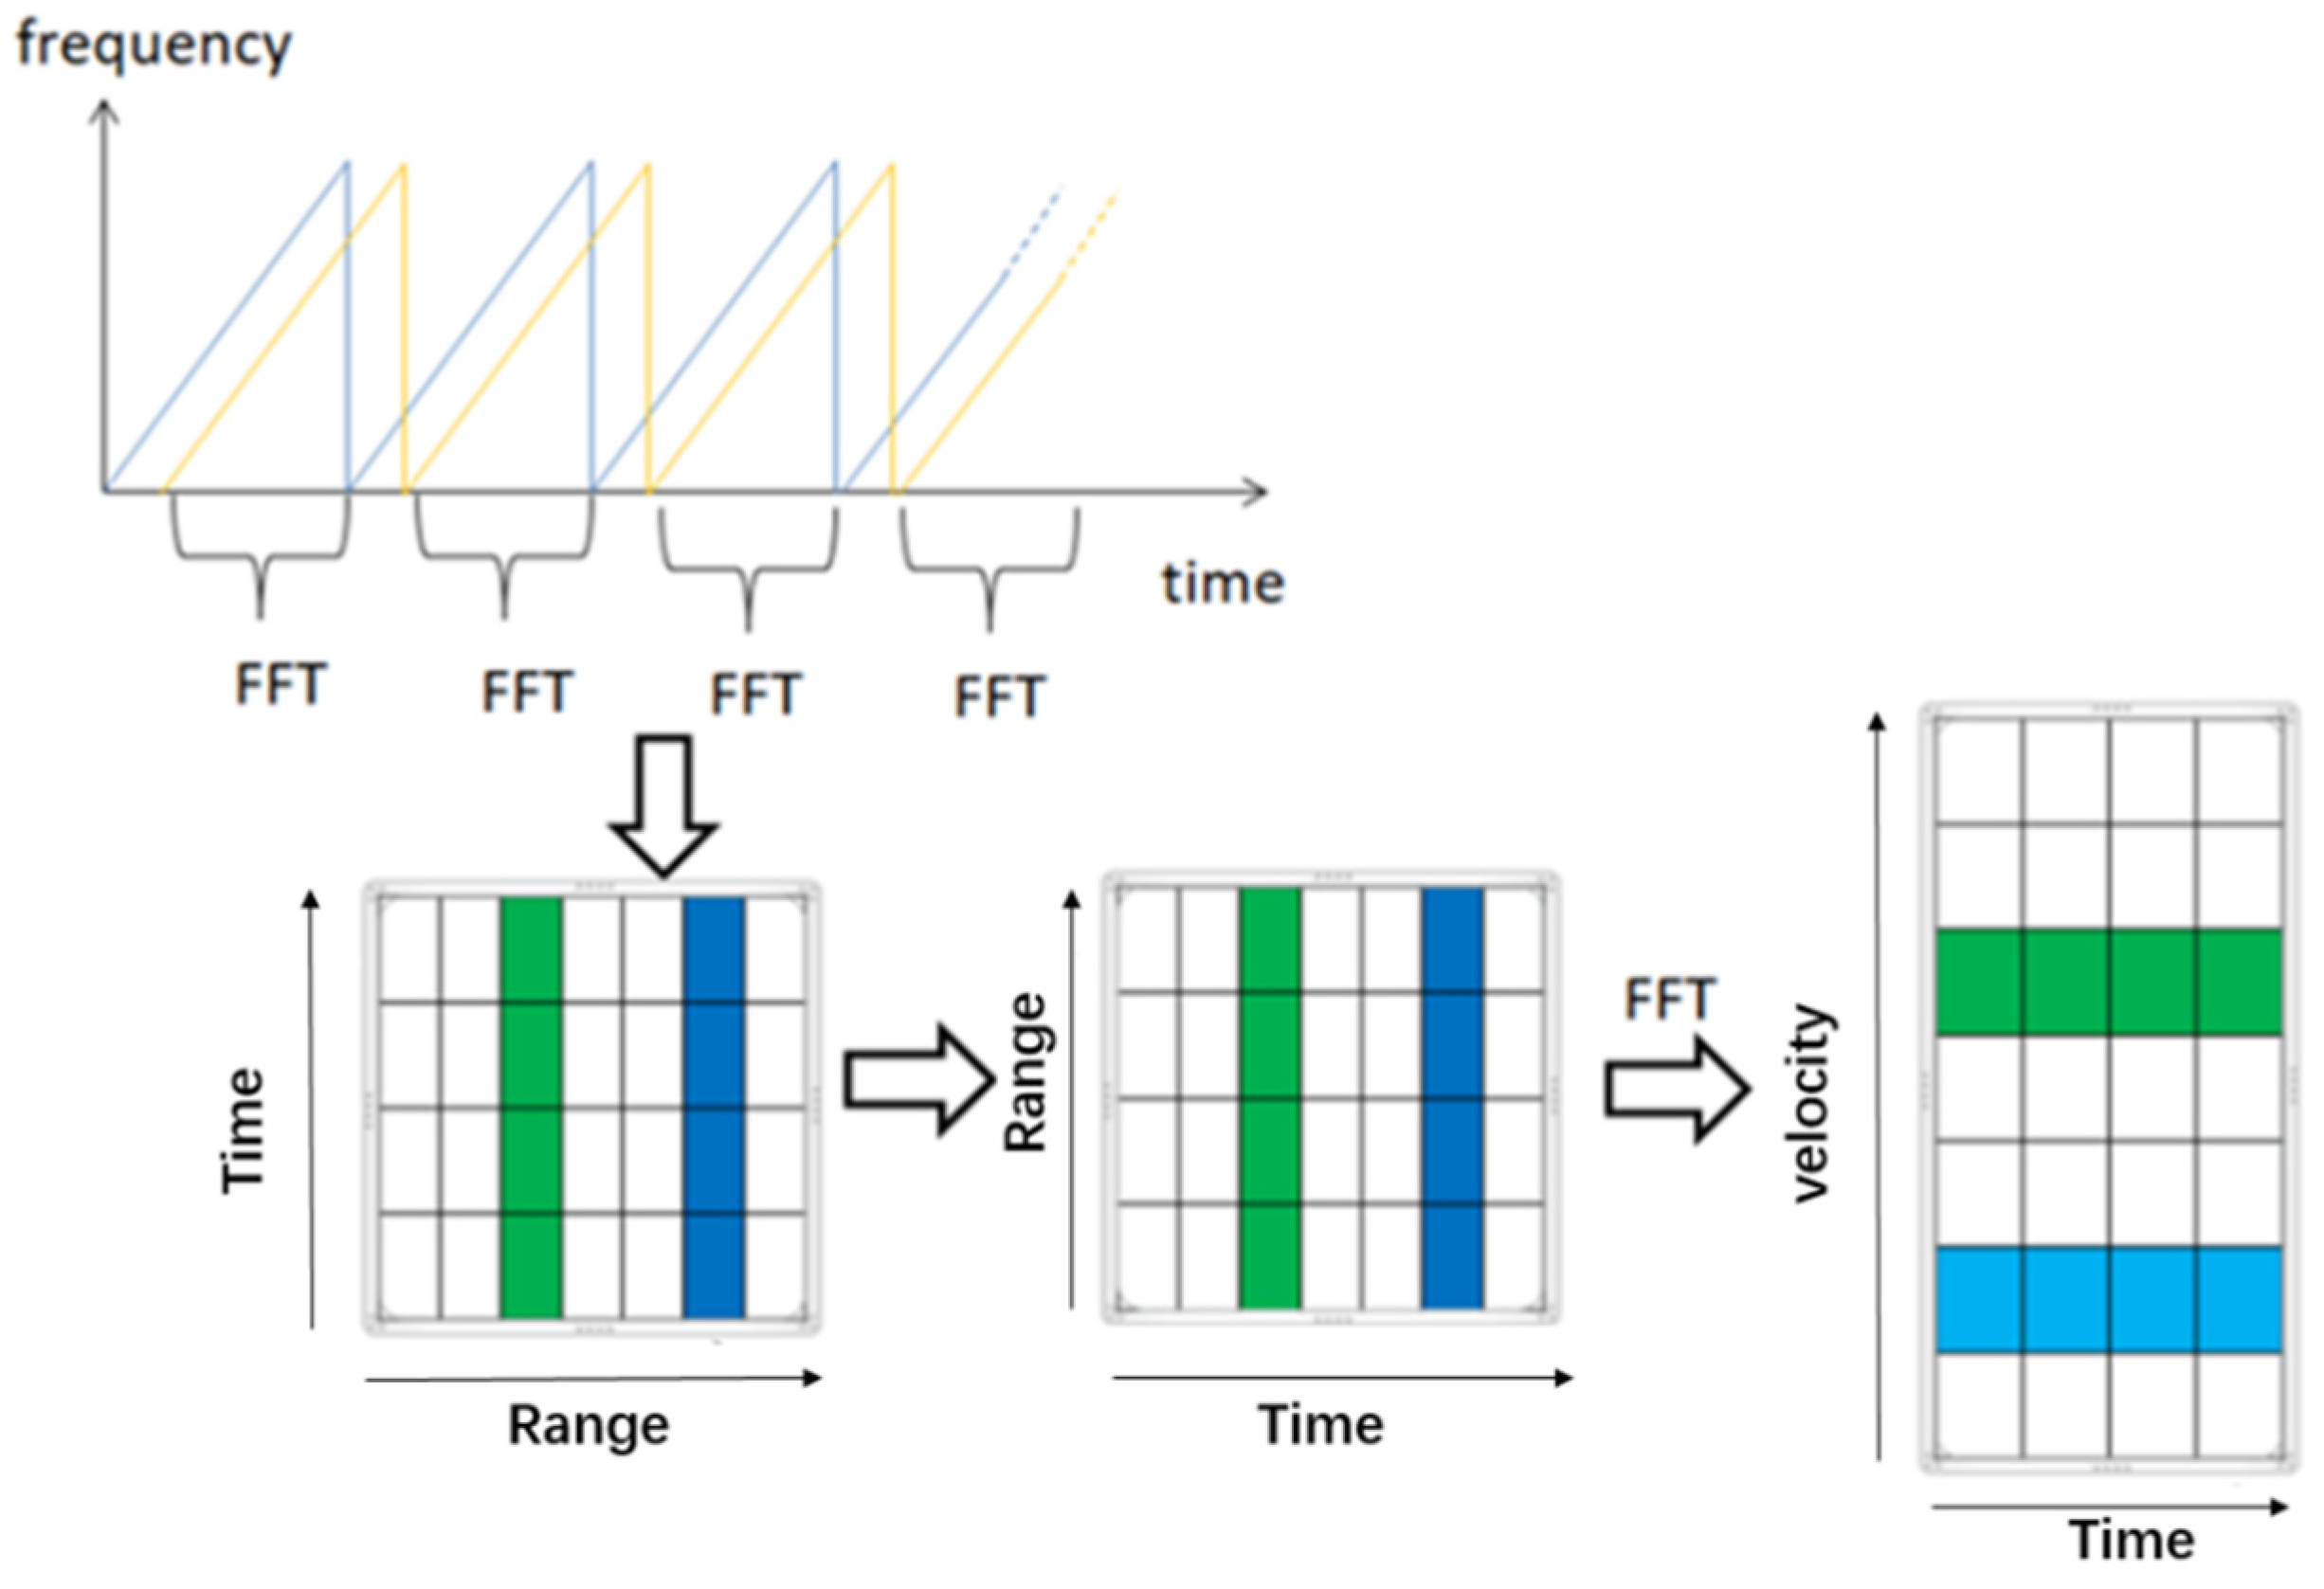
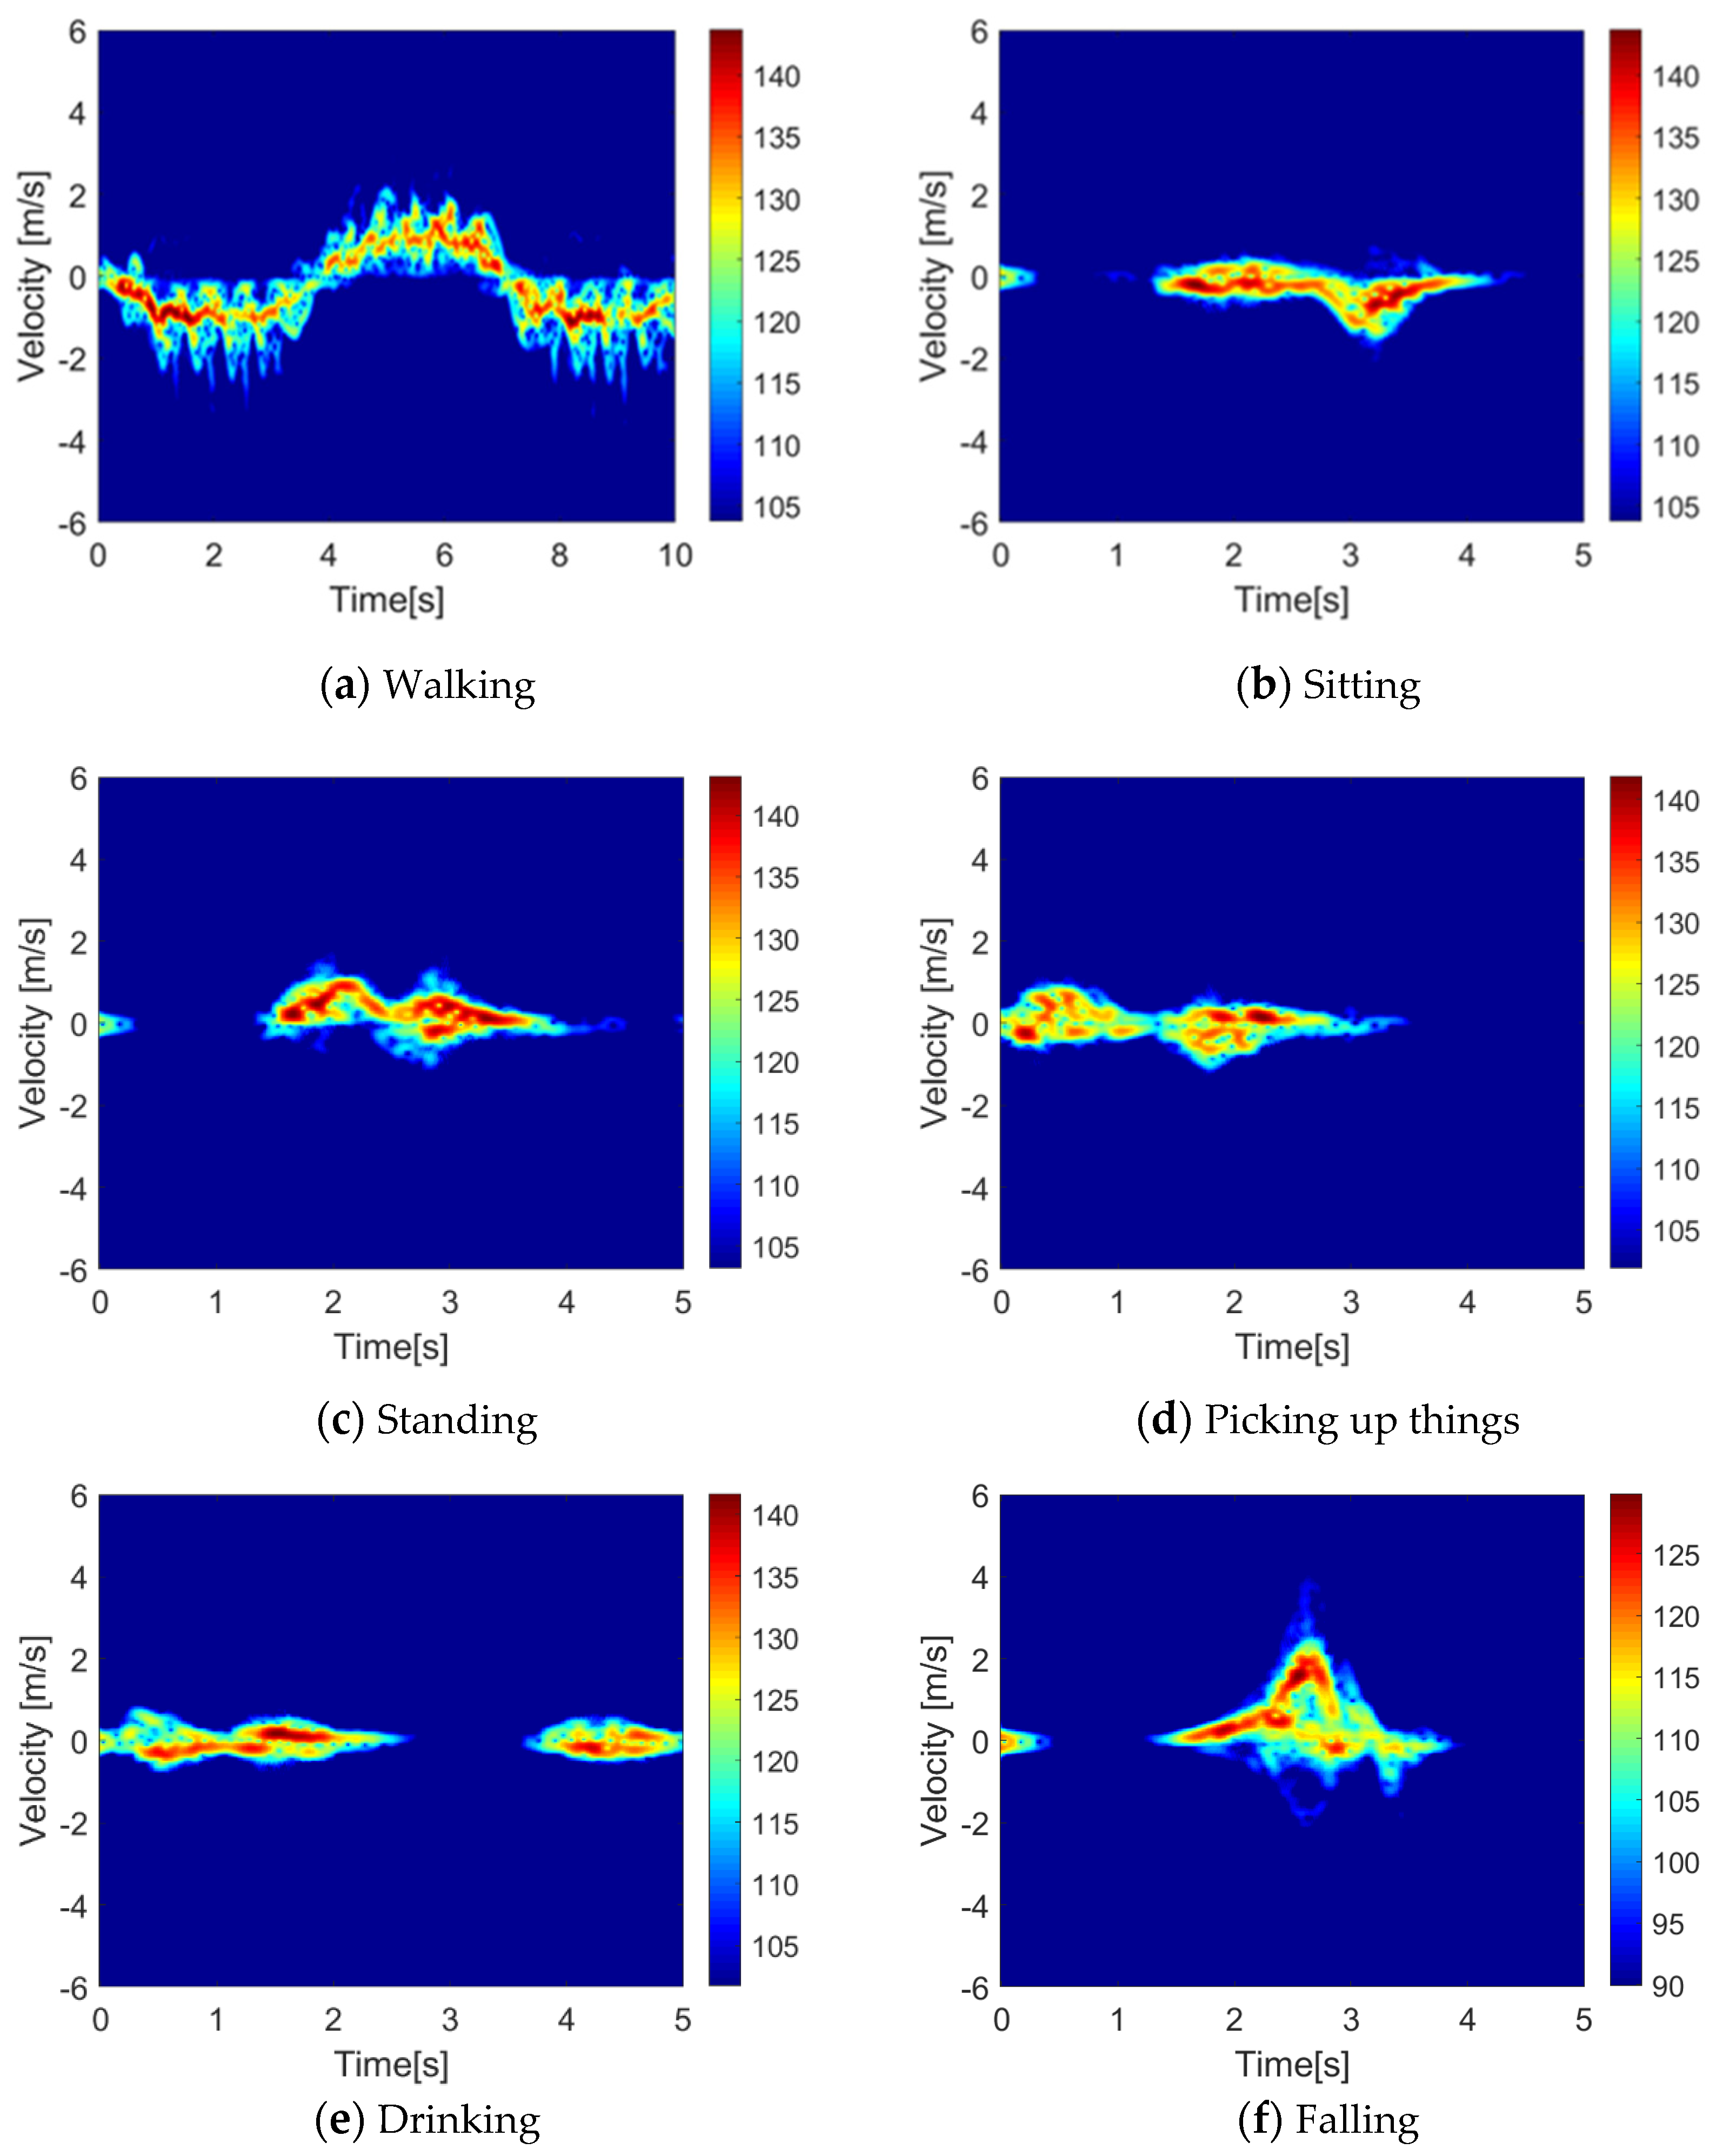
4.1. Dataset
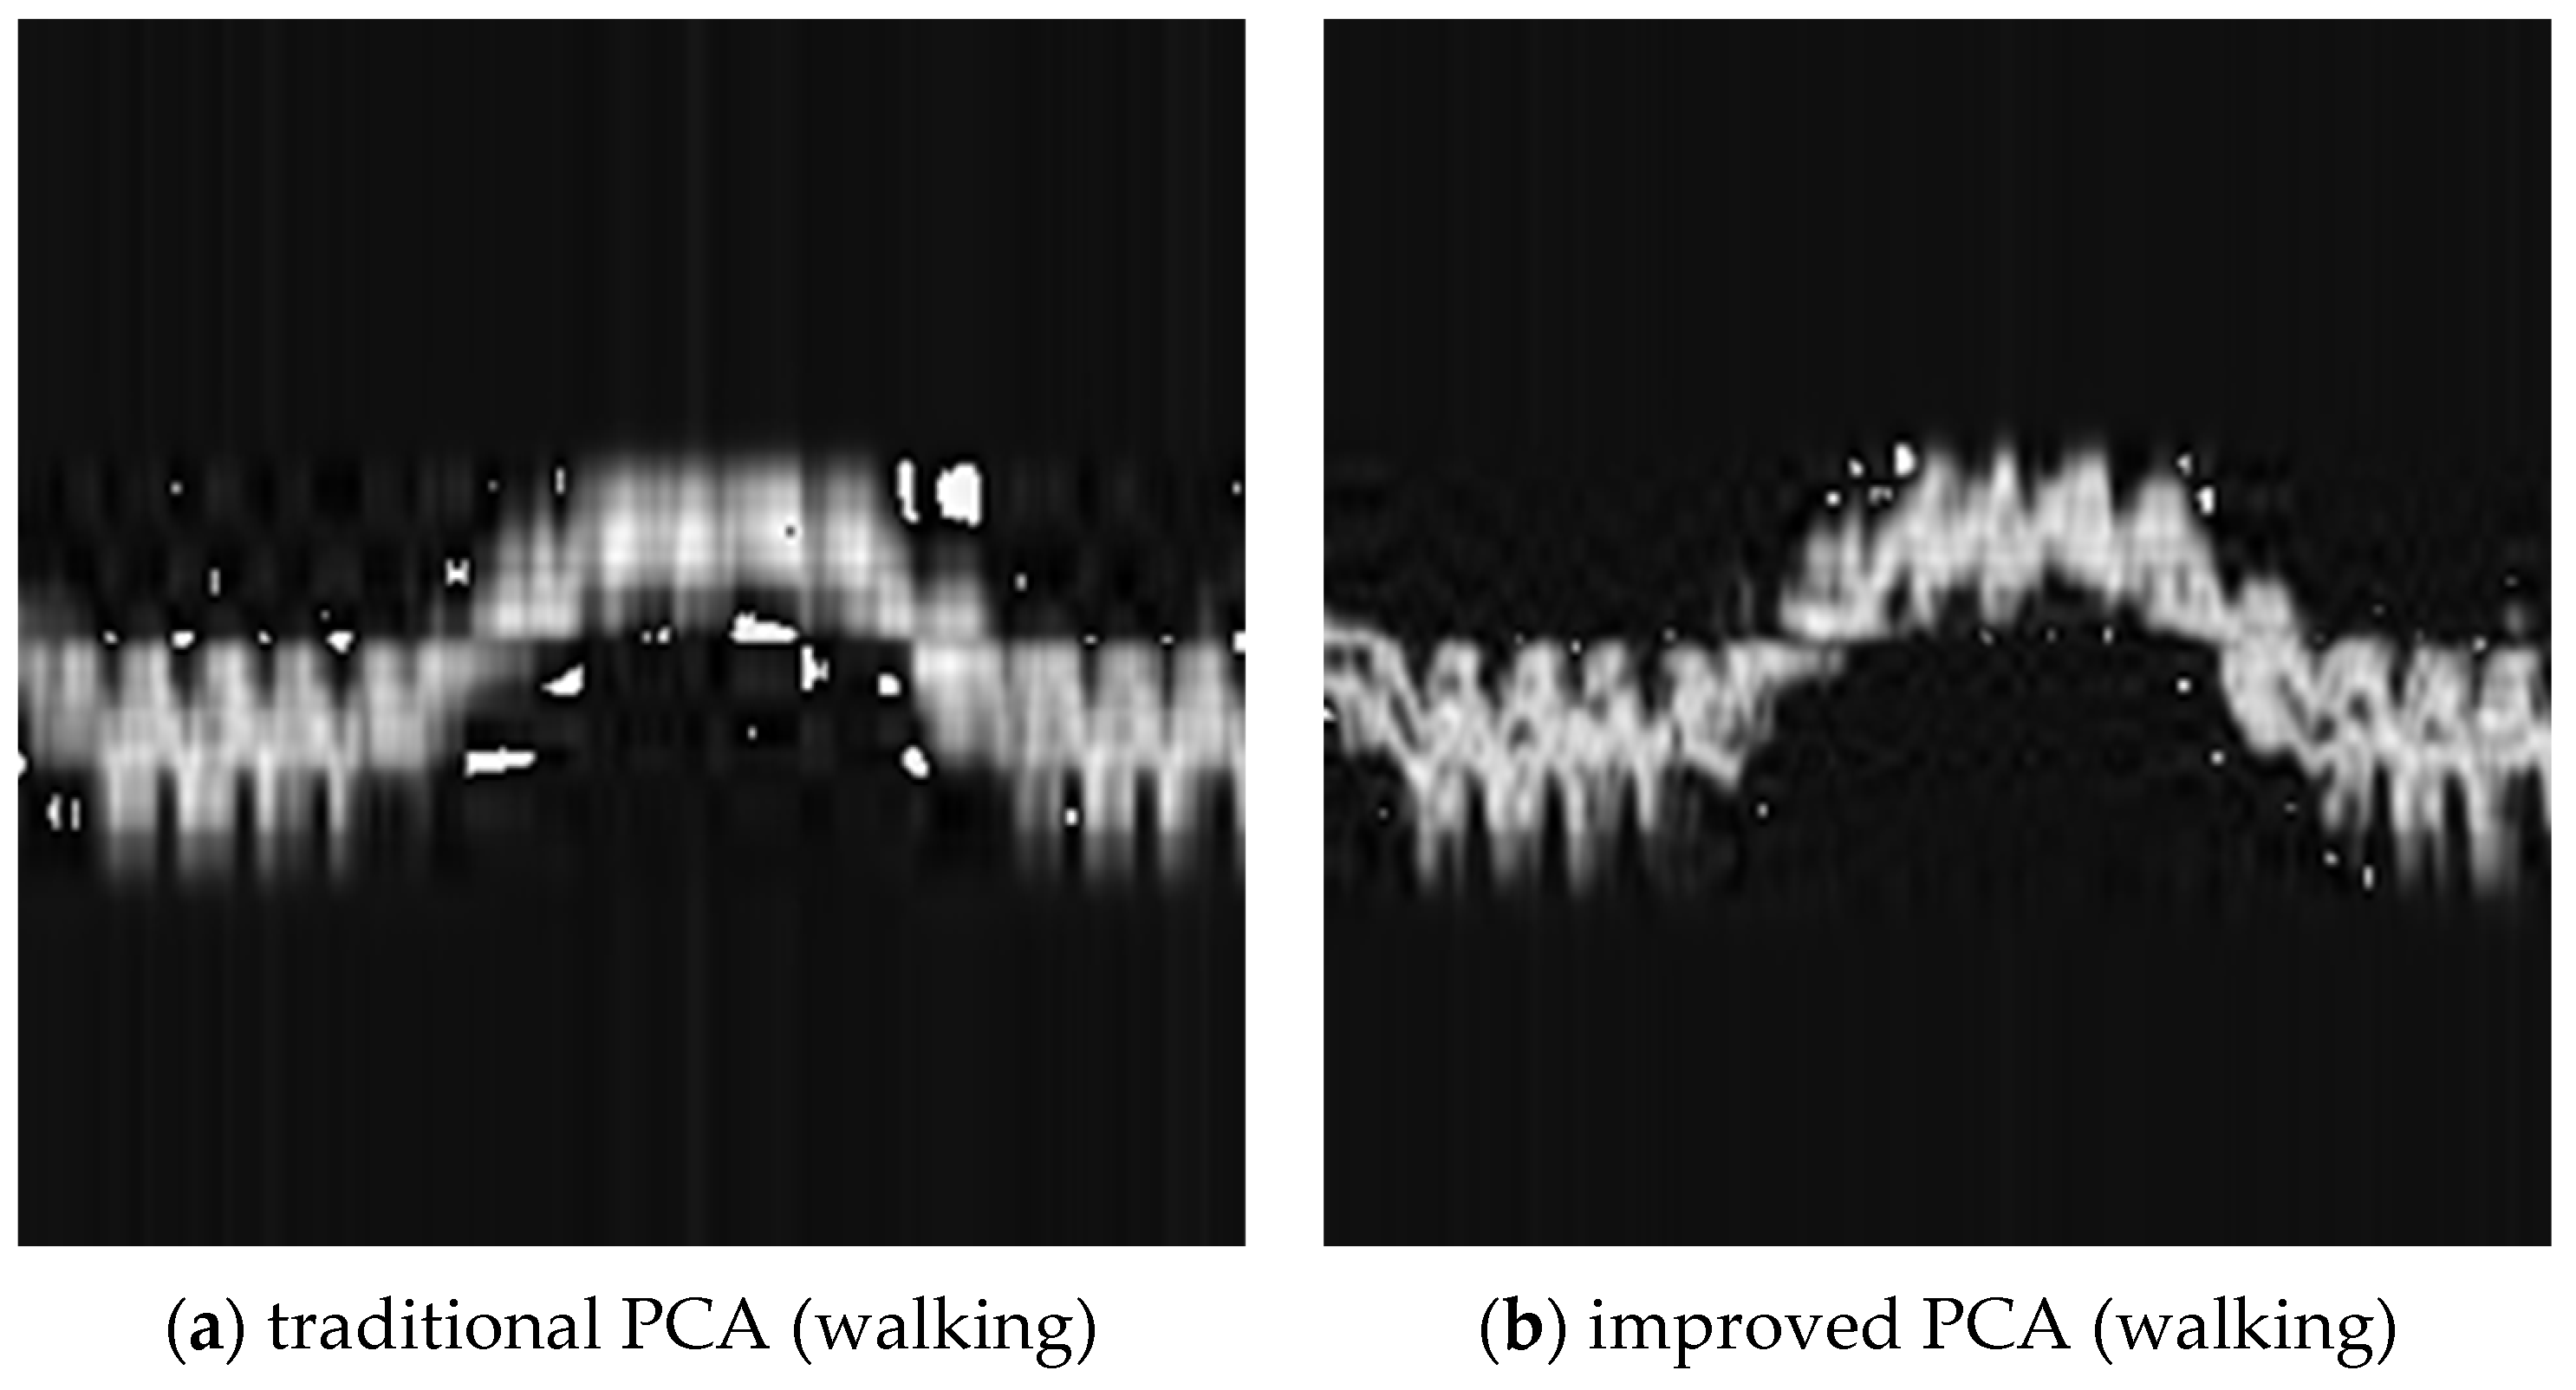
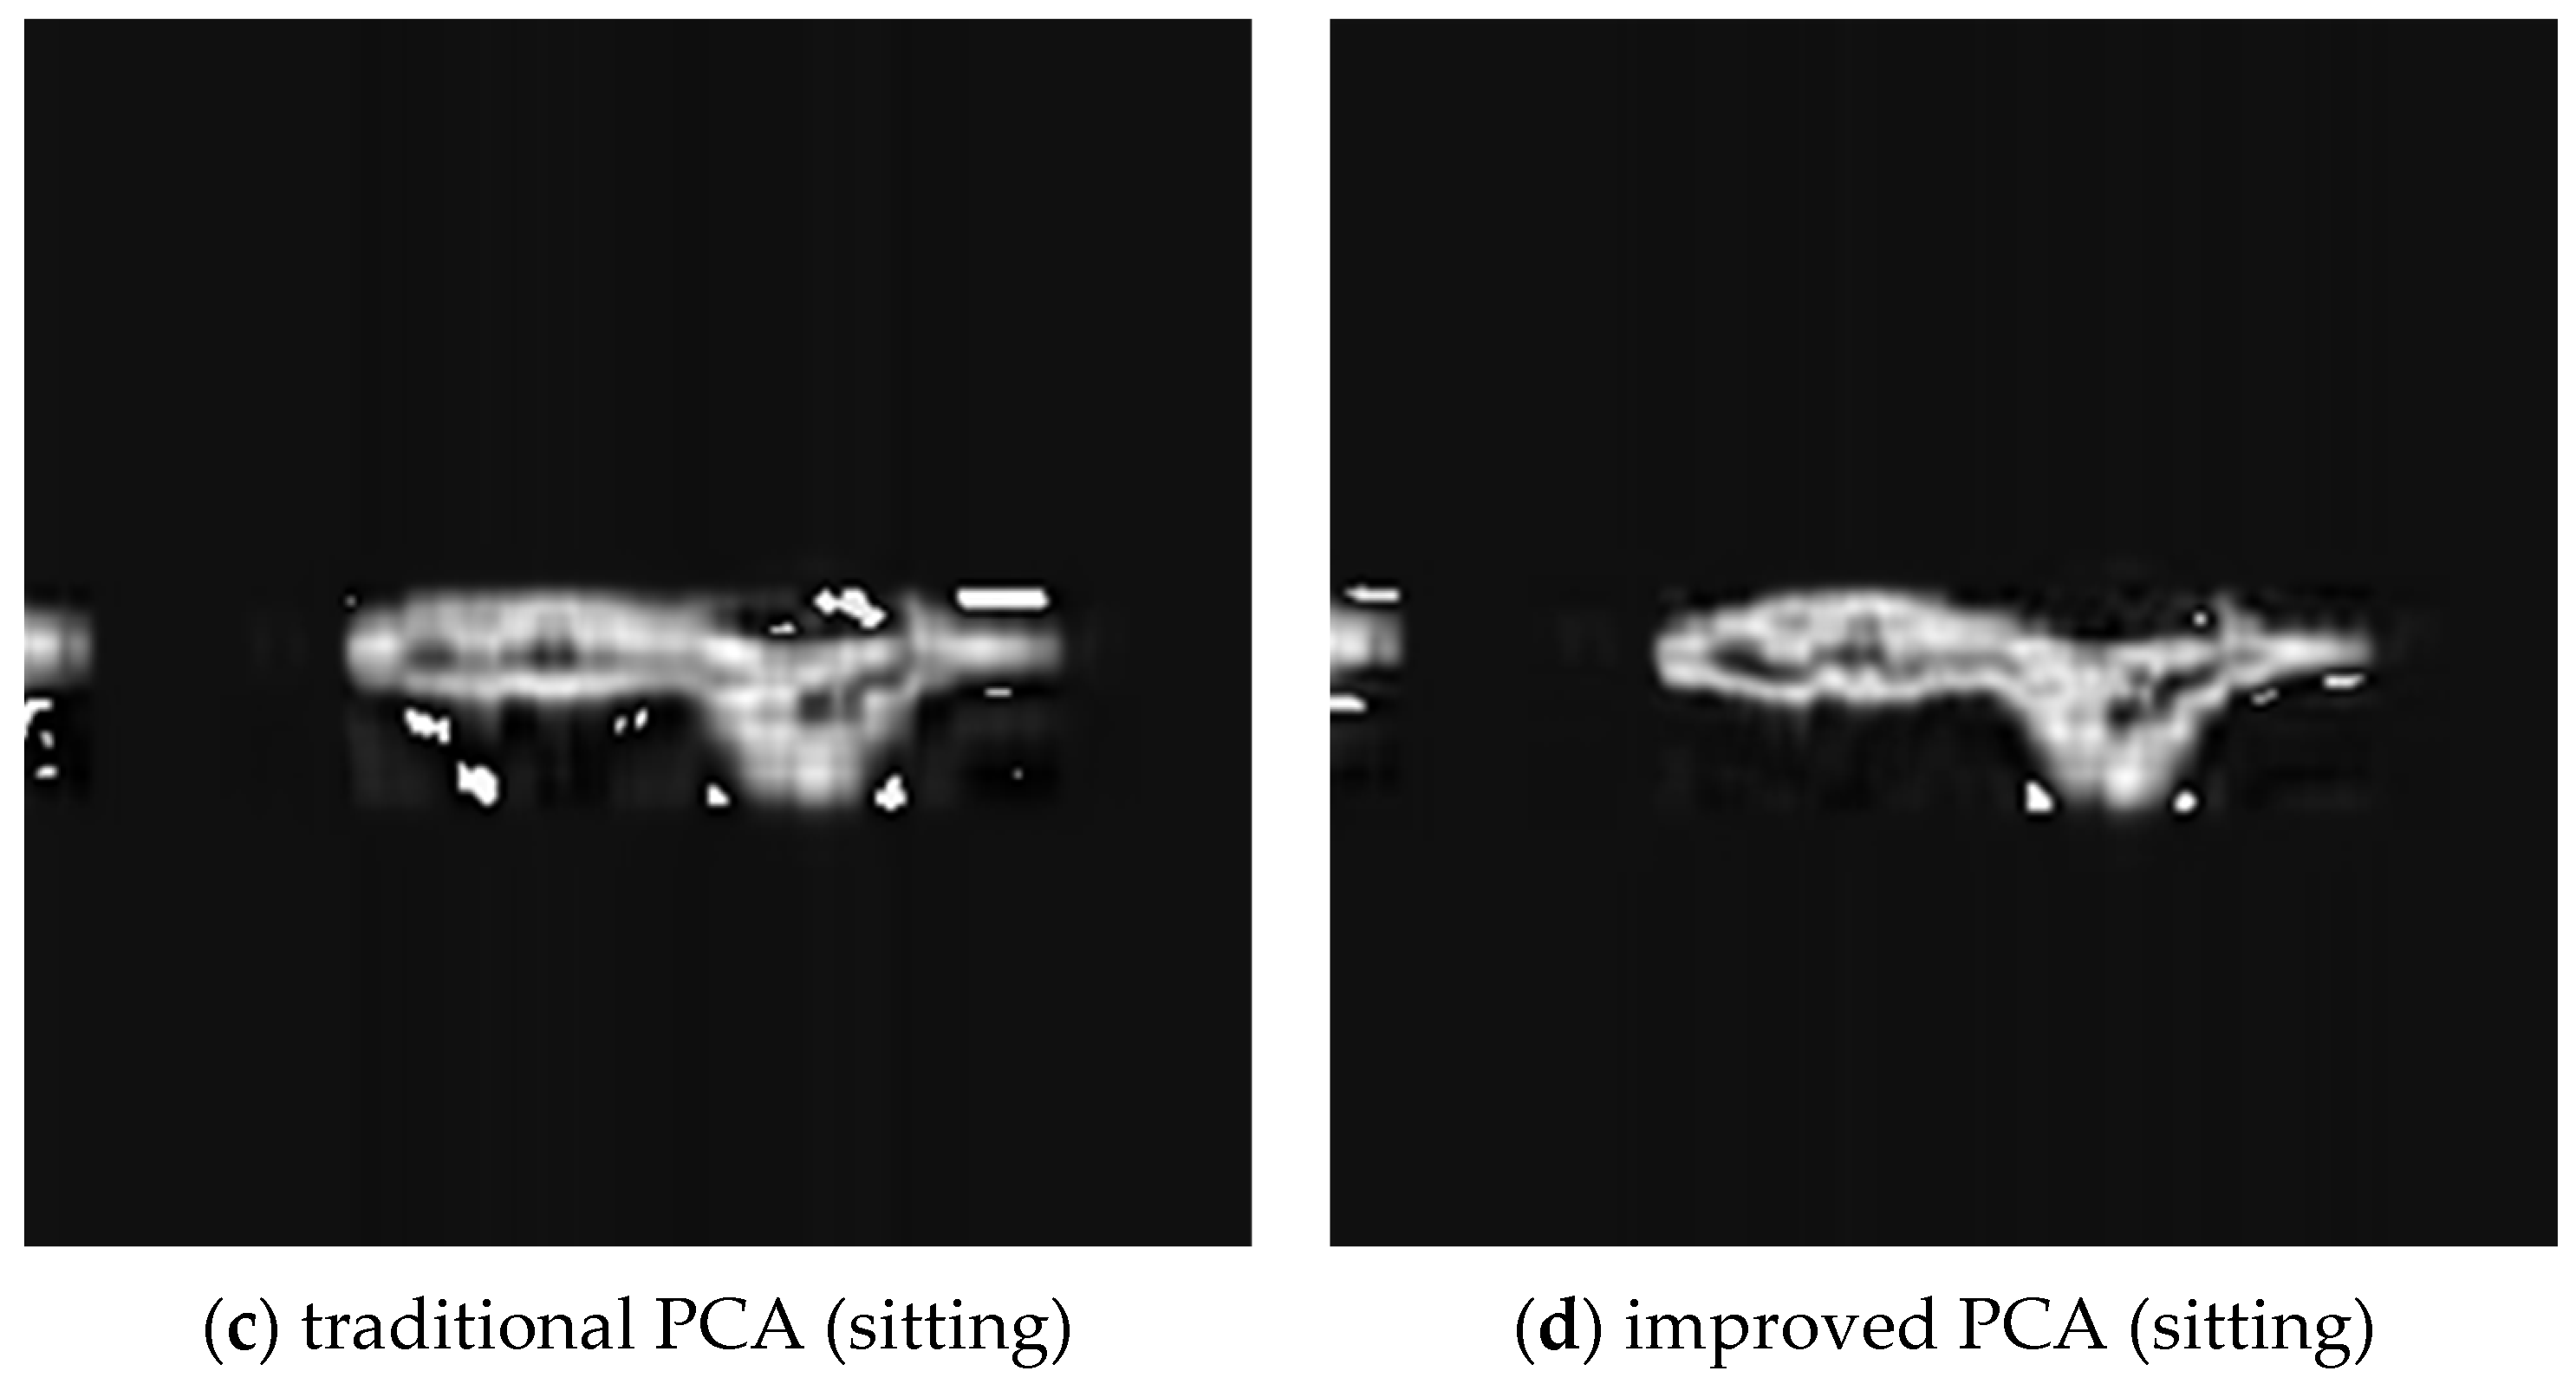
4.2. Signal Preprocess: Improved PCA
4.3. Test and Evaluation
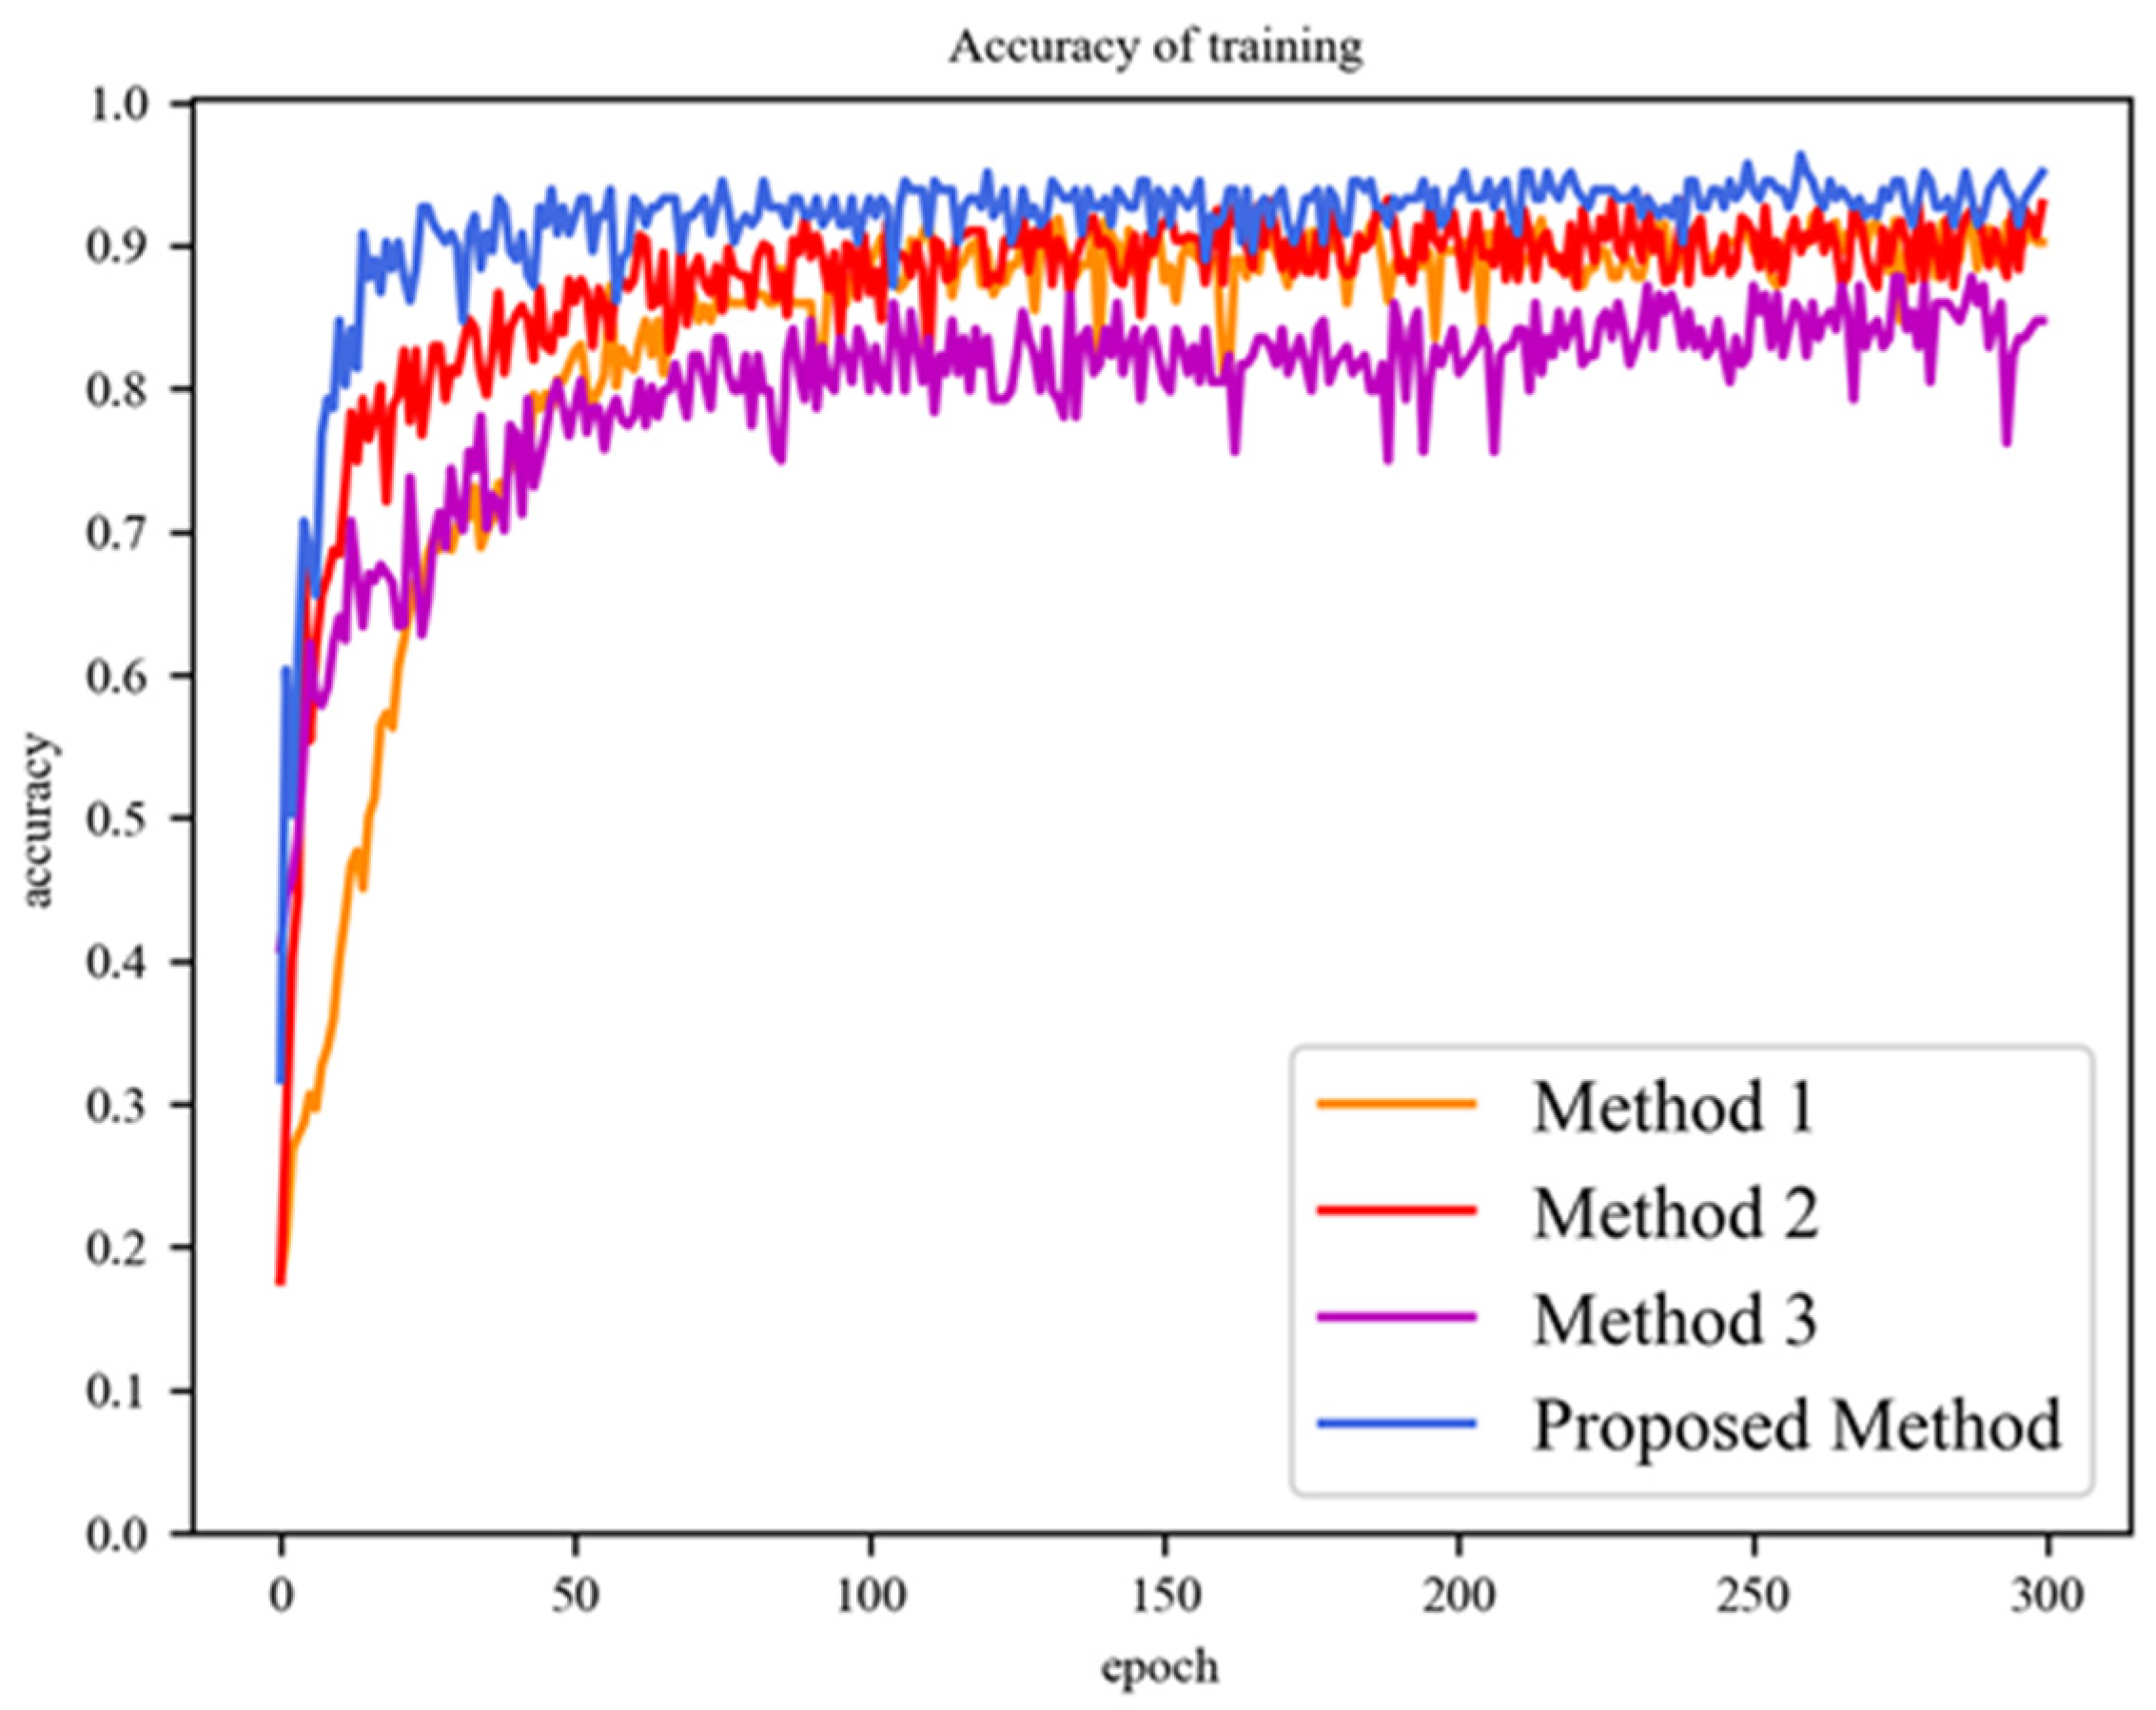
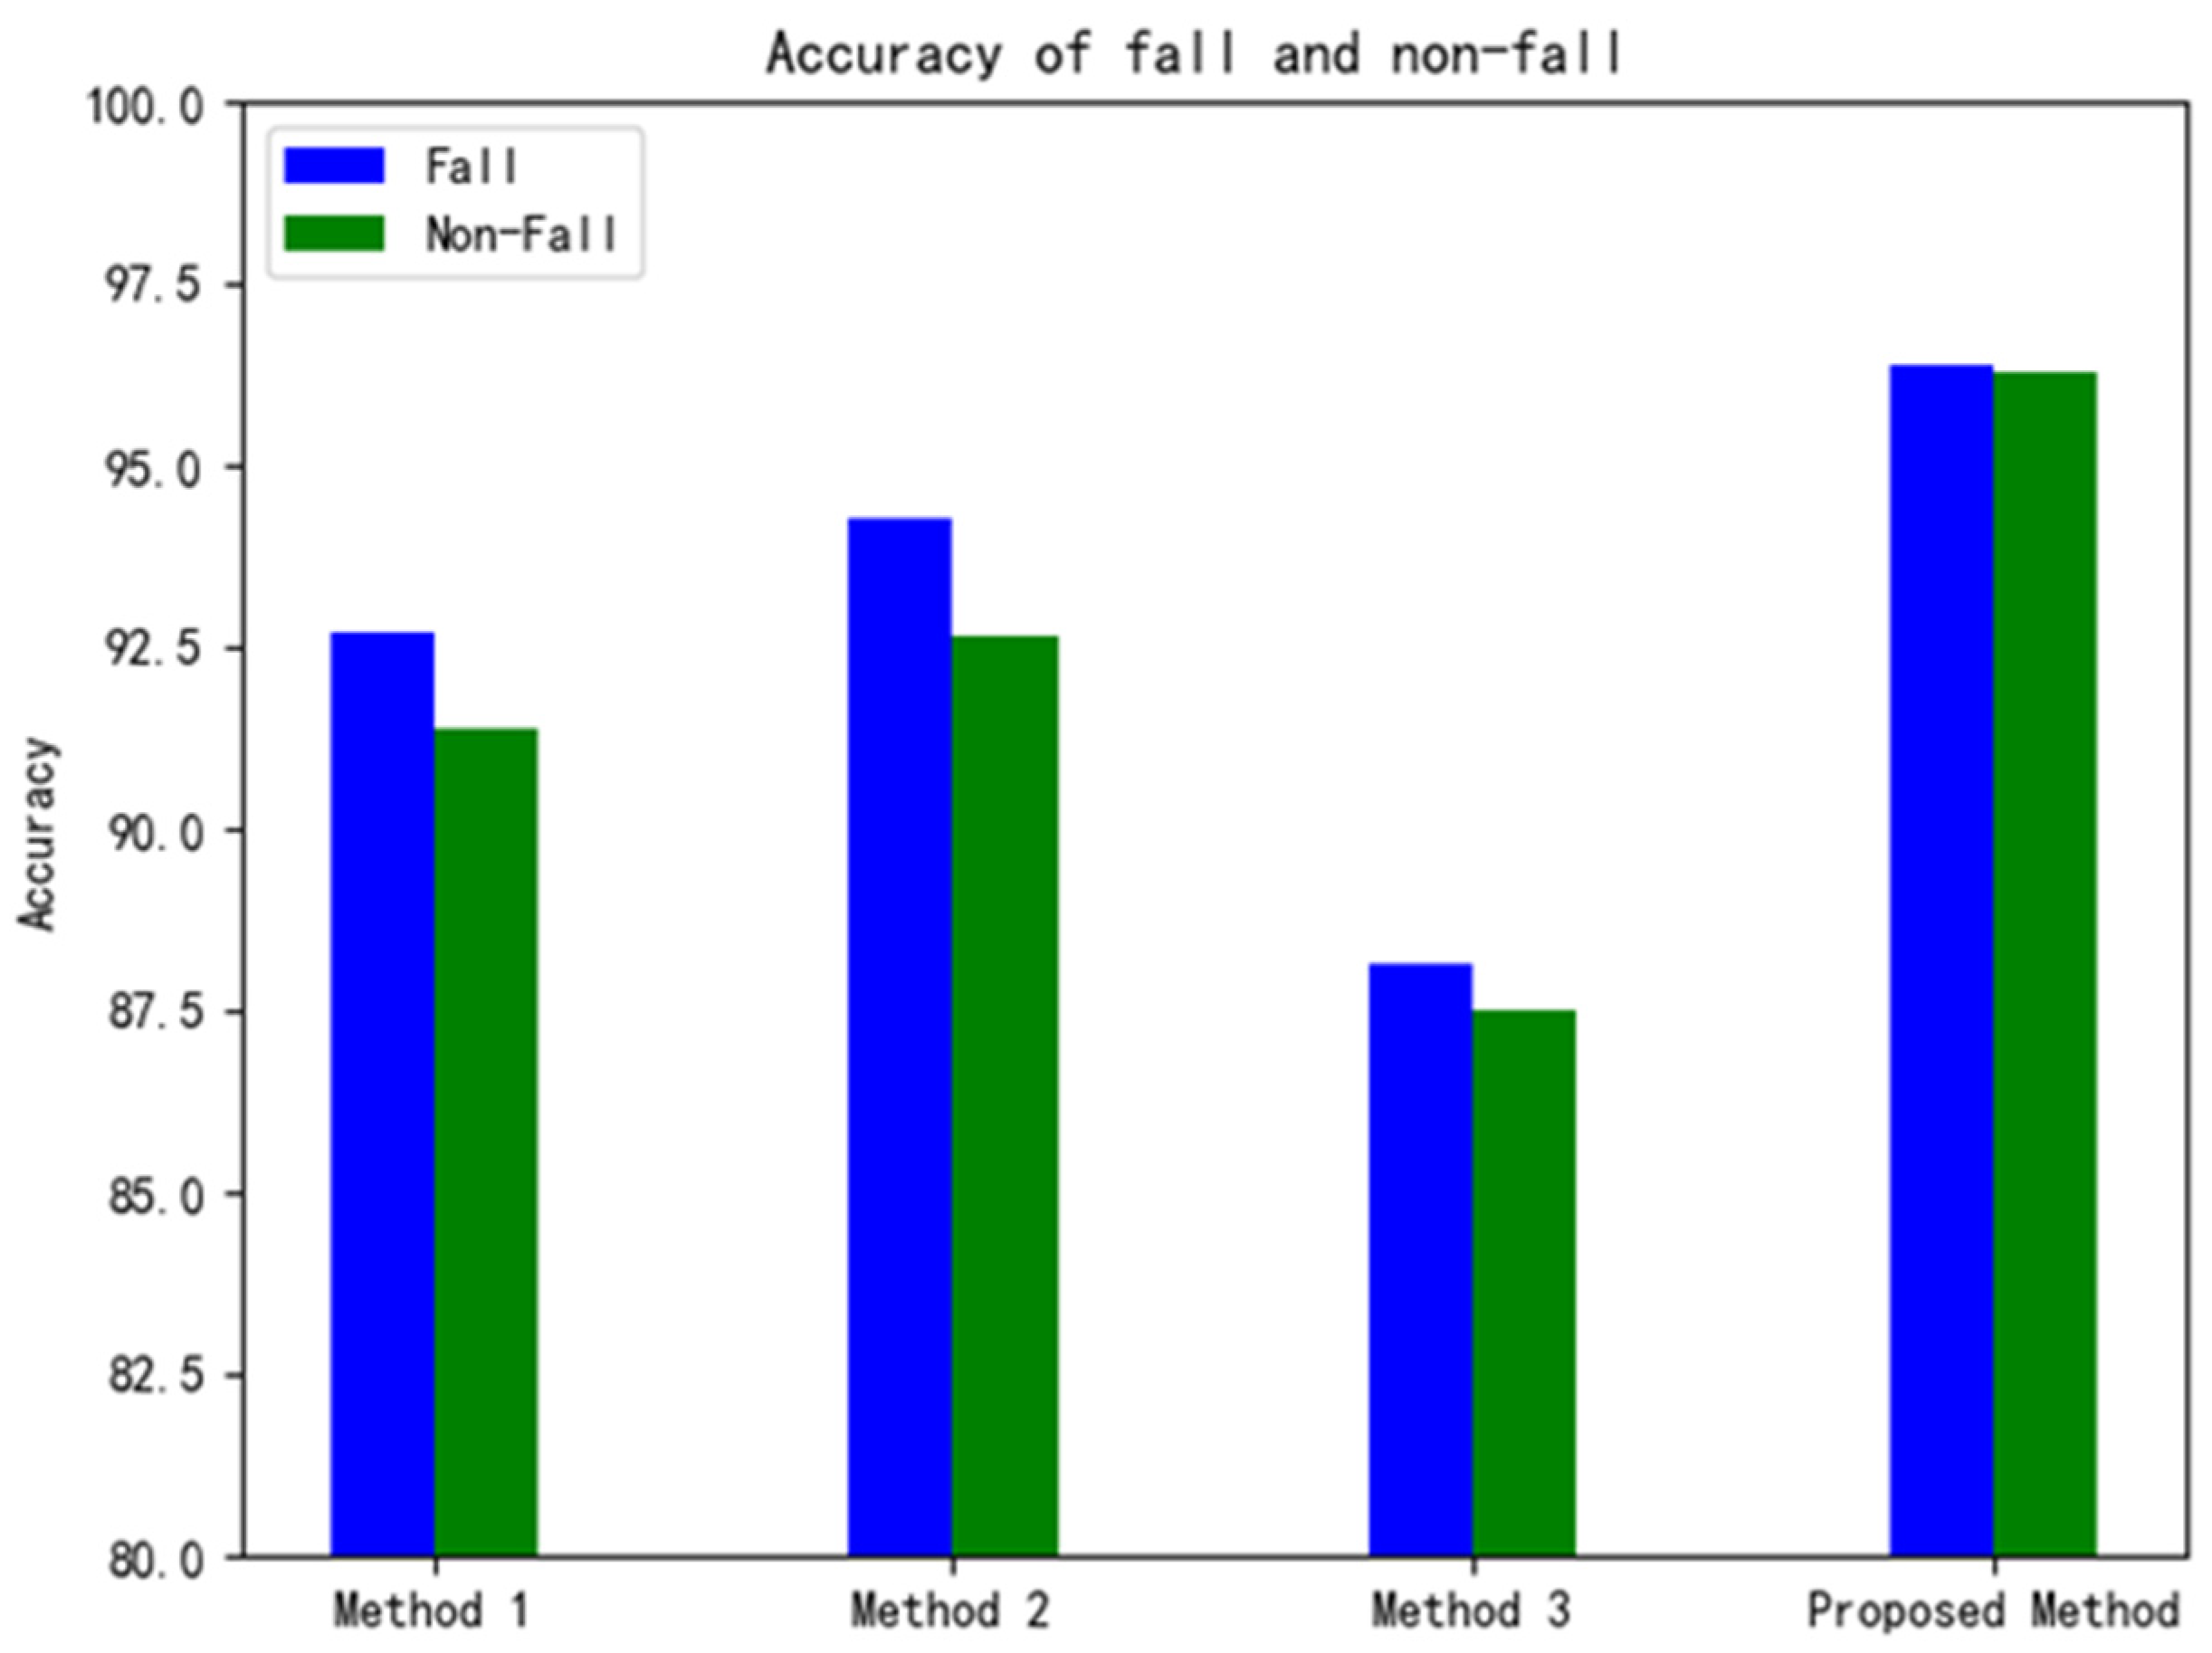
- Method 1: Training raw radar spectrograms through VGG16;
- Method 2: Training raw radar spectrograms through improved VGG16;
- Method 3: Training the data processed by traditional PCA through improved VGG16;
- Proposed Method: Training the data processed by improved PCA through improved VGG16.
4.3.1. Performance Comparison
4.3.2. Performance Study in Fall Detection
5. Conclusions
Author Contributions
Funding
Institutional Review Board Statement
Informed Consent Statement
Data Availability Statement
Conflicts of Interest
References
- De Miguel, K.; Brunete, A.; Hernando, M.; Gambao, E. Home Camera-Based Fall Detection System for the Elderly. Sensors 2017, 17, 2864. [Google Scholar] [CrossRef] [Green Version]
- Australian and New Zealand Hip Fracture Registry (ANZHFR) Steering Group. Australian and New Zealand Guideline for Hip Fracture Care: Improving Outcomes in Hip Fracture Management of Adults. Sydney: Australian and New Zealand Hip Fracture Registry Steering Group. New Zealand, Falls in People Aged 50 and Over. 2018. Available online: https://www.hqsc.govt.nz/our-programmes/health-quality-evaluation/projects/atlas-of-healthcare-variation/falls/ (accessed on 5 September 2019).
- Mubashir, M.; Shao, L.; Seed, L. A survey on fall detection: Principles and approaches. Neurocomputing 2013, 100, 144–152. [Google Scholar] [CrossRef]
- Daher, M.; Diab, A.; El Badaoui El Najjar, M.; Ali Khalil, M.; Charpillet, F. Elder Tracking and Fall Detection System Using Smart Tiles. IEEE Sens. J. 2017, 17, 469–479. [Google Scholar] [CrossRef]
- Alonso, M.; Brunete, A.; Hernando, M.; Gambao, E. Background-Subtraction Algorithm Optimization for Home Camera-Based Night-Vision Fall Detectors. IEEE Access 2019, 7, 152399–152411. [Google Scholar] [CrossRef]
- Fan, K.; Wang, P.; Zhuang, S. Human fall detection using slow feature analysis. Multimed. Tools Appl. 2019, 78, 9101–9128. [Google Scholar] [CrossRef]
- Espinosa, R.; Ponce, H.; Gutiérrez, S.; Martínez-Villaseñor, L.; Brieva, J.; Moya-Albor, E. A vision-based approach for fall detection using multiple cameras and convolutional neural networks: A case study using the UP-Fall detection dataset. Comput. Biol. Med. 2019, 115, 103520. [Google Scholar] [CrossRef] [PubMed]
- Rougier, C.; Meunier, J.; St-Arnaud, A.; Rousseau, J. Robust Video Surveillance for Fall Detection Based on Human Shape Deformation. IEEE Trans. Circuits Syst. Video Technol. 2011, 21, 611–622. [Google Scholar] [CrossRef]
- Lotfi, A.; Albawendi, S.; Powell, H.; Appiah, K.; Langensiepen, C. Supporting Independent Living for Older Adults; Employing a Visual Based Fall Detection Through Analysing the Motion and Shape of the Human Body. IEEE Access 2018, 6, 70272–70282. [Google Scholar] [CrossRef]
- Albawendi, S.; Lotfi, A.; Powell, H.; Appiah, K. Video Based Fall Detection using Features of Motion, Shape and Histogram. In Proceedings of the 11th ACM International Conference on Pervasive Technologies Related to Assistive Environments (PETRA), Corfu, Greece, 26–29 June 2018. [Google Scholar]
- Rougier, C.; Meunier, J.; Arnaud, A.; Rousseau, J. Fall Detection from Human Shape and Motion History Using Video Surveillance. In Proceedings of the 21st International Conference on Advanced Information Networking and Applications Workshops (AINAW07), Niagara Falls, ON, Canada, 21–23 May 2007; Volume 2, pp. 875–880. [Google Scholar] [CrossRef]
- Lai, C.-F.; Chang, S.-Y.; Chao, H.-C.; Huang, Y.-M. Detection of Cognitive Injured Body Region Using Multiple Triaxial Accelerometers for Elderly Falling. IEEE Sens. J. 2011, 11, 763–770. [Google Scholar] [CrossRef]
- Núñez-Marcos, A.; Azkune, G.; Arganda-Carreras, I. Vision-Based Fall Detection with Convolutional Neural Networks. Wirel. Commun. Mob. Comput. 2017, 2017, 9474806. [Google Scholar] [CrossRef] [Green Version]
- Khraief, C.; Benzarti, F.; Amiri, H. Elderly fall detection based on multi-stream deep convolutional networks. Multimed. Tools Appl. 2020, 79, 19537–19560. [Google Scholar] [CrossRef]
- Igual, R.; Medrano, C.; Plaza, I. Challenges, issues and trends in fall detection systems. Biomed. Eng. Online 2013, 12, 24–66. [Google Scholar] [CrossRef] [PubMed] [Green Version]
- Xu, T.; Zhou, Y. Elders’ fall detection based on biomechanical features using depth camera. Int. J. Wavelets Multiresolut. Inf. Process. 2018, 16, 1840005. [Google Scholar] [CrossRef]
- Bianchi, F.; Redmond, S.J.; Narayanan, M.R.; Cerutti, S.; Lovell, N.H. Barometric Pressure and Triaxial Accelerometry-Based Falls Event Detection. IEEE Trans. Neural Syst. Rehabil. Eng. 2010, 18, 619–627. [Google Scholar] [CrossRef]
- Bourke, A.; O’Brien, J.; Lyons, G. Evaluation of a threshold-based tri-axial accelerometer fall detection algorithm. Gait Posture 2007, 26, 194–199. [Google Scholar] [CrossRef]
- Li, Q.; Zhou, G.; Stankovic, J.A. Accurate, Fast Fall Detection Using Posture and Context Information. In Proceedings of the 6th ACM Conference on Embedded Networked Sensor Systems, Raleigh, NC, USA, 5–7 November 2008. [Google Scholar]
- Nyan, M.; Tay, F.E.; Murugasu, E. A wearable system for pre-impact fall detection. J. Biomech. 2008, 41, 3475–3481. [Google Scholar] [CrossRef]
- Le, T.M.; Pan, R. Accelerometer-based sensor network for fall detection. In Proceedings of the 2009 IEEE Biomedical Circuits and Systems Conference, Beijing, China, 26–28 November 2009. [Google Scholar] [CrossRef]
- Pierleoni, P.; Belli, A.; Palma, L.; Pellegrini, M.; Pernini, L.; Valenti, S. A High Reliability Wearable Device for Elderly Fall Detection. IEEE Sens. J. 2015, 15, 4544–4553. [Google Scholar] [CrossRef]
- Mao, A.; Ma, X.; He, Y.; Luo, J. Highly Portable, Sensor-Based System for Human Fall Monitoring. Sensors 2017, 17, 2096. [Google Scholar] [CrossRef] [Green Version]
- Tsinganos, P.; Skodras, A. A Smartphone-based Fall Detection System for the Elderly. In Proceedings of the 10th International Symposium on Image and Signal Processing and Analysis, Ljubljana, Slovenia, 18–20 September 2017. [Google Scholar]
- Grossi, G.; Lanzarotti, R.; Napoletano, P.; Noceti, N.; Odone, F. Positive technology for elderly well-being: A review. Pattern Recognit. Lett. 2020, 137, 61–70. [Google Scholar] [CrossRef]
- Liu, L.; Popescu, M.; Skubic, M.; Rantz, M. An Automatic Fall Detection Framework Using Data Fusion of Doppler Radar and Motion Sensor Network. In Proceedings of the 36th Annual International Conference of the IEEE-Engineering-in-Medicine-and-Biology-Society (EMBC), Chicago, IL, USA, 26–30 August 2014. [Google Scholar]
- Sadreazami, H.; Bolic, M.; Rajan, S. Fall Detection Using Standoff Radar-Based Sensing and Deep Convolutional Neural Network. IEEE Trans. Circuits Syst. II: Express Briefs 2020, 67, 197–201. [Google Scholar] [CrossRef]
- Tsuchiyama, K.; Kajiwara, A. Accident detection and health-monitoring UWB sensor in toilet. In Proceedings of the IEEE Topical Conference on Wireless Sensors and Sensor Networks (WiSNet), Orlando, FL, USA, 20–23 January 2019. [Google Scholar]
- Bhattacharya, A.; Vaughan, R. Deep Learning Radar Design for Breathing and Fall Detection. IEEE Sens. J. 2020, 20, 5072–5085. [Google Scholar] [CrossRef]
- Maitre, J.; Bouchard, K.; Gaboury, S. Fall Detection with UWB Radars and CNN-LSTM Architecture. IEEE J. Biomed. Health Inform. 2021, 25, 1273–1283. [Google Scholar] [CrossRef] [PubMed]
- Erol, B.; Amin, M.G.; Boashash, B. Range-Doppler radar sensor fusion for fall detection. In Proceedings of the 2017 IEEE Radar Conference (RadarConf), Seattle, WA, USA, 8–12 May 2017. [Google Scholar] [CrossRef]
- Hochreiter, S.; Obermayer, K. Optimal gradient-based learning using importance weights. In Proceedings of the IEEE International Joint Conference on Neural Networks (IJCNN 2005), Montreal, QC, Canada, 31 July–4 August 2005. [Google Scholar]
- Wang, M.; Zhang, Y.D.; Cui, G. Human motion recognition exploiting radar with stacked recurrent neural network. Digit. Signal Process. 2019, 87, 125–131. [Google Scholar] [CrossRef]
- García, E.; Villar, M.; Fáñez, M.; Villar, J.R.; de la Cal, E.; Cho, S.-B. Towards effective detection of elderly falls with CNN-LSTM neural networks. Neurocomputing 2022, 500, 231–240. [Google Scholar] [CrossRef]
- Bouchard, K.; Maitre, J.; Bertuglia, C.; Gaboury, S. Activity Recognition in Smart Homes using UWB Radars. In Proceedings of the 11th International Conference on Ambient Systems, Networks and Technologies (ANT)/3rd International Conference on Emerging Data and Industry 4.0 (EDI), Warsaw, Poland, 6–9 April 2020. [Google Scholar]
- Cao, P.; Xia, W.; Ye, M.; Zhang, J.; Zhou, J. Radar-ID: Human identification based on radar micro-Doppler signatures using deep convolutional neural networks. IET Radar Sonar Navig. 2018, 12, 729–734. [Google Scholar] [CrossRef]
- Deng, J.; Dong, W.; Socher, R.; Li, L.J.; Li, K.; Li, F. ImageNet: A Large-Scale Hierarchical Image Database. In Proceedings of the IEEE-Computer-Society Conference on Computer Vision and Pattern Recognition Workshops, Miami Beach, FL, USA, 20–25 June 2009. [Google Scholar]
- Shah, S.A.; Fioranelli, F. Human Activity Recognition: Preliminary Results for Dataset Portability using FMCW Radar. In Proceedings of the 2019 International Radar Conference (RADAR), Toulon, France, 23–27 September 2019. [Google Scholar] [CrossRef]
- Wiseman, Y. Ancillary Ultrasonic Rangefinder for Autonomous Vehicles. Int. J. Secur. Its Appl. 2018, 12, 49–58. [Google Scholar] [CrossRef]


| Types of Sensors | Advantages | Disadvantages |
|---|---|---|
| Methods based on cameras |
|
|
| Methods based on wearable devices |
|
|
| Methods based on millimeter-wave radars |
|
|
| Types of Activities | Number |
|---|---|
| Walking | 286 |
| Sitting | 289 |
| Standing | 287 |
| Picking up things | 287 |
| Drinking | 286 |
| Falling | 198 |
| Total | 1633 |
| Methods | Accuracy/% | Precision | Recall | F1-Score | Training Time (/epoch/s) |
|---|---|---|---|---|---|
| Method 1 | 92.07 | 0.93 | 0.91 | 0.92 | 12.47 |
| Method 2 | 93.47 | 0.94 | 0.93 | 0.93 | 11.39 |
| Method 3 | 87.84 | 0.90 | 0.87 | 0.89 | 10.14 |
| Proposed Method | 96.34 | 0.96 | 0.96 | 0.96 | 10.88 |
| Methods | Accuracy/% | Precision | Recall | F1-Score | Training Time (/epoch/s) |
|---|---|---|---|---|---|
| Random Forest | 84.75 | 0.86 | 0.85 | 0.85 | 16.49 |
| SVM | 74.46 | 0.76 | 0.74 | 0.70 | 13.76 |
| KNN | 90.85 | 0.91 | 0.91 | 0.91 | 14.28 |
| Bi-LSTM | 83.53 | 0.87 | 0.84 | 0.85 | 23.17 |
| Proposed Method | 96.34 | 0.96 | 0.96 | 0.96 | 10.88 |
Publisher’s Note: MDPI stays neutral with regard to jurisdictional claims in published maps and institutional affiliations. |
© 2022 by the authors. Licensee MDPI, Basel, Switzerland. This article is an open access article distributed under the terms and conditions of the Creative Commons Attribution (CC BY) license (https://creativecommons.org/licenses/by/4.0/).
Share and Cite
Zhao, Y.; Zhou, H.; Lu, S.; Liu, Y.; An, X.; Liu, Q. Human Activity Recognition Based on Non-Contact Radar Data and Improved PCA Method. Appl. Sci. 2022, 12, 7124. https://doi.org/10.3390/app12147124
Zhao Y, Zhou H, Lu S, Liu Y, An X, Liu Q. Human Activity Recognition Based on Non-Contact Radar Data and Improved PCA Method. Applied Sciences. 2022; 12(14):7124. https://doi.org/10.3390/app12147124
Chicago/Turabian StyleZhao, Yixin, Haiyang Zhou, Sichao Lu, Yanzhong Liu, Xiang An, and Qiang Liu. 2022. "Human Activity Recognition Based on Non-Contact Radar Data and Improved PCA Method" Applied Sciences 12, no. 14: 7124. https://doi.org/10.3390/app12147124
APA StyleZhao, Y., Zhou, H., Lu, S., Liu, Y., An, X., & Liu, Q. (2022). Human Activity Recognition Based on Non-Contact Radar Data and Improved PCA Method. Applied Sciences, 12(14), 7124. https://doi.org/10.3390/app12147124