Abstract
A field-based experiment was set up to evaluate the effectiveness of a single application of marble waste sludge (MWS) on chemical immobilization of potentially hazardous trace elements (PHE) within the soil profile of a mine Technosol under natural assisted remediation for 12 years. Results showed that MWS amendment significantly reduced soil acidity and PHE mobility compared to unamended soil, thus improving soil health and plant growth. The amendment application had a sustained acid-neutralizing action, as soil pH remains relatively constant at between 5.8 and 6.4 throughout the entire profile (70 cm depth). In addition to diluting pollutants, the treatment triggered a redistribution of trace elements among the various operationally defined geochemical pools, shifting the PHE speciation from water-soluble forms to fractions associated with carbonates (29% Cd), metal oxides (40–48% Zn, Cd, Cu, and Ni), organic matter (22% Cu and Ni), and insoluble secondary oxidation minerals and residual phases (80–99% As, Cr, Sb, Tl, and Pb), thereby effectively limiting its potential environmental significance. MWS treatment to immobilize PHE in the contaminated mine Technosol was effective and persistent while in the untreated soil metal release is continuing over time.
1. Introduction
Soils contaminated with potentially hazardous trace elements (PHE) arising from mining wastes and industrial discharges pose serious threat to human health and ecosystems [1,2]. Management of these environmentally significant soils [3] may require the use of sustainable remediation strategies to mitigate the dispersion of contaminants and their associated risks. Conventional soil clean-up technologies [4,5], especially those involving surface capping and landfilling, are often financially inefficient in extensive mine lands where treatments should be affordable and self-sustaining.
In situ stabilization or chemical fixation of PHE induced by the addition of immobilizing agents, such as soil amendments made of waste materials and by-products [6,7,8], is a cost-effective and eco-friendly option to reclaim abandoned mine lands following circular economy principles and modern waste management trends. These amendments can be referred as Technosols according to the World Reference Base for Soil Resources [9], because they form a new soil layer [10].
The immobilization technique involves PHE removal from soil solution either through precipitation, adsorption, ion exchange, or complexation mechanisms [11], thus reducing to some extent contaminant uptake by plants and leaching into groundwater or nearby watercourses [12]. Since contaminant solubility is linked to its mobility and bioavailability, chemical stabilization has the potential to reduce environmental risk [13], although the immobilizing effects may not last long enough and, consequently, repeated amendment additions may be needed to sustain the stabilization process.
Liming is a widely used practice for reducing the mobility of PHE in contaminated soils with different degrees of success [14,15]. Most research on the use of lime-based waste materials and their efficiencies for PHE immobilization in soil has been conducted under laboratory conditions in short-term studies [11,12], as the liming effects were observed only after the first few years of treatment. These results from lab-scale experiments need to be validated by further field work to verify long-term stability of immobilized PHE in amended soils [16,17,18], where natural processes controlling PHE mobility can be monitored over long time scales under realistic conditions. Long-term field monitoring provides direct evidence of the ageing process of amendments [19].
Specifically, the waste sludge (i.e., micronized calcium carbonate) generated by marble processing plants has been proven as an effective nanomaterial for acid soil neutralization and for enhanced PHE retention capacity of soils affected by mining activities [20,21,22,23]. In fact, a field trial in the historic mining district of Tharsis (southwestern Spain) showed the potential of marble waste sludge (MWS) as a promising soil additive for assisting re-vegetation of legacy mine lands [24]. The most remarkable features of the MWS are alkalinity (pH = 8.8–9.2), fineness (mean particle size = 8.24 µm), and purity (~95 wt% of calcite). Using this MWS, a single amendment of 22 cmolc of lime per kilogram of soil was applied by Fernández-Caliani and Barba-Brioso [24] to raise the pH from 3.2 to a pH level suitable for plant regrowth. The acid neutralizing effect of the soil amendment effectively reduced the concentrations of Al, Fe, sulfate and PHE, notably Cd, Cu, Pb and Zn, in the most labile and phytoavailable fraction enough to allow the settlement of spontaneous plant species (Lolium perenne, Plantago coronopus and Spergularia rubra). Even though the reported early findings showed promise, substantial uncertainty exists regarding the long-term effectiveness of PHE stabilization in soil.
To address this uncertainty, a mini plot field experiment was conducted to evaluate the sustainability of a single application of MWS on chemical immobilization of PHE in the mine soil of Tharsis, after a period of 12 years post-application. The specific objectives were to ascertain: (1) the effect of acid buffering capacity of the liming waste on the soil leachate chemistry; and (2) the influence of the MWS addition on fractionation of PHE and their environmental availability over a long time span.
2. Location and Description of the Experimental Site
The experimental plot was established at the historic mine site of Tharsis, in southwestern Spain (Figure 1), a world-class massive sulfide deposit hosted primarily by black shale sequences from the latest Devonian [25]. The biggest deposit is exposed in the Filón Norte open pit (Figure 1a), with total original reserves of about 90 million tons containing average grades of 46.5% S, 0.7% Cu, 2.7% Zn plus Pb, 35 g/t Ag, and 0.9 g/t Au [26]. Besides, a wide variety of PHE (As, Cd, Hg, Sb, and Tl, among others) are usually present in the ore as trace elements.
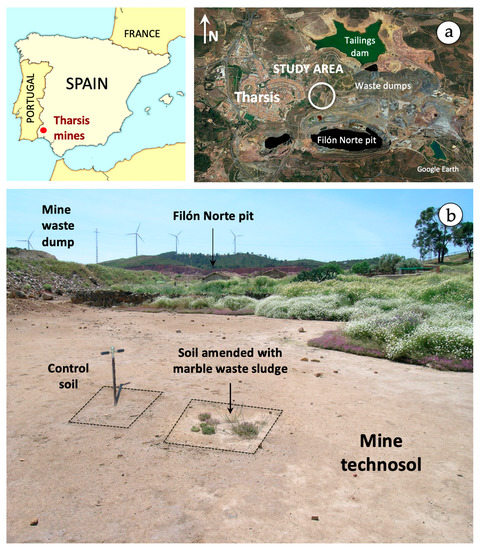
Figure 1.
Location map of the study area showing a satellite view of the mining area of Tharsis (a), and a field picture of the field experimental site (b).
Tharsis has a long history of metal extraction dating back from prehistoric (third millennium B.C.) and Roman to modern times [27]. Past mining and smelting activities have left an extensive legacy of heavily contaminated soils. The surface soil has been subjected to chemical loading for decades in the absence of legal and regulatory frameworks for mine closure and environmental remediation. In the vicinity of the mining area, the soil is adversely affected by acid mine drainage (AMD) emanating from the waste dumps, thus being unable to support plant life [22,28,29]. However, small agricultural holdings have persisted by adopting traditional farming practices that enable cultivation of food crops [30], all at risk of contamination [31]. Elevated levels of PHE in soil and vegetation can be detected up to 2–3 km downwind of the Tharsis mines [32,33].
The experimental plot (1 × 1 m) is regarded as representative of an area impacted by AMD discharges arising from the mine wastes of Filón Norte pit (Figure 1b), with an extension of about 1.5 ha. The site (UTM coordinates: X = 666,533 and Y = 4,163,175) is located 250 m above sea level and subject to a Mediterranean climate (Csa in the Köppen climate classification system) characterized by hot, dry summers and mild winters. During the experimental period (2007 to 2019), the average minimum and maximum temperatures were 5 °C and 34 °C, respectively, and the average annual rainfall was 389 mm, according to data recorded in the nearest weather station.
3. Materials and Methods
3.1. Soil Sampling
Two undisturbed soil cores were extracted by hand augering to a depth of 70 cm from the experimental mini plot amended with MWS in 2007 [24], and from an adjacent site of contaminated soil in which no amendment was applied (control soil) for comparative purposes. The cores were obtained using an Eijkelkamp auger (100 cm in length and 30 mm in diameter) after 12 years of MWS amendment application. The two soil cores were sectioned transversely into seven 10-cm thick slices that are assumed to be representative samples of incremental depths within the soil profile (0–10, 10–20, 20–30, 30–40, 40–50, 50–60, and 60–70 cm) in both treated and control areas.
3.2. Analytical Procedures
The soil samples were air-dried, gently crushed to pass through a 2–mm sieve, and mixed thoroughly. Soil texture was determined by particle-size distribution analysis using a laser diffraction analyzer (Mastersizer 2000, Malvern Panalytical, Malvern, Worcestershire, UK). Soil reaction (pH), redox potential (Eh) and electrical conductivity (EC) were determined by stirring soil in deionized water at the ratio of 1:2.5 (g mL−1). All measurements were performed in triplicate and averaged. Aliquots of the sieved material (<2 mm) were ground in an agate mortar until getting a fine powder (<63 μm) for analyses.
Major crystalline phases were identified by X-ray powder diffraction (XRPD) using a BRUKER AXS D8-Advance diffractometer (Bruker Corp., Karlsruhe, Germany), with monochromatic CuKα radiation operated at 40 kV and 30 mA. Scans of randomly oriented bulk powders were run from 3 to 70° 2θ with a step size of 0.02° and a counting time of 0.6 s per step. The XRPD raw data were processed with the software MacDiff 4.2.6 (from R. Petschick, Goethe-Universität Frankfurt, Frankfurt, Germany) to precisely determine the position, intensity, and area of the diffraction peaks. Semi-quantitative estimates of mineral abundance were made by empirical intensity factors weighting the integrated peak area values of diagnostic reflections [34], with absolute errors averaging less than 3% [35]. Samples were examined by environmental scanning electron microscopy (ESEM) on a JEOL JSM-IT500 instrument (JEOL, Tokyo, Japan) coupled with energy dispersive X-ray spectroscopy (EDS). Back-scattered electron (BSE) images and EDS spectra were acquired at 20 kV accelerating voltage to assist in the identification of accessory minerals of environmental concern.
The soil samples were subjected to multi-acid digestion (HF-HClO4-HNO3-HCl) followed by inductively coupled plasma-optical emission spectroscopy (ICP-OES) analysis to determine total concentrations of As, Cd, Cr, Cu, Ni, Pb, Sb, Tl, and Zn, all which are of environmental significance. The analyses were carried out at Activation Laboratories Ltd. (Ancaster, ON, Canada), which is compliant to the ISO/IEC 17,025 standard. Reliability of the analytical procedure was evaluated by the use of reagent blanks, certified reference materials (GRX-4, GRX-6, SDC-1, DNC-1a, OREAS-45d), and replicates to check accuracy and precision of the data. The average relative standard deviation (RSD) of the analyses was between 1.6 and 11.7%.
Chemical partitioning of PHE in the topsoil of both the amended and the control soil was determined using an improved Community Bureau of Reference (BCR) sequential extraction method [36]. This protocol fractionates PHE into three operationally defined pools: (F1) exchangeable and weak acid soluble fraction (extraction with 20 mL 0.11 mol L−1 acetic acid, CH3COOH); (F2) reducible fraction (extraction with 20 mL 0.5 mol L−1 hydroxylammonium chloride, NH2OH·HCl); (F3) oxidizable fraction (digestion with 5 mL 8.8 mol L−1 hydrogen peroxide, H2O2, and extraction with 25 mL 1 mol L−1 ammonium acetate, CH3COONH4); and (F4) residual fraction (open vessel, hot plate acid digestion with 10 mL HF, 3.8 mL HNO3, 5 mL HClO4, and 1.2 mL HCl). Following each extraction step, the extract was centrifuged at 5000 rpm for 10 min, then the supernatant was filtered through a 0.45-μm membrane filter, and stored at 4° C until analysis. The PHE concentrations in the filtered soil extract were chemically analyzed by ICP-MS using an Agilent 7900 ICP-MS instrument (Agilent Technologies, Santa Clara, CA, USA), with detection and quantification limits of 0.01 μg L−1 and 0.03 μg L−1, respectively, for all the determinations.
The sequential extraction procedure was repeated at least twice to ensure repeatability of results. The validity of the method was verified by carrying out analysis of a reference material (BCR-701) certified for extractable metal contents in the three steps of the modified BCR scheme [37]. The results showed a close agreement between observed and expected values for most PHE. The mean recovery was 102.6% with a standard deviation of 10.2% for PHE extracted in step 1, 102.2 ± 5.0% for those extracted in step 2, and 92.8 ± 16.0% for those extracted in step 3. Moreover, the cumulative amount of PHE released from the three steps (F1 + F2 + F3) plus residual fraction (F4) compared well with the total PHE concentrations determined in soil samples, indicating acceptable levels of accuracy.
Easily leachable and potentially leachable fractions of PHE were assessed by single-reagent extraction tests with deionized water and with ethylene diamine tetraacetic acid (EDTA), respectively. Aliquots of each soil sample (<2 mm) were placed in 50-mL polypropylene centrifuge tubes and shaken for 2 h, with deionized water and with 0.05 mol L−1 EDTA (adjusted to pH 7.0) at a soil:solution ratio of 1:10 (w/v) [38,39]. Afterwards, the suspensions were centrifuged for 10 min at 5000 rpm, and then filtered through a 0.45-μm membrane filter. The PHE concentrations were measured in the filtrates by ICP-MS (Agilent 7900 ICP-MS instrument). Blank analyses were carried out to correct for contamination. The extraction procedure was repeated twice to assess reproducibility. Precision values were generally better than 10% RSD.
3.3. Analytical Analysis
The data obtained were statistically processed using the Statistica 10.0 (Stat Soft Inc., Tulsa, OK, USA) and MS Excel 2016 (Microsoft Co., USA) software packages. For statistical and graphical purposes, all values below detection limits (non-detects) were replaced with half of the detection limit [40]. Statistical differences between measured variables in treated and control samples were evaluated using Student’s t-test and analysis of variance (one-way ANOVA). Prior to analysis, the homogeneity of variance was assessed by Levene’s test. In this study, an α-value of 0.05 was used as critical level of significance for all statistical testing.
4. Results and Discussion
4.1. Mineral Composition and Soil Reaction
The soil affected by AMD discharges from the sulfide mine wastes is silt loam in texture (~68% silt, 25% sand and 7% clay), and mineralogically composed of quartz, clay minerals (illite and kaolinite) and jarosite, with minor feldspars, gypsum and hematite, as determined by XRPD analysis of control samples (Figure 2).
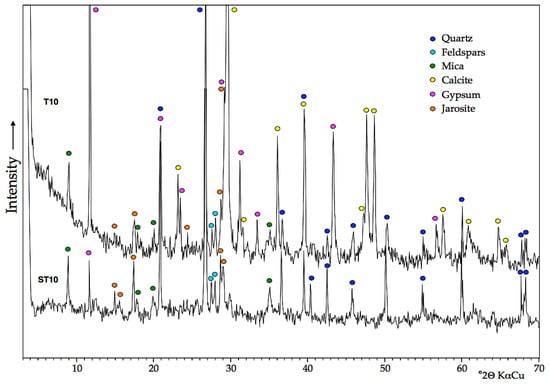
Figure 2.
XRPD diffractograms of topsoil samples of amended soil (T10) and control soil (ST10).
In addition, a suite of accessory minerals was identified by ESEM-EDS, including barite, monazite, zircon, rutile, plumbogummite, cuprospinel and poorly crystallized iron oxides. Consistently, the contaminated mine soil has a poor buffering capacity to neutralize acid that is being produced, or has been produced, by AMD because it is completely free of carbonates and depleted in other acid-neutralizing minerals. Jarosite typically occurs as clusters of euhedral crystals of less than 1 μm in size, coexisting with iron oxides nanoparticles and soil clays, as observed by ESEM at high magnification (Figure 3a,b). The EDS spectra of some isolated crystals of a jarosite-group mineral that appear brighter in the ESEM-BSE images revealed a remarkable amount of Pb, by virtue of which they can be ascribed to plumbojarosite (Figure 3c).
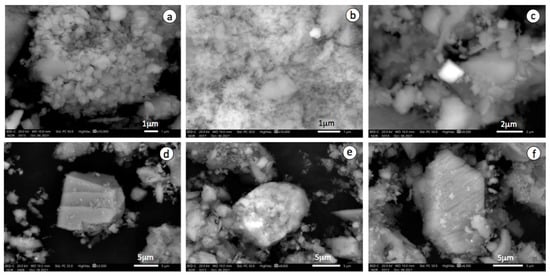
Figure 3.
ESEM-BSE images showing salient mineralogical and textural features of the amended soil after 12 years of amendment application: (a) aggregate of jarosite with pseudocubic habit of euhedral crystals; (b) iron oxide nanoparticle aggregate; (c) isolated pseudocubic crystal of plumbojarosite; (d) calcite grain with dissolution grooves on its surface; (e) iron oxide coating calcite grain; and (f) newly-formed crystal of gypsum.
Twelve years after amendment with MWS, the soil showed a silt loam texture with high contents of fine-grained calcite in the topsoil layer (0–20 cm) and lower proportions of the other constituents relative to control soil, with the exception of gypsum. It is interesting to note that most calcite crystals remain unaltered, maintaining their original rhombohedral morphology despite the long time since marble slurry application. Nevertheless, some of them showed signs of partial dissolution on their surface (Figure 3d), and some others appear to be coated by iron oxyhydroxides (Figure 3e). Direct precipitation of gypsum (Figure 3f) was induced by partial dissolution of the carbonates added to the soil, thus providing the Ca2+ ions necessary to combine with the sulfate ions. The neutralization reaction can explain not only the increase in gypsum concentration observed in the amended soil layer but also the occurrence of metal oxide coatings, as the Fe3+ solubility is controlled by the precipitation of ferric iron oxyhydroxides [2].
Soil reaction measured on control samples was ultra-acid, with pH values ranging from 3.1 to 3.5 (Table 1), whereas in the amended plot the soil samples had pH values in the range of 5.8–6.4, with an average of 6.2. Therefore, the soil solution appears to be neutralized to slightly acidic reaction throughout the entire sampled profile (0–70 cm) in the response to MWS amendment. Moreover, the long-term measurement of soil redox potential changed noticeably from strongly oxidizing conditions (Eh = 535–647 mV) to moderately oxidizing conditions (Eh = 343–525 mV) after treatment. The mean values of soil electrical conductivity were 2.62 mS cm−1 in the amended soil and 3.04 mS cm−1 in the unamended soil, indicating a low soluble salt content in both soil solutions.

Table 1.
Electrochemical properties and semiquantitative mineral composition of the samples.
As compared to soil electrochemical properties after one year of treatment, the soil pH declined but not to detrimental levels, from 6.8 to 6.3, and the electrical conductivity remained practically constant at 3.3–3.5 mS cm−1 twelve years after amendment application. Given the long lapse of time since the treatment, the soil system seems to be well buffered by carbonate equilibria, and thereby further potential acid production could be consumed with little or no decrease in pH through acid-neutralization reactions [41].
4.2. Total Trace Element Concentrations
Results of the total concentrations of PHE analyzed in the amended and control (no amendment) soil samples are listed together in Table 2, and displayed in Figure 4 to graphically show the variation of concentration with depth.
Table 2.
Total trace element concentrations (in mg kg−1) analyzed by ICP-OES.
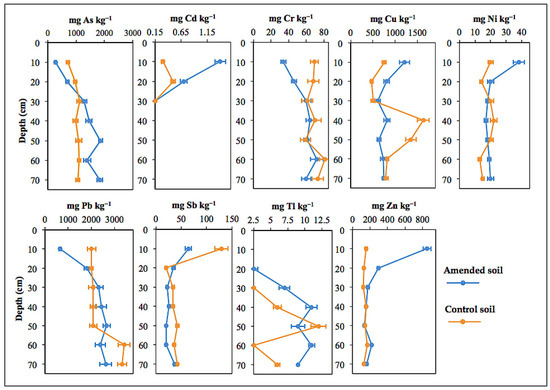
Figure 4.
Vertical distribution of trace elements along the two sampling sections (amended and control) of the soil profile.
Total concentrations of As, Cr, and Pb increased significantly (p < 0.01) with depth in the amended soil up to a maximum of 1860 mg kg−1 As at 40–50 cm depth, 72 mg kg−1 Cr (50–60 cm), and 2660 mg kg−1 Pb (40–50 cm). Compared to the control, the concentrations of As, Pb, and Cr in the amended soil were noticeably low at the upper sampling layers (up to 20 cm depth), and then increased with depth to levels comparable to even higher than baseline concentration. Such vertical distribution pattern may be related to a dilution effect caused by the incorporation of MWS to the plough layer. It is nevertheless noteworthy that As showed a contrasted soil profile distribution, with increasing downward concentrations suggesting leaching from the upper horizons and subsequent re-deposition.
The levels of Cu, Cd, Ni, and Zn in the surface horizon were significantly (p < 0.01) higher than in the lower sampling depths. Notwithstanding the diluting effect due to MWS addition, the amounts of Cu (1210 mg kg−1), Cd (1.4 mg kg−1), Ni (38 mg kg−1), and Zn (851 mg kg−1) found in the topsoil (0–10 cm) of the amended mini plot were higher by a factor of 5.4 for Zn, 4.7 for Cd, 1.9 for Ni, and 1.6 for Cu relative to control soil (Figure 5). This increased upward trend is clearly indicative of metal enrichment in the amended surface layer. It was further found that the vertical distribution of such PHE in the two sampling sections (i.e., MWS-amended and control) was rather similar, with the concentration factor values ranging from 0.5 to 1.5, except for Cu that seemed to be more depleted in the 30–50 cm depth layer.
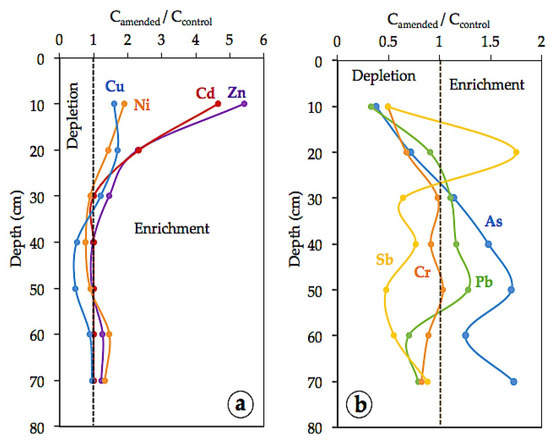
Figure 5.
Soil profile distribution of the concentration factor (calculated by dividing the total content of each trace element in the amended soil by that in the unamended soil) for: (a) Cd, Cu, Ni, and Zn; and (b) As, Cr, Sb, and Pb.
A similar distribution pattern was observed when comparing the ratio between the concentrations of PHE in the amended topsoil 12 years after treatment and those previously reported for the surface soil before treatment [24]. Zinc, Cd, Ni, and to a lesser extent, Cu were found enriched in the amended surface layer (Figure 6), clearly indicating retention by the soil, while As, Cr, and Pb were relatively depleted by the dilution effect of the soil amendment.
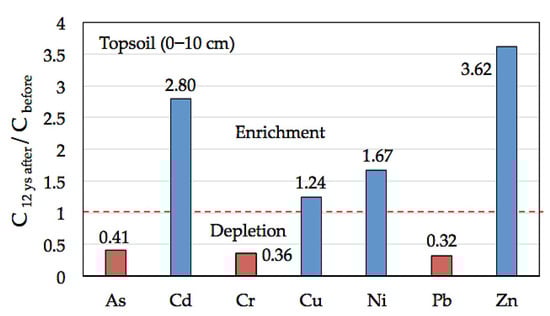
Figure 6.
Quotient between total concentration (C) of trace elements in the amended surface soil 12 years after amendment application (this study) and before treatment [24].
4.3. Chemical Partitioning
Trace elements were unevenly distributed among the four operationally defined soil fractions, as determined by sequential chemical extraction (Table 3), which has been proven to be a useful procedure for assessing the long-term mobility of PHE [37].
Table 3.
Total trace element concentrations (in mg kg−1) analyzed by ICP-OES.
Fraction F1 represents the labile fraction of PHE that would be released into the environment when soil conditions become acidic, including water-soluble, exchangeable (non-specifically sorbed), and weak acid soluble (bound to carbonates) pools. Trace element concentrations in the fraction F1 of the amended soil appeared insignificant (generally less than 1 mg kg−1), except for Cu and Zn which reached 23.2 mg kg−1 and 116 mg kg−1, respectively. Despite the low level of Cd (0.54 mg kg−1) measured in this readily available fraction, it accounted for a relatively high extractability (28.9%).
Fraction F2 includes PHE bound to Fe and Mn oxyhydroxides, which would be easily released into the solution as a result of reductive dissolution. Copper (554 mg kg−1) and Zn (436 mg kg−1) were again the most extractable PHE in the reducible fraction of the amended soil, with an extraction yield of 44.1% and 47.7%, respectively. In addition, Cd and Ni were solubilized in the second step of the sequential extraction (F2) to a considerable extent in terms of percent extraction, accounting for 47.1% and 39.9% of their respective total concentration in the surface soil.
The results showed once again that Cu (282 mg kg−1) and Zn (158 mg kg−1) were the PHE removed at highest grade from the oxidizable fraction (F3) of the amended soil, which theoretically involves PHE bound to sulfides and/or organic matter. These released concentrations represent 22.4% and 17.3% of their respective total contents in soil and they scored the highest proportion of extractable PHE together with the extraction yield of Ni (21.7%).
The amounts of PHE solubilized in the amended soil samples after multi-acid digestion ranged widely depending on the element studied, with Pb (639 mg kg−1), Cu (398 mg kg−1), As (263 mg kg−1), and Zn (203 mg kg−1) being the most abundant contaminants in the extracts. This residual fraction (F4) was the dominant pool for Pb (99.8%), As (96.0%), Sb (93.4%), and Tl (86.2%). It must be emphasized that this residual fraction comprises not only the PHE tightly bound to the crystal structure of silicates but also those associated with secondary sulfates, such as jarosite-group minerals, which have not been effectively solubilized during the first three steps of the BCR sequential extraction procedure. It is generally agreed that jarosite-group minerals can scavenge Pb, As, Sb, and Tl in AMD-impacted areas through structural incorporation and/or adsorption mechanisms [2,42,43].
The lability of PHE in the amended soil, expressed as the ratio between the most labile fraction (F1) and the sum of all other fractions (F2 + F3 + F4), decreased in the following order (values shown in brackets): Cd (0.41) > Zn (0.15) > Ni (0.07) > Cu, Sb (0.02) > As, Cr, Pb, Tl (<0.01). Accordingly, Cd is the most labile PHE in soil under the current conditions of the amended mini plot whereas mobility of the other PHE remains very low unless specific environmental conditions are induced in the soil system. Interestingly, the most labile PHE (Cd, Zn, Ni, and Cu) are those that have been concentrated in a greater proportion in the soil surface as a result of the MWS amendment.
By comparing the fractionation pattern of PHE in topsoil, there are significant statistical differences between treated and untreated soil (Figure 7). The fraction of Cu, Zn, and Ni soluble in acetic acid (F1) was significantly lower in the amended soil than in the control soil (p < 0.01). In contrast, the extractability of Cd, Sb, and Tl was significantly higher in the amended soil (p < 0.01). The increased association of Cd with fraction F1 after soil amendment may suggest immobilization through carbonate precipitation by increased soil pH rather than sorption by cation exchange. It seems possible that adsorption could have been inhibited or limited due to the competition with Ca2+ ions for binding sites [41].
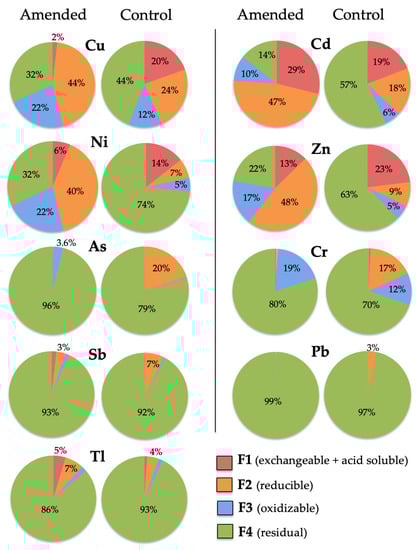
Figure 7.
Geochemical partitioning of trace elements in amended soil (sample T10) and control soil (sample ST10). Extraction yields are expressed as percentage of extracted trace elements in operationally defined soil chemical fractions: (F1) water soluble, exchangeable and weak acid soluble; (F2) reducible; (F3) oxidizable; and (F4) residual.
The proportions of As, Cr, Pb, and Sb linked to reducible soil components (F2) of the amended plot were found to be significantly low relative to the control soil (p < 0.01), while those of Cu, Zn, Ni, and Cd showed a significant increase (p < 0.01). These findings indicate that iron oxyhydroxides were potentially responsible for retention of considerable levels of contaminants in soil after amendment, either by adsorption or coprecipitation processes [11].
In general, the percentages of PHE extracted from the treated soil sample under oxidizing conditions (F3) were significantly higher (p < 0.01) than those of the control sample, with the exception of Pb and Tl. The increase was particularly noteworthy for Cu and Ni, suggesting that a considerable proportion of them (up to 22%) seem to be bound to naturally occurring organic substances derived from plants growing on the amended soil.
In brief, most Pb, As, Sb, Tl, and Cr were found accumulated in the residual fraction (F4) of both treated and untreated soil; the fractionation patterns of Cu and Ni were fairly similar as they appear more or less evenly distributed among F2, F3, and F4 fractions; and Cd and Zn seemed preferentially partitioned among the most labile compartments (F1 and F2).
4.4. Environmental Availability
For most soil samples from the plot treated with MWS, the concentrations of PHE released after reaction with deionized water were generally less than 1 µg kg−1 with a few exceptions (Table 4), resulting in trivial fractions of less than 0.10%, calculated as the percentage of the total PHE concentration that was removed by the water extraction. In environmental terms, the fraction of PHE that may be available for plant uptake and easily leachable from the soil was assessed to be negligible. Zinc, Ni, and Cu were the PHE that showed the highest water-extractable concentrations, with their maximum values being measured in the leachates of the samples T50 (154 µg kg−1), T40 (41.38 µg kg−1), and T10 (31.4 µg kg−1), respectively.
Table 4.
Trace element concentrations (µg kg−1) extracted with deionized water from amended soil and control soil samples.
Remarkable differences were observed when comparing the PHE concentrations extracted with water from both groups of soil samples under study. The contents of Cu, Zn, Ni, Cd, Cr, and Pb in the extracts from the upper sampling layers (up to 20 cm depth) of the amended plot were significantly lower than those from the control soil sample (p < 0.01). No meaningful changes were detected in the concentrations of As and Sb released from the surface soil, although they were higher in the 10–20 cm depth interval of the amended soil compared to control. A significant decrease (p < 0.01) was also observed in the water-extractable amounts of all PHE at the amended soil depth of 20–50 cm, with the exception of Pb (at 20–30 cm depth) and Sb (at 40–50 cm depth). At deeper depths (50–70 cm), the water-extracted concentrations of PHE in the amended soil remained consistently lower than those of the control.
The amounts of PHE extracted with EDTA varied noticeably depending on the element concerned and the sampling depth, in both the amended and the non-amended soil (Table 5). The use of EDTA as extracting reagent led to much higher (p < 0.01) extraction yields than those determined with deionized water (Figure 8), as expected given its strong complexing capacity [44]. The EDTA extraction method is capable of extracting PHE from all non-silicate bound phases, likely reflecting the metal availability in the long term [45].
Table 5.
Trace element concentrations (µg kg−1) extracted with 0.05 mol L−1 EDTA from amended soil and control soil samples.
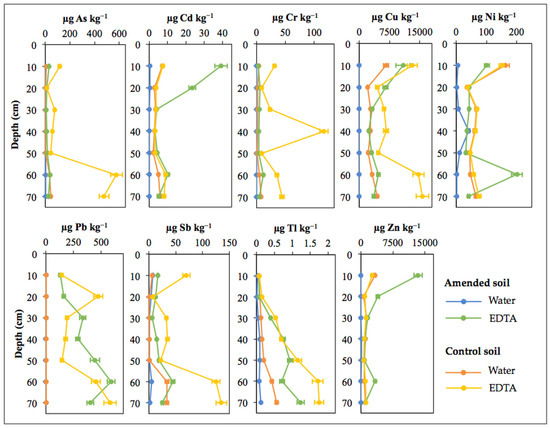
Figure 8.
Vertical distribution of trace element concentrations extracted by deionized water and EDTA from the two sampling sections (amended and control) of the soil profile.
Certainly, Zn and Cu were the most abundant PHE in the topsoil extracts of the amended plot, where the EDTA-extracted concentrations reached up to 13,419 µg kg−1 and 10,877 µg kg−1, respectively. Despite the high levels of Zn and Cu measured in the extracts, the mobilizable fraction of Zn was 1.58%, and that for Cu accounted for only 0.90%. The maximum contents of Pb (402–589 µg kg−1) were extracted from the subsoil samples (50–70 cm depth), while the remaining PHE were at lower concentration in the extracts (mostly below 50 µg kg−1) over the entire soil profile.
The amended upper surface layer (0–10 cm depth) had a significant increase (p < 0.01) in the levels of Zn and Cd in comparison with the control soil. It was also found that the soil cores were significantly enriched (p < 0.01) in the EDTA-extracted concentrations of Zn over the entire profile of the amended plot, as well as in those of Cd, Cu, and Sb at the depth of 10–20 cm, and Pb at 20–60 cm depth. Conversely, As, Cr, Cu, Ni, Sb, and Tl were generally most abundant in the EDTA extracts from the control soil samples. Furthermore, the comparison also revealed a generalized significant decrease (p < 0.01) in the PHE levels extracted with EDTA from the deeper sample (60–70 cm depth) of the amended soil.
To give a clearer picture of the effects of soil amendment on environmental availability of PHE with time, Figure 9 shows a bar chart comparing water-soluble and EDTA-extracted concentrations of PHE in the surface layer (0–10 cm depth) of the untreated soil, one year after and twelve years after amendment application. The extractable levels of PHE did differ statistically between the three groups of samples (one-way ANOVA, p < 0.01).
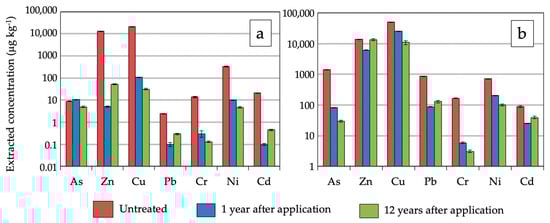
Figure 9.
Bar chart comparing trace element availability before and after marble slurry waste application, at years one and twelve after soil amendment. (a) Water-extracted concentration; (b) EDTA-extracted concentration.
Before soil amendment, substantial amounts of PHE were released from the mine soil, as indicated in previous work [24]. The leachability risk was particularly high for Zn and Cu. Given that metal sorption and many metal precipitation processes increase with pH [11,46], amelioration of soil acidity by use of MWS amendment was the major factor driving the immobilization of contaminants, by reducing the activity of H+ ions in soil solution and increasing negatively charged sites on soil particles. This in turn boosted the adsorption capacity of amended soil as the water-soluble levels of PHE and their uptake by plants dropped following MWS addition, except for As. Increased As mobility observed in the treated soil one year after amendment may also be linked to the increase in the negatively-charged surfaces of soil particles after acid neutralization [47], thus preventing the adsorption of water-soluble As oxyanion species.
When comparing soil treated with MWS at years one and twelve after amendment application, a salient decrease in the water-soluble concentrations (Figure 9a) of As, Cu, and Ni was observed with treatment time (p < 0.01), while the opposite trend was apparent for Zn, Pb, and Cd (p < 0.01). A plausible mechanism for reduced As leaching could be formation of low-solubility calcium arsenates [48,49,50], due to reaction of dissolved calcium with arsenic, as reported in other acid mine soils reclaimed with sugar beet lime and composted biosolids [41]. Decreased Cu and Ni availability can be ascribed to adsorption onto organic matter or formation of stable complexes with organic ligands [51]. On the contrary, the release of Zn, Pb, and Cd from the amended soil increased after 12 years. The competition with Ca2+ ions for sorption sites could have displaced such PHE from the soil binding sites increasing their labile fractions, although they were limited in comparison with those determined in the unamended soil.
The extractable amounts of PHE by EDTA (Figure 9b) showed a similar pattern of results for the same time period excepting that of Cu, which increased from 12 to 22% with treatment. This could be explained by the fact that EDTA is a chelating agent that has the ability to release the fraction of Cu associated through complexation with various forms of organic material [52].
5. Conclusions
A mini plot field study was conducted to test the long-term effects of amending a heavily contaminated mine Technosol with a single application of MWS, with emphasis on soil reaction, chemical partitioning, and PHE retention. Soil acidity (pH = 3.1–3.5) and release of PHE were effectively reduced by amendment after its incorporation and these improvements were still observed after 12 years of its application. The addition of MWS provided a high pH-buffering capacity (pH = 5.8–6.4) to soil, making it less susceptible to eventual re-acidification over time, and therefore to PHE mobilization. Soil acidity neutralization affected the status and occurrence mode of PHE, rendering them less potentially phytotoxic and available for plant absorption, as indicated by the presence of plant species spontaneously growing in the amended site. Decreased mobility of Cu, Zn, Ni, and Cd most likely occurred by retention in reducible phases, mainly poorly crystallized Fe oxides, while Pb, As, Sb, Tl, and Cr were mostly found accumulated in the residual fraction, linked to insoluble secondary oxidation minerals and undissolved phases.
Consistently, application of MWS amendment is a promising option for assisting sustainable natural remediation of degraded mining landscapes with long-term efficacy on PHE immobilization, as well as an attractive way of industrial waste recycling. However, it is important to note that, in the event of re-acidification, a considerable proportion of Zn and Cd retained in topsoil as exchangeable and weak acid soluble forms could be released by ion exchange and dissolution reactions. It has also been shown that the competitive effect of Ca2+ ions for sorption sites could displace PHE from soil binding sites into soil solution enhancing the mobility of weakly adsorbed metallic cations. Therefore, further monitoring would be required to assess the chemical stability of PHE over a longer time span, the ageing process of the amendment, and the potential risk of transfer from soil to growing plants.
Author Contributions
Conceptualization, J.C.F.-C.; methodology, J.C.F.-C. and I.G.; validation, J.C.F.-C. and I.G.; formal analysis, I.G. and E.M.; investigation, I.G., S.F.-L., C.B.-B. and E.M.; data curation, S.F.-L. and C.B.-B.; writing—review and editing, J.C.F.-C.; visualization, I.G., S.F.-L., and C.B.-B.; supervision, J.C.F.-C.; project administration and funding acquisition, J.C.F.-C. All authors have read and agreed to the published version of the manuscript.
Funding
This research was partially supported by the Regional Government of Andalusia (Spain) and the European Regional Development Fund Andalusia 2014–2020, through the Project P-18-TP-3503.
Institutional Review Board Statement
Not applicable.
Informed Consent Statement
Not applicable.
Data Availability Statement
Not applicable.
Conflicts of Interest
The authors declare no conflict of interest.
References
- Plumlee, G.S.; Morman, S.A. Mine wastes and human health. Elements 2011, 7, 399–404. [Google Scholar] [CrossRef]
- Grantcharova, M.M.; Fernández-Caliani, J.C. Soil acidification, mineral neoformation and heavy metal contamination driven by weathering of sulphide wastes in a Ramsar wetland. Appl. Sci. 2022, 12, 249. [Google Scholar] [CrossRef]
- Niu, A.; Lin, C. Managing soils of environmental significance: A critical review. J. Hazard. Mater. 2021, 417, 125990. [Google Scholar] [CrossRef] [PubMed]
- Song, B.; Zeng, G.; Gong, J.; Liang, J.; Xu, P.; Liu, Z.; Zhang, Y.; Zhang, C.; Cheng, M.; Liu, Y.; et al. Evaluation methods for assessing effectiveness of in situ remediation of soil and sediment contaminated with organic pollutants and heavy metals. Environ. Int. 2017, 105, 43–55. [Google Scholar] [CrossRef]
- Liu, L.; Li, W.; Song, W.; Guo, M. Remediation techniques for heavy metal-contaminated soils: Principles and applicability. Sci. Total Environ. 2018, 633, 206–219. [Google Scholar] [CrossRef]
- Séré, G.; Schwartz, C.; Ouvrard, S.; Sauvage, C.; Renat, J.C.; Morel, J.L. Soil construction: A step for ecological reclamation of derelict lands. J. Soils Sediments 2008, 8, 130–136. [Google Scholar] [CrossRef]
- Kumpiene, J. Trace element immobilization in soil using amendments. In Trace Elements in Soils; Hooda, P.S., Ed.; Wiley: Chichester, UK, 2010; pp. 353–379. [Google Scholar]
- Firpo, B.A.; Weiler, J.; Schneider, I.A.H. Technosol made from coal waste as a strategy to plant growth and environmental control. Energy Geosci. 2021, 2, 160–166. [Google Scholar] [CrossRef]
- IUSS Working Group WRB. World Reference Base for Soil Resources 2014, Update 2015; International Soil Classification System for Naming Soils and Creating Legends for Soil Maps; World Soil Resources Reports 106; FAO: Rome, Italy, 2015. [Google Scholar]
- Asensio, V.; Vega, F.A.; Andrade, M.L.; Covelo, E.F. Technosols made of wastes to improve physico-chemical characteristics of a copper mine soil. Pedosphere 2013, 23, 1–9. [Google Scholar] [CrossRef]
- Kumpiene, J.; Lagerkvist, A.; Maurice, C. Stabilization of As, Cr, Cu, Pb and Zn in soil using amendments—A review. Waste Manag. 2008, 28, 215–225. [Google Scholar] [CrossRef]
- Bolan, N.S.; Kunhikrishnan, A.; Thangarajan, R.; Kumpiene, J.; Park, J.; Makino, T.; Kirkhamg, M.B.; Schecke, K. Remediation of heavy metal(loid)s contaminated soils—To mobilize or to immobilize? J. Hazard. Mater. 2014, 266, 141–166. [Google Scholar] [CrossRef]
- Basta, N.T.; Gradwohl, R.; Snethen, K.L.; Schroder, J.L. Chemical immobilization of lead, zinc, and cadmium in smelter-contaminated soils using biosolids and rock phosphate. J. Environ. Qual. 2001, 30, 1222–1230. [Google Scholar] [CrossRef] [PubMed]
- Bolan, N.S.; Adriano, D.C.; Curtin, D. Soil acidification and liming interactions with nutrient and heavy metal transformation and bioavailability. Adv. Agron. 2003, 78, 5–272. [Google Scholar]
- Holland, J.; Bennett, A.; Newton, A.; White, P.; McKenzie, B.; George, T.; Pakeman, R.; Bailey, J.; Fornara, D.; Hayes, R. Liming impacts on soils, crops and biodiversity in the UK: A review. Sci. Total Environ. 2018, 610, 316–332. [Google Scholar] [CrossRef] [PubMed]
- Madejón, P.; Pérez de Mora, A.; Burgos, P.; Cabrera, F.; Lepp, N.W.; Madejón, E. Do amended, polluted soils require re-treatment for sustainable risk reduction?—Evidence from field experiments. Geoderma 2010, 159, 174–181. [Google Scholar] [CrossRef]
- Palansooriya, K.N.; Shaheen, S.M.; Chen, S.S.; Tsang, D.C.W.; Hashimoto, Y.; Hou, D.; Bolan, N.S.; Rinklebe, J. Soil amendments for immobilization of potentially toxic elements in contaminated soils: A critical review. Environ. Int. 2020, 134, 105046. [Google Scholar] [CrossRef]
- Kumpiene, J.; Carabante, I.; Kasiuliene, A.; Austruy, A.; Mench, M. Long-term stability of arsenic in iron amended contaminated soil. Environ. Pollut. 2021, 269, 116017. [Google Scholar] [CrossRef]
- Wang, L.; Huang, J.; Li, G.; Luo, J.; Bolan, N.S.; Hou, D. Long-term immobilization of soil metalloids under simulated aging: Experimental and modeling approach. Sci. Total Environ. 2022, 806, 150501. [Google Scholar] [CrossRef]
- Pérez-Sirvent, C.; García-Lorenzo, M.L.; Martínez-Sanchez, M.J.; Navarro, M.C.; Marimón, J.; Bech, J. Metal-contaminated soil remediation by using sludges of the marble industry: Toxicological evaluation. Environ. Int. 2007, 33, 502–504. [Google Scholar] [CrossRef]
- Zornoza, R.; Faz, A.; Carmona, D.M.; Kabas, S.; Martínez-Martínez, S.; Acosta, J.A. Plant cover and soil biochemical properties in a mine tailing pond five years after application of marble wastes and organic amendments. Pedosphere 2012, 22, 22–32. [Google Scholar] [CrossRef]
- Tozsin, G.; Arol, A.I.; Oztas, T.; Kalkan, E. Using marble wastes as a soil amendment for acidic soil neutralization. J. Environ. Manag. 2014, 133, 374–377. [Google Scholar] [CrossRef]
- Tozsin, G.; Oztas, T.; Arol, A.I.; Kalkan, E. Changes in the chemical composition of an acidic soil treated with marble quarry and marble cutting wastes. Chemosphere 2015, 138, 664–667. [Google Scholar] [CrossRef] [PubMed]
- Fernández-Caliani, J.C.; Barba-Brioso, C. Metal immobilization in hazardous contaminated minesoils after marble slurry waste application. A field assessment at the Tharsis mining district (Spain). J. Hazard. Mater. 2010, 181, 817–826. [Google Scholar] [CrossRef] [PubMed]
- González, F.; Moreno, C.; Sáez, R.; Clayton, J. Ore genesis age of the Tharsis Mining District (Iberian Pyrite Belt): A palynological approach. J. Geol. Soc. Lond. 2002, 159, 229–232. [Google Scholar] [CrossRef]
- Tornos, F.; González-Clavijo, E.; Spiro, B.F. The Filón Norte orebody (Tharsis, Iberian Pyrite Belt): A proximal low-temperature shale-hosted massive sulphide in a thin-skinned tectonic belt. Miner. Deposita 1998, 33, 150–169. [Google Scholar] [CrossRef]
- O’Brien, W. Prehistoric Copper Mining in Europe: 5500-500 BC; Oxford University Press: Oxford, UK, 2015. [Google Scholar]
- Fernández-Caliani, J.C.; Barba-Brioso, C.; De la Rosa, J. Mobility and speciation of rare earth elements in acid minesoils and geochemical implications for river waters in the southwestern Iberian margin. Geoderma 2009, 149, 393–401. [Google Scholar] [CrossRef]
- Fernández-Caliani, J.C.; Barba-Brioso, C.; González, I.; Galán, E. Heavy metal pollution in soils around the abandoned mine sites of the Iberian Pyrite Belt (Southwest Spain). Water Air Soil Pollut. 2009, 200, 211–226. [Google Scholar] [CrossRef]
- Madejón, P.; Barba-Brioso, C.; Lepp, N.W.; Fernández-Caliani, J.C. Traditional agricultural practices enable sustainable remediation of highly polluted soils in Southern Spain for cultivation of food crops. J. Environ. Manag. 2011, 92, 1828–1836. [Google Scholar] [CrossRef]
- Fernández-Caliani, J.C.; Giráldez, M.I.; Barba-Brioso, C. Oral bioaccessibility and human health risk assessment of trace elements in agricultural soils impacted by acid mine drainage. Chemosphere 2019, 237, 124441. [Google Scholar] [CrossRef]
- Chopin, E.I.B.; Alloway, B.J. Trace element partitioning and soil particle characterization around mining and smelting areas at Tharsis, Riotinto and Huelva, SW Spain. Sci. Total Environ. 2007, 373, 488–500. [Google Scholar] [CrossRef]
- Chopin, E.I.B.; Alloway, B.J. Distribution and mobility of trace elements in soils and vegetation around the mining and smelting areas of Tharsis, Riotinto and Huelva, Iberian Pyrite Belt, SW Spain. Water Air Soil Pollut. 2007, 182, 245–261. [Google Scholar] [CrossRef]
- Kahle, M.; Kleber, M.; Jahn, R. Review of XRD-based quantitative analyses of clay minerals in soils. The suitability of mineral intensity factors. Geoderma 2002, 109, 191–205. [Google Scholar] [CrossRef]
- Underwood, M.B.; Lawler, N.; McNamara, K. Data report: Standard mineral mixtures, normalization factors, and determination of error for quantitative X-ray diffraction analyses of bulk powders and clay-sized mineral assemblages. Hikurangi Subduction Margin Coring, Logging, and Observatories. In Proceedings of the International Ocean Discovery Program, 372B/375, Timaru, New Zealand, 8 March–5 May 2020. [Google Scholar]
- Rauret, G.; López-Sánchez, J.F.; Sahuquillo, A.; Rubio, R.; Davidson, C.M.; Ure, A.M.; Quevauviller, P. Improvement of the BCR three step sequential extraction procedure prior to certification of new sediment and soil reference materials. J. Environ. Monit. 1999, 1, 57–61. [Google Scholar] [CrossRef] [PubMed]
- Pueyo, M.; Sastre, J.; Hernández, M.; Vidal, E.; López-Sánchez, J.F.; Rauret, G. Prediction of trace element mobility in contaminated soils by sequential extraction. J. Environ. Qual. 2003, 32, 2054–2066. [Google Scholar] [CrossRef] [PubMed]
- Sahuquillo, A.; Rigol, A.; Rauret, G. Overview of the use of leaching/extraction tests for risk assessment of trace metals in contaminated soils and sediments. Trends Anal. Chem. 2003, 22, 152–159. [Google Scholar] [CrossRef]
- Rivera, M.B.; Giráldez, M.I.; Fernández-Caliani, J.C. Assessing the environmental availability of heavy metals in geogenically contaminated soils of the Sierra de Aracena Natural Park (SW Spain). Is there a health risk? Sci. Total Environ. 2016, 560–561, 254–265. [Google Scholar] [CrossRef]
- Singh, A.; Nocerino, J. Robust estimation of mean and variance using environmental data sets with below detection limit observations. Chemom. Intell. Lab. Syst. 2002, 60, 69–86. [Google Scholar] [CrossRef]
- Fernández-Caliani, J.C.; Giráldez, M.I.; Waken, W.H.; Del Río, Z.M.; Córdoba, F. Soil quality changes in an Iberian pyrite mine site 15 years after land reclamation. Catena 2021, 206, 105538. [Google Scholar] [CrossRef]
- Aguilar-Carrillo, J.; Herrera-García, L.; Reyes-Domínguez, I.A.; Gutiérrez, E.J. Thallium(I) sequestration by jarosite and birnessite: Structural incorporation vs. surface adsorption. Environ. Pollut. 2019, 257, 113492. [Google Scholar] [CrossRef]
- Asta, M.P.; Cama, J.; Martínez, M.; Giménez, J. Arsenic removal by goethite and jarosite in acidic conditions and its environmental implications. J. Hazard. Mater. 2009, 171, 965–972. [Google Scholar] [CrossRef]
- Sun, B.; Zhao, F.J.; Lombi, E.; McGrath, S.P. Leaching of heavy metals from contaminated soils using EDTA. Environ. Pollut. 2001, 113, 111–120. [Google Scholar] [CrossRef]
- Ure, A.M. Single extraction schemes for soil analysis and related applications. Sci. Total Environ. 1996, 178, 3–10. [Google Scholar] [CrossRef]
- Basta, N.T.; Rayan, J.A.; Chaney, R.L. Trace element chemistry in residual-treated soil: Key concepts and metal bioavailability. J. Environ. Qual. 2005, 34, 49–63. [Google Scholar] [CrossRef] [PubMed] [Green Version]
- Hartley, W.; Eduards, R.; Lepp, W.N. Arsenic and heavy metal mobility in iron oxide-amended contaminated soils as evaluated by short and long term leaching tests. Environ. Pollut. 2004, 131, 495–504. [Google Scholar] [CrossRef] [PubMed]
- Bothe, J.V.; Brown, P.W. Arsenic immobilization by calcium arsenate formation. Environ. Sci. Technol. 1999, 33, 3806–3811. [Google Scholar] [CrossRef]
- Juillot, F.; Ildefonse, P.; Morin, G.; Calas, G.; De Kersabiec, A.M.; Benedetti, M. Remobilization of arsenic from buried wastes at an industrial site: Mineralogical and geochemical control. Appl. Geochem. 1999, 14, 1031–1048. [Google Scholar] [CrossRef]
- Porter, S.K.; Scheckel, K.G.; Impellitteri, C.A.; Ryan, J.A. Toxic metals in the environment: Thermodynamic considerations for possible immobilisation strategies for Pb, Cd, As, and Hg. Crit. Rev. Environ. Sci. Tech. 2004, 34, 495–604. [Google Scholar] [CrossRef]
- Uchimiya, M.; Lima, I.M.; Klasson, K.T.; Wartelle, L.H. Contaminant immobilization and nutrient release by biochar soil amendment: Roles of natural organic matter. Chemosphere 2010, 80, 935–940. [Google Scholar] [CrossRef]
- Rao, C.R.M.; Sahuquillo, A.; López-Sánchez, J.F. A review of the different methods applied in environmental geochemistry for single and sequential extraction of trace elements in soils and related materials. Water Air Soil Pollut. 2008, 189, 291–333. [Google Scholar] [CrossRef]
Publisher’s Note: MDPI stays neutral with regard to jurisdictional claims in published maps and institutional affiliations. |
© 2022 by the authors. Licensee MDPI, Basel, Switzerland. This article is an open access article distributed under the terms and conditions of the Creative Commons Attribution (CC BY) license (https://creativecommons.org/licenses/by/4.0/).